Abstract
Locomotion is one of the major physiological functions for most animals. Previous studies have described aging mechanisms linked to locomotor performance among different species. However, the precise dynamics of these age-related changes, and their interactions with development and senescence, are largely unknown. Here, we use the same conceptual framework to describe locomotor performances in Caenorhabditis elegans, Mus domesticus, Canis familiaris, Equus caballus, and Homo sapiens. We show that locomotion is a consistent biomarker of age-related changes, with an asymmetrical pattern throughout life, regardless of the type of effort or its duration. However, there is variation (i) among species for the same mode of locomotion, (ii) within species for different modes of locomotion, and (iii) among individuals of the same species for the same mode of locomotion. Age-related patterns are modulated by genetic (such as selective breeding) as well as environmental conditions (such as temperature). However, in all cases, the intersection of the rising developmental phase and the declining senescent phase reveals neither a sharp transition nor a plateau, but a smooth transition, emphasizing a crucial moment: the age at peak performance. This transition may define a specific target for future investigations on the dynamics of such biological interactions.
Keywords: Aging, Comparative biology, Epidemiology, Exercise physiology, Senescence
Aging is a complex, multiscale process that affects all levels of biological organization from molecular structure to individual behavior (1). As a highly integrated neurophysiological function, locomotion illustrates this process in a clear and dramatic fashion (2,3). The decline of locomotor ability with age is widely documented in Homo sapiens for swimming, walking, and running performances (4–7). These age-related alterations are caused in part by underlying changes in physiological parameters, such as sarcopenia or dynapenia in skeletal muscles (8,9).
Sarcopenia characterizes a gradual loss of muscle mass during aging while dynapenia represents the progressive decline in muscle strength and power (8–10). These alterations of both structure and function are related to changes in muscle architecture, composition, regeneration, and metabolic biochemistry (8–11). Muscle architecture and composition are gradually altered with a reduction in motor units and loss of fascicle length through shorter and thinner fibers (8–10). These changes also include a shift in pennation angles, an increase of intramuscular lipids and noncontractile fibrotic components, such as collagen (8–11). Intramuscular lipids and fibrosis accumulation are partly related to the progressive impairment of muscle regeneration, including a decreasing number of satellite cells with reduced proliferative capacity (8,11). At the cellular and molecular levels major changes, especially in mitochondria, also occur. Mitochondria decrease in number and mitochondrial DNA transcription and adenosine triphosphate (ATP) production decline (8,9). Finally, there are strong relationships with other physiological functions which largely modulate these multiscale gradual alterations; for example, different nervous regulation of muscular strength can result in reduced recruitment, discharge rate or synchronization of the motor unit pools (10).
Locomotion, an integrated neurophysiological function, reveals the inherent complexity of aging processes occurring at multiple levels of biological organization. Observations of sarcopenia have been made in several wild species, both short and long lived (9,12–15). Other structural and functional age-related changes have been described in wide range of species, both captive and wild (16,17); these depend on the accumulation of changes with time at both the molecular and cellular levels and appear as a common aspect of organismal senescence among animals (17–20). However, in most cases these descriptions remain incomplete because of the difficulty of collecting reliable quantitative data from molecular, physiological, and behavioral traits, particularly in natural populations.
Empirical approaches have been used to characterize dynamics of changes associated with aging at different levels of biological organization (6). Except for the characterization of survival rate (21,22), most of these approaches, in particular at physiological, cellular, and molecular levels, use linear models, but monotonic functions may have limited utility for characterizing the complex, nonlinear relationship linking age and phenotypic changes, especially across the entire life span. In fact, most characterizations only take into account senescence or ontogeny, but rarely both, which contributes to fundamental misconceptions about age-related dynamics (21,22).
An original approach to more accurately characterize this relationship in humans was proposed by Moore (4). He used a biphasic function made of two exponential curves to describe the relation to age of top running speeds in seven track and field events which emphasized an asymmetrical pattern with two phases (see Materials and Methods for more details). In the first phase, performance increases rapidly during growth at younger ages, in parallel with structural and functional development, until maximal performances are attained. In the second phase, aging negatively affects the same structures and functions leading to a decline in physiological traits at older ages.
More recently, Berthelot et al. and Guillaume et al. applied the Moore function to various human sports and activities, including swimming, tennis, and chess (6,23). Nassif et al.(24) applied the Moore function to a general population of 31,349 volunteers aged 4–80 years for different tests of physical fitness, including a 20-m shuttle run, a 4×10 m run sprinting run, broad jump, repeated squat jumps, a flexibility test, and push-ups. Moore’s equation well described age-related performances in these activities. In all cases, it delineates the frontiers of performance with age, at both the population and individual levels and provides a simple way to compare aging patterns among species or among different human groups (25). This equation may also be a useful tool to describe the impact of risk factors, such as addictive behaviors, on the time course of highly prevalent degenerative diseases (26).
In this article, we focus on extending the examination of age-related patterns in locomotor performance to additional species. We use the Moore function to characterize maximal locomotor performance by age (including both males and females) across the entire life span to describe age-related changes for an entire species (Canis familiaris, Equus caballus, and Homo sapiens) or for a population (Mus domesticus and Caenorhabditis elegans). Because a growing body of evidence suggest that senescence occurs in most animal species (16,17), we hypothesized that we would find similar patterns of age-related changes in locomotor performance among species; specifically, we expected a unimodal pattern across age (eg, only one performance peak) with a short development phase followed by a longer declining phase. In addition we also hypothesized:
(i) Species differences at the relative age (age scaled by maximal age) of peak performance. Because of their relative fast development and early sexual maturity, we expected that M domesticus and C elegans would reach an earlier peak in locomotor performance.
(ii) Population differences associated with artificial selection on locomotor behavior. We expected that a population of mice selected for high wheel-running activity would show an expanded pattern for both maximal and mean locomotor performance.
(iii) Modulated effects under various environmental conditions. We expected that the patterns of change in locomotion by age would be reduced at temperatures distant from the optimal range. We examined such temperature impacts by comparing marathon performances in H sapiens at 5°C versus 25°C, and voluntary activity at 22°C versus 25°C in isogenic populations of C elegans.
Materials and Methods
Data Sets
Running speeds in H sapiens: International track and field sport events data
We used 20,625 speed and age (in years) values from international Men 100-m track events, 21,423 speed and age values from international Women 100-m track events, 18,389 speed and age values from international 800-m track events, and 21,423 speed and age values from international marathon, all recorded during the 1970–2013 seasons.
All data were cross-checked with the following websites http://www.iaaf.org, http://www.mastersathletics.net, http://www.tilastopaja.org, and www.chicagomarathon.com. Racing times were converted average running speeds in meters per second. For each year of age, the single maximal performance among all individuals was selected to be included in the analysis. For 100-m event (including both men and women), the final data set used contained 90 maximal running performances from 6 to 100 years of life. For 800 m and marathon, the final data sets used contained respectively 92 and 90 maximal running performances from 5 to 100 years of life.
Comparison between Chicago marathon 2006 and 2007
We used respectively 33,637 and 25,523 speeds and ages from results of Chicago marathon in 2006 and 2007. The final data set only included men’s performance. Maximal performance, mean performance, and standard deviation were calculated.
Running speeds in E caballus: Thoroughbred racing competition data
We used 1,810 speeds and ages (in months) from international 1,200 m on-turf competition over a 10-year period (2005–2014). All data were cross-checked with http://jra.jp/. Racing times were converted to average running speeds in meters per second. For each month of age, the single maximal performance among all individuals was selected to be included in the analysis, so that the final data set contained 91 maximal running performances from 31 to 140 months of life (see Supplementary Material)
Running speeds in C familiaris: Racing greyhounds competition data
We used 26,571 speeds and ages (in months) from international 480-m racing greyhound competition over a 10-year period (2003–2012). All data were cross-checked with http://www.greyhound-data.com/. Racing times were converted to average running speeds in meters per second. For each month of age, the single maximal performance among all individuals was selected to be included in the analysis, so that the final data set used herein contained 63 maximal running performances from 12 to 74 months of life (see Supplementary Material).
Activity in M domesticus: Experimental measure of free wheel running
Colonies and conditions
We used data from Morgan et al. and Bronikowski et al. (27,28) who conducted studies of life-long voluntary activity in two groups of mice: A control population composed of 79 mice and a population of 80 mice from the 16th generation of selection for high wheel-running activity. All the details of the population selection and living conditions are available in Morgan et al. (27).
Experimental system
Mice, in individual cages, had free access to an 11.15-cm-radius running wheel equipped with a wheel-revolution counter for the duration of their life span.
Activity measurements
The running wheel was freely accessible in the cage. Every week, the number of revolutions was recorded. A total of 7,682 activity performances for selected mice and 7,598 activity performances for control mice were recorded. For control population, we chose the maximal activity performances for each of 135 weekly ages (see Supplementary Material). Then, we compared the maximal activity performance by age for the two populations (control and selected).
Free activity in C elegans: Experimental measure of body bends
Strains and culture conditions
We used N2 (wild-type) C elegans provided by the CGC (Caenorhabditis Genetics Center at the University of Minnesota: http://www.cbs.umn.edu/research/resources/cgc). All animals were cultivated on nematode growth media (NGM) plates seeded with the Escherichia coli OP50 following standard protocols (http://www.wormbook.org/). We used standard synchronization technique to ensure that all worms in a set have the same age. L1 starved larvae were transferred on NGM plates and maintained at 22°C until death. Every 2 days, the entire set was carefully transferred with a worm-picker on a new fresh plate seeded with E coli OP50.
Experimental system
Worms in NGM plates were placed under the microscope and for each worm the number of body bends was recorded during 20 seconds using a 6.6 Mpixels CMOS monochrome camera (Pixelink) connected to a microscope (Leica MZ 16 F).
Activity measurements
Activity was defined as the number of body bends (ie, a full oscillation of the head region of the animal). Images were loaded in the ImageJ software (http://imagej.nih.gov/ij/), and the number of body bends was carefully counted frame by frame. Finally, the number of body bends was converted to body bends per second. We recorded 1,131 activity performances and chose the maximum by age ranging from 1 to 15 days of life (see Supplementary Material).
Comparison experiment
We compare free activity between two subpopulations maintained during all their life respectively at 22°C versus 25°C. We measure at 22°C, 414 locomotor performance from 1 to 15 days and at 25°C, 332 locomotor performance from 1 to 11 days (see Supplementary Material).
Forced velocity in C elegans: Experimental measure of speed in an electrotaxis device
Strains and culture conditions
We used the same strains and culture conditions previously described for the experimental measure of activity.
Experimental system
We used the previously described electrotaxis device (29). Worms were tracked with a camera CCD (Edmund Optics, EO-0813M) fitted with a 10× lens (Computar MLH 10×).
Velocity measurements
The worms were rinsed with M9 minimal medium and transferred with a pipet on the agar pad in the electrotaxis device. An electric field of 4V cm−1 was applied in the agar pad for 30 seconds, and the worms were automatically tracked. We determined the length of crawling trajectories using the ImageJ software (http://imagej.nih.gov/ij/). This was then converted to speed (µm/s).We recorded 2,739 activity performances and chose the maximal activity performances by age every day for 1–14 days of life (see Supplementary Material).
Scaling of Data
To compare the age-related patterns between the different species, we scaled all the data selected (maximal performance by age and mean performance by age) using the following formulas:
Scaled speed = Speed / Maximal speed
Scaled age = Age / Maximal age
We added to H sapiens, E caballus, and C familiaris data sets the age of the oldest subjects with a null speed, respectively for the oldest known human (J. Calment, 122 years), the oldest known horse (684 months), and the oldest known dog (288 months) according to data from http://genomics.senescence.info/species/ (30). We chose maximal longevities from the entire species (including both females and males) to compare in particular physiological frontiers in these three species.
For H sapiens, E caballus, and C familiaris data, the maximal sprint speed in the data set was used to scale the speed at each age, and the age of the oldest known subject was used to scale the age. For M domesticus and C elegans, we used the maximal age and maximal performances in the data sets to scale the data.
The Moore Equation: Estimating the Age-Related Pattern for Each Species
We determined the best performance by age for each data sets and fitted them with the Moore equation (4,6):
where P(t) is the performance (t the time), a and c are scaling parameters, b−1 and d−1 the characteristic time of the exponential growth and decline as exponential processes, respectively. Coefficients are determined using a least-square nonlinear regression. The quality of each fit is estimated by the coefficient of determination R2 and RMSE (details are given in Supplementary Material).
Results
Similar Age-Related Patterns in Locomotor Performances
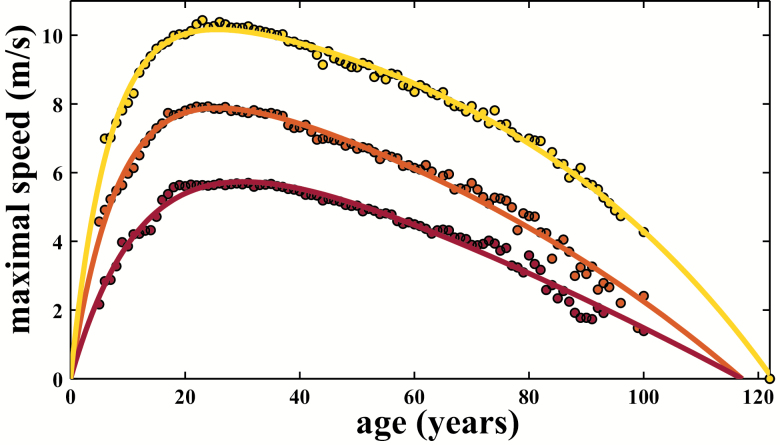
We found a similar age-related pattern for different maximal locomotor performances in H sapiens (Figure 1). These patterns included both men and women. We also compared maximal sprint performance by age between men and women and found that men are on average 13.8% faster across the life span (Supplementary Figures 1 and 2).
Figure 1.
Age-related pattern for Homo sapiens for three track and field main events. Despite some asynchrony at the peak, age-related patterns are similar for different locomotor performances in H sapiens 100 m (sprint, light gray line (yellow line online), R2 = .99), 800 m (middle distance, gray line (orange line online), R2 = .98), and marathon (endurance, dark line (red line online), R2 = .97).
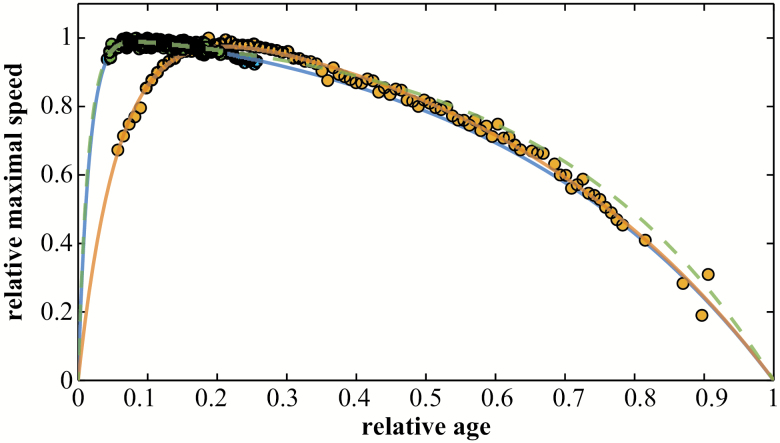
To compare performance among species, we scaled the data by the maximal best performance and the maximal age in each population (Figure 2 and see details in Materials and Methods), that is, we divided each performance value by the maximal performance and each age by the maximal age. For all the species examined herein, the changes in locomotor performance with age revealed a similar asymmetrical pattern, with peak performance occurring during the first third of life span. However, we observed a wide range of variation in peak ages among species for a given mode of locomotion. Although the geometry of the patterns may slightly differ, the overall shape is always preserved, suggesting the exclusion of bimodal or multimodal patterns (ie, curves with several performance peaks, at different ages, do not occur). Also, the patterns do not show any plateaus nor sharp transitions between the development and the senescence phases.
Figure 2.
Age-related pattern for relative maximal speed in Canis familiaris, Equus caballus, and Homo sapiens. The Moore function is adjusted to the maximal speed performances by age in H sapiens for 100-m track and field International Association of Athletics Federations (IAAF) main events (dark full line (yellow line online), R2 = .99), in E caballus for racing thoroughbred 1.200-m turf events (dark dotted line (green dotted line online), R2 = .99) and in C familiaris for racing greyhound 480-m events (light full line (blue line online), R2 = .99).
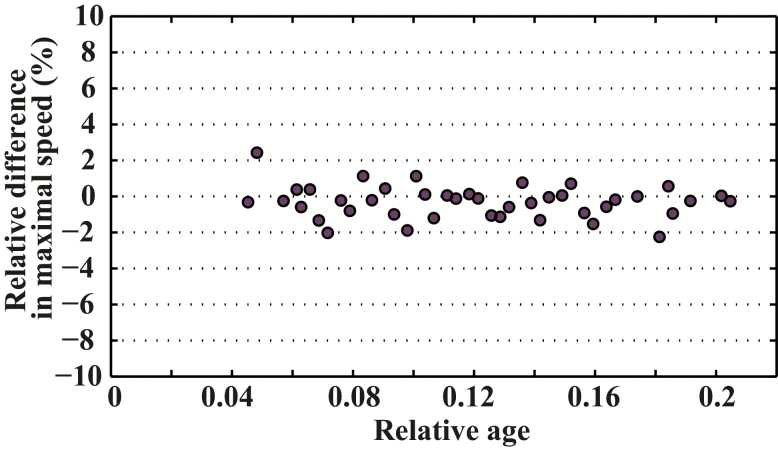
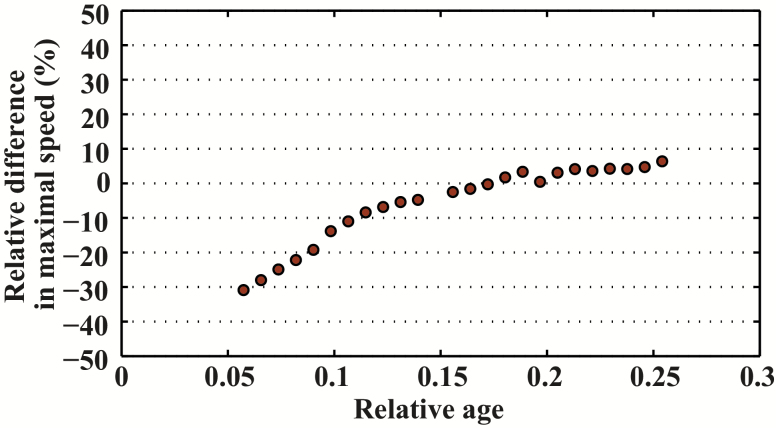
Maximal sprint speed by age was well described by the Moore equation for C familiaris, E caballus, and H sapiens (Figure 2). All three species demonstrated an asymmetrical pattern. However, the age at peak speed differed among species: Maximal sprint speed was reached at around 8% of the maximal life span in C familiaris (around 2 years) and in E caballus (around 5 years), but much later in H sapiens (about 21% of the maximal life span, 26 years). We compared specifically the relative difference for maximal relative performance between E caballus and C familiaris across the range of our data (Figure 3). We found that the dynamic of age-related changes are very similar with a difference on average of 0.31%. Likewise, we compared maximal relative performance between H sapiens and C familiaris and found between these species large relative difference (Figure 4).
Figure 3.
Relative difference in relative maximal speed between Equus caballus and Canis familiaris.
Figure 4.
Relative difference in relative maximal speed between Homo sapiens and Canis familiaris.
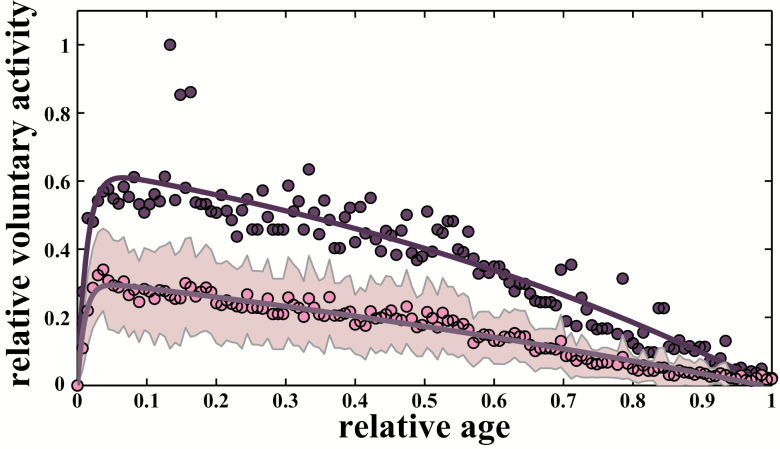
In mice, the maximal voluntary activity by age in control lines was described with a high consistency using the Moore equation (Figure 5). The fit showed an asymmetrical pattern similar to dogs, horses, and humans, with a peak speed reached at about 6% of maximal life span (around 8 weeks). The mean population voluntary activity was also well described by the same function, with a configuration similar to the maximal voluntary speed pattern, and an age at peak performance around 6% of maximal life span.
Figure 5.
Age-related pattern for voluntary activity for mice (control lines). The age-related pattern is also similar for voluntary activity in a population of mice for maximal activity (both male and female) and mean activity. The Moore function is adjusted to the 135 maximal (dark line (purple line online), R2 = .87) and mean (light gray line (pink line online), R2 = .96) freewheeling activity by age from our control lines. Maximal performances are represented by filled purple circles and mean by filled pink circles. Standard deviations by age (gray areas (pink areas online)) are represented to express variability within the population.
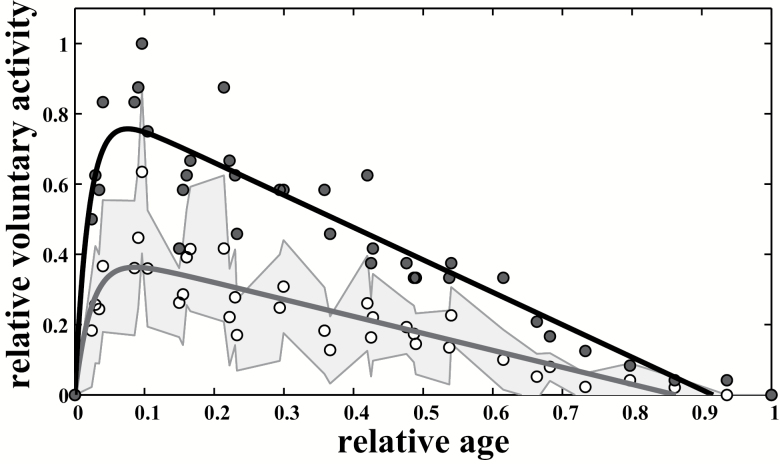
Two modes of locomotion were tested in C elegans: Voluntary activity was measured by assessing the number of body bends per second, whereas forced activity was induced by an electrotaxis device. The Moore function accurately fit both the maximal voluntary activity (Figure 6) and the forced velocity data (Supplementary Figure 3). Again, a pattern similar to the other species was observed: Performance increased over a short range of life span, with a performance peak at about 8% of maximal life span for voluntary activity; it was around 35% for forced locomotor performance (2 and 5 days, respectively). The fit of the voluntary and forced activity means provided results similar to the maximal speed fit: Peaks appeared at about 8% for mean voluntary activity and at about 32% for mean forced activity.
Figure 6.
Age-related pattern for voluntary activity for Caenorhabditis elegans. The age-related pattern is also similar for voluntary activity in a population of C elegans for maximal and mean activity. The Moore function is adjusted to the maximal (black line, R2 = .84) and mean (gray line, R2 = .73) number of body bends by age in C elegans N2 wild-type. Maximal performances are represented by filled black circles and mean by filled white circles. Standard deviations by age (light gray area) are represented to express variability within the population.
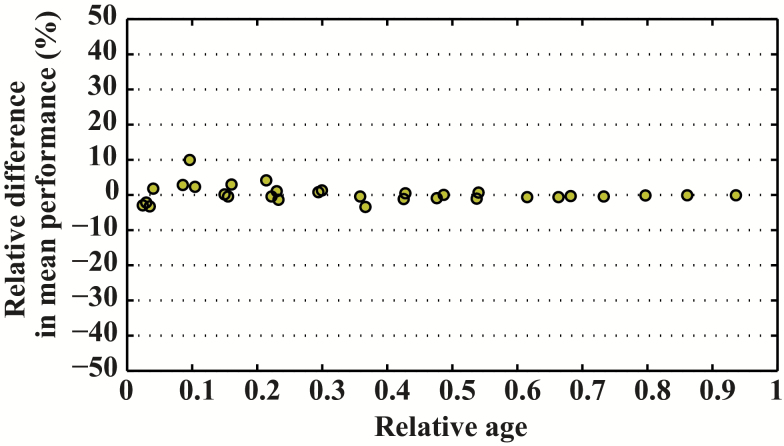
Also, we compared the relative difference for maximal and mean relative voluntary activity between M domesticus and C elegans across the range of our data (Figure 7 and Supplementary Figure 4). We found that the dynamics of age-related changes are very similar with a difference on average of 0.55% for maximal performance and 0.28% for mean performance.
Figure 7.
Relative difference in relative voluntary activity between Mus domesticus and Caenorhabditis elegans.
Based on scaled data in M domesticus and C elegans, standard deviations by age indicate variability in individual performance curves, hence we also used the Moore function to model individual variations in M domesticus. The trajectories of two mice from control lines across the life span show inter-individual variability with large differences in terms of maximal activity and life span (Supplementary Figure 5). The two subjects also have a weekly change in terms of activity with some wide differences in activity from one week to the other. Despite such individual differences, a pattern similar to that of the population as a whole was assessed, with a peak in activity during the early beginning of life and a progressive decline thereafter.
Effects of Selection on Age-Performance Patterns
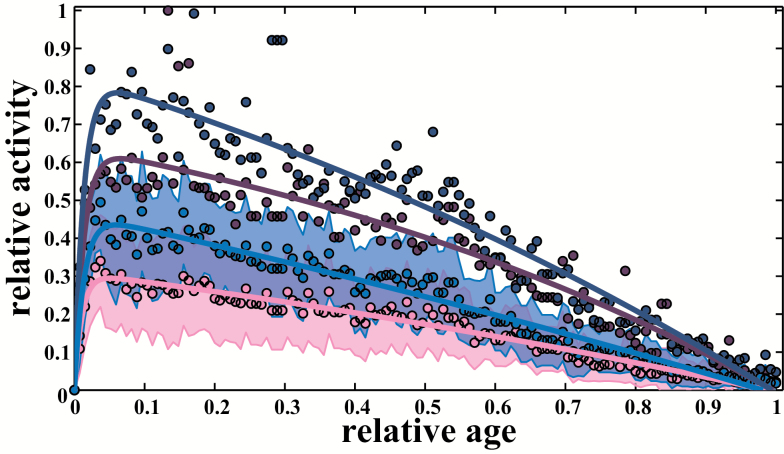
We extended our investigations to mice (M domesticus) from lines that had been selectively bred over 16 generations for high wheel-running activity. For selected mice, maximal voluntary activity by age was well described by the Moore equation (Figure 8). The curves showed asymmetrical patterns similar to those measured in control mice, with a peak occurring at about 6% of maximal life span for both maximal and mean voluntary activity (about 8 weeks). However, compared with control mice, selected mice had a 25.3% increase in maximal performance and a 41.4% increase in mean performance (Supplementary Figures 6 and 7).
Figure 8.
Breeding selection extend the age-related pattern in mice. The Moore equation respectively is adjusted to the maximal and mean performances in wheel-running activity in mice selected for high running behavior (upper dark line (dark blue line online) + lower dark line (light blue line online), Rmax2 = .91 and Rmean2 = .96) and in their control (upper light line (purple line online) + lower light line (pink line online), Rmax2 = .87, Rmean2 = .96). Standard deviations by age (gray areas (blue and pink areas online)) are represented to express variability within the population.
Effects of Temperature on Age-Performance Patterns
Temperature was found to considerably alter the patterns of age-related effects on locomotion in both endotherms and ectotherms. First, in H sapiens, we compared the effect of a 20°C difference in temperature on locomotion for men running the Chicago marathon (4.5°C in 2006 versus 25°C in 2007). Speed and age data were collected for all 33,638 finishers in 2006 and all 25,524 finishers in 2007. We fit the Moore function to both maximal and mean performance by age for Men (Supplementary Figure 8). Results revealed a similar pattern at both temperatures, with a peak performance at 30 years. However, both maximal performances and mean performances were impacted by temperature, with a 9.2% decrease in running speed for maximal performance and a 12.0% reduction for mean performance in the hotter conditions (Supplementary Figures 9 and 10). We also compared voluntary activity patterns in C elegans, between two subpopulations maintained throughout the life span at 22°C and 25°C, respectively (Supplementary Figure 11). We measured 374 locomotor performances from 1 to 15 days at 22°C, and 291 performances from 1 to 11 days at 25°C. Results revealed a similar pattern with a peak around 5% of the maximal life span at both temperatures. Activity was lower at 22°C for both maximal and mean values during the first part of life. Thereafter, worms at 22°C maintained a higher rate of voluntary activity during the deterioration phase, because of an accelerated deterioration of worms at 25°C (Supplementary Figures 12 and 13).
Discussion
A Robust Nonlinear Pattern Describes Age-Related Physiological Functions and Performances in Living Organisms
The Moore equation effectively describes the relationship between age and locomotor performance for the five studied species. Based on these results, we hypothesize that these age-related patterns are common features of the relationship between age and locomotor performance in a wide range of organisms. The shape of the patterns seems to match descriptions of other age-related locomotor performances in different species, such as flight performances in Drosophila (31), honeybees (32), and codling moths (33), maximal sprint speed in dogs and horses (34–36), physical activity in different rodents and monkeys (16,27,28), grip strength in mouse lemurs (15), hunting rates and success in wolves (37), swimming speed in zebrafish (38), and voluntary activity and electrotactic behavior in C. elegans (29,39). Likewise, other performance traits might follow a similar pattern, such as biting force in mouse lemur (40), cognitive performances in Rhesus monkey (41), attentiveness in domestic dogs (42), pharynx pumping rate in C. elegans (43), and perhaps even photosynthetic yield in cotton leaves (44).
Comparison of Age-Related Changes in Locomotor Performance Among Species
Our comparison of maximal sprint speeds in C familiaris, E caballus, and H sapiens shows that the performance peak is reached much earlier in C familiaris and E caballus than in humans (8% vs 21%). Previous studies supported this relative difference (6,34–36), consistent with the fact that H sapiens have among the slowest growth rates and greatest longevities in mammals, and hence may have slowed its relative physiological development rate during evolution (45). However more research, including phylogenetically corrected analyses (46), need to be done before a convincing argument can be made. Interestingly, the age at peak performance for voluntary activity corresponds to the beginning of sexual maturity for H sapiens, M domesticus, and C. elegans (30). Although we did not examine voluntary activity in humans herein, Beets et al. showed that the daily number of free steps in humans peaked at 10–12 years, close to the onset of puberty, before gradually declining (7,47).
The Age of Peak Performance in Humans Depends on the Locomotion Mode
In H sapiens, the peak of voluntary activity—10 to 12 years (47)—is earlier than the peak for maximal sprint performances, which is around 26 years (6). The difference might be influenced by cultural factors or by social environments (7). Berthelot et al. showed that the age at peak for maximal human performances depends on locomotion mode, effort duration, and gender (6). For example, the maximal swimming speeds appear earlier than the maximal running performances: 18–23 vs 23–31 years, respectively (6). Differences in peak ages are also measured in other circumstances: For example, cognitive performances reach their peak later in life. The peak for chess competition is around 31 years (6), whereas the peak for facial recognition is between 30 and 34 years (48).
Because locomotion is a highly integrated trait (2,3), differences in the age at peak performance among different types of performance might be related to functional or structural differences in senescence of physiological traits (49). For example, in C elegans, the difference in locomotor activity peak age between voluntary activity and forced electrotactic conditions might be related to a wide variability of aging effects on muscular and neuronal structures (12). Such an asynchrony among phenotypic traits has already been described for several species in both laboratory and natural conditions (17,49).
Individual Variation in Locomotion With Aging
Our results for C elegans and mice are consistent with those of previous studies that demonstrate significant individual variability in locomotor performance with age both in C elegans and H sapiens. Herndon et al. measured individual variability in locomotor performances with age within isogenic populations of worms (12). In H sapiens, Tudor-Locke and Bassett measured large variation in healthy adults; “sedentary” participants walked less than 5,000 steps/day, whereas highly “active” participants walked more than 12,500 steps/day (7). In the same way, Nassif et al. described high variability in physical fitness levels irrespective of age group (24). For example, in the 20-m shuttle run test among 9,710 girls aged 12–17 years, the mean running distance was 512.20 m with a standard deviation of 60.58 m (min = 120 and max = 980, cv = 8.45%), whereas among 413 women aged 40–60 years the mean running distance was 482.05 m with a standard deviation of 68.57 m (min = 240 and max = 700, cv = 7.03%).
Have Maximal Locomotor Performances Reached Their Limits?
The large populations of C familiaris, E caballus, and H sapiens examined herein represent the best sprint performances from individuals who underwent optimal training regimes in a highly competitive environment. Other environmental aspects, such as nutrition, medicine, and technological innovations, also contribute to performances that develop at the physiological limits (50). Denny and Desgorces et al. previously showed that performance development in racing greyhounds, thoroughbreds, and human athletes followed a similar trend during the past century, with an increase of performance until the 1990s followed by an asymptotic limit thereafter (50–52). In this context, and without future major technological or biotechnological improvements, our data may accurately describe the age-related physiological frontiers for maximal sprint performances.
Environmental conditions could have beneficial or detrimental effects on senescence patterns. Temperature or long-term diet changes have been directly related to change in survival pattern (12,18,53). In addition, the exposure to environmental stressors during development (food availability, temperature, predators, etc.) also impacts survival patterns (20). The anthropocene with unprecedented environmental change (temperature, pollution, food availability, species extinction, etc.) could also adjust drastically the senescence patterns of many living species (54). The data from the Chicago marathon show that locomotor traits are also affected, and the temperature change expected during the 21st century may contribute to alter the locomotor age-related pattern, at least for endurance performances (50). Our results in C elegans, where longevity depends on temperature (12), also support this point.
Limitations of the Moore Equation and Population Size Effect
The Moore equation is a mathematical description using four parameters which adjust both growing and declining phases (fitting parameters are available in Supplementary Table 1). It generally does a good job for fitting traits or performance changes with age across the entire life span. However, our data sets present some limitations. First, in C familiaris and E caballus, data are missing after the first third of life span because of the retirement of the oldest animals from competition. This may lead to extrapolation and/or interpolation errors. A minimization of these errors could possibly be obtained by adding the oldest animal record to ensure a reasonable convergence toward the maximum recorded life span. Second, our results indicate that the accuracy of the fit of the function depends on the density of the sampling across ages and the population size. A lack of data during the growing phase may lead to errors in estimating the peak, whereas reduced sample sizes may increase variability and approximations within the pattern. In both cases, the fit of the Moore equation could be explored through simulations and compared with other biological curve fitting approaches (eg, function-valued methods) that rely on interpolations (55). However, despite these limitations, we think that the application of the Moore equation to the data presented herein is generally robust given the similarity of patterns of locomotor dynamics with age in multiple species.
Common Mechanism From Unicellar to H sapiens?
Phenotypic traits are shaped by a complex and intimate interplay between genes and environment (18,20,56,57) and are composed, for each individual, of a developmental and a senescent phase. The development from fertilization to maturity for a wide range of organisms shares common morphogenesis processes, despite major differences in shape and growth rates (58). For example, at the cellular level, the WnT signaling pathway is highly conserved from amoeba to humans and is implicated in embryogenesis (59).
During the senescent phase, homologous pathways are also implicated in aging in a wide range of organisms; for example, the insulin/IGF1 regulatory system is conserved in composition and function from yeast to mammals (60). However, despite the progressive increase of knowledge about the hallmarks of aging (19) and important attempts to unify theories under a common entropic origin (61), the interaction of senescence with the development phase is often overlooked. Moreover, the temporality of such a process and its gradual progression are also regularly omitted or elusive in molecular and cellular studies. Our results offer a new overview for such hidden dynamics (1). In particular, the age at peak performance may be a key moment, at the crossroad of growth and aging, and thus may provide a great opportunity to thoroughly examine the scope of interactions between both components; this, for example, might be a critical moment for changes in gene expression (62,63).
Studying Senescence Patterns Using Sophisticated Locomotor Tracking Technology
Measuring accurate senescence patterns, particularly in the wild, remains complex (17,20). This difficulty has constrained the past characterization of phenotypic changes with ages and lead sometimes to fallacy (17). In the wild, most researches continue to focus on mortality and fecundity rates (17). Locomotor performance, as a major integrated trait in living organisms, represents an excellent trait that could be used to characterize senescence in natural populations of animals. An accurate characterization seems now available with new tracking technologies (64). Global positioning systems (GPS) are smaller, are cheaper, and have better temporal resolution (64). An exponential number of studies with more robust tracking technology underlines the potential of such methods to better understand ecological patterns, including collective motions, social behavior, or eco-physiology (64).
Conclusion
Despite substantial variability and complexity differences, our study shows a common pattern in age-related changes for locomotor performances among Caenorhabditis elegans, Mus domesticus, Canis familiaris, Equus caballus, and Homo sapiens. Differences only appear in the relative age at peak performance, depending on the species or locomotion modes, and selective breeding and temperature variation may also alter the details of these dynamics.
Overall, our results indicate that locomotor performance provides a consistent biomarker of age-related changes across five species. Its accurate modeling during ontogenesis and senescence sustains a continuous process, easily measurable now throughout the life span in humans and domesticated/lab species, and perhaps in natural populations in the near future using recently developed technologies. The study of multiscale interactions may provide clues for universal mechanisms, common to numerous structures, organisms, and species.
Funding
Research on the high runner mice has been supported by grants from the U.S. National Science Foundation to T.G., most recently IOS-1121273. Research on C. elegans has been supported by grants from La dynamique du vieillir, Sorbonne Paris Cité (SPC).
Conflict of Interest
The authors declare they have no conflicts of interest.
Supplementary Material
Acknowledgments
The authors thank the Julien Dumont team (Paris-Diderot) and the CGC for providing C. elegans strains (CGC is funded by NIH Office of Research Infrastructure Programs P40 OD010440). The authors also thank the two anonymous reviewers for their helpful comments. Finally, we thank Washington State University (WSU) and Sorbonne Paris Cité (SPC) to provide an International Travel Grant to P.A.C. and the following colleagues for their advices: S. Douady, A. Sauvat, A. Hallou, K. Weinachter, J-B. Lugagne, B. Haridi, and L. Renault.
Footnotes
This version corrects the captions for figures 1, 2, 5, and 8.
References
- 1. West GB, Bergman A. Toward a systems biology framework for understanding aging and health span. J Gerontol A Biol Sci Med Sci. 2009;64:205–208. doi:10.1093/gerona/gln066 [DOI] [PMC free article] [PubMed] [Google Scholar]
- 2. Dickinson MH, Farley CT, Full RJ, Koehl MAR, Kram R, Lehman S. How Animals move: An integrative view. Science. 2000;288:100–106. doi:10.1126/science.288.5463.100 [DOI] [PubMed] [Google Scholar]
- 3. Foster KL, Collins CE, Higham TE, Garland T., Jr 11 Determinants of lizard escape performance: Decision, motivation, ability, and opportunity. Escaping Predat Integr View Escape Decis. 2015:287. [Google Scholar]
- 4. Moore DH. A study of age group track and field records to relate age and running speed. Nature. 1975;253:264–265. doi:10.1038/253264a0 [DOI] [PubMed] [Google Scholar]
- 5. Baker AB, Tang YQ. Aging performance for masters records in athletics, swimming, rowing, cycling, triathlon, and weightlifting. Exp Aging Res. 2010;36:453–477. doi:10.1080/0361073X.2010.507433 [DOI] [PubMed] [Google Scholar]
- 6. Berthelot G, Len S, Hellard P, et al. Exponential growth combined with exponential decline explains lifetime performance evolution in individual and human species. Age. 2012;34:1001–1009. doi:10.1007/s11357-011-9274-9 [DOI] [PMC free article] [PubMed] [Google Scholar]
- 7. Tudor-Locke C, Bassett DR., Jr How many steps/day are enough? Sports Med. 2012;34:1–8. doi:10.2165/00007256-200434010-00001 [DOI] [PubMed] [Google Scholar]
- 8. Mitchell WK, Williams J, Atherton P, Larvin M, Lund J, Narici M. Sarcopenia, dynapenia, and the impact of advancing age on human skeletal muscle size and strength: A quantitative review. Front Physiol. 2012;3:260. doi:10.3389/fphys.2012.00260 [DOI] [PMC free article] [PubMed] [Google Scholar]
- 9. McGregor RA, Cameron-Smith D, Poppitt SD. It is not just muscle mass: A review of muscle quality, composition and metabolism during ageing as determinants of muscle function and mobility in later life. Longev Healthspan. 2014;3:9. doi:10.1186/2046-2395-3-9 [DOI] [PMC free article] [PubMed] [Google Scholar]
- 10. Clark BC, Manini TM. Sarcopenia =/= dynapenia. J Gerontol A Biol Sci Med Sci. 2008;63:829–834. [DOI] [PubMed] [Google Scholar]
- 11. Mann CJ, Perdiguero E, Kharraz Y, et al. Aberrant repair and fibrosis development in skeletal muscle. Skelet Muscle. 2011;1:21. doi:10.1186/2044-5040-1-21 [DOI] [PMC free article] [PubMed] [Google Scholar]
- 12. Herndon LA, Schmeissner PJ, Dudaronek JM, et al. Stochastic and genetic factors influence tissue-specific decline in ageing C. elegans. Nature. 2002;419:808–814. doi:10.1038/nature01135 [DOI] [PubMed] [Google Scholar]
- 13. Hindle AG, Horning M, Mellish JA, Lawler JM. Diving into old age: Muscular senescence in a large-bodied, long-lived mammal, the Weddell seal (Leptonychotes weddellii). J Exp Biol. 2009;212:790–796. doi:10.1242/jeb.025387 [DOI] [PubMed] [Google Scholar]
- 14. Hindle AG, Lawler JM, Campbell KL, Horning M. Muscle senescence in short-lived wild mammals, the soricine shrews Blarina brevicauda and Sorex palustris. J Exp Zool A Ecol Genet Physiol. 2009;311:358–367. doi:10.1002/jez.534 [DOI] [PMC free article] [PubMed] [Google Scholar]
- 15. Hämäläinen A, Dammhahn M, Aujard F, Kraus C. Losing grip: Senescent decline in physical strength in a small-bodied primate in captivity and in the wild. Exp Gerontol. 2015;61:54–61. doi:10.1016/j.exger.2014.11.017 [DOI] [PubMed] [Google Scholar]
- 16. Ingram DK. Age-related decline in physical activity: Generalization to nonhumans. Med Sci Sports Exerc. 2000;32:1623–1629. [DOI] [PubMed] [Google Scholar]
- 17. Nussey DH, Froy H, Lemaitre JF, Gaillard JM, Austad SN. Senescence in natural populations of animals: Widespread evidence and its implications for bio-gerontology. Ageing Res Rev. 2013;12:214–225. doi:10.1016/j.arr.2012.07.004 [DOI] [PMC free article] [PubMed] [Google Scholar]
- 18. Kirkwood TBL. Understanding the odd science of aging. Cell. 2005;120:437–447. doi:10.1016/j.cell.2005.01.027 [DOI] [PubMed] [Google Scholar]
- 19. López-Otín C, Blasco MA, Partridge L, Serrano M, Kroemer G. The hallmarks of aging. Cell. 2013;153:1194–1217. doi:10.1016/j.cell.2013.05.039 [DOI] [PMC free article] [PubMed] [Google Scholar]
- 20. Monaghan P, Charmantier A, Nussey DH, Ricklefs RE. The evolutionary ecology of senescence. Funct Ecol. 2008;22:371–378. doi:10.1111/j.1365-2435.2008.01418.x [Google Scholar]
- 21. Levitis DA. Before senescence: The evolutionary demography of ontogenesis. Proc R Soc Lond B Biol Sci. 2011;278:801–809. doi:10.1098/rspb.2010.2190 [DOI] [PMC free article] [PubMed] [Google Scholar]
- 22. Levitis DA, Martínez DE. The two halves of U-shaped mortality. Front Genet. 2013;4:31. doi:10.3389/fgene.2013.00031 [DOI] [PMC free article] [PubMed] [Google Scholar]
- 23. Guillaume M, Len S, Tafflet M, et al. Success and decline: Top 10 tennis players follow a biphasic course. Med Sci Sports Exerc. 2011;43:2148–2154. doi:10.1249/MSS.0b013e31821eb533 [DOI] [PubMed] [Google Scholar]
- 24. Nassif H, Sedeaud A, Abidh E, et al. Monitoring fitness levels and detecting implications for health in a French population: An observational study. BMJ Open. 2012;2. doi:10.1136/bmjopen-2012-001022 [DOI] [PMC free article] [PubMed] [Google Scholar]
- 25. Belsky DW, Caspi A, Houts R, et al. Quantification of biological aging in young adults. Proc Natl Acad Sci USA. 2015;112:E4104–E4110. doi:10.1073/pnas.1506264112 [DOI] [PMC free article] [PubMed] [Google Scholar]
- 26. Jha P, Ramasundarahettige C, Landsman V, et al. 21st-century hazards of smoking and benefits of cessation in the United States. N Engl J Med. 2013;368:341–350. doi:10.1056/NEJMsa1211128 [DOI] [PubMed] [Google Scholar]
- 27. Morgan TJ, Garland T, Carter PA. Ontogenies in mice selected for high voluntary wheel-running activity: I. Mean ontogenies. Evolution. 2003;57:646–657. doi:10.1111/j.0014-3820.2003.tb01556.x [DOI] [PubMed] [Google Scholar]
- 28. Bronikowski AM, Morgan TJ, Garland T, Carter PA. The evolution of aging and age-related physical decline in mice selectively bred for high voluntary exercise. Evolution. 2006;60:1494–1508. doi:10.1111/j.0014-3820.2006.tb01228.x [PubMed] [Google Scholar]
- 29. Manière X, Lebois F, Matic I, Ladoux B, Di Meglio JM, Hersen P. Running worms: C. elegans self-sorting by electrotaxis. PLoS One. 2011;6:e16637. doi:10.1371/journal.pone.0016637 [DOI] [PMC free article] [PubMed] [Google Scholar]
- 30. de Magalhães JP, Costa J, Church GM. An analysis of the relationship between metabolism, developmental schedules, and longevity using phylogenetic independent contrasts. J Gerontol A Biol Sci Med Sci. 2007;62:149–160. [DOI] [PMC free article] [PubMed] [Google Scholar]
- 31. Le Bourg É, Minois N. A mild stress, hypergravity exposure, postpones behavioral aging in Drosophila melanogaster. Exp Gerontol. 1999;34:157–172. doi:10.1016/S0531-5565(98)00077-1 [DOI] [PubMed] [Google Scholar]
- 32. Vance JT, Williams JB, Elekonich MM, Roberts SP. The effects of age and behavioral development on honey bee (Apis mellifera) flight performance. J Exp Biol. 2009;212:2604–2611. doi:10.1242/jeb.028100 [DOI] [PMC free article] [PubMed] [Google Scholar]
- 33. Schumacher P, Weyeneth A, Weber DC, Dorn S. Long flights in Cydia pomonella L. (Lepidoptera: Tortricidae) measured by a flight mill: Influence of sex, mated status and age. Physiol Entomol. 1997;22:149–160. doi:10.1111/j.1365–3032.1997.tb01152.x [Google Scholar]
- 34. Strbac L, Trivunovic S. Effect of paragenetic factors on race time in a small population of trotters. Turk J Vet Anim Sci. 2013;37:701–705. [Google Scholar]
- 35. Takahashi T. The effect of age on the racing speed of Thoroughbred racehorses. J Equine Sci. 2015;26:43–48. doi:10.1294/jes.26.43 [DOI] [PMC free article] [PubMed] [Google Scholar]
- 36. Täubert H, Agena D, Simianer H. Genetic analysis of racing performance in Irish greyhounds. J Anim Breed Genet. 2007;124:117–123. doi:10.1111/j.1439-0388.2007.00643.x [DOI] [PubMed] [Google Scholar]
- 37. MacNulty DR, Smith DW, Vucetich JA, Mech LD, Stahler DR, Packer C. Predatory senescence in ageing wolves. Ecol Lett. 2009;12:1347–1356. doi:10.1111/j.1461-0248.2009.01385.x [DOI] [PubMed] [Google Scholar]
- 38. Gilbert MJ, Zerulla TC, Tierney KB. Zebrafish (Danio rerio) as a model for the study of aging and exercise: Physical ability and trainability decrease with age. Exp Gerontol. 2014;50:106–113. doi:10.1016/j.exger.2013.11.013 [DOI] [PubMed] [Google Scholar]
- 39. Simonetta SH, Migliori ML, Romanowski A, Golombek DA. Timing of locomotor activity circadian rhythms in Caenorhabditis elegans. PLoS One. 2009;4:e7571. doi:10.1371/journal.pone.0007571 [DOI] [PMC free article] [PubMed] [Google Scholar]
- 40. Chazeau C, Marchal J, Hackert R, Perret M, Herrel A. Proximate determinants of bite force capacity in the mouse lemur. J Zool. 2013;290:42–48. doi:10.1111/jzo.12011 [Google Scholar]
- 41. Herndon JG, Moss MB, Rosene DL, Killiany RJ. Patterns of cognitive decline in aged rhesus monkeys. Behav Brain Res. 1997;87:25–34. doi:10.1016/S0166-4328(96)02256-5 [DOI] [PubMed] [Google Scholar]
- 42. Wallis LJ, Range F, Müller CA, Serisier S, Huber L, Zsó V. Lifespan development of attentiveness in domestic dogs: Drawing parallels with humans. Front Psychol. 2014;5:71. doi:10.3389/fpsyg.2014.00071 [DOI] [PMC free article] [PubMed] [Google Scholar]
- 43. Huang C, Xiong C, Kornfeld K. Measurements of age-related changes of physiological processes that predict lifespan of Caenorhabditis elegans. Proc Natl Acad Sci USA. 2004;101:8084–8089. doi:10.1073/pnas.0400848101 [DOI] [PMC free article] [PubMed] [Google Scholar]
- 44. Wullschleger SD, Oosterhuis DM. Photosynthesis of individual field-grown cotton leaves during ontogeny. Photosynth Res. 1990;23:163–170. doi:10.1007/BF00035007 [DOI] [PubMed] [Google Scholar]
- 45. Kuzawa CW, Chugani HT, Grossman LI, et al. Metabolic costs and evolutionary implications of human brain development. Proc Natl Acad Sci USA. 2014;111:13010–13015. doi:10.1073/pnas.1323099111 [DOI] [PMC free article] [PubMed] [Google Scholar]
- 46. Rezende EL, Diniz-Filho JAF. Phylogenetic analyses: Comparing species to infer adaptations and physiological mechanisms. In: Pollock DM. Comprehensive physiology. Hoboken, NJ: John Wiley & Sons; 2011. http://onlinelibrary.wiley.com/doi/10.1002/cphy.c100079/abstract Accessed February 15, 2016. [DOI] [PubMed] [Google Scholar]
- 47. Beets MW, Bornstein D, Beighle A, Cardinal BJ, Morgan CF. Pedometer-measured physical activity patterns of youth: A 13-country review. Am J Prev Med. 2010;38:208–216. doi:10.1016/j.amepre.2009.09.045 [DOI] [PubMed] [Google Scholar]
- 48. Germine LT, Duchaine B, Nakayama K. Where cognitive development and aging meet: Face learning ability peaks after age 30. Cognition. 2011;118:201–210. doi:10.1016/j.cognition.2010.11.002 [DOI] [PubMed] [Google Scholar]
- 49. Hayward AD, Moorad J, Regan CE, et al. Asynchrony of senescence among phenotypic traits in a wild mammal population. Exp Gerontol. 2015;71:56–68. doi:10.1016/j.exger.2015.08.003 [DOI] [PMC free article] [PubMed] [Google Scholar]
- 50. Berthelot G, Sedeaud A, Marck A, et al. Has athletic performance reached its peak? Sports Med. 2015;45:1263–1271. doi:10.1007/s40279-015-0347-2 [DOI] [PMC free article] [PubMed] [Google Scholar]
- 51. Denny MW. Limits to running speed in dogs, horses and humans. J Exp Biol. 2008;211:3836–3849. doi:10.1242/jeb.024968 [DOI] [PubMed] [Google Scholar]
- 52. Desgorces FD, Berthelot G, Charmantier A, et al. Similar slow down in running speed progression in species under human pressure. J Evol Biol. 2012;25:1792–1799. doi:10.1111/j.1420-9101.2012.02563.x [DOI] [PubMed] [Google Scholar]
- 53. Dudycha JL. A multi-environment comparison of senescence between sister species of Daphnia. Oecologia. 2003;135:555–563. doi:10.1007/s00442-003-1230-7 [DOI] [PubMed] [Google Scholar]
- 54. McMichael A. Population health in the Anthropocene: Gains, losses and emerging trends. Anthr Rev. 2014;1:44–56. doi:10.1177/2053019613514035 [Google Scholar]
- 55. Irwin KK, Carter PA. Constraints on the evolution of function-valued traits: A study of growth in Tribolium castaneum. J Evol Biol. 2013;26:2633–2643. doi:10.1111/jeb.12257 [DOI] [PubMed] [Google Scholar]
- 56. Boehm AM, Rosenstiel P, Bosch TC. Stem cells and aging from a quasi-immortal point of view. Bioessays. 2013;35:994–1003. doi:10.1002/bies.201300075 [DOI] [PubMed] [Google Scholar]
- 57. de Magalhães JP, Wuttke D, Wood SH, Plank M, Vora C. Genome–environment interactions that modulate aging: Powerful targets for drug discovery. Pharmacol Rev. 2012;64:88–101. doi:10.1124/pr.110.004499 [DOI] [PMC free article] [PubMed] [Google Scholar]
- 58. Alberts B, Johnson A, Lewis J, Raff M, Roberts K, Walter P. Universal mechanisms of animal development 2002. http://www.ncbi.nlm.nih.gov/books/NBK26825/ Accessed February 15, 2016.
- 59. Cadigan KM, Nusse R. Wnt signaling: A common theme in animal development. Genes Dev. 1997;11:3286–3305. doi:10.1101/gad.11.24.3286 [DOI] [PubMed] [Google Scholar]
- 60. Barbieri M, Bonafè M, Franceschi C, Paolisso G. Insulin/IGF-I-signaling pathway: An evolutionarily conserved mechanism of longevity from yeast to humans. Am J Physiol Endocrinol Metab. 2003;285:E1064–E1071. doi:10.1152/ajpendo.00296.2003 [DOI] [PubMed] [Google Scholar]
- 61. Hayflick L. Entropy explains aging, genetic determinism explains longevity, and undefined terminology explains misunderstanding both. PLoS Genet. 2007;3:e220. doi:10.1371/journal.pgen.0030220 [DOI] [PMC free article] [PubMed] [Google Scholar]
- 62. Short KR, Bigelow ML, Kahl J, et al. Decline in skeletal muscle mitochondrial function with aging in humans. Proc Natl Acad Sci USA. 2005;102:5618–5623. doi:10.1073/pnas.0501559102 [DOI] [PMC free article] [PubMed] [Google Scholar]
- 63. Su J, Ekman C, Oskolkov N, et al. A novel atlas of gene expression in human skeletal muscle reveals molecular changes associated with aging. Skelet Muscle. 2015;5:35. doi:10.1186/s13395-015-0059-1 [DOI] [PMC free article] [PubMed] [Google Scholar]
- 64. Kays R, Crofoot MC, Jetz W, Wikelski M. Terrestrial animal tracking as an eye on life and planet. Science. 2015;348:aaa2478. [DOI] [PubMed] [Google Scholar]
Associated Data
This section collects any data citations, data availability statements, or supplementary materials included in this article.


