

Abstract
OBJECTIVE
To examine the secular trends in risk factors, estimate their impact on type 2 diabetes burden from 1991 to 2011, and project trends in the next 20 years.
RESEARCH DESIGN AND METHODS
Risk factor distributions were based on data from the China Health and Nutrition Survey 1991–2011. Diabetes cases attributable to all nonoptimal levels of each risk factor were estimated by applying the comparative risk assessment method.
RESULTS
In 2011, high BMI was the leading individual attributable factor for diabetes cases in China responsible for 43.8 million diabetes cases with a population-attributable fraction of 46.8%. Low whole-grain intake and high refined grain intake were the leading dietary risk factors in China responsible for 37.8 million and 21.8 million diabetes-attributable cases, respectively. The number of attributable diabetes cases associated with low physical activity, high blood pressure, and current smoking was 29.5, 21.6, and 9.8 million, respectively. Although intakes of low-fat dairy products, nuts, fruit, vegetables, and fish and seafood increased moderately over time, the average intake was below optimal levels in 2011 and were responsible for 15.8, 11.3, 9.9, 6.0, 3.6, and 2.6 million diabetes cases, respectively. Meanwhile, intakes of processed meat, red meat, and sugar-sweetened beverage showed increasing trends over time and were responsible for 2.8, 1.8, and 0.5 million diabetes cases, respectively, in 2011.
CONCLUSIONS
A high BMI and low intake of whole grains but high intake of refined grains are the most important individual risk factors related to Chinese diabetes burden; low physical activity and high blood pressure also significantly contributed.
Introduction
Rate of type 2 diabetes (T2D) in China has increased rapidly in a short period (1,2). Based on data from national surveys, the estimated prevalence of diabetes was 0.9% in 1980 (3), 2.5% in 1994 (4), and 2.6% in 2002 (5). Just 1 decade later, the prevalence of diabetes rapidly increased to 9.7% in 2007 (1) and 10.9% in 2013 (2). Of note, the recent estimate of diabetes prevalence included an additional criterion based on glycated hemoglobin A1c (2). Over 90 million adults with diabetes lived in China, which was one-fourth of patients with diabetes worldwide (1,2). Compared with Western populations, diabetes in China is characterized by rapidly increased rates in recent years, onset at a relatively young age, low BMI, and very low rates of awareness and treatments (6,7).
Based on studies in Western countries, diabetes is a largely preventable disease with an estimated population-attributable risk of 91% for lifestyle factors (8). This suggests that, in theory, most cases of diabetes in the population could be prevented by adherence to a low-risk lifestyle, including a healthy diet, physical activity, not smoking, moderate alcohol consumption, and maintaining a healthy body weight. Clinical trials have converged to support the importance of lifestyle factors in the prevention of T2D (9). The China Da Qing Diabetes Prevention Study (9) indicated that lifestyle intervention groups, through improvements in dietary quality and physical activity and maintaining a healthy body weight, had a 51% lower incidence of diabetes during the 6-year active intervention period and a 43% lower incidence over a 20-year period compared with control subjects.
Given the trends in diabetes prevalence in China, it would be of great interest to investigate the burden of diabetes attributable to various lifestyle factors to conform current public health policies and provide guidance for future disease prevention and health promotion strategies in the country. However, to date there has been no comprehensive estimation of the time trends of lifestyle factors and their related diabetes burden among the Chinese population. Therefore, using data from an ongoing open cohort of the China Health and Nutrition Survey (CHNS) (10), we described the time trends in dietary and other lifestyle risk factors related to diabetes from 1991 to 2011 and estimated the number of diabetes cases attributable to below optimal levels of these risk factors.
Research Design and Methods
Study Population
The CHNS (10) is an ongoing prospective household-based study that includes multiple age groups across nine rounds of data collection, including 4,400 households with a total of 26,000 individuals in nine provinces. The CHNS was initiated in 1989 and conducted follow-up visits in 1991, 1993, 1997, 2000, 2004, 2006, 2009, and 2011, with data publicly available at http://www.cpc.unc.edu/projects/china.
The CHNS applied a stratified probability sampling method to sample the study population (10). Briefly, the CHNS used a multistage, random cluster design in nine provinces (Liaoning, Jiangsu, Shandong, Henan, Hubei, Hunan, Guangxi, Guizhou, and Heilongjiang). Within each province, two cities (one large and one small, usually the provincial capital and a lower-income city) and four counties (stratified by income: one high income, one low income, and two middle income) were selected. Within cities, two urban and two suburban communities were randomly selected. Within counties, one community in the capital city and three rural villages were randomly chosen. Twenty households per community were then selected for participation.
The 1989 CHNS surveyed 15,917 individuals, and the 1991 CHNS surveyed only individuals belonging to the original sample households, which resulted in a total of 14,778 individuals. From the 1993 CHNS, all new households formed from sample households who resided in sample areas were added to this sample. From the 1997 CHNS, besides the original sample households and newly formed households, additional households and communities were added to the study sample to replace those no longer participating (10). We excluded data from the 1989 wave because it enrolled only adults 20–45 years of age. We also excluded the data for three megacities from the comparison of time trends, as those data were available only in 2011. Additionally, we excluded participants who were pregnant or <20 years of age at the time of the survey.
Measurements
Age, sex, primary occupation category, highest educational level achieved, and smoking status were self-reported in each wave. Dietary information was collected by 3-day dietary recalls in addition to using a 3-day food-weighed method to assess cooking oil and condiment consumption. Nutrient intakes were calculated using the China food composition tables (FCTs). Specifically, FCT-1991 was used for dietary data from the 1997 and 2000 waves; FCT-2002/2004 was used for dietary data from the 2004, 2006, 2009, and 2011 waves. We did not include the dietary data from 1991 or 1993 because the food codes in those data sets did not match the food codes in the FCTs (the matching codes were not released). We evaluated energy-adjusted dietary intake for each dietary factor using the residual method to 2,000 kcal/day (11).
Following standardized procedures, trained health workers measured the weight and height of all participants using calibrated equipment (seca 880 scales and seca 206 wall-mounted metal tapes) (12). BMI (kg/m2) was calculated as weight (kg) divided by height squared (m2).
Each participant’s seated systolic blood pressure (SBP) was measured on the right arm (with the lower edge of the cuff placed ∼25 mm above the elbow) using standard mercury sphygmomanometers by experienced physicians who attended a 7-day data collection training session and passed a comprehensive reliability test (13). SBP was measured at the first detection of a pulse sound (Korotkoff phase 1). Three measurements were obtained with a 30-s interval between cuff inflations if the first measurement was normal. Otherwise, participants were requested to rest for 10–30 min before a second measurement was made (13). The mean value of three measurements was used.
Participants self-reported physical activity on a questionnaire that solicited detailed information on occupational and domestic activities (14). The total number of MET hours per week was calculated by multiplying the MET values of activities by the time spent on the activity. We also categorized study participants into different physical activity levels according to their MET minutes per week (0: <600; 1: 600–3,999; 2: 4,000–7,999; 3: ≥8,000 MET minutes) (15).
Comparative Risk Assessment Method
We applied population-level comparative risk assessment to calculate the population attributable risk (16); that is, the proportion of the diabetes burden that would have been prevented during a period of analysis if the distribution of specific risk factor exposure had been changed to a hypothetical alternative distribution while holding other risk factors constant. We conducted all analyses separately (12 groups in total): by sex and age group based on age at measurement (20–29, 30–39, 40–49, 50–59, 60–69, and ≥70 years). We restricted analyses to participants ≥20 years of age because of limited data on the effects of these risk factors and fewer T2D cases among younger participants.
For the comparative risk assessment analysis, we included data from different sources, including the following: 1) the current distribution of risk factor exposure in each wave; 2) the etiological effects of risk factor exposures on diabetes; 3) an alternative theoretical minimum risk exposure distribution (TMRED); and 4) the total number of diabetes cases in the population.
Risk Factor Selection
We selected 14 dietary and lifestyle risk factors for which 1) sufficient evidence was available on the presence and magnitude of probable causal relationships with diabetes; 2) available intervention strategies existed to modify exposure of risk; and 3) data on risk factor exposure were available in the CHNS without systematic bias. Based on these criteria, we selected 14 factors that included high SBP, high BMI, low physical inactivity, current tobacco use, and 10 dietary risk factors. Table 1 summarizes these 14 risk factors, their optimal level (TMRED), and sources of the relative risk (RR) used for the estimation of diabetes burden.
Table 1.
Sources and magnitudes of RRs for the effects of diabetes
| Risk factors | TMRED ± SD | RR of diabetes |
|||
|---|---|---|---|---|---|
| Sources‡ | Exposure metric, units | Age (years/ sex*) | RR (95% CI) | ||
| Lifestyle and metabolic risk factors | |||||
| High BMI | 21 ± 1 kg/m2 | Hartemink N et al., Am J Epidemiol, 2006 | BMI per kg/m2 increase | 1.18 (1.16–1.20) | |
| Physical inactivity | 133 ± 13 MET h/week | Smith A et al., Diabetologia, 2016 | Total activity per 10 MET h/week decrease | 1.05 (1.03–1.08) | |
| High blood pressure | 115 ± 6 mmHg | Emdin C et al., J Am Coll Cardiol, 2015 | SBP per 20 mmHg increase | 20–50 | 2.00 (1.96–2.04) |
| 51–70 | 1.49 (1.47–1.51) | ||||
| 71–90 | 1.14 (1.11–1.17) | ||||
| Smoking | Current smoking | Pan A et al., Lancet Diabetes Endocrinol, 2015 | Yes vs. no | M | 1.42 (1.34–1.50) |
| F | 1.33 (1.26–1.41) | ||||
| Moderate dietary factors | |||||
| Diet high in SSBs | No dietary intake of SSBs | Imamura F et al., BMJ, 2015 | per 250 g/day more | 1.13 (1.06–1.21) | |
| Diet high in red meat | 100 ± 10 g/week | Pan A et al., Am J Clin Nutr, 2011 | per 100 g/day more | 1.19 (1.04–1.37) | |
| Diet high in processed meat | No dietary intake of processed meat | Pan A et al., Am J Clin Nutr, 2011 | per 100 g/day more | 1.51 (1.25–1.83) | |
| Diet high in refined grain | 200 ± 20 g/day** | Hu EA et al., BMJ, 2012 | per 63.2 g/day more§ | 1.11 (1.08–1.14) | |
| Adequate dietary factors | |||||
| Diet low in whole grain | 125 ± 12.5 g/day** | Aune D et al., Eur J Epidemiol, 2013 | 90 g/day less | 1.47 (1.25–1.72) | |
| Diet low in low-fat dairy products | 300 ± 30 g/day** | Tong X et al., Eur J Clin Nutr, 2011 | 245 g/day less | 1.11 (1.05–1.18) | |
| Diet low in vegetables | 400 ± 40 g/day | Wang P et al., J Diabetes Investig, 2016 | 250 g/day less | 1.10 (0.99–1.22) | |
| Diet low in fruit | 300 ± 30 g/day | Wang P et al., J Diabetes Investig, 2016 | 100 g/day | 1.028 (1.01–1.04) | |
| Diet low in nuts | 114 ± 14 g/week | Afshin A et al., Am J Clin Nutr, 2014 | 16.2 g/day | 1.15 (1.07–1.23) | |
| Diet low in fish and seafood | 40 ± 4 g/day** | Wu J et al. (Asia), Br J Nutr, 2012 | per 100 g/day less | 1.12 (1.02–1.23) | |
F, female; M, male.
*For all age groups and both males and females if not specifically indicated.
**2016 Chinese Dietary Guidelines for grain 250–400 g/day; combined with 2015 American Dietary Guidelines regarding at least half of grain intake is whole grain, so the TMRED level of whole grain is set up as at least 250/2 = 125 g/day and TMRED of refined grain is at most of 400/2 = 200 g/day.
2016 Chinese Dietary Guidelines: 40–75 g/day for fish and seafood and dairy products of 300 g/day, we set up TMRED of fish and seafood of at least 40 g/day and low-fat dairy of 300 g/day.
§Per 158 g/day cooked rice (dry weight = 158/2.5 = 63.2).
‡The full reference list for this table is listed in the Supplementary Data online.
Etiological Effects of Risk Factors on Diabetes
Data on etiological effects of risk factor exposures on diabetes were extracted from the most recent systematic reviews and meta-analyses. The identified observational studies in these meta-analyses used multivariable adjustment for other risk factors in order to reduce potential bias from confounding. For each risk factor-diabetes association, we derived the same RR for males and females and across age groups, except where empirical evidence indicated that the RR differed by sex or age (17,18).
Optimal Exposure Distribution
We used TMRED as the alternative optimal exposure distribution to assess the proportion of diabetes cases associated with all nonoptimal levels of exposure (16). The TMRED for smoking was zero (e.g., no tobacco smoking). For variables where the exposure of zero is physiologically impossible, such as in BMI, SBP, diet, and physical activity, the optimal distribution for each factor was characterized based on observed levels associated with the lowest disease risk in epidemiological studies of clinical end points or the levels observed in low-exposure populations (15,16,19). We also considered recommended intake levels for dietary factors from the Chinese Dietary Guidelines (20). The SD of the TMRED was estimated from the optimal distributions in the Global Burden of Diseases study (15,16,19), which was 10% of the mean for dietary factors and physical activity. The modeling assumed no additional health benefits beyond the optimal population distribution of the TMRED (15,16,19).
Total Diabetes Cases
The figures for diabetes cases in China were extracted from the publicly available age- and sex-specific prevalence of diabetes (1) in combination with the age- and sex-specific population data from the 2010 Population Census of the People’s Republic of China.
Statistical Analysis
Standardization
The mean (SD) or percentage of each risk factor was calculated by sex and age groups in each wave, and then we calculated the overall sex and age standardized distribution of each risk factor using the 2010 Chinese Population Census data as the standard to describe the overall trends for each factor over time.
Projection
Future trends of 14 risk factors for 2012–2031 were projected based on data for participants with more than three repeated measurements during 1991–2011 using a random-effects model within each stratum of age and sex. The proportion of three or more repeated measurements was 53.8% for dietary factors and 53–54% for other factors.
The T2D burden attributable to specific/individual risk factors was estimated by assuming a causal relationship between each risk factor and T2D and then calculating the population-attributable fraction (PAF) (16) to estimate the proportional reduction in T2D cases that would occur if risk factor exposure had been reduced to an alternative level based on the total effects of the risk factor.
For risk factors measured continuously (blood pressure, BMI, and dietary factors), we computed PAFs using the following equation:
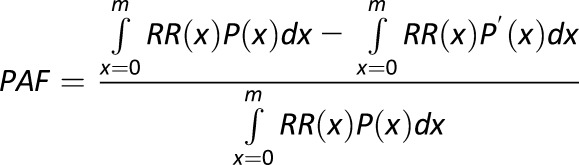 |
where x = exposure level; P(x) = actual distribution of exposure in the population; P′(x) = alternative distribution of exposure in the population; RR(x) = RR of diabetes at exposure level x; and m = maximum exposure level. The discrete version of the same estimator for PAF was applied to smoking that was measured in categories.
The PAF related to each risk factor for diabetes was calculated by joint classifications of sex and age groups (12 groups in total). We calculated the number of diabetes cases attributable to each risk factor by multiplying its PAF by the total number of cases.
Results
The estimated number of T2D cases was 93.6 million in 2011 (Supplementary Table 1). From the combination of the extracted RRs (Table 1), the total number of diabetes cases, and the distribution of risk factors, our estimation indicated that high BMI was the leading individual attributable factor for diabetes cases in China, which was responsible for 43.8 million diabetes cases in 2011 (Fig. 1), with an estimated PAF of 46.8%. In the sensitivity analysis, diabetes burden estimates based on the lower and upper limits of the RR were 39.4 and 46.8 million, respectively (Supplementary Fig. 1). The average BMI among adults ≥20 years of age was 21.7 kg/m2 (SE 0.14) in 1991, which increased to 23.5 kg/m2 (SE 0.15) in 2011, and was projected to be 25.2 kg/m2 (SE 0.21) in 2031 (Fig. 2A and Supplementary Table 2). The increase in BMI was estimated to be responsible for 22.3 million diabetes cases from 1991 to 2011 and was estimated to be responsible for another 10.2 million diabetes cases from 2011 to 2031 (Fig. 2A).
Figure 1.

Diabetes cases attributable to 14 individual risk factors in 2011.
Figure 2.

Time trends and estimated diabetes cases attributable to high BMI (A), low physical activity (B), high SBP (C), and smoking (D). The mean (SE) of each risk factor distribution at each time point was standardized by age and sex distribution using the 2010 Chinese Population Census data as the standard.
Based on the repeated measurements of the CHNS, we observed a drastic decline in physical activity levels (Fig. 2B). The average physical activity level among adults ≥20 years of age was 379 MET hours/week (SE 10.2) in 1991, which decreased to 190.3 MET hours/week (SE 6.6) in 2011 (Fig. 2B). The number of diabetes cases attributable to physical inactivity was 16.4, 29.5, and 42.4 million in 1991, 2011, and 2031, respectively (Fig. 2B). An increasing trend was observed for average SBP, which increased from 119 mmHg in 1991 to 123 mmHg in 2011. The number of diabetes cases attributable to high SBP was 16.8, 21.6, and 30.4 million in 1991, 2011, and 2031, respectively (Fig. 2C). A declining trend in current smoking was estimated to result in 2.0 million fewer diabetes cases during 1991–2011 and was projected to prevent an additional 1.3 million cases during 2011–2031 (Fig. 2D), primarily among males (Supplementary Fig. 2). The PAF of smoking on the risk of diabetes in 2011 was 18.1% among males and 1.3% among females (Supplementary Fig. 2).
We classified dietary factors into the following two groups: moderate components (lower intake is preferred), including refined grains, red meat, processed meat, and sugar-sweetened beverages (SSBs); and adequate components (higher intake is preferred), including whole grains, low-fat dairy products, fruits, vegetables, nuts, and fish and seafood. The average intake levels are listed in Supplementary Table 2.
The average daily intake of refined grains among Chinese adults ≥20 years of age was 442 g/day (SE 7.2) in 1997, which decreased to 348 g/day (SE 4.8) in 2011 (Fig. 3A.a). However, the average intake of whole grains was 4 g/day in 1997 and 4.6 g/day in 2011 (Fig. 3B.a). Despite a decrease in the number of diabetes cases attributable to both refined and whole grains, a low intake of whole grains and a high intake of refined grains remained the leading dietary risk factors for diabetes in China. In 2011, the estimated number of diabetes cases attributable to the low intake of whole grains and the high intake of refined grains was 37.8 million and 21.8 million, respectively (Fig. 1). The consumption of red meat (from 54.7 g/day in 1997 to 80.0 g/day in 2011), processed meat (from 2.1 g/day in 1997 to 3.7 g/day in 2011), and SSBs (from 0.5 g/day to 4.2 g/day) showed increasing trends over time, although overall consumption levels remained relatively low (Fig. 3A.b–d).
Figure 3.


Time trends and estimated diabetes cases attributable to a high intake of moderate dietary components (A) and a low intake of adequate dietary components (B). A.a: Refined grain. A.b: Processed meat. A.c: Red meat. A.d: SSBs. B.a: Whole grains. B.b: Low-fat dairy products. B.c: Nuts. B.d: Fruit. B.e: Vegetables. B.f: Fish and seafood. Solid bars represent diabetes cases; circles represent mean values; and bars represent SEs of each risk factor distribution at each time point, which were standardized by age and sex distribution using the 2010 Chinese Population Census.
In 2011, the mean intake levels of Chinese adults ≥20 years of age were 0.2 g/day (TMRED 300) for low-fat dairy products, 5.4 g/day (TMRED 114) for nuts, 68.0 g/day (TMRED 300) for fruit, 320.7 g/day (TMRED 400) for vegetables, and 31.0 g/day (TMRED 40) for fish and seafood (Fig. 3B.b–f). Insufficient intake levels of these dietary factors were estimated to be responsible for 11.3, 9.9, 6.0, 3.6, and 2.6 million diabetes cases, respectively, in 2011 (Fig. 1). Intake levels of these adequate components increased over time, but the average intake remained below TMRED levels (Fig. 3B).
Conclusions
The current study comprehensively examined a wide range of lifestyle factors among a large and representative adult Chinese population and estimated the number of diabetes cases attributable to those factors in China. Modifiable risk factors, including high BMI; physical inactivity; high blood pressure; a diet low in whole grains, low-fat dairy products, fruits, vegetables, nuts, and fish and seafood but high in refined grains, red meat, processed meat, and SSBs; as well as smoking, accounted for the majority of diabetes cases. Although we observed modest improvements in the intake levels of multiple dietary components and smoking, overall diet quality still fell short of optimal goals and smoking prevalence was still high. These modest improvements could not counteract the increasing burden of diabetes due to unfavorable concurrent changes in BMI, physical inactivity, and blood pressure.
The continuous upward trend in BMI among the Chinese population has moved China from 60th and 41st place for males and females in the worldwide ranking of the number of severely obese individuals in 1975 to 2nd place for both sexes in 2014 (21). Our estimation indicated that high BMI was the leading attributable individual factor for diabetes in China with a PAF of 46.8%. This is consistent with a previous cohort study in China that observed a population-attributable risk of 42.9% for BMI ≥25 kg/m2 in relation to diabetes risk (22). Overweight and obesity have been reported to be responsible for 77% of diabetes cases in a Finnish population (23) and for 46% of diabetes cases in males (61% in females) in a Spanish population (24). Our estimated diabetes burden attributable to high BMI is likely to be underestimated. This is because the etiological effect of BMI was derived mostly from European populations; Chinese individuals tend to have a higher diabetes risk and increases in insulin resistance and other diabetes risk factors per unit increase of BMI (6,25,26). However, the only direct comparison study of diabetes risk with per unit increase of BMI did not observe a significant difference between Chinese and Caucasian populations (27).
Grains are a staple food among the Chinese population, constituting a dominant portion of daily calorie consumption. It was estimated that in China 79.9–88.8% of the population consumes rice daily, whereas 63.3–80.2% consume wheat-based items daily (28). Although carbohydrates continue to provide the majority of daily calories in the Chinese population, the intake of carbohydrates decreased from 68.8% of total energy in 1991 to 60% in 2004 (29). In comparison, the U.S. population consumed <50% of energy from carbohydrates, which increased from 44.0% in 1971 to 48.7% in 2006 (30). The majority of grains consumed in China are refined, including white rice and refined wheat flour, which was a major contributor to the dietary glycemic load of the diet (31). Greater refined grain intake has been consistently associated with an increased risk of diabetes (32,33). Conversely, greater intake of whole grains was associated with a lower risk (32,33). Compared with refined grains, whole grains have a lower glycemic index and contain higher amounts of dietary fiber, contributing to a lower risk of diabetes (34). A higher intake of whole grains has also been associated with improved insulin sensitivity (35). The inverse association between the intake of whole grain and prospective weight gain (36) might be another potential mechanism underlying the relationship between whole grains and diabetes. Replacing refined grain staples with whole-grain foods for health promotion in China will be challenging but not impossible because coarse whole grains were the basis of traditional carbohydrate staple diets before the introduction of advanced technologies used in the agricultural sector and food industries to popularize refined grains. Promoting the health benefits of whole-grain foods could change societal attitudes toward them (37), and the favorable nutrient-to-price ratio of cereals (whole grain) may be promoted as an affordable strategy to increase their purchase (38). As observed in an initial focus group and taste test study among middle-aged Chinese adults, the main cultural barriers to the acceptance of brown rice were the perception of rough texture, unpalatable taste, and higher price, whereas the majority of participants were willing to switch to brown rice if the cost were affordable (39).
We observed a gradual increase in the intake of red and processed meat, which have been positively associated with the risk of diabetes (40). Although we observed moderate increases in the intake of several healthy dietary factors, including fruits, vegetables, nuts, low-fat dairy products, and fish and seafood, the overall consumption levels remained relatively low and the overall dietary quality was not optimal (41). Our previous study (42) identified a traditional Chinese dietary pattern characterized by high refined grain intake and another dietary pattern characterized by a higher intake of foods with an animal source; both were associated with a higher risk of diabetes among the Chinese population, which was partially explained by their effects on BMI and central body adiposity. Cumulative exposure to a healthy dietary pattern was associated with a lower diabetes risk compared with those with unhealthier dietary pattern scores (43).
Physical activity is a key lifestyle factor for the prevention and management of diabetes. Our study indicated that decreasing physical activity, which was responsible for almost one-third of the diabetes cases in 2011, was the third leading individual factor attributable to diabetes. The average level of physical activity in Chinese adults in 2011 was less than half of that in 1991. Declines in overall physical activity were largely driven by reductions in occupational physical activity, decreases in domestic activities, declines in active transport, and increases in sedentary activities (14). The average occupational physical activity level fell from 382 MET hours/week in 1991 to 264 MET hours/week in 2011 among adult men and fell from 420 MET hours/week in 1991 to 243 MET hours/week in 2011 among adult women (14). The domestic activity level decreased during the same period in both males and females (44). Physically active forms of transportation, including bicycling and walking as the dominant forms of transportation in China, were gradually replaced by more passive forms such as cars, motorcycles, and buses. Although the levels of leisure-time physical activity increased continually (45) in China with the national and local physical activity promotion campaigns (46), the overall physical activity level was still low. It is estimated that half an hour of daily moderate-intensity physical activity is required for diabetes prevention (47), which is difficult to achieve through leisure-time physical activity alone (48). Maintaining an active lifestyle is encouraged to prevent diabetes in China, including but not limited to brisk walking, bicycling, working around the house or yard, and standing or walking while working (14,44,46).
The strengths of the current study include the originality and high response rate of the CHNS (88%); this survey is the only large-scale longitudinal study of its kind in China (10). Our study was the first population-level long-term analysis of diabetes-attributable cases associated with dietary and lifestyle factors using comparable methods. Our estimates were based on the most recent and best available evidence on risk factor-diabetes associations, derived primarily from meta-analyses. Sampling representativeness is an issue to be considered when interpreting our results. The CHNS sample was not designed to be representative of China but to be a random selection able to capture a range of demographic conditions, economic development, and health indicators (10). The randomly selected households in nine provinces have provided a broad-based indication of the trends taking place in China.
Some methodological limitations also need to be acknowledged when interpreting our results. First, the total number of diabetes cases attributable to multiple factors could not be obtained by simple summing because the models for PAF assume that each factor was independent but the estimated diabetes burden attributable to each individual factor was not mutually exclusive. However, interaction and mediation effects between factors on the risk of diabetes were possible. For example, the diabetes burden associated with physical inactivity and the intake of highly refined grain and red meat might be mediated by their effects on BMI, whereas smoking and BMI may additively interact in the risk of T2D (49). Thus, the total number of diabetes cases attributable to multiple factors could not be summed because of joint distributions and shared pathways through interaction or mediation. Novel methods and solid evidence–based joint RRs are warranted for future studies to estimate the diabetes burden associated with joint distributions of multiple interrelated risk factors. Instead, our results can be considered the best estimates of the total effect of individual risk factors, including upstream determinants and downstream mediators (50). Second, the etiological effects of risk factors on diabetes that were used in this study were derived from meta-analyses, which primarily contain studies from Western populations. However, after carefully adjusting for potential confounding variables in the observational studies included in these meta-analyses, the associations represent the underlying physiological mechanisms, which are generally similar across different populations (51–53). Future estimations based on meta-analyses of Asian or specifically among Chinese populations are warranted when more data become available. Third, our estimation of diabetes burden is based on the theoretical ideal level of the individual factor in combination with the effect size for the individual factor estimated from the meta-analysis of prospective studies. Our findings of the large diabetes burden associated with lifestyle factors highlighted the importance of primary prevention before diabetes occurs. However, our estimation based on the comparative risk assessment model could not prove that changes in these factors could reduce diabetes risk in the same way since the impact of reducing risk is different from the etiology of identifying associations. However, it should still be acknowledged that secondary prevention strategies to reduce the impact of diabetes among patients with diabetes should also be emphasized in China where more than half of patients with diabetes are undiagnosed (1,2). How to improve the awareness, treatment, and control rate of patients with diabetes in China is warranted in future studies.
In conclusion, high BMI and a diet high in refined grains but low in whole grains are the leading factors contributing to the diabetes burden in China. High blood pressure and low physical activity were also important contributors. Increased intake of fruits, vegetables, low-fat dairy products, and fish and seafood, as well as decreased smoking prevalence contributed to a slight reduction in the diabetes burden from 1991 to 2011. However, the current levels of these factors remain suboptimal. In order to slow down or even stop the increasing diabetes epidemic in China, health promotion strategies should include replacing whole grains with refined grains; increasing the popularization of low-fat dairy products or replacing whole-fat with low-fat or fat-free dairy products; increasing the intake of fruits, vegetables, nuts, and fish and seafood; and developing environments conducive to walking and bicycling. Targeted interventions for smoking cessation are still warranted and with the rapid Westernization of the Chinese diet, the consumption of red meat, processed meat, and SSBs should also be targeted in future interventions to prevent diabetes in China (54). These findings can be used to help inform policy strategies for diabetes prevention at the population level.
Supplementary Material
Article Information
Acknowledgments. The authors thank Guifeng Jin and Shufa Du from the University of North Carolina at Chapel Hill and Huijun Wang from the China National Institute of Nutrition and Health for providing individual assistance in the data preparation.
Funding. The current study was supported by the Swiss Re Foundation. This research was supported by the National Bureau of Statistics of the People’s Republic of China, the National Institute of Nutrition and Food Safety, the Chinese Center for Disease Control and Prevention, the Carolina Population Center (grant 5 R24 HD050924), the University of North Carolina at Chapel Hill, the National Institutes of Health (NIH) (grants R01-HD-30880, DK-056350, R24-HD050924, and R01-HD-38700), and the Fogarty International Center. Financial support was also provided by the NIH for the CHNS data collection and analysis files from 1989 to 2011 surveys, and by the China-Japan Friendship Hospital, Ministry of Health for the CHNS 2009. Most of the data presented in this article were based on the National Population Census Datasets, and eight waves of data from the CHNS.
Duality of Interest. No potential conflicts of interest relevant to this article were reported.
Author Contributions. Y.L. analyzed data and wrote the manuscript. D.D.W. reviewed the extracted RRs and reviewed and edited the manuscript. S.H.L. and M.V. reviewed and edited the manuscript. A.G.H. and Y.H. researched data and reviewed and edited the manuscript. F.B.H. designed the study, contributed to discussion, and reviewed and edited the manuscript. Y.L. and F.B.H. are the guarantors of this work and, as such, had full access to all the data in the study and take responsibility for the integrity of the data and the accuracy of the data analysis.
Footnotes
This article contains Supplementary Data online at http://care.diabetesjournals.org/lookup/suppl/doi:10.2337/dc17-0571/-/DC1.
This article is featured in a podcast available at http://www.diabetesjournals.org/content/diabetes-core-update-podcasts.
References
- 1.Yang W, Lu J, Weng J, et al.; China National Diabetes and Metabolic Disorders Study Group . Prevalence of diabetes among men and women in China. N Engl J Med 2010;362:1090–1101 [DOI] [PubMed] [Google Scholar]
- 2.Wang L, Gao P, Zhang M, et al. Prevalence and ethnic pattern of diabetes and prediabetes in China in 2013. JAMA 2017;317:2515–2523 [DOI] [PMC free article] [PubMed] [Google Scholar]
- 3.National Diabetes Prevention Collaborative Group A mass survey of diabetes mellitus in a population of 300,000 in 14 provinces and municipalities in China. Zhonghua Nei Ke Za Zhi 1981;20:678–683 [author's translation] [PubMed] [Google Scholar]
- 4.Pan XR, Yang WY, Li GW, Liu J; National Diabetes Prevention and Control Cooperative Group . Prevalence of diabetes and its risk factors in China, 1994. Diabetes Care 1997;20:1664–1669 [DOI] [PubMed] [Google Scholar]
- 5.Li LM, Rao KQ, Kong LZ, et al.; Technical Working Group of China National Nutrition and Health Survey . A description on the Chinese national nutrition and health survey in 2002. Zhonghua Liu Xing Bing Xue Za Zhi 2005;26:478–484 [in Chinese] [PubMed] [Google Scholar]
- 6.Chan JC, Malik V, Jia W, et al. Diabetes in Asia: epidemiology, risk factors, and pathophysiology. JAMA 2009;301:2129–2140 [DOI] [PubMed] [Google Scholar]
- 7.Hu FB. Globalization of diabetes: the role of diet, lifestyle, and genes. Diabetes Care 2011;34:1249–1257 [DOI] [PMC free article] [PubMed] [Google Scholar]
- 8.Hu FB, Manson JE, Stampfer MJ, et al. Diet, lifestyle, and the risk of type 2 diabetes mellitus in women. N Engl J Med 2001;345:790–797 [DOI] [PubMed] [Google Scholar]
- 9.Li G, Zhang P, Wang J, et al. The long-term effect of lifestyle interventions to prevent diabetes in the China Da Qing Diabetes Prevention Study: a 20-year follow-up study. Lancet 2008;371:1783–1789 [DOI] [PubMed] [Google Scholar]
- 10.Popkin BM, Du S, Zhai F, Zhang B. Cohort profile: the China Health and Nutrition Survey--monitoring and understanding socio-economic and health change in China, 1989-2011. Int J Epidemiol 2010;39:1435–1440 [DOI] [PMC free article] [PubMed] [Google Scholar]
- 11.Li Y, Wang DD, Ley SH, et al. Potential impact of time trend of life-style factors on cardiovascular disease burden in China. J Am Coll Cardiol 2016;68:818–833 [DOI] [PMC free article] [PubMed] [Google Scholar]
- 12.Stern D, Smith LP, Zhang B, Gordon-Larsen P, Popkin BM. Changes in waist circumference relative to body mass index in Chinese adults, 1993-2009. Int J Obes 2014;38:1503–1510 [DOI] [PMC free article] [PubMed] [Google Scholar]
- 13.Du S, Batis C, Wang H, Zhang B, Zhang J, Popkin BM. Understanding the patterns and trends of sodium intake, potassium intake, and sodium to potassium ratio and their effect on hypertension in China. Am J Clin Nutr 2014;99:334–343 [DOI] [PMC free article] [PubMed] [Google Scholar]
- 14.Ng SW, Howard AG, Wang HJ, Su C, Zhang B. The physical activity transition among adults in China: 1991-2011. Obes Rev 2014;15(Suppl. 1):27–36 [DOI] [PMC free article] [PubMed] [Google Scholar]
- 15.Lim SS, Vos T, Flaxman AD, et al. A comparative risk assessment of burden of disease and injury attributable to 67 risk factors and risk factor clusters in 21 regions, 1990-2010: a systematic analysis for the Global Burden of Disease Study 2010. Lancet 2012;380:2224–2260 [DOI] [PMC free article] [PubMed] [Google Scholar]
- 16.Danaei G, Ding EL, Mozaffarian D, et al. The preventable causes of death in the United States: comparative risk assessment of dietary, lifestyle, and metabolic risk factors. PLoS Med 2009;6:e1000058. [DOI] [PMC free article] [PubMed] [Google Scholar]
- 17.Emdin CA, Anderson SG, Woodward M, Rahimi K. Usual blood pressure and risk of new-onset diabetes: evidence from 4.1 million adults and a meta-analysis of prospective studies. J Am Coll Cardiol 2015;66:1552–1562 [DOI] [PMC free article] [PubMed] [Google Scholar]
- 18.Pan A, Wang Y, Talaei M, Hu FB, Wu T. Relation of active, passive, and quitting smoking with incident type 2 diabetes: a systematic review and meta-analysis. Lancet Diabetes Endocrinol 2015;3:958–967 [DOI] [PMC free article] [PubMed] [Google Scholar]
- 19.Micha R, Peñalvo JL, Cudhea F, Imamura F, Rehm CD, Mozaffarian D. Association between dietary factors and mortality from heart disease, stroke, and type 2 diabetes in the United States. JAMA 2017;317:912–924 [DOI] [PMC free article] [PubMed] [Google Scholar]
- 20.Chinese Nutrition Society. The Chinese dietary guidelines, 2017 [article online]. Available from http://dg.cnsoc.org/article/04/8a2389fd5520b4f30155b41b364b23df.html. Accessed 20 June 2017
- 21.NCD Risk Factor Collaboration (NCD-RisC) Trends in adult body-mass index in 200 countries from 1975 to 2014: a pooled analysis of 1698 population-based measurement studies with 19.2 million participants. Lancet 2016;387:1377–1396 [DOI] [PMC free article] [PubMed] [Google Scholar]
- 22.Wang C, Li J, Xue H, et al. Type 2 diabetes mellitus incidence in Chinese: contributions of overweight and obesity. Diabetes Res Clin Pract 2015;107:424–432 [DOI] [PubMed] [Google Scholar]
- 23.Laaksonen MA, Knekt P, Rissanen H, et al. The relative importance of modifiable potential risk factors of type 2 diabetes: a meta-analysis of two cohorts. Eur J Epidemiol 2010;25:115–124 [DOI] [PubMed] [Google Scholar]
- 24.Huerta JM, Tormo MJ, Chirlaque MD, et al. Risk of type 2 diabetes according to traditional and emerging anthropometric indices in Spain, a Mediterranean country with high prevalence of obesity: results from a large-scale prospective cohort study. BMC Endocr Disord 2013;13:7. [DOI] [PMC free article] [PubMed] [Google Scholar]
- 25.Wang D, Li Y, Lee SG, et al. Ethnic differences in body composition and obesity related risk factors: study in Chinese and white males living in China. PLoS One 2011;6:e19835. [DOI] [PMC free article] [PubMed] [Google Scholar]
- 26.Khoo CM, Sairazi S, Taslim S, et al. Ethnicity modifies the relationships of insulin resistance, inflammation, and adiponectin with obesity in a multiethnic Asian population. Diabetes Care 2011;34:1120–1126 [DOI] [PMC free article] [PubMed] [Google Scholar]
- 27.Pan WH, Flegal KM, Chang HY, Yeh WT, Yeh CJ, Lee WC. Body mass index and obesity-related metabolic disorders in Taiwanese and US whites and blacks: implications for definitions of overweight and obesity for Asians. Am J Clin Nutr 2004;79:31–39 [DOI] [PubMed] [Google Scholar]
- 28.Su C, Zhang B, Wang HJ, et al. The status and trend of cereal consumption among Chinese adults in nine provinces (municipality) from 1989 to 2006. Zhonghua Yu Fang Yi Xue Za Zhi 2011;45:798–801 [in Chinese] [DOI] [PubMed] [Google Scholar]
- 29.Zhai F, Wang H, Du S, et al. Prospective study on nutrition transition in China. Nutr Rev 2009;67(Suppl. 1):S56–S61 [DOI] [PubMed] [Google Scholar]
- 30.Austin GL, Ogden LG, Hill JO. Trends in carbohydrate, fat, and protein intakes and association with energy intake in normal-weight, overweight, and obese individuals: 1971-2006. Am J Clin Nutr 2011;93:836–843 [DOI] [PubMed] [Google Scholar]
- 31.Villegas R, Liu S, Gao YT, Yang G, Li H, Zheng W, et al. Prospective study of dietary carbohydrates, glycemic index, glycemic load, and incidence of type 2 diabetes mellitus in middle-aged Chinese women. Arch Intern Med 2007;167:2310–2316 [DOI] [PubMed] [Google Scholar]
- 32.Aune D, Norat T, Romundstad P, Vatten LJ. Whole grain and refined grain consumption and the risk of type 2 diabetes: a systematic review and dose-response meta-analysis of cohort studies. Eur J Epidemiol 2013;28:845–858 [DOI] [PubMed] [Google Scholar]
- 33.Hu EA, Pan A, Malik V, Sun Q. White rice consumption and risk of type 2 diabetes: meta-analysis and systematic review. BMJ 2012;344:e1454. [DOI] [PMC free article] [PubMed] [Google Scholar]
- 34.InterAct Consortium Dietary fibre and incidence of type 2 diabetes in eight European countries: the EPIC-InterAct Study and a meta-analysis of prospective studies. Diabetologia 2015;58:1394–1408 [DOI] [PMC free article] [PubMed] [Google Scholar]
- 35.Liese AD, Roach AK, Sparks KC, Marquart L, D’Agostino RB Jr, Mayer-Davis EJ. Whole-grain intake and insulin sensitivity: the Insulin Resistance Atherosclerosis Study. Am J Clin Nutr 2003;78:965–971 [DOI] [PubMed] [Google Scholar]
- 36.Mozaffarian D, Hao T, Rimm EB, Willett WC, Hu FB. Changes in diet and lifestyle and long-term weight gain in women and men. N Engl J Med 2011;364:2392–2404 [DOI] [PMC free article] [PubMed] [Google Scholar]
- 37.Mattei J, Malik V, Wedick NM, et al.; Global Nutrition Epidemiologic Transition Initiative . Reducing the global burden of type 2 diabetes by improving the quality of staple foods: the Global Nutrition and Epidemiologic Transition Initiative. Global Health 2015;11:23. [DOI] [PMC free article] [PubMed] [Google Scholar]
- 38.Drewnowski A. The Nutrient Rich Foods Index helps to identify healthy, affordable foods. Am J Clin Nutr 2010;91:1095S–1101S [DOI] [PubMed] [Google Scholar]
- 39.Zhang G, Malik VS, Pan A, et al. Substituting brown rice for white rice to lower diabetes risk: a focus-group study in Chinese adults. J Am Diet Assoc 2010;110:1216–1221 [DOI] [PubMed] [Google Scholar]
- 40.Pan A, Sun Q, Bernstein AM, et al. Red meat consumption and risk of type 2 diabetes: 3 cohorts of US adults and an updated meta-analysis. Am J Clin Nutr 2011;94:1088–1096 [DOI] [PMC free article] [PubMed] [Google Scholar]
- 41.Ezzati M, Riboli E. Behavioral and dietary risk factors for noncommunicable diseases. N Engl J Med 2013;369:954–964 [DOI] [PubMed] [Google Scholar]
- 42.He Y, Ma G, Zhai F, et al. Dietary patterns and glucose tolerance abnormalities in Chinese adults. Diabetes Care 2009;32:1972–1976 [DOI] [PMC free article] [PubMed] [Google Scholar]
- 43.Ley SH, Pan A, Li Y, et al. Changes in overall diet quality and subsequent type 2 diabetes risk: three U.S. prospective cohorts. Diabetes Care 2016;39:2011–2018 [DOI] [PMC free article] [PubMed] [Google Scholar]
- 44.Ng SW, Norton EC, Popkin BM. Why have physical activity levels declined among Chinese adults? Findings from the 1991-2006 China Health and Nutrition Surveys. Soc Sci Med 2009;68:1305–1314 [DOI] [PMC free article] [PubMed] [Google Scholar]
- 45.Tian Y, Jiang C, Wang M, et al. BMI, leisure-time physical activity, and physical fitness in adults in China: results from a series of national surveys, 2000-14. Lancet Diabetes Endocrinol 2016;4:487–497 [DOI] [PubMed] [Google Scholar]
- 46.The State Council General Office of The Central People's Government of the People's Republic of China. Notice of the State Council on Printing and Distributing the National Fitness Program (2011-2015), 2011 [article online]. Available from http://www.gov.cn/zwgk/2011-02/24/content_1809557.htm. Accessed 20 June 2017
- 47.Centers for Disease Control and Prevention 2014 State Indicator Report on Physical Activity. Atlanta, GA, U.S. Department of Health and Human Services, 2014 [Google Scholar]
- 48.Bauman A, Allman-Farinelli M, Huxley R, James WP. Leisure-time physical activity alone may not be a sufficient public health approach to prevent obesity—a focus on China. Obes Rev 2008;9(Suppl. 1):119–126 [DOI] [PubMed] [Google Scholar]
- 49.Luo W, Guo Z, Wu M, Hao C, Zhou Z, Yao X. Interaction of smoking and obesity on type 2 diabetes risk in a Chinese cohort. Physiol Behav 2015;139:240–243 [DOI] [PubMed] [Google Scholar]
- 50.Yakoob MY, Micha R, Khatibzadeh S, et al.; Global Burden of Diseases, Injuries, and Risk Factors: Nutrition and Chronic Diseases Expert Group, and Metabolic Risk Factors of Chronic Diseases Collaborating Group . Impact of dietary and metabolic risk factors on cardiovascular and diabetes mortality in South Asia: analysis from the 2010 Global Burden of Disease Study. Am J Public Health 2016;106:2113–2125 [DOI] [PMC free article] [PubMed] [Google Scholar]
- 51.Wang PY, Fang JC, Gao ZH, Zhang C, Xie SY. Higher intake of fruits, vegetables or their fiber reduces the risk of type 2 diabetes: a meta-analysis. J Diabetes Investig 2016;7:56–69 [DOI] [PMC free article] [PubMed] [Google Scholar]
- 52.Du H, Li L, Bennett D, et al.; China Kadoorie Biobank study . Fresh fruit consumption in relation to incident diabetes and diabetic vascular complications: a 7-y prospective study of 0.5 million Chinese adults. PLoS Med 2017;14:e1002279. [DOI] [PMC free article] [PubMed] [Google Scholar]
- 53.Liese AD, Krebs-Smith SM, Subar AF, et al. The Dietary Patterns Methods Project: synthesis of findings across cohorts and relevance to dietary guidance. J Nutr 2015;145:393–402 [DOI] [PMC free article] [PubMed] [Google Scholar]
- 54.Hu FB, Liu Y, Willett WC. Preventing chronic diseases by promoting healthy diet and lifestyle: public policy implications for China. Obes Rev 2011;12:552–559 [DOI] [PubMed] [Google Scholar]
Associated Data
This section collects any data citations, data availability statements, or supplementary materials included in this article.