Abstract
Objective
Adipose tissue cholesterol increases with adipocyte triglyceride (TG) content and size during development of obesity. However, how adipocyte cholesterol affects adipocyte function is poorly understood. The aim of this study was to evaluate the role of the cellular cholesterol exporter, ATP binding cassette transporter A1 (Abca1), on adipose tissue function during diet-induced obesity.
Approach and Results
Adiponectin Cre recombinase transgenic mice were crossed with Abca1 flox/flox mice to generate adipocyte-specific Abca1 knockout (ASKO) mice. Control (Cntl) and ASKO mice were then fed a high fat, high cholesterol (45% calories as fat, 0.2% cholesterol) diet for 16 weeks. Compared to Cntl mice, ASKO mice had a 2-fold increase in adipocyte plasma membrane cholesterol content and significantly lower body weight, epididymal fat pad weight, and adipocyte size. ASKO vs. Cntl adipose tissue had decreased peroxisome proliferator-activated receptor γ (PPARγ) and CCAAT/enhancer binding protein expression, nuclear sterol regulatory element binding protein 1 (SREBP1) protein, lipogenesis, and TG accretion, but similar Akt activation after acute insulin stimulation. Acute siRNA-mediated Abca1 silencing during 3T3L1 adipocyte differentiation reduced adipocyte Abca1 and PPARγ protein expression and triglyceride content. Systemic stimulated TG lipolysis and glucose homeostasis was similar between Cntl and ASKO mice.
Conclusions
Adipocyte Abca1 is a key regulator of adipocyte lipogenesis and lipid accretion, likely due to increased adipose tissue membrane cholesterol, resulting in decreased activation of lipogenic transcription factors PPARγ and SREBP1.
Keywords: Lipids and lipoproteins, obesity, adipose tissue, animal model, cholesterol
Subject codes: Animal models of human disease, Lipids and Cholesterol, Basic Science Research, Metabolism
Introduction
Obesity continues to increase at an alarming rate in the US population, with 67% of adults classified as overweight or obese based on body mass index 1, 2. Obesity is a risk factor for other chronic diseases and is associated with increased prevalence of type 2 diabetes, hypertension, dyslipidemia, and cardiovascular disease 2, 3. With the onset of obesity, adipocytes increase in size due to increased triglyceride (TG) accumulation, which protects against lipotoxicity in other organs because excess circulating fatty acids (FAs) are esterified into TG and stored in adipocytes. However, if FA flux into adipose tissue exceeds the ability of adipocytes to store the excess energy as TG, adipocyte dysfunction and ultimately cell death occurs. Large dysfunctional adipocytes are charactized by decreased responsiveness to insulin 4, 5, decreased glucose uptake, increased endoplasmic reticulum and mitochondrial stress 6, reactive oxygen species 7, 8, and proinflammatory cytokine secretion 9–11. However, obesity and adipocyte hypertrophy does not lead to adipose tissue dysfunction in all cases 12–14, suggesting that additional factors contributing to adipose tissue dysfunction remain to be identified.
Cholesterol and TG accumulate proportionately in adipocytes during weight gain 15. While much research has focused on adipocyte TG accumulation, little is known about how cholesterol accumulation affects adipocyte function. Unlike other tissues, adipocytes store nearly all cholesterol as free cholesterol (FC; >93% of total cholesterol). In obesity, adipocytes can contain up to 50% of the body’s FC, making it the largest FC pool 16. Adipocytes also exhibit very low levels of cholesterol synthesis compared to other tissues, suggesting that most adipocyte cholesterol comes from dietary sources 17, 18. Several studies suggest a link between cholesterol content and adipose tissue inflammation 19, 20 and insulin resistance 21; however, how adipocyte cholesterol content influences adipose tissue inflammation and insulin resistance is poorly understood.
To determine how cholesterol accumulation affects adipocyte function, our lab 22 and others 23 have used in vivo mouse models to delete the ATP binding cassette transporter A1 (Abca1) from adipocytes. Abca1 is a membrane protein that exports cellular cholesterol and phospholipids to apolipoproteins, generating nascent high-density lipoprotein (HDL) particles 24. Abca1 is highly expressed in adipose tissue 25 and its expression is important in mobilizing adipose tissue cholesterol for transport to the liver for excretion 22, 26. Previous studies suggest that adipocyte Abca1 contributes significantly to plasma cholesterol concentrations and is the major cholesterol efflux mechanism in adipocytes 22, 23. However, the model used (i.e., aP2 Cre recombinase mouse) also results in partial and variable myeloid cell (i.e., macrophage, monocyte, neutrophil) Abca1 deletion 22, 27. Myeloid-specific Abca1 gene deletion results in proinflammatory macrophages that are functionally distinct from macrophages expressing Abca1 28–30. This is an important point because macrophages are the primary source of inflammatory cytokine expression in adipose tissue 31, and cytokines contribute to development of insulin resistance.
To address this issue, we generated an adipocyte-specific Abca1 knockout (ASKO) mouse model using an adiponectin Cre recombinase mouse, so that macrophage Abca1 expression remained intact 27. This model allowed us to study the impact of ABCA1 expression and adipocyte cholesterol accumulation on adipocyte function. Our results demonstrate that adipocyte Abca1 is critical for regulating adipose tissue cholesterol content and that genetic deletion of adipocyte Abca1 expression results in mice that are resistant to diet-induced obesity.
Methods and Methods
A detailed description of the materials and methods is available in the online-only data supplement.
Results
Abca1 is selectively deleted from adipose tissue
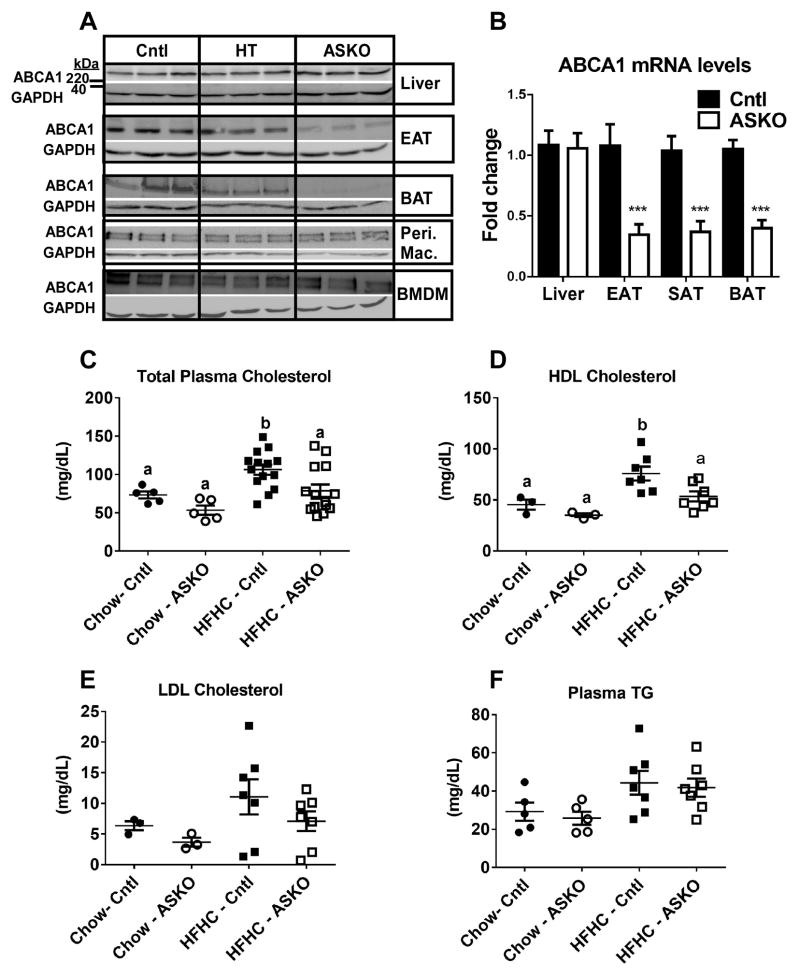
Previous reports on in vivo adipocyte Abca1 deletion used an Abca1flox/flox mouse crossed with an aP2 Cre recombinase mouse 22, 23; however, the resulting knockout mice also demonstrated partial and variable myeloid Abca1 deletion, complicating interpretation of results. In this study, we created an adipocyte-specific Abca1 knockout mouse model by crossing Abca1flox/flox mice with adiponectin Cre recombinase expressing mice obtained from Dr. Evan Rosen 32, 33. Abca1 protein expression was reduced in white adipose tissue (WAT; 17% (HT) and 58% (ASKO) of Cntl) and brown adipose tissue (BAT; 28% (HT) and 93% (ASKO) of Cntl) and the reduction exhibited the expected gene dosage effect (i.e., homozygous< heterozygous<Cntl) (Figure 1A). In contrast, no apparent decrease in Abca1 protein expression was observed in macrophages (peritoneal or bone marrow-derived) or liver, demonstrating selectivity for elimination of adipocyte Abca1. Abca1 gene expression was significantly reduced in adipose tissue, but not in liver (Figure 1B). Although other Abca1-expressing tissues were not examined, previous work has shown adipocyte specificity with the adiponectin Cre recombinase mouse 27, 32.
Figure 1.
A) Abca1 and GAPDH Western blots of tissues from Cntl, heterozygous ASKO (HT), and ASKO mice. EAT=epididymal adipose tissue, BAT=brown adipose tissue, Peri. Mac.=resident peritoneal macrophages, BMDM=bone marrow-derived macrophages. B) Abca1 gene expression in liver, EAT, SAT and BAT (n=6 per group). *** denotes statistical difference by Student’s t-test, p<0.0001. Plasma concentrations of: C) total cholesterol, D) HDL cholesterol, E) LDL cholesterol, and F) triglyceride (TG) in male Cntl and ASKO mice fed chow for 24 weeks or a HFHC diet for 16 weeks starting at 8 weeks of age. Total plasma cholesterol and TG concentrations were determined from individual plasma samples. LDL and HDL cholesterol concentrations were determined after FPLC fractionation of plasma and enzymatic assay of cholesterol as described in the Methods. Each data point represents an equal volume pooled from 2 mice. Panels C and D, different letters denote statistical difference by ANOVA and Tukey’s multiple comparisons test, p<0.05.
Adipocyte Abca1 deletion significantly reduces plasma HDL concentration
The previous adipocyte Abca1 knockout mouse model (made with an aP2 Cre recombinase mouse) had a slight, but significant decrease in total plasma cholesterol and HDL cholesterol in two separate studies 22, 23. In our study, plasma total, LDL, and HDL cholesterol concentrations were measured in mice before (chow) and after 16 weeks of HFHC diet. ASKO mice had significantly reduced (~30%) total plasma cholesterol (Figure 1C; genotype, p<0.015) and HDL cholesterol (Figure 1D; genotype, p<0.028) concentrations compared to control mice. However, because few age-matched chow-fed mice were analyzed, post-hoc analyses did not show a significant difference for total plasma cholesterol and HDL cholesterol between chow-fed control and ASKO mice. No differences were observed in plasma concentrations of LDL, VLDL, or TG between the two genotypes (Figure 1E and F).
ASKO mice are resistant to diet-induced weight gain
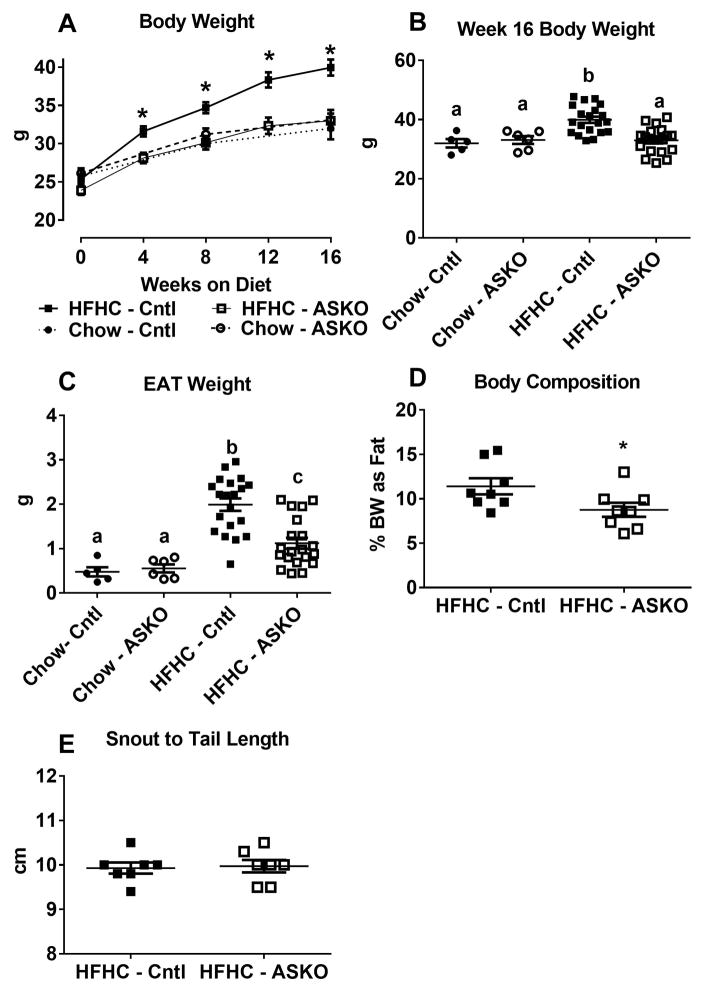
To determine the systemic effects of adipocyte-specific Abca1 gene deletion, mice were fed a HFHC diet for 16 weeks starting at 8 weeks of age. A smaller cohort was maintained on chow from weaning until 24 weeks of age. All three possible genotypes of Cntl mice (adiponectin Cre+ Abca1+/+, Abca1+/+, Abca1flox/flox) were used, since their phenotypes (body and fat pad weight, plasma cholesterol, adipocyte size, and adipose cholesterol content) were indistinguishable from Abca1+/+ mice. Both genotypes gained weight at a similar rate while consuming a chow diet. Strikingly, ASKO mice failed to gain weight on the HFHC diet compared to their Cntl counterparts (Figure 2A). In fact, weight gain for HFHC diet-fed ASKO mice was similar to chow-fed mice, resulting in terminal body weights significantly lower in HFHC-fed ASKO than in HFHC-fed Cntl mice (32.0 ± 1.4 g versus 39.9 ± 1.1 g; p<0.0017) (Figure 2B). These results demonstrate that adipocyte-specific Abca1 deletion confers resistance to HFHC diet-induced obesity.
Figure 2.
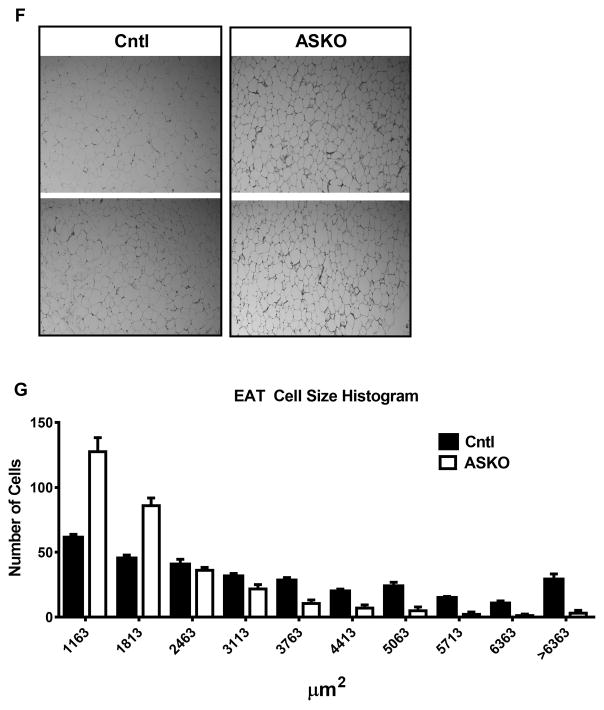
Male Cntl and ASKO mice were fed chow for 24 weeks (n=5–6) or a HFHC diet for 16 weeks starting at 8 weeks of age (n=20). Mice were sacrificed at 24 weeks of age to harvest adipose tissue. A) Body weight gain during dietary feeding. B) Terminal body weights. C) Epididymal adipose tissue (EAT) weight harvested at 24 weeks of age. D) Percentage of body weight as fat was calculated by summing the weight of epididymal, retrorenal, subcutaneous, and brown fat depots and dividing the sum by total body weight X 100% for each mouse. E) Snout to tail length of mice at 24 weeks of age. F) Representative photomicrographs of EAT harvested at 24 weeks of age. G) Histogram of EAT adipocyte cross-sectional area; 300 cell measurements per mouse were taken from n=6 mice per genotype. Adipocyte size was significantly smaller in ASKO vs. Cntl mice by Chi square analysis (p<0.001). Asterisks (panels A and D) and different letters (panels B and C) denote statistical difference by ANOVA and Tukey’s multiple comparisons test or unpaired Student’s t-test, p<0.05.
Similar patterns were observed in white adipose tissue weight. On a HFHC diet, Cntl mice had two-fold higher epididymal white adipose tissue (EAT) mass compared to ASKO mice (1.99 ± 0.14 vs. 1.12 ± 0.12 g, respectively, p < 0.0001), whereas EAT mass was similar for chow-fed Cntl and ASKO (0.48 ± 0.10 vs. 0.55 ± 0.09 g, respectively; p = 0.6) (Figure 2C). HFHC diet-fed ASKO mice had larger EAT mass than their chow-fed counterparts (p = 0.02) despite having no difference in body weight; however, the difference in fat pad weight between chow and HFHC diet-fed ASKO mice (0.57 g) was much smaller than that for Cntl mice (1.51 g). These differences were unaltered when EAT weight was normalized to body weight (data not shown). Liver:body weight ratio was similar for all mice (data not shown). To measure body fat composition, the total amount of fat in EAT, subcutaneous (SAT), brown (BAT), and retrorenal depots was measured and normalized to body weight. HFHC diet-fed ASKO mice had a lower percentage of body weight as fat compared to Cntl mice (11.4 ± 0.9% vs. 8.8 ± 0.8%, p = 0.04) (Figure 2D). Snout-to-tail length, measured at necropsy, was similar for both genotypes, supporting no growth retardation in ASKO mice (Figure 2E). Together, these data show that ASKO mice are resistant to HFHC diet-induced weight gain.
Abca1 deletion results in smaller adipocytes
Adipocyte hypertrophy is believed to be the major mechanism for adipose tissue expansion during weight gain and hypertrophied adipocytes are associated with metabolic dysfunction 34. We determined whether adipocyte Abca1 deletion alters adipocyte size. Adipose tissue sections from ASKO and Cntl mice fed HFHC and chow diets were stained with hematoxylin and eosin and examined microscopically. ASKO EAT adipocytes from HFHC diet-fed mice appeared smaller than those from Cntl mice (Figure 2F), which was confirmed by quantitative size analysis (Figure 2G). SAT adipocytes from HFHC diet-fed ASKO mice were also significantly smaller than their Cntl counterparts (Supplemental Figure I A and B). EAT adipocyte size distribution was similar for chow-fed mice (Supplemental Figure I C and D).
Adipocyte-specific Abca1 deletion has minimal impact on metabolic phenotype
Since ASKO mice gained less weight on the HFHC diet compared with Cntl mice, we subjected both genotypes to metabolic phenotyping. Mice fed the HFHC diet for 16 weeks were placed in metabolic cages (CLAMS) for four days, two days for acclimation and two days for measurements. Although ASKO mice had significantly (p<0.05) increased oxygen consumption, carbon dioxide production, and heat production during the dark cycle when the data were normalized for body weight (data not shown), this was not the case when the data were expressed on a per mouse basis (Supplemental Figure II A–C), as suggested in recent literature 35, 36. Analysis of covariance of body weight vs. heat production 35 showed no significant genotype difference between ASKO and Cntl mice (data not shown). Physical activity (Supplemental Figure II D), respiratory exchange ratio (Supplemental Figure II E), and food intake (Supplemental Figure II F) were also similar between genotypes. Despite no difference in food intake, plasma leptin was significantly decreased in ASKO compared to Cntl mice (8.0 ± 3.6 vs. 20.9 ± 2.4 ng/ml, p = 0.01) (Supplemental Figure II G). Leptin mRNA abundance was also significantly decreased in EAT from ASKO mice compared to Cntl mice (fold change: 0.47 ± 0.20 vs. 1.03 ± 0.10, respectively; p< 0.03) (Supplemental Figure II H). EAT adiponectin mRNA abundance trended lower in ASKO mice compared to Cntl mice (p=0.086; data not shown).
ASKO mice have higher adipose tissue cholesterol content
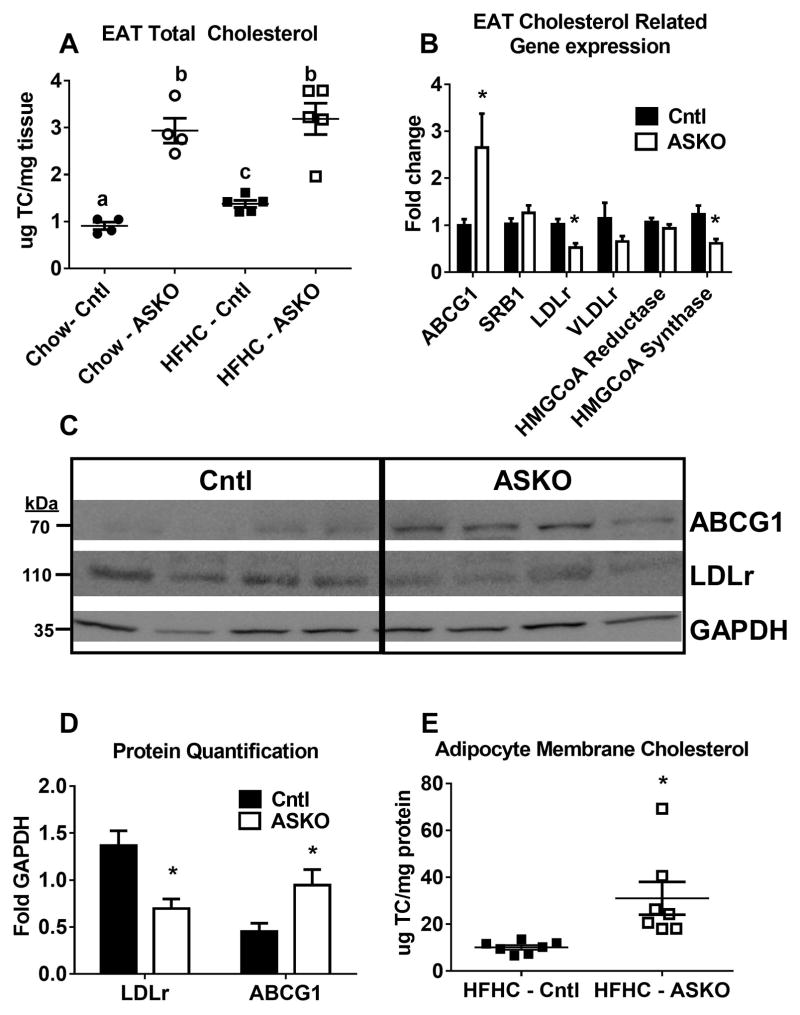
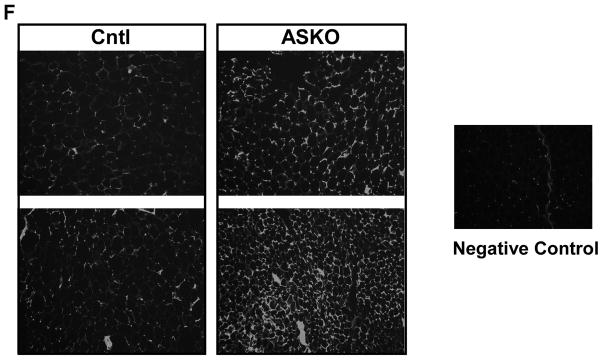
We next examined the impact of adipocyte Abca1 deletion on adipose tissue cholesterol content. EAT from ASKO mice had ~3-fold higher levels of cholesterol compared to Cntl mice, regardless of diet (Figure 3A). However, EAT stromal vascular cells from both genotypes had similar cholesterol content (7.2 ± 1.1 and 6.4 ± 1.1 μg/mg protein, respectively, n=4/genotype), demonstrating that adipocyte Abca1 deletion had minimal effect on stromal vascular cell cholesterol content. ABCG1 gene expression increased and cholesterol synthesis (HMGCoA synthase) and lipoprotein receptor gene (LDLr and VLDLr) expression decreased significantly in response to deletion of adipocyte Abca1, in ASKO vs. Cntl mice fed the HFHC diet (Figure 3B). Gene expression results were confirmed for ABCG1 and LDLr protein expression by Western blot analysis (Figure 3C,3D). Previously, we demonstrated that increased plasma membrane FC and lipid raft content resulted in agumented macrophage inflammatory signaling in macrophage-specific Abca1 knockout mice 28, 29. We isolated adipocyte plasma membranes and observed a two-fold increase in cholesterol content for ASKO vs. Cntl mice (Figure 3E). Lipid rafts were also visualized using fluorescent-labeled beta-cholera toxin on adipose tissue sections; ASKO adipose tissue demonstrated increased lipid raft staining (Figure 3F). These data demonstrate a remarkable increase in adipocyte cholesterol in the absence of Abca1 that cannot be overcome by the usual compensatory cellular responses to increased cellular cholesterol.
Figure 3.
A) Male Cntl and ASKO mice were fed chow for 24 weeks or a HFHC diet for 16 weeks starting at 8 weeks of age before EAT was harvested to measure total cholesterol content. B) Expression of genes involved in cholesterol metabolism in EAT from HFHC-fed mice diet for 16 weeks (n= 6 per group). C) Western blot of EAT ABCG1, LDLr and GAPDH from mice fed the HFHC diet diet for 16 weeks. D) Quantification of Western blot data in panel C. E) EAT plasma membrane cholesterol content from mice fed the HFHC diet for 16 weeks. F) Lipid raft staining of EAT from mice fed the HFHC diet for 16 weeks. Lipid rafts detected by fluorescent-labeled beta-cholera toxin, which binds to GM1 gangliosides. Negative control contained no fluorescent-labeled beta-cholera toxin. Different letters (panel A) denote statistical difference by ANOVA and Tukey’s multiple comparisons test. Asterisks (panels B, D, and E) denote statistical differences between genotypes by unpaired Student’s t-test, p<0.05.
ASKO mice have reduced adipose tissue TG
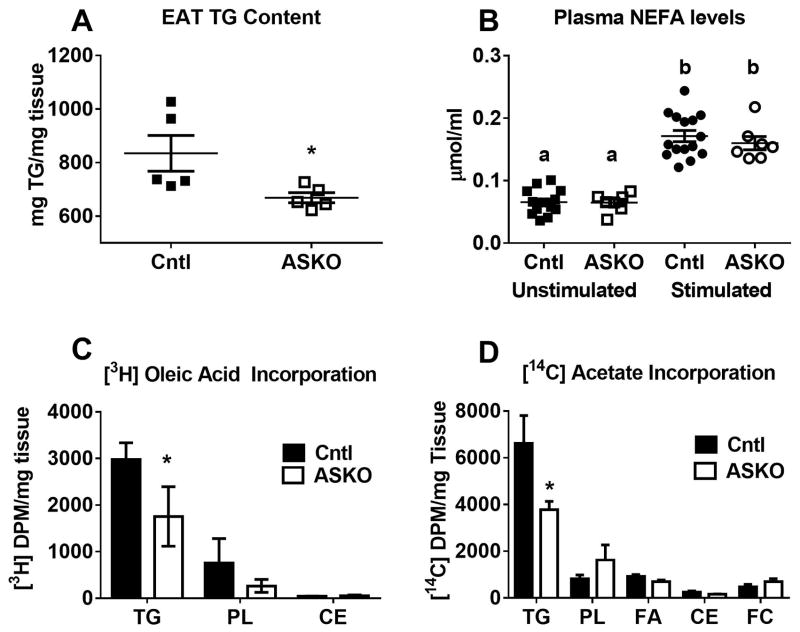
Previous studies have shown that the adipocyte cholesterol to TG ratio remains relatively constant regardless of adipocyte size 17. Given the smaller adipocyte phenotype along with increased adipose cholesterol in ASKO mice, we next examined whether adipose TG metabolism was affected. As anticipated, EAT from HFHC diet-fed ASKO mice contained less TG than EAT from Cntl mice (Figure 4A). There are several reasons why TG may be lower in ASKO adipocytes. We first explored whether ASKO adipocytes were more lipolytic compared to Cntl adipocytes. After 8 weeks of HFHC diet feeding, Cntl and ASKO mice were stimulated with a β3-specific adrenergic receptor agonist to induce lipolysis. There was no significant difference in plasma non-esterified free fatty acid levels before and after β3-agonist stimulation between ASKO and Cntl mice, indicating that deletion of adipocyte Abca1 does not alter in vivo lipolytic potential (Figure 4B). We next examined [3H]-oleic acid incorporation into EAT TG. Less [3H]-TG was found in ASKO than Cntl EAT, suggesting either decreased [3H]-oleic acid upake or diminished esterification into TG (Figure 4C). Finally, we examined de novo lipogenesis by incubating EAT with [14C]-acetic acid. ASKO EAT incorporated less [14C]-acetate into TG, suggesting decreased de novo lipogenesis (Figure 4D). Taken together, these results demonstrate that ASKO adipocytes are smaller and contain less TG due to decreased lipogenesis.
Figure 4.
A) EAT TG content of male Cntl and ASKO mice fed HFHC diet for 16 weeks starting at 8 weeks of age. B) Plasma NEFA concentrations before and after stimulation with a β-3 specific adrenergic agonist in male mice fed HFHC diet for 8 weeks starting at 8 weeks of age. C) Incorporation of [3H]-oleic acid into EAT explant lipid fractions (n=6 per group). D) Incorporation of [14C]-acetate into EAT explant lipid fractions (n=4 per group). Different letters (panel B) denote statistical difference by ANOVA and Tukey’s multiple comparisons test. Asterisks (panels A, C, and D) denote statistical difference between genotypes by Student’s t-test, p<0.05.
Adipocyte Abca1 deletion does not affect adipose tissue insulin sensitivity
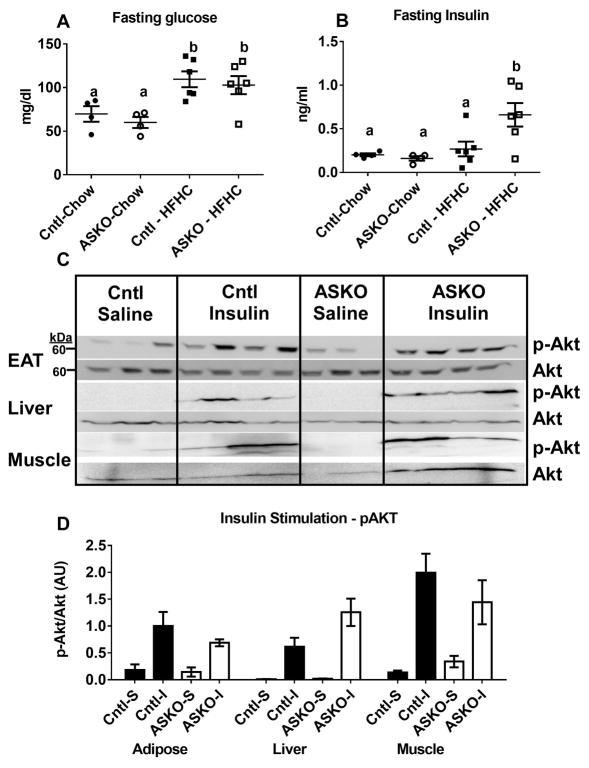
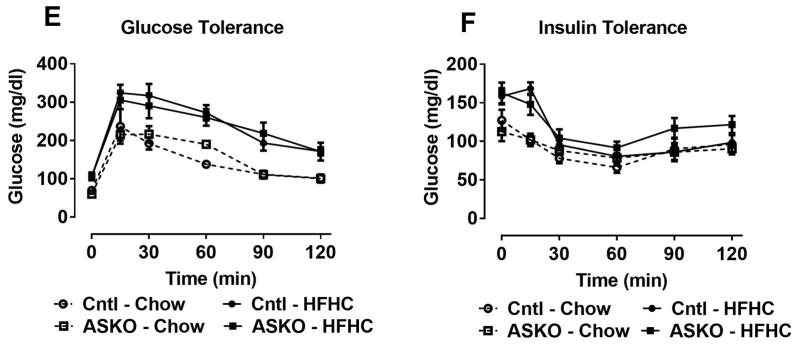
Since HFHC diet-fed ASKO mice had smaller adipocytes that contained less TG and synthesized less TG relative to Cntl adipocytes, we hypothesized that insulin signaling might also be attenuated in ASKO adipose tissue. Fasting blood glucose concentrations were similar in ASKO and Cntl mice, regardless of diet (Figure 5A). Plasma insulin concentrations were similar between genotypes in chow-fed mice, but significantly higher in HFHC diet-fed ASKO vs. Cntl mice (Figure 5B). Insulin signaling was examined in EAT, liver and skeletal muscle collected 5 minutes after portal vein insulin injection. Contrary to our hypothesis, insulin signaling, measured as Akt phosphorylation, was similar between genotypes in all three tissues (Figure 5C, 5D). To examine systemic glucose homeostasis, glucose and insulin tolerance tests were performed on mice fed chow until 24 weeks of age or the HFHC diet for 16 weeks, starting at 8 weeks of age. Although HFHC diet-fed mice were defective in plasma glucose disposal compared to chow-fed counterparts, glucose tolerance (Figure 5E) and insulin tolerance (Figure 5F) curves were indistinguishable between genotypes, suggesting that deletion adipocyte Abca1 did not affect systemic insulin resistance.
Figure 5.
Male Cntl and ASKO mice were fed chow for 24 weeks or a HFHC diet for 16 weeks starting at 8 weeks of age and then fasted for 12 hours before blood and plasma were collected for glucose (A) and insulin (B) measurements, respectively. C) Male mice fed a HFHC diet for 16 weeks were fasted overnight, anesthetized, and injected with insulin (1U/Kg) in the portal vein. Five minutes later, mice were euthanized and EAT, liver, and skeletal muscle were harvested for Western blot analysis of p-Akt and total Akt expression. D) Western blot quantification of p-Akt/total Akt from blots in C. E) Glucose tolerance tests were performed on mice fed the HFHC diet for 16 weeks after a 12 hour fast. F) Insulin tolerance tests were performed on mice fed the HFHC diet for 16 weeks after a 12 hour fast. Different letters (panel A, B) denote statistical difference by ANOVA and Tukey’s multiple comparisons test, p<0.05.
EAT lipid accretion pathways are down-regulated in ASKO mice
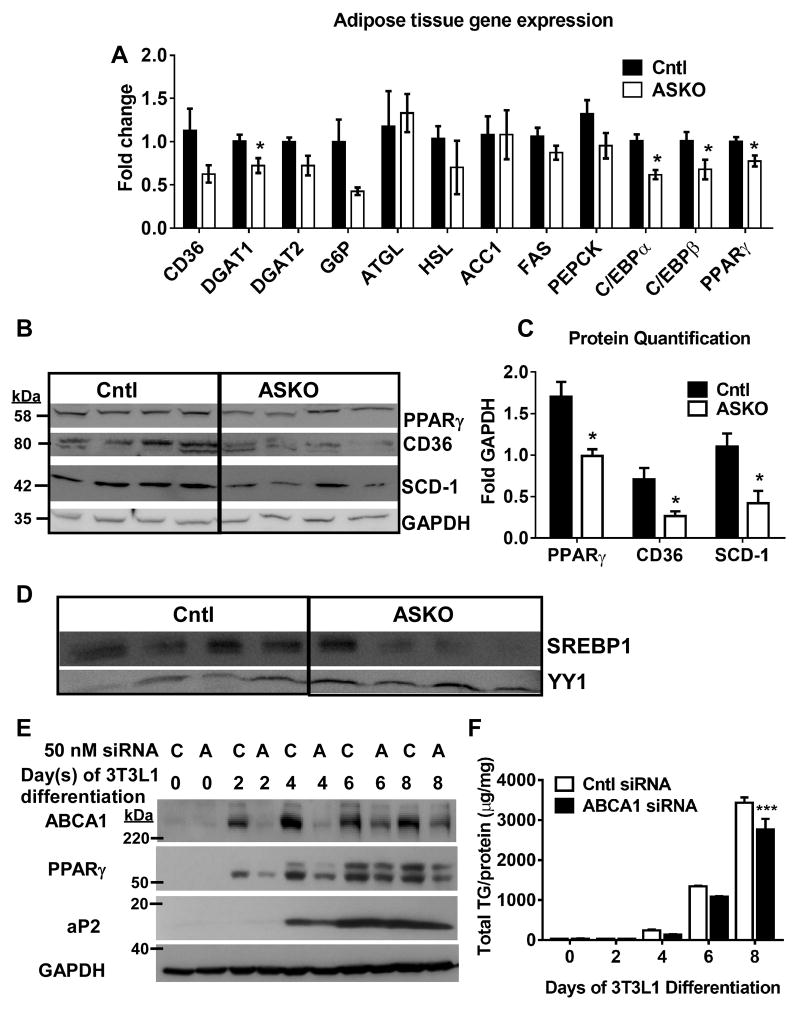
Since insulin signaling could not explain reduced adipocyte TG content and lipogenesis in ASKO mice, we further examined lipid accretion pathways. PPARγ and CCAAT/enhancer binding protein (C/EBP1)α and β gene expression were significantly decreased in EAT of HFHC-fed ASKO mice (Figure 6A). These genes are the major transcription factors that govern TG accumulation during adipocyte differentiation 37. Other genes involved in adipocyte TG synthesis, such as DGAT 1 and 2, or lipid uptake (i.e., CD36) were also decreased in ASKO EAT. These data were confirmed by Western blot analysis of PPARγ, Stearoyl-CoA Desaturase 1 (SCD-1), and CD36 (Figure 6B and C).
Figure 6.
Male Cntl and ASKO mice were fed a HFHC diet for 16 weeks, starting at 8 weeks of age, before harvesting EAT for gene and protein expression. A) EAT gene expression of lipogenic genes and transcription factors (n=6 per group). B) Western blot for PPARγ, CD36, SCD-1, and GAPDH in EAT tissue. C) Quantification of Western blot results in panel B; asterisk denotes statistical difference by upaired Student’s t-test, p<0.05. D) Western blot of SREBP1 and YY1 in nuclear fraction of EAT isolated adipocytes. E) and F) 3T3-L1 cells were transfected with scrambled control siRNA (C) or with Abca1 siRNA (A) for 6 h and then differentiated for 8 d. Abca1, PPARγ, aP2, and GAPDH expression was examined by Western blot and cellular triglyceride (TG) content was measured by enzymatic TG assay. Two-way ANOVA results showed significant differences for time (0.0001), siRNA treatment (0.03), and interaction (0.01); asterisks denote Bonferroni’s multiple comparisons test results; *** p<0.001.
SREBP1c is a major regulatory pathway responsible for the promotion of de novo lipogenesis and TG storage 38. Accordingly, we examined nuclear (i.e., activated) SREBP1c levels in adipocytes isolated from EAT of mice fed HFHC diet for 16 weeks; nuclear SREBP1 protein was decreased in ASKO vs. Cntl adipocytes (Figure 6D). To determine whether transient loss of adipocyte Abca1 protein expression impaired adipocyte differentiation by decreasing PPARγ expression, we silenced Abca1 in 3T3L1 cells during differentiation into adipocytes and examined PPARγ and aP2 protein expression. Abca1 protein expression was strikingly reduced in 3T3L1 adipocytes by day 2 of Abca1 siRNA treatment compared to control-treated cells (Figure 6E), and began to increase during days 6–8. Reduction of Abca1 protein was associated with decreasing expression of PPARγ and aP2, a target of PPARγ, (Figure 6E) and reduced adipocyte TG content (Figure 6F). Based on these results, we proposed that deletion of Abca1 resulted in decreased expression and activation of Pparγ, which in turn, leads to decreased lipid accretion and smaller adipocytes.
Deletion of Abca1 in BAT has minimal effect on BAT function
BAT weight did not differ between Cntl and ASKO animals (Supplemental Figure III A), although cholesterol content was elevated >2-fold in ASKO mice (Supplemental Figure III B). Expression of prototypical BAT genes was similar for both genotypes of mice (Supplemental Figure III C). However, ASKO mice were better able to maintain body temperature during acute cold exposure compared with Cntl mice (Supplemental Figure IIID), suggesting a modest increase in thermogenesis in ASKO mice.
Deletion of Abca1 in adipose tissue does not increase adipose tissue inflammation
In previous studies, increased adipose tissue cholesterol content driven by dietary cholesterol intake was associated with increased adipose tissue inflammation 19, 39. Despite a 3-fold increase in EAT cholesterol (Figure 3A), pro-inflammatory and ER stress-related gene expression did not increase in EAT of ASKO relative to Cntl mice, although inflammatory gene expression did increase in mice fed the HFHC diet versus the chow diet (Supplemental Figure IV A). CD68 immunofluorescence was similar for ASKO and Cntl adipose tissue (Supplemental Figure IV B), in agreement with the gene expression data. Previous studies have shown a direct correlation between dietary cholesterol, adipose tissue cholesterol, and inflammation 39, 40; however, this is not the case in our ASKO model, likely due to selective increases in cholesterol in adipocytes, but not stromal vascular cells.
Discussion
This study was designed to elucidate the role of adipocyte Abca1 expression on adipocyte lipid homeostasis. Previous studies have shown that Abca1 is abundantly expressed in adipose tissue 22; however, its role in adipocyte lipid homeostasis and function in vivo is poorly understood. Previous studies using aP2 Cre recombinase mediated-deletion of Abca1 flox/flox alleles were complicated by concomitant and variable Abca1 gene deletion in macrophages in addition to adipocytes 22, 23. In the present study, we generated a mouse model with adipocyte-specific deletion of the Abca1 gene using adiponectin Cre recombinase-mediated deletion, allowing us to more clearly detect the effects of Abca1 expression in adipocytes.
ASKO mice had significantly lower total plasma and HDL cholesterol concentrations compared to Cntl mice (Figures 1C, 1D). This agrees with our previous findings 22 that adipose Abca1 contributes minimally (<15%) to total plasma cholesterol levels in vivo, which are primarily determined by Abca1 expression in the liver 41 and small intestine 42.
Despite marginal impact on plasma cholesterol concentrations, adipocyte Abca1 deletion resulted in significantly higher levels of adipose tissue cholesterol content. We observed a 3-fold increase in total cholesterol in both WAT and BAT (Figure 3A and Supplemental Figure IIIB), despite the fact that ABCG1 was upregulated and cholesterol synthesis and uptake genes were downregulated in ASKO adipose tissue (Figure 3B). These results strongly suggest that Abca1 is the major cholesterol efflux system in adipocytes – and that in its absence, other pathways of cellular cholesterol homeostasis cannot compensate. These results are in contrast to those of early in vitro experiments, which reported that Abca1 only effluxes cholesterol under conditions of prolonged lipolysis 43. On the other hand, our findings agree with those in other in vivo models that examined adipose Abca1 expression in vivo 22, 23.
Adipocyte cholesterol balance may play a significant role in determining adipocyte size and TG content, particularly during progression of obesity 21, 44, 45. For example, adipocyte cholesterol accumulation is associated with TG accretion during adipocyte hypertrophy 15. However, in our study, ASKO mice had a 3-fold increase in adipose tissue cholesterol, but reduced adipose tissue TG content and adipocyte size (Figure 2G and 4A). The reason for the difference in outcomes between our study and previous ones may be attributed to the high levels of plasma membrane cholesterol in ASKO adipocytes (Figure 3E). Adipocyte cholesterol moves from the plasma membrane to the lipid droplet during hypertrophy, leading to enlarged adipocytes and relative depletion of plasma membrane cholesterol 21. Adipocytes appear to sense cholesterol redistribution from the plasma membrane to lipid droplets as a form of cellular cholesterol depletion 21, 43, 44, 46. Supporting this notion, hypertrophied adipocytes activate SREBP2 and upregulate cholesterol synthesis genes, despite higher levels of cellular cholesterol 21. In the absence of adipocyte Abca1, cholesterol redistribution from the plasma membrane to lipid droplets may be compromised.
To determine why ASKO mice had lower fat pad weight and smaller adipocytes, we examined adipose tissue TG metabolism. We determined that β3 adrenergic-stimulated TG lipolysis in vivo was similar between genotypes (Figure 4B). In contrast, ASKO EAT was less able to incorporate radiolabeled oleic acid and acetate into TG (Figure 4C and D) and expression of major lipogenic genes and transcription factors (i.e., PPARγ, C/EBPs, SREBP1c) were downregulated in the adipose tissues of ASKO mice compared to their Cntl counterparts (Figure 6A and B). The most likely explanation for our findings is that accumulation of cholesterol without adipocyte Abca1 expression inhibited SREBP1c processing by increasing endoplasmic reticulum cholesterol content 47, diminishing de novo lipogenesis and PPARγ expression, which is a direct transcriptional target of SREBP1c 48. Reduced lipogenesis and fatty acid uptake would decrease potential ligands for PPARγ activation as well as substrate for TG synthesis 49.
Interestingly, despite a 3-fold increase in EAT cholesterol content in ASKO mice, we observed only minor effects on adipose tissue inflammation (Supplemental Figure IVA and B). Previous work has shown that addition of dietary cholesterol alone can lead to adipose inflammation 19, 39. Several studies, including our own, have demonstrated that dietary cholesterol leads to increased adipose tissue cholesterol content, macrophage infiltration, and inflammation 39, 40, 50. These studies show ~ 50% increase in adipose cholesterol content as a result of increased dietary cholesterol intake. In contrast, ASKO mice had a ~300% increase in EAT cholesterol, suggesting that adipocyte cholesterol content alone does not determine adipose tissue inflammation and that macrophages, not adipocytes, are primarily responsible for dietary cholesterol-induced inflammation. The absence of increased EAT inflammation in HFHC diet-fed ASKO vs. Cntl mice may also explain why systemic insulin resistance was similar between genotypes.
Macrophage infiltration into adipose tissue is likely the main contributor to adipose tissue inflammation that accompanies weight gain and obesity 19, 51–55. We also showed that a small increase in macrophage membrane FC and lipid raft content induced by macrophage-specific Abca1 deletion results in an exaggerated proinflammatory response to Toll-like 4 receptor (TLR4) agonists (i.e. lipopolysaccharide, LPS) 29, supporting the idea that increased adipose tissue macrophage cholesterol may result in increased adipose tissue inflammation. However, increased macrophage inflammation per se does not result in the systemic insulin resistance that accompanies obesity 56, suggesting that adipose tissue macrophage inflammation and adipocyte dysfunction are both necessary to display the full metabolic phenotype in obese states.
ASKO mice consuming a HFHC diet had significantly less weight gain compared to Cntl mice. One explanation for this outcome may be related to higher energy expenditure by ASKO mice during the dark cycle, (Supplemental Figure II). However, when energy expenditure data were not normalized to body weight, there was no difference between genotypes. Although the appropriate way to report metabolic data has been debated 36, most studies normalize energy expenditure to body weight as we did. Different energy expenditures could not be explained by differences in BAT mass or UCP1 expression. We also found no consistent evidence for beiging or browning of WAT (subcutaneous and visceral) based on UCP1 gene and protein expression (data not shown). However, in an acute cold tolerance experiment, ASKO mice had a slight, but significant, elevation of body temperature compared with Cntl mice, in agreement with the increased energy expenditure data.
We also observed similar food intake and activity between Cntl and ASKO mice. However, a small decrease in food intake in ASKO mice may not have been detected over the relatively short food intake experiments. For example, an 8 g difference in body weight between Cntl and ASKO mice over a 16 week feeding period is an average body weight gain of 0.071 g/day (8g/112 days); detecting a difference in food consumption needed to produce this small change in body weight over a two day (CLAMS experiment) or one week (manual food intake experiment) observational period may be very difficult (Supplemental Figure II F). More detailed studies will be necessary to understand the mechanisms for lower body weights in HFHC diet-fed ASKO mice.
The results of our study may have clinical implications. During development of obesity, as adipocyte size and TG content increases, adipocyte cholesterol also increases, reaching 50% of the total body cholesterol pool in extreme cases of obesity 15. Cellular cholesterol accumulation normally would increase expression of ABCA1 and other cholesterol export proteins through activation of the transcription factor liver X receptor (LXR). We have shown increased visceral fat expression of ABCA1 and apolipoprotein E, two LXR target genes, in non-human primates fed increased dietary cholesterol, which may provide protection from adipocyte cholesterol overload 39. Obesity is also accompanied by increased adipose tissue and systemic inflammation and we and others have shown that inflammatory stimuli downregulate ABCA1 expression 30, 57. Based on results from the present study, this may afford adipocytes a protective mechanism to avoid excessive TG accumulation, which may lead to adipocyte dead, by downregulating TG synthesis as adipocyte FC accumulates.
In summary, the results from our mouse model provide additional mechanistic insights into cholesterol metabolism in adipose tissue. Surprisingly, deletion of Abca1 in adipocytes was mostly beneficial, resulting in lower weight gain, reduced body fat, and increased energy expenditure, with no alteration in systemic glucose and insulin sensitivity or adipose tissue inflammation. We posit that most of these results are due to the high level of membrane cholesterol in ASKO adipocytes. By preventing cholesterol efflux through Abca1, we artificially raised membrane cholesterol levels and prevented the adipocyte hypertrophy normally observed in HFHC diet-fed mice. Our results demonstrate an important role for adipocyte Abca1 in the regulation of adipocyte function.
Supplementary Material
Highlights.
Adipocyte-specific deletion of the cellular cholesterol exporter Abca1 prevents body weight gain induced by high fat, high cholesterol diet feeding without affecting glucose or insulin sensitivity.
Mouse adipocytes lacking Abca1 had a 3-fold increase in cholesterol content, but were smaller in size and contained less triglyceride due to defective triglyceride synthesis, which likely occurred due to decreased activation of transcription factors SREBP1c and PPARγ.
This study provides compelling evidence that Abca1 is a major regulator of adipocyte cholesterol content and triglyceride storage.
Acknowledgments
Anti-SREBP1 antibody were generously supplied by Dr. Timothy Osborne (Sanford Burnham Prebys Medical Discovery Institute, Orlando, FL) and the adiponectin Cre recombinase mice were a generous gift of Dr. Evan Rosen, Harvard Medical School, Cambridge, MA. We also acknowledge the editorial assistance of Karen Klein, MA, in the Wake Forest Clinical and Translational Science Institute (UL1 TR001420; PI: McClain).
Sources of Funding: This work was supported by an NIH grant R01 HL119962 (JSP) and a student fellowship (HC) from the Center for Molecular Signaling at Wake Forest University.
Abbreviations
- TG
Triglyceride
- Abca1
ATP Binding Cassette Transporter A1
- ASKO
Adipose-specific Abca1 knockout
- HT
Heterozygous adipocyte-specific Abca1 knockout
- C/EBP
CCAAT/enhancer binding protein
- HFHC
High Fat High Cholesterol
- HDL
High Density Lipoprotein
- EAT
Epididymal Adipose Tissue
- BAT
Brown Adipose Tissue
- SAT
Subcutaneous Adipose Tisue
- WAT
White Adipose Tissue
- SREBP1/2
Sterol Regulatory Element Binding Protein 1/2
- PPARγ
Peroxisome Proliferator-activated Receptor γ
Footnotes
Disclosures: None.
References
- 1.Flegal KMCM, Ogden CL, Curtin LR. Prevalence and trends in obesity among US adults, 1999–2008. JAMA. 2010;303:235–241. doi: 10.1001/jama.2009.2014. [DOI] [PubMed] [Google Scholar]
- 2.Haslam DW, James WP. Obesity. Lancet. 2005;366:1197–1209. doi: 10.1016/S0140-6736(05)67483-1. [DOI] [PubMed] [Google Scholar]
- 3.Bays HE, Toth PP, Kris-Etherton PM, Abate N, Aronne LJ, Brown WV, Gonzalez-Campoy JM, Jones SR, Kumar R, La Forge R, Samuel VT. Obesity, adiposity, and dyslipidemia: a consensus statement from the National Lipid Association. J Clin Lipidol. 2013;7:304–383. doi: 10.1016/j.jacl.2013.04.001. [DOI] [PubMed] [Google Scholar]
- 4.Salans LB, Knittle JL, Hirsch J. The role of adipose cell size and adipose tissue insulin sensitivity in the carbohydrate intolerance of human obesity. The Journal of Clinical Investigation. 1968;47:153–165. doi: 10.1172/JCI105705. [DOI] [PMC free article] [PubMed] [Google Scholar]
- 5.Smith U. Effect of cell size on lipid synthesis by human adipose tissue in vitro. J Lipid Res. 1971;12:65–70. [PubMed] [Google Scholar]
- 6.Gregor MF, Hotamisligil GS. Inflammatory mechanisms in obesity. Annu Rev Immunol. 2011;29:415–445. doi: 10.1146/annurev-immunol-031210-101322. [DOI] [PubMed] [Google Scholar]
- 7.Sun K, Kusminski CM, Scherer PE. Adipose tissue remodeling and obesity. J Clin Invest. 2011;121:2094–2101. doi: 10.1172/JCI45887. [DOI] [PMC free article] [PubMed] [Google Scholar]
- 8.Mlinar B, Marc J. New insights into adipose tissue dysfunction in insulin resistance. Clin Chem Lab Med. 2011;49:1925–1935. doi: 10.1515/CCLM.2011.697. [DOI] [PubMed] [Google Scholar]
- 9.Xu H, Barnes GT, Yang Q, Tan G, Yang D, Chou CJ, Sole J, Nichols A, Ross JS, Tartaglia LA, Chen H. Chronic inflammation in fat plays a crucial role in the development of obesity-related insulin resistance. The Journal of Clinical Investigation. 2003;112:1821–1830. doi: 10.1172/JCI19451. [DOI] [PMC free article] [PubMed] [Google Scholar]
- 10.Winkler G, Kiss S, Keszthelyi L, et al. Expression of tumor necrosis factor (TNF)-alpha protein in the subcutaneous and visceral adipose tissue in correlation with adipocyte cell volume, serum TNF-alpha, soluble serum TNF-receptor-2 concentrations and C-peptide level. European Journal of Endocrinology. 2003;149:129–135. doi: 10.1530/eje.0.1490129. [DOI] [PubMed] [Google Scholar]
- 11.Skurk T, Alberti-Huber C, Herder C, Hauner H. Relationship between Adipocyte Size and Adipokine Expression and Secretion. J Clin Endocrinol Metab. 2007;92:1023–1033. doi: 10.1210/jc.2006-1055. [DOI] [PubMed] [Google Scholar]
- 12.O’Connell J, Lynch L, Cawood TJ, Kwasnik A, Nolan N, Geoghegan J, McCormick A, O’Farrelly C, O’Shea D. The Relationship of Omental and Subcutaneous Adipocyte Size to Metabolic Disease in Severe Obesity. PLoS One. 2010;5:e9997. doi: 10.1371/journal.pone.0009997. [DOI] [PMC free article] [PubMed] [Google Scholar]
- 13.Badoud F, Perreault M, Zulyniak MA, Mutch DM. Molecular insights into the role of white adipose tissue in metabolically unhealthy normal weight and metabolically healthy obese individuals. FASEB J. 2015;29:748–758. doi: 10.1096/fj.14-263913. [DOI] [PubMed] [Google Scholar]
- 14.Karelis AD, St-Pierre DH, Conus F, Rabasa-Lhoret R, Poehlman ET. Metabolic and body composition factors in subgroups of obesity: what do we know? J Clin Endocrinol Metab. 2004;89:2569–2575. doi: 10.1210/jc.2004-0165. [DOI] [PubMed] [Google Scholar]
- 15.Krause BR, Hartman AD. Adipose tissue and cholesterol metabolism. J Lipid Res. 1984;25:97–110. [PubMed] [Google Scholar]
- 16.Schreibman RH, Dell RB. Human adipocyte Cholesterol. Concentration, localization, synthesis, and turnover. Journal of Clinical Investigation. 1975;55:986–993. doi: 10.1172/JCI108028. [DOI] [PMC free article] [PubMed] [Google Scholar]
- 17.Kovanen PT, Nikkilä EA, Miettinen TA. Regulation of cholesterol synthesis and storage in fat cells. J Lipid Res. 1975;16:211–223. [PubMed] [Google Scholar]
- 18.Tilvis RS, Kovanen PT, Miettinen TA. Release of newly synthesized squalene, methyl sterols and cholesterol from human adipocytes in the presence of lipoproteins. Scandinavian Journal of Clinical & Laboratory Investigation. 1978;38:83–87. doi: 10.3109/00365517809108407. [DOI] [PubMed] [Google Scholar]
- 19.Subramanian S, Han CY, Chiba T, McMillen TS, Wang SA, Haw A, Kirk EA, O’Brien KD, Chait A. Dietary Cholesterol Worsens Adipose Tissue Macrophage Accumulation and Atherosclerosis in Obese LDL Receptor–Deficient Mice. Arterioscler Thromb Vasc Biol. 2008;28:685–691. doi: 10.1161/ATVBAHA.107.157685. [DOI] [PMC free article] [PubMed] [Google Scholar]
- 20.Umemoto T, Han CY, Mitra P, Averill MM, Tang C, Goodspeed L, Omer M, Subramanian S, Wang S, Den Hartigh LJ, Wei H, Kim EJ, Kim J, O’Brien KD, Chait A. Apolipoprotein A-I and HDL Have Anti-Inflammatory Effects on Adipocytes via Cholesterol Transporters: ATP-Binding Cassette (ABC) A-1, ABCG-1 and Scavenger Receptor B-1(SRB-1) Circulation Research. 2013;112:1345–1354. doi: 10.1161/CIRCRESAHA.111.300581. [DOI] [PMC free article] [PubMed] [Google Scholar]
- 21.Le Lay S, Krief S, Farnier C, Lefrère I, Le Liepvre X, Bazin R, Ferré P, Dugail I. Cholesterol, a Cell Size-dependent Signal That Regulates Glucose Metabolism and Gene Expression in Adipocytes. Journal of Biological Chemistry. 2001;276:16904–16910. doi: 10.1074/jbc.M010955200. [DOI] [PubMed] [Google Scholar]
- 22.Chung S, Sawyer JK, Gebre AK, Maeda N, Parks JS. Adipose tissue ATP binding cassette transporter A1 contributes to high-density lipoprotein biogenesis in vivo. Circulation. 2011;124:1663–1672. doi: 10.1161/CIRCULATIONAHA.111.025445. [DOI] [PMC free article] [PubMed] [Google Scholar]
- 23.de Haan W, Bhattacharjee A, Ruddle P, Kang MH, Hayden MR. ABCA1 in adipocytes regulates adipose tissue lipid content, glucose tolerance, and insulin sensitivity. J Lipid Res. 2014;55:516–523. doi: 10.1194/jlr.M045294. [DOI] [PMC free article] [PubMed] [Google Scholar]
- 24.Zhu X, Parks JS. New roles of HDL in inflammation and hematopoiesis. Annu Rev Nutr. 2012;32:161–182. doi: 10.1146/annurev-nutr-071811-150709. [DOI] [PMC free article] [PubMed] [Google Scholar]
- 25.Wellington CL, Walker EK, Suarez A, Kwok A, Bissada N, Singaraja R, Yang YZ, Zhang LH, James E, Wilson JE, Francone O, McManus BM, Hayden MR. ABCA1 mRNA and protein distribution patterns predict multiple different roles and levels of regulation. Lab Invest. 2002;82:273–283. doi: 10.1038/labinvest.3780421. [DOI] [PubMed] [Google Scholar]
- 26.Zhang Y, McGillicuddy FC, Hinkle CC, O’Neill S, Glick JM, Rothblat GH, Reilly MP. Adipocyte modulation of high-density lipoprotein cholesterol. Circulation. 2010;121:1347–1355. doi: 10.1161/CIRCULATIONAHA.109.897330. [DOI] [PMC free article] [PubMed] [Google Scholar]
- 27.Lee KY, Russell SJ, Ussar S, Boucher J, Vernochet C, Mori MA, Smyth G, Rourk M, Cederquist C, Rosen ED, Kahn BB, Kahn CR. Lessons on Conditional Gene Targeting in Mouse Adipose Tissue. Diabetes. 2013;62:864–874. doi: 10.2337/db12-1089. [DOI] [PMC free article] [PubMed] [Google Scholar]
- 28.Zhu X, Lee JY, Timmins JM, Brown JM, Boudyguina E, Mulya A, Gebre AK, Willingham MC, Hiltbold EM, Mishra N, Maeda N, Parks JS. Increased cellular free cholesterol in macrophage-specific Abca1 knock-out mice enhances pro-inflammatory response of macrophages. J Biol Chem. 2008;283:22930–22941. doi: 10.1074/jbc.M801408200. [DOI] [PMC free article] [PubMed] [Google Scholar]
- 29.Zhu X, Owen JS, Wilson MD, Li H, Griffiths GL, Thomas MJ, Hiltbold EM, Fessler MB, Parks JS. Macrophage ABCA1 reduces MyD88-dependent Toll-like receptor trafficking to lipid rafts by reduction of lipid raft cholesterol. J Lipid Res. 2010;51:3196–3206. doi: 10.1194/jlr.M006486. [DOI] [PMC free article] [PubMed] [Google Scholar]
- 30.Zhu X, Westcott MM, Bi X, Liu M, Gowdy KM, Seo J, Cao Q, Gebre AK, Fessler MB, Hiltbold EM, Parks JS. Myeloid cell-specific ABCA1 deletion protects mice from bacterial infection. Circ Res. 2012;111:1398–1409. doi: 10.1161/CIRCRESAHA.112.269043. [DOI] [PMC free article] [PubMed] [Google Scholar]
- 31.Weisberg SP, McCann D, Desai M, Rosenbaum M, Leibel RL, Ferrante AW. Obesity is associated with macrophage accumulation in adipose tissue. The Journal of Clinical Investigation. 2003;112:1796–1808. doi: 10.1172/JCI19246. [DOI] [PMC free article] [PubMed] [Google Scholar]
- 32.Wang ZV, Deng Y, Wang QA, Sun K, Scherer PE. Identification and Characterization of a Promoter Cassette Conferring Adipocyte-Specific Gene Expression. Endocrinology. 2010;151:2933–2939. doi: 10.1210/en.2010-0136. [DOI] [PMC free article] [PubMed] [Google Scholar]
- 33.Eguchi J, Wang X, Yu S, Kershaw EE, Chiu PC, Dushay J, Estall JL, Klein U, Maratos-Flier E, Rosen ED. Transcriptional control of adipose lipid handling by IRF4. Cell metabolism. 2011;13:249–259. doi: 10.1016/j.cmet.2011.02.005. [DOI] [PMC free article] [PubMed] [Google Scholar]
- 34.Choe SS, Huh JY, Hwang IJ, Kim JI, Kim JB. Adipose Tissue Remodeling: Its Role in Energy Metabolism and Metabolic Disorders. Front Endocrinol (Lausanne) 2016;7:30. doi: 10.3389/fendo.2016.00030. [DOI] [PMC free article] [PubMed] [Google Scholar]
- 35.Tschop MH, Speakman JR, Arch JR, et al. A guide to analysis of mouse energy metabolism. Nature methods. 2012;9:57–63. doi: 10.1038/nmeth.1806. [DOI] [PMC free article] [PubMed] [Google Scholar]
- 36.Butler AA, Kozak LP. A Recurring Problem With the Analysis of Energy Expenditure in Genetic Models Expressing Lean and Obese Phenotypes. Diabetes. 2010;59:323–329. doi: 10.2337/db09-1471. [DOI] [PMC free article] [PubMed] [Google Scholar]
- 37.Tontonoz P, Hu E, Spiegelman BM. Stimulation of adipogenesis in fibroblasts by PPAR gamma 2, a lipid-activated transcription factor. Cell. 1994;79:1147–1156. doi: 10.1016/0092-8674(94)90006-x. [DOI] [PubMed] [Google Scholar]
- 38.Horton JD, Bashmakov Y, Shimomura I, Shimano H. Regulation of sterol regulatory element binding proteins in livers of fasted and refed mice. Proc Natl Acad Sci U S A. 1998;95:5987–5992. doi: 10.1073/pnas.95.11.5987. [DOI] [PMC free article] [PubMed] [Google Scholar]
- 39.Chung S, Cuffe H, Marshall SM, McDaniel AL, Ha JH, Kavanagh K, Hong C, Tontonoz P, Temel RE, Parks JS. Dietary cholesterol promotes adipocyte hypertrophy and adipose tissue inflammation in visceral, but not in subcutaneous, fat in monkeys. Arterioscler Thromb Vasc Biol. 2014;34:1880–1887. doi: 10.1161/ATVBAHA.114.303896. [DOI] [PMC free article] [PubMed] [Google Scholar]
- 40.Subramanian S, Chait A. The effect of dietary cholesterol on macrophage accumulation in adipose tissue: implications for systemic inflammation and atherosclerosis. Current Opinion in Lipidology. 2009;20:39–44. doi: 10.1097/mol.0b013e32831bef8b. [DOI] [PubMed] [Google Scholar]
- 41.Timmins JM, Lee J-Y, Boudyguina E, Kluckman KD, Brunham LR, Mulya A, Gebre AK, Coutinho JM, Colvin PL, Smith TL, Hayden MR, Maeda N, Parks JS. Targeted inactivation of hepatic Abca1 causes profound hypoalphalipoproteinemia and kidney hypercatabolism of apoA-I. The Journal of Clinical Investigation. 2005;115:1333–1342. doi: 10.1172/JCI23915. [DOI] [PMC free article] [PubMed] [Google Scholar]
- 42.Brunham LR, Kruit JK, Iqbal J, Fievet C, Timmins JM, Pape TD, Coburn BA, Bissada N, Staels B, Groen AK, Hussain MM, Parks JS, Kuipers F, Hayden MR. Intestinal ABCA1 directly contributes to HDL biogenesis in vivo. The Journal of Clinical Investigation. 2006;116:1052–1062. doi: 10.1172/JCI27352. [DOI] [PMC free article] [PubMed] [Google Scholar]
- 43.Le Lay S, Robichon C, Le Liepvre X, Dagher G, Ferre P, Dugail I. Regulation of ABCA1 expression and cholesterol efflux during adipose differentiation of 3T3-L1 cells. J Lipid Res. 2003;44:1499–1507. doi: 10.1194/jlr.M200466-JLR200. [DOI] [PubMed] [Google Scholar]
- 44.Yu BL, Zhao SP, Hu JR. Cholesterol imbalance in adipocytes: a possible mechanism of adipocytes dysfunction in obesity. Obes Rev. 2010;11:560–567. doi: 10.1111/j.1467-789X.2009.00699.x. [DOI] [PubMed] [Google Scholar]
- 45.Turner SM, Roy S, Sul HS, Neese RA, Murphy EJ, Samandi W, Roohk DJ, Hellerstein MK. Dissociation between adipose tissue fluxes and lipogenic gene expression in ob/ob mice. American Journal of Physiology - Endocrinology And Metabolism. 2007;292:E1101–E1109. doi: 10.1152/ajpendo.00309.2005. [DOI] [PMC free article] [PubMed] [Google Scholar]
- 46.Wang S, Peng D. Regulation of adipocyte autophagy — The potential anti-obesity mechanism of high density lipoprotein and ApolipoproteinA-I. Lipids in Health and Disease. 2012;11:131–131. doi: 10.1186/1476-511X-11-131. [DOI] [PMC free article] [PubMed] [Google Scholar]
- 47.Radhakrishnan A, Goldstein JL, McDonald JG, Brown MS. Switch-like Control of SREBP-2 Transport Triggered by Small Changes in ER Cholesterol: A Delicate Balance. Cell Metab. 2008;8:512–521. doi: 10.1016/j.cmet.2008.10.008. [DOI] [PMC free article] [PubMed] [Google Scholar]
- 48.Fajas L, Schoonjans K, Gelman L, Kim JB, Najib J, Martin G, Fruchart JC, Briggs M, Spiegelman BM, Auwerx J. Regulation of peroxisome proliferator-activated receptor gamma expression by adipocyte differentiation and determination factor 1/sterol regulatory element binding protein 1: implications for adipocyte differentiation and metabolism. Mol Cell Biol. 1999;19:5495–5503. doi: 10.1128/mcb.19.8.5495. [DOI] [PMC free article] [PubMed] [Google Scholar]
- 49.Kim JB, Wright HM, Wright M, Spiegelman BM. ADD1/SREBP1 activates PPARgamma through the production of endogenous ligand. Proc Natl Acad Sci U S A. 1998;95:4333–4337. doi: 10.1073/pnas.95.8.4333. [DOI] [PMC free article] [PubMed] [Google Scholar]
- 50.Aguilar D, Fernandez ML. Hypercholesterolemia induces adipose dysfunction in conditions of obesity and nonobesity. Adv Nutr. 2014;5:497–502. doi: 10.3945/an.114.005934. [DOI] [PMC free article] [PubMed] [Google Scholar]
- 51.Gregor MF, Hotamisligil GS. Inflammatory Mechanisms in Obesity. Annual Review of Immunology. 2011;29:415–445. doi: 10.1146/annurev-immunol-031210-101322. [DOI] [PubMed] [Google Scholar]
- 52.Hotamisligil GS. Inflammation and metabolic disorders. Nature. 2006;444:860–867. doi: 10.1038/nature05485. [DOI] [PubMed] [Google Scholar]
- 53.Ouchi N, Parker JL, Lugus JJ, Walsh K. Adipokines in inflammation and metabolic disease. Nat Rev Immunol. 2011;11:85–97. doi: 10.1038/nri2921. [DOI] [PMC free article] [PubMed] [Google Scholar]
- 54.Shoelson SE, Herrero L, Naaz A. Obesity, Inflammation, and Insulin Resistance. Gastroenterology. 2007;132:2169–2180. doi: 10.1053/j.gastro.2007.03.059. [DOI] [PubMed] [Google Scholar]
- 55.Odegaard JI, Chawla A. Pleiotropic actions of insulin resistance and inflammation in metabolic homeostasis. Science. 2013;339:172–177. doi: 10.1126/science.1230721. [DOI] [PMC free article] [PubMed] [Google Scholar]
- 56.Zhu X, Chung S, Bi X, Chuang CC, Brown AL, Liu M, Seo J, Cuffe H, Gebre AK, Boudyguina E, Parks JS. Myeloid cell-specific ABCA1 deletion does not worsen insulin resistance in HF diet-induced or genetically obese mouse models. J Lipid Res. 2013;54:2708–2717. doi: 10.1194/jlr.M038943. [DOI] [PMC free article] [PubMed] [Google Scholar]
- 57.Yin K, Liao DF, Tang CK. ATP-binding membrane cassette transporter A1 (ABCA1): a possible link between inflammation and reverse cholesterol transport. Mol Med. 2010;16:438–449. doi: 10.2119/molmed.2010.00004. [DOI] [PMC free article] [PubMed] [Google Scholar]
Associated Data
This section collects any data citations, data availability statements, or supplementary materials included in this article.


