

Abstract
Back pain is a leading cause of global disability that can arise from vertebral fracture and osteoporosis. Although poor general health and obesity are among the strongest risk factors for back pain, there is remarkably little known about how diet influences spinal diseases. Advanced glycation end-products (AGEs) are implicated in increased fracture risk, yet no studies investigated how dietary AGEs affect spinal health. We tested the hypothesis that high dietary AGE ingestion will diminish vertebral structure and function in a sex- and age-dependent manner. Female and male mice were fed low-AGE (L-AGE) or high-AGE (H-AGE) isocaloric diets for 6 and 18 months and multiple measurements of bone structure and function were taken. AGE levels in serum and cortical vertebrae were increased only for 6-month-old H-AGE female mice while blood glucose and body weight remained normal for all animals. When fed an H-AGE diet, 6-month-old female mice had inferior vertebral trabecular structure with decreased bone mineral density (BMD) and bone volume fraction. Biomechanical testing and analytical modeling further showed functional deterioration in 6-month-old H-AGE females with reduced shear and compression moduli, and maximum load to failure. At 18 months, H-AGE mice of both sexes had significant but small decreases in cortical BMD and thickness, yet functional biomechanical behaviors were not distinguishable from other aging changes. We conclude that an H-AGE diet, without diabetic or overweight conditions, diminished vertebral microstructure, mechanical behaviors, and fracture resistance in young female mice in a manner suggesting accelerated bone aging.
Keywords: Spine, Vertebral Fracture, Advanced Glycation End Products, Nutrition, Animal Model, Aging, Bone Qct/μCt, Biomechanics, Fracture Risk Assessment
Introduction
Back pain is the most common physical condition for doctor visits and the leading cause of global disability,(1) affecting approximately 20% of the population at any time(2) and resulting in substantial loss of productivity and increasing medical treatment costs.(3) Back pain is associated with multiple interacting spinal pathologies including vertebral fracture and endplate defects as well as intervertebral disc herniation and degeneration. Poor general health and obesity are among the strongest risk factors for back pain,(2,4,5) motivating investigations of how diet influences spinal diseases.
A causal link between diabetes and spinal pathology was identified in animal studies where accumulation of advanced glycation end-products (AGEs) in spinal tissues was suggested as a mechanism for the observed vertebral bone loss and disc degeneration.(6,7) AGEs are formed by spontaneous reactions between aldehyde groups of reducing sugars and free functional groups of proteins as well as lipids and nucleic acids (the Maillard reaction).(8) AGEs can be produced endogenously as a result of hyperglycemia (eg, with diabetes) or exogenously in food processed, for example, under dry heat.(9) Bone tissue accumulation of AGEs has also been correlated with osteoporo-sis(10) and increased vertebral fracture risk.(11) Nonenzymatic glycation can reduce the strength of cortical and trabecular bone(12,13) and can also reduce intervertebral disc water content.(14) AGEs are elevated in serum and bone tissue of diabetic patients, and diabetics are known to have increased risk of fracture and spinal stenosis.(8,15–20) Diabetic complications such as heart attacks or fractures occur more often in women than in men,(21,22) motivating studies on both sexes. There is also a known sex-dependent fracture risk in diabetics,(18,19) further motivating studies on vertebral pathology in both sexes. Taken together, AGEs are strongly implicated as contributing to painful spinal pathologies and diminished vertebral and disc quality, and these effects may have sex differences. However, there are very few studies investigating a direct role of AGEs in spinal pathology.(11,19,23,24)
AGEs are prevalent in standard western diets and 10% of ingested AGEs can be found in the blood circulation.(25) Diets high in fructose increase AGEs in collagen-rich tissues and cause crosslinking of collagen fibers. These crosslinks can result in increased collagen stiffness, reduced elasticity,(26) and crosslinked collagen matrix in bones, which in turn can contribute to decreased bone toughness.(12) AGEs can also act via inhibiting parathyroid hormone secretion(27) that, in relation to diminished bone formation and turnover, inhibits osteoblast function(27) and thus might contribute to the effect of AGEs on inferior bone mechanical behaviors in long bones.(28,29) However, spinal tissues often have distinct effects from long bones, and many outstanding questions remain. Dietary AGEs are likely to impact spinal tissues because reduced ingestion of the AGE precursor methylglyoxal in mice was protective of aging-related decreases in vertebral bone quality.(23) However, it remains unclear if a high-AGE diet can induce pathological spinal changes and result in functional biomechanical alterations. It also remains unclear if these changes accumulate differently in male or female mice, and if these changes are affected by or accelerate aging. This study tested the overall hypothesis that high dietary AGE ingestion, independent from diabetes, will result in accumulation of AGEs in spinal tissues and induce vertebral changes in young female mice which amplify vertebral changes and increased fracture risk known to occur with aging.
Materials and Methods
Mouse model
This study was carried out in accordance to recommendations stated in the Guide for the Care and Use of Laboratory Animals of the National Institutes of Health (US Department of Health, Education, and Welfare, NIH 78-23, 1996) and all animal protocols were approved by the Mount Sinai Institutional Animal Care and Use Committee (protocol # 2013-1428-PD).
To investigate the sex- and age-dependent effects of dietary AGEs on vertebral bone, 80 male and female C57BL/6J mice were used (Table 1). After weaning, mice were assigned to two pair-fed groups receiving either a low-AGE chow (L-AGE; containing 7.6 μg/mg AGE; Test Diet Low AGE 5053; WF Fisher & Son Co, Somerville, NJ, USA), or high-AGE chow (H-AGE; 40.9 μg/mg, 10 female and 10 male per age group; NIH-31 open formula chow autoclaved for 30min at 120°C). The L-AGE group served as age-and sex-matched control to determine effects of dietary AGEs. Apart from AGE content, diets were identical in caloric and nutritional content.(30) Mice were fed ad libitum with ample amounts of water and provided unrestricted cage access. Enrichment tools (safety houses) were added to increase welfare.(31) At 6 months or 18 months of age, mice were anesthetized by Ketamine-Xylazine-Acepromazine injection (Forane, Baxter, IL, USA), and then euthanized via cardiac puncture at the termination of the experiment. General observations at termination included body weight, fasting blood glucose, and serum AGE content. Thoracic, lumbar, and coccygeal spines were collected for vertebral structure, mechanical testing, and AGE analyses (Table 2).
Table 1. Study Design.
| Diet | n | Age (months) | Sex |
|---|---|---|---|
| Low AGE (L-AGE) | 10/group | 6 | Male |
| 6 | Female | ||
| 18 | Male | ||
| 18 | Female | ||
| High AGE (H-AGE) | 10/group | 6 | Male |
| 6 | Female | ||
| 18 | Male | ||
| 18 | Female |
AGE = advanced glycation end-product.
Table 2. Sample Collection for Dependent Variables.
| Sample collection | Dependent variable |
|---|---|
| Blood | Fasting glucose |
| Serum AGEs | |
| Thoracic spine | Maximum load from fracture mechanics |
| Lumbar spine | Microstructure, analytical mechanical properties |
| Coccygeal spine | Total fluorescent AGE |
AGE= advanced glycation end-product.
Serum AGEs and fasting blood glucose determination
Blood was collected for analysis of fasting glucose (Aimstrip Plus Glucose Meter; Germaine Laboratories, San Antonio, TX, USA) and serum AGEs (competitive ELISA; developed in our laboratory using an anti-AGE antibody; Abcam, Cambridge, MA, USA; ab23722), for this study 1 unit (U) corresponds to 3 μg AGE-BSA).
Vertebrae harvest
Following blood collection, thoracic (T12), lumbar (L5), and coccygeal (CC4–CC6) spinal segments were dissected and surrounding soft tissue was removed. Thoracic vertebrae were immediately stored at −80°C until mechanical testing. Coccygeal vertebrae were separated into individual cortical and trabecular bone compartments. Collected tissue was submerged in 1% saline and immediately stored at −80°C until further usage for the assessment of total fluorescent AGE content. Lumbar vertebrae were washed in 1× phosphate-buffered saline and scanned by micro–computed tomography (μCT).
μCT scanning, reconstructions, and volume of interest selections
Lumbar spines were kept hydrated while μCT scanned in air. Lumbar L5 vertebrae were scanned with a nominal resolution of 4.9 μm/pixel with an aluminum filter, 1767 ms of X-ray exposure time, and 80 kV × 80 μA power (SkyScan 1172; Bruker Corp., Kontich, Belgium). Five consecutive projections were taken and averaged every 0.3 degrees to increase signal to noise ratio. Hydroxyapatite phantoms (0.25 and 0.75 mg/cm3) were equally scanned for mineral density calibration. After scanning, μCT projections were reconstructed into cross-sectional images using a modified back-projection algorithm (N-Recon, V1.01; Bruker). Reconstructed μCT images were digitally aligned (Dataviewer V1.01; Bruker) to a common global coordinate system to allow for accurate and consistent measurements of anisotropy. Regions of interest for trabecular bone and cortical bone were hand-drawn (Ctan, V1.01.0; Bruker) and used for cortical and trabecular compartment separation. Analyses of bone densitometry (bone quantity), microarchitecture (bone quality), and anisotropy (bone quality) were performed (Ctan, V1.01.0; Bruker).
3D measures of trabecular bone were assessed using sphere-fitting methods and total pixel counting methods to compute trabecular thickness, separation, number, and bone surface to volume ratio. A mineral density standard curve was generated from the hydroxyapatite phantoms and used along with a global thresholding technique to compute tissue bone mineral density (BMD). Finally, trabecular bone anisotropy was analyzed in 3D using the mean-intercept-length method (MIL), which generated a 3 × 3 tensor of eigenvalues describing the three principal axes along which bone mass is distributed. MIL eigenvalues were transformed into the fabric tensor, which is most commonly used in describing anisotropy, using previously described methods (32) to evaluate directional dependent mechanical properties of the bone structure.
Individual 2D cross-sections of cortical bone were analyzed for tissue mineral density, BMD, bone surface area, cross sectional thickness, and porosity. Each measure was then averaged providing a mean value.
AGE content of cortical and cancellous vertebral bone
Tail vertebrae were dissected and organic tissue and vertebral end plates were removed using standard dissection tools. Bone marrow was removed by flushing the vertebrae with 1× phosphate-buffered saline. A precision drill (Dremel-4300; Dremel, Racine, WI, USA) was used to separate trabecular and cortical bone by boring a cylinder into the center of the vertebrae using a 26G needle. Trabecular bone tissue was collected by pushing a 30G needle through the 26G needle. Cortical and trabecular bone samples were washed in 1 × Tris-Buffered-Saline+Tween-20 and sonicated for 5 min (Sonic Dismembrator; Fisher Scientific, Waltham, MA, USA) to remove any remaining organic tissues. AGE content was determined using published protocols.(12,13) Briefly, cortical or trabecular bone tissues were flushed with cold Nanopure water until free of blood, defatted, lyophilized, and hydrolyzed according to dry mass in 6 N HCl (10 μL/mg bone) for 16 hours at 110°C. The bulk fluorescence of the hydrolysates was measured using a micro-plate reader (370 nm excitation and 440 nm emission) and normalized to a quinine sulfate standard. The amount of collagen in the sample was estimated based on the amount of hydroxyproline. AGE content is expressed as nanograms (ng) of quinine sulfate fluorescence per milligrams (mg) of collagen.
Whole-vertebra mechanical testing to failure
Thoracic vertebrae were stored at−80°C until testing. A precision drill (Dremel-4300) was used to remove the vertebral processes. Superior and inferior vertebral endplates were removed (∼0.25 mm total) using a scalpel to create flat and parallel loading surfaces, similar to methods as described.(33) Removing endplates provided a more accurate mechanical response with uniform reaction forces across the vertebrae that were interpreted as average properties across vertebral bone, including both cortical and trabecular components but not endplate behaviors. Sample length and diameter (including trabecular and cortical compartments) were measured in multiple locations for each vertebrae. Cross-sectional area was calculated using the average diameter of each vertebrae assuming a circular cross-sectional area. Thoracic vertebrae were loaded into parallel-platens of an axial testing machine (Bose ElectroForce 3220; TA Instruments, New Castle, DE, USA), and held in place on the lower platen using a thin layer of cyanoacrylate. Samples were loaded to failure in compression with a displacement-controlled test (at a rate of 0.05 mm/s).(34) Force-displacement and stress-strain curves were created, from which we determined the maximum values at failure for each specimen of the load, displacement, stress, and strain data. The area under the force-displacement curve to failure and toughness were calculated by integrating the force-deformation and stress-strain curves until the point of failure, respectively.
Analytical model for trabecular mechanics
The compressive and shear moduli of trabecular bone was calculated using a previously validated analytical model of the trabecular network that accounts for trabecular TMD, fabric anisotropy and bone volume fraction, which were previously measured by μCT scanning and the mean intercept length method.(32,35) Trabecular bone fabric anisotropy exhibited orthotropic symmetry, providing three planes of symmetry. The nonzero diagonal elements of the fourth rank elasticity tensor were then calculated using the relationships described by Cowin(32) and Turner and colleagues(36) with the coefficients calculated by Kabel and colleagues(35) and Wagner and colleagues.(37) The following equations were used:
| (1) |
| (2) |
| (3) |
where Et is the elastic modulus; λ1, λ2, and λ3 are the three normalized eigenvalues of the fabric tensor; ║ is the trace of the fabric tensor (║ = sum(λiλj), i ≠ j, and i,j = 1,2,3); Ciiii is the elastic modulus (C1111 = compressive elastic modulus in the principal trabecular orientation); and Ciijj is the shear modulus (C1122 = shear elastic modulus perpendicular to the principal trabecular direction).
Statistical analyses
For statistical analyses, two-way ANOVAs were used to assess the effects of diet and sex, and the effects of diet and age on the vertebral bone (Tables 3–5). When significant effects were detected, a two-tailed unpaired Student's t test with Bonferroni correction to compensate for the number of comparisons was used to identify significant differences between H-AGE and L-AGE diet effects as a function of sex and time. Error bars are displayed as ±SD on all graphs. For all analyses, p < 0.05 was considered significant.
Table 3. Values of p from Two-Way ANOVA for General Observation and AGE Accumulation.
| Diet:Age (p) | Diet:Sex (p) | |||||||||||
|---|---|---|---|---|---|---|---|---|---|---|---|---|
|
|
|
|||||||||||
| 6 months | 18 months | Female | Male | |||||||||
|
|
|
|
|
|||||||||
| Interact | Diet | Sex | Interact | Diet | Sex | Interact | Diet | Age | Interact | Diet | Age | |
| Body weight | 0.122 | 0.233 | 0.017 | 0.503 | 0.816 | 0.774 | 0.890 | 0.723 | 0.009 | 0.638 | 0.054 | 0.018 |
| Blood glucose | 0.02 | 0.189 | 0.679 | 0.025 | 0.008 | 0.127 | 0.060 | 0.270 | 0.881 | 0.056 | 0.020 | 0.232 |
| AGE serum | 0.195 | 0.001 | 0.040 | 0.126 | 0.396 | 0.501 | 0.016 | 0.237 | 0.044 | 0.634 | 0.011 | <0.001 |
| AGE trabecular | 0.213 | 0.202 | 0.741 | 0.269 | <0.001 | 0.119 | 0.016 | 0.016 | <0.001 | 0.001 | 0.024 | <0.001 |
| AGE cortical | 0.340 | 0.017 | 0.683 | 0.901 | 0.119 | 0.314 | 0.596 | 0.119 | <0.001 | 0.927 | 0.002 | 0.231 |
Bold values are signifcant.
AGE = advanced glycation end-product; Interact = interaction.
Table 5. Values of p From Two-Way ANOVA for Mechanical Testing.
| Diet:Age (p) | Diet:Sex (p) | |||||||||||
|---|---|---|---|---|---|---|---|---|---|---|---|---|
|
|
|
|||||||||||
| 6 months | 18 months | Female | Male | |||||||||
|
|
|
|
|
|||||||||
| Interact | Diet | Sex | Interact | Diet | Sex | Interact | Diet | Age | Interact | Diet | Age | |
| Maximum load (N) | 0.091 | 0.015 | 0.055 | 0.939 | 0.357 | 0.004 | 0.089 | 0.014 | 0.194 | 0.940 | 0.356 | 0.026 |
| Toughness (MPa) | 0.195 | 0.307 | 0.866 | 0.331 | 0.046 | 0.367 | 0.879 | 0.017 | 0.417 | 0.482 | 0.752 | 0.132 |
| Maximum displacement (mm) | 0.918 | 0.703 | 0.854 | 0.208 | 0.222 | 0.092 | <0.001 | <0.001 | <0.001 | 0.697 | 0.99 | <0.001 |
| Maximum stress (MPa) | 0.043 | 0.146 | 0.063 | 0.897 | 0.018 | 0.855 | 0.010 | 0.326 | 0.034 | 0.399 | 0.098 | 0.915 |
| Maximum strain (MPa) | 0.447 | 0.350 | 0.060 | 0.039 | <0.001 | 0.535 | 0.009 | 0.014 | 0.837 | 0.053 | 0.974 | 0.004 |
| AUC (N*m) | 0.946 | 0.386 | 0.315 | 0.450 | 0.1057 | 0.013 | 0.697 | 0.223 | 0.046 | 0.795 | 0.288 | 0.001 |
| Shear modulus (GPa) | 0.277 | 0.323 | <0.001 | 0.828 | 0.253 | <0.001 | 0.423 | 0.035 | <0.001 | 0.543 | 0.598 | 0.002 |
| Compressive modulus (GPa) | 0.261 | 0.449 | <0.001 | 0.995 | 0.163 | <0.001 | 0.526 | 0.011 | <0.001 | 0.489 | 0.720 | <0.001 |
Bold values are signifcant.
Results
H-AGE diet caused elevated serum AGE levels in female mice independent of diabetes or overweight
Serum AGE levels of 6-month-old female H-AGE mice increased by ∼78% compared to L-AGE female mice (p = 0.03; Fig. 1A).The H-AGE group exhibited significantly elevated blood glucose for 18-month-old females and 6-month-old males, yet the fasting blood glucose levels of all mice were all below prediabetic levels (<100mg/dL; Fig. 1B). Body weights of female and male mice were also in normal ranges for mice of this strain at both time points (Fig. 1C).(38)
Fig. 1.
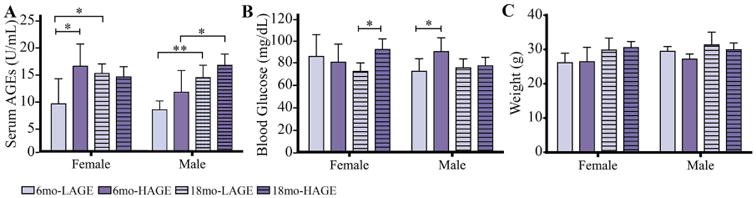
H-AGE diet significantly increased serum AGE levels only in 6-month-old female mice indicating sex-dependent effects of dietary AGE ingestion on (A) serum AGE accumulation. Although the H-AGE diet resulted in some significant increases in blood glucose levels, (B) fasting blood glucose (16 hours) remained in euglycemic levels (50-10 mg/dL) and (C) body weight remained in normal ranges demonstrating that dietary AGEs induced AGE accumulation independent from diabetes and obesity. *p < 0.5. mo = months.
Dietary AGE ingestion had a sex- and age-dependent effects on vertebral AGE accumulation
Trabecular bone
Measurements of AGE autofluorescence revealed increased accumulation of fluorescent AGEs in trabecular bone of 18-month-old female and male H-AGE mice compared to 18-month-old L-AGE (female: p= 0.032; male: p = 0.005) or 6-month-old H-AGE mice (female: p < 0.001; male p < 0.001; Fig. 2A). Age-dependent effects of L-AGE diet were only observed in female mice (female: p = 0.014; male p > 0.99). No differences were observed in 6-month-old mice (p> 0.99).
Fig. 2.
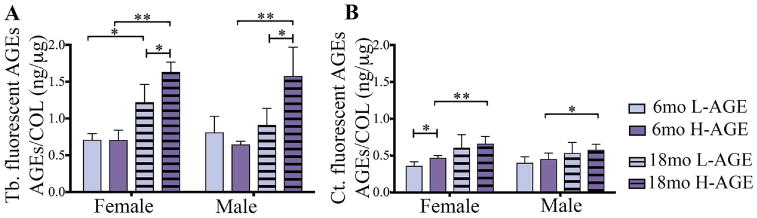
H-AGE diet led to AGE accumulation in (A) Tb bone in 18-month-old mice of both sexes. In addition to dietary AGE accumulation, in female mice, aging caused AGE accumulation independent from diet. (B) H-AGE diet caused increased AGE accumulation in Ct bone of 6-month-old female mice, while aging dominated diet effects in both sexes, indicating sex- and diet-dependent effects of AGE accumulation in bone. *p < 0.05; **p < 0.001. mo = months; Tb = trabecular; Ct = cortical; COL = collagen.
Cortical bone
AGE accumulation was increased in 6-month-old female H-AGE mice (p = 0.04, Fig. 2B), while no differences were observed in male mice (p > 0.99). Compared to 6-month-old mice, in 18-month-old female and male mice H-AGE diet increased AGE accumulation (female: p = 0.009; male: p = 0.035), while L-AGE diets had no effect on aging (p > 0.99). In 18-month-old mice no differences were observed between diets (p > 0.99).
Dietary AGE ingestion had a sex-dependent effect on vertebral bone microstructure
Trabecular bone
μCT analysis of lumbar vertebrae revealed that chronic dietary H-AGE ingestion caused diminished microstructure in 6-month-old female mice (Fig. 3A). At 6 months old, compared to 6-month-old female L-AGE mice, female H-AGE mice had significantly reduced trabecular BMD (p = 0.022, Fig. 3B) and a slight decrease in trabecular bone volume fraction; however, this change was not significant (Table 5). Dietary AGE ingestion did not affect the bone microstructure of male mice (trabecular BMD: p > 0.99; trabecular bone volume fraction: p = 0.99) at 6 months old. As expected, aging was identified as an additional risk factor for diminished bone microstructure caused by H-AGE diet for both male and female mice. In female mice, aging caused significantly decreased trabecular BMD for both dietary groups (L-AGE: p = 0.002; H-AGE: p = 0.0001). Trabecular bone volume density decreased with age in both female and male mice (female: L-AGE p = 0.0008, H-AGE p = 0.0004; male: L-AGE p = 0.0088, H-AGE p = 0.0448). No differences between diets were observed at 18 months old (Fig. 3B–F, Table 6), which were likely masked by aging effects as indicated by the large structural changes between age groups. No differences between dietary groups were observed for trabecular thickness, number, spacing, bone surface to volume ratio, bone volume density, degree of anisotropy, and tissue mineral density (Fig. 3C–F, Table 6).
Fig. 3.
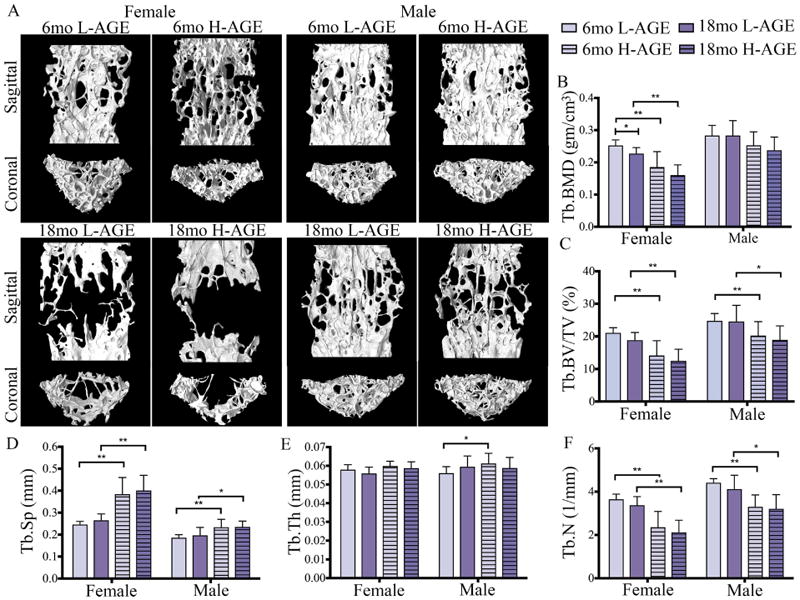
H-AGE intake induced pathological changes in trabecular vertebrae of 6-month-old female mice. (A) 3D μCT images of Tb bone of (top) 6-month-old and (bottom) 18-month-old mice. (B) Tb.BMD, (C) Tb.BV/TV and (D) Tb.Sp demonstrate inferior Tb microstructure in female 6-month-old H-AGE mice. (B-F) Aging dominated diet effects in both sexes. *p < 0.05, **p < 0.001. Tb = trabecular; Tb.BMD = trabecular bone mineral density; Tb.BV/TV = trabecular bone volume fraction; Tb.Sp = trabecular separation; Tb.Th = trabecular thickness; Tb.N = trabecular number; mo = months.
Table 6. Trabecular and Cortical Bone Quantity and Quality From μCT Analysis.
| 6 months | 18 months | 6 versus 18 months (p) | |||||||||||||||
|---|---|---|---|---|---|---|---|---|---|---|---|---|---|---|---|---|---|
|
|
|
|
|||||||||||||||
| Female | Male | Female | Male | Female | Male | ||||||||||||
|
|
|
|
|
|
|
||||||||||||
| L-AGE | H-AGE | P | L-AGE | H-AGE | P | L-AGE | H-AGE | P | L-AGE | H-AGE | P | L-AGE | H-AGE | L-AGE | H-AGE | ||
| Trabecular | Tb.Th (mm) | 0.58 ±0.01 | 0.56 ±0.01 | 0.607 | 0.06 ±0.01 | 0.06 ± 0.01 | 0.513 | 0.056 ±0.01 | 0.06 ±0.01 | >0.99 | 0.06 ± 0.06 | 0.06 ±0.01 | >0.99 | 0.42 | 0.277 | 0.032 | >0.99 |
| Tb.N (1/mm) | 3.65 ±0.24 | 3.37 ±0.40 | 0.337 | 4.42 ±0.18 | 4.12 ±0.64 | >0.99 | 2.34 ±0.73 | 2.12 ±0.56 | 0.001 | 3.30 ±0.55 | 3.21 ±0.66 | >0.99 | 0.001 | 0.001 | 0.001 | 0.015 | |
| Tb.Sp (mm) | 0.25 ±0.01 | 0.27 ±0.03 | 0.311 | 0.19±0.01 | 0.20 ± 0.04 | >0.99 | 0.39 ± 0.08 | 0.40 ± 0.07 | >0.99 | 0.23 ± 0.04 | 0.24 ± 0.03 | >0.99 | 0.001 | 0.001 | 0.001 | 0.051 | |
| Tb.BS/BV (mm−1) | 57.11 ±2.85 | 60.10 ±2.97 | 0.135 | 58.92 ±3.27 | 56.87 ±5.36 | >0.99 | 57.16 ±3.88 | 59.15 ±3.06 | 0.737 | 55.67 ±4.36 | 57.66 ±5.52 | >0.99 | >0.99 | >0.99 | 0.179 | >0.99 | |
| Tb.DA ([]) | 2.10±0.17 | 2.05 ±0.13 | >0.99 | 2.34 ±0.15 | 2.30 ±0.15 | >0.99 | 2.02 ±0.12 | 2.03 ±0.26 | >0.99 | 2.04 ±0.19 | 2.02 ± 0.20 | >0.99 | >0.99 | >0.99 | 0.001 | 0.006 | |
| Tb.TMD (g HA/cm3) | 0.90 ± 0.03 | 0.87 ± 0.02 | 0.542 | 0.88 ± 0.03 | 0.89 ±0.01 | 0.984 | 0.92 ± 0.03 | 0.90 ± 0.04 | 0.525 | 0.93 ± 0.03 | 0.92 ± 0.04 | >0.99 | 0.091 | 0.184 | 0.004 | 0.004 | |
| Tb.BW/TV (%) | 21.11 ± 1.56 | 18.84 ±2.40 | 0.096 | 24.80 ± 2.25 | 24.60 ± 4.98 | >0.99 | 14.16 ±4.54 | 12.49 ±3.57 | >0.99 | 20.28 ±4.25 | 18.93 ±4.30 | >0.99 | 0.001 | 0.001 | 0.001 | 0.045 | |
| Tb.BMD (gm/cm3) | 0.25 ±0.02 | 0.23 ±0.02 | 0.022 | 0.28 ±0.03 | 0.28 ±0.05 | >0.99 | 0.19 ±0.05 | 0.16 ±0.03 | >0.99 | 0.25 ± 0.04 | 0.24 ± 0.04 | >0.99 | 0.002 | 0.001 | >0.99 | 0.090 | |
| Cortical | Ct.BS/BV (mm−1) | 35.41 ±1.85 | 37.41 | 0.21 | 40.34 ±2.21 | 38.45 ±2.61 | 0.384 | 40.84 ±2.59 | 40.54 ± 2.64 | >0.99 | 43.75 ±3.51 | 44.94 ± 3.09 | >0.99 | 0.377 | 0.001 | 0.026 | 0.001 |
| Ct.TMD (g HA/cm3) | 1.06 ±0.41 | 1.04 ± 0.03 | 0.95 | 1.01 ±0.05 | 1.02 ± 0.02 | >0.99 | 1.04 ± 0.02 | 1.00 ±0.02 | 0.002 | 1.04 ± 0.02 | 0.10 ±0.02 | 0.011 | 0.561 | 0.004 | 0.284 | 0.277 | |
| Ct.BMD (gm/cm3) | 1.05 ± 0.04 | 1.04 ± 0.02 | >0.99 | 1.00 ± 0.05 | 1.02 ± 0.02 | >0.99 | 1.03 ± 0.02 | 1.00 ±0.22 | 0.002 | 1.02 ± 0.03 | 0.99 ± 0.04 | 0.024 | >0.99 | 0.001 | >0.99 | >0.99 | |
| Ct.Th (mm) | 0.07 ± 0.00 | 0.07 ±0.01 | >0.99 | 0.06 ± 0.00 | 0.06 ± 0.00 | >0.99 | 0.06 ± 0.00 | 0.06 ±0.01 | >0.99 | 0.07 ±0.01 | 0.06 ± 0.00 | >0.99 | 0.001 | 0.07 | >0.99 | 0.02 | |
| TLAr (mm2) | 0.35 ±0.03 | 0.34 ± 0.04 | >0.99 | 0.29 ±0.02 | 0.31 ±0.03 | >0.99 | 0.34 ± 0.03 | 0.32 ± 0.04 | >0.99 | 0.32 ±0.02 | 0.32 ± 0.02 | >0.99 | >0.99 | >0.99 | 0.009 | >0.99 | |
Values are mean ± SD. Bold values are significant.
L-AGE = low level of advanced glycation end-products; H-AGE = high level of advanced glycation end-products; Tb.Th = trabecular thickness; Tb.N = trabecular number; Tb.Sp = trabecular separation; Tb.BS/BV = trabecular bone surface to volume ratio; Tb.DA = trabecular degree of anisotropy; Tb.TMD = trabecular tissue mineral density; Tb.BMD = trabecular bone mineral density; Tb.BV/TV = trabecular bone volume density; Ct.BS/BV = cortical bone surface to volume ratio; Ct.TMD = cortical tissue mineral density; Ct.BMD = cortical bone mineral density; Ct.Th = cortical thickness; Tt.Ar = cortical total area.
Cortical bone
Contrary to trabecular bone, dietary AGEs did not affect cortical bone quality or quantity of 6-month-old mice (Table 6, Fig. 4A–C). Interestingly, in 18-month-old mice H-AGE diets caused a decrease in bone quality with decreased cortical BMD and cortical tissue mineral density in both sexes (cortical BMD 18-month-old female = 0.002; 18-month-old male p = 0.03; cortical tissue mineral density: 18-month-old female p = 0.002; 18-month-old male p = 0.01; Table 6, Fig. 4B, C).
Fig. 4.
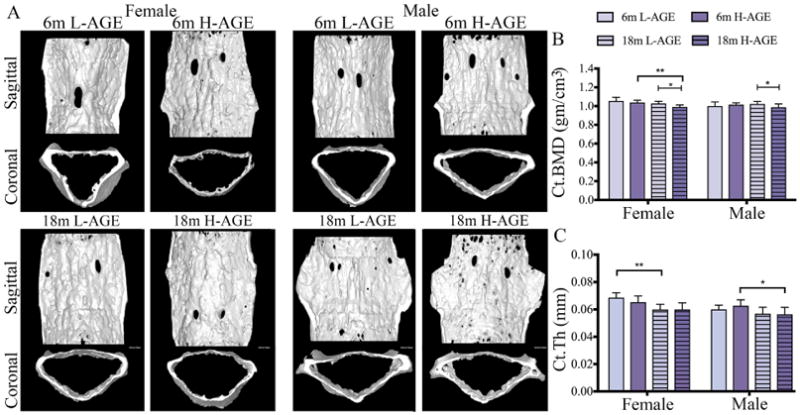
H-AGE intake led to inferior microstructure of cortical vertebrae in 18-month-old mice. (A) 3D μCT images of Ct bone for (top) 6-month-old and (bottom) 18-month-old mice. H-AGE diet decreased (B) Ct.BMD in 18-month-old mice; (C) Ct.Th decreased with age, and aging effects dominated any potential diet effects. *p < 0.05, **p < 0.001. mo = months; Ct = cortical; Ct.BMD = cortical bone mineral density; Ct.Th = cortical thickness.
Dietary AGE ingestion decreased vertebral mechanical properties of 6-month-old female mice
Load to failure testing of thoracic vertebrae demonstrated that, compared to 6-month-old female L-AGE mice, the H-AGE diet and aging caused lower maximum load to failure (6-month-old H-AGE versus L-AGE: p = 0.048; Fig. 5A) while aging resulted in lower maximum stress only in female low-AGE groups (L-AGE 6 months old versus 18 months old: p= 0.003; Fig. 5B) and lower maximum strain in female H-AGE mice (H-AGE 6 months old versus 18 months old: p = 0.027; Fig. 5D), which was also decreased compared to 18-month-old female L-AGE mice. Only in male mice aging resulted in a lower area under the curve (H-AGE 6 months old versus 18 months old p= 0.019; Fig. 5E). An H-AGE diet had no further effects on aging. No differences between groups were observed for maximum displacement or toughness (Fig. 5C, F). To assess if the diminished microstructure of trabecular bone was associated with impaired mechanical properties, we performed analytical modeling for trabecular bone. Modeling the trabecular bone properties revealed that in 6-month-old female mice the H-AGE diet significantly reduced trabecular compressive stiffness (p = 0.048) and shear modulus (p= 0.048) when compared to the L-AGE diet. Aging mainly affected properties of female mice with significantly decreased shear (L-AGE: p = 0.002; H-AGE: p = 0.001) and compressive modulus (L-AGE: p= 0.0004; H-AGE: p= 0.05) and male compressive modulus (L-AGE: p= 0.044; H-AGE: p = 0.048). No significant changes were found at 18 months old with H-AGE diet for either female or male mice indicating a larger effect of age than diet on the bone structure as seen by the significant decrease in both compressive and shear stiffness in the H-AGE groups and the L-AGE groups (Fig. 6A, B).
Fig. 5.
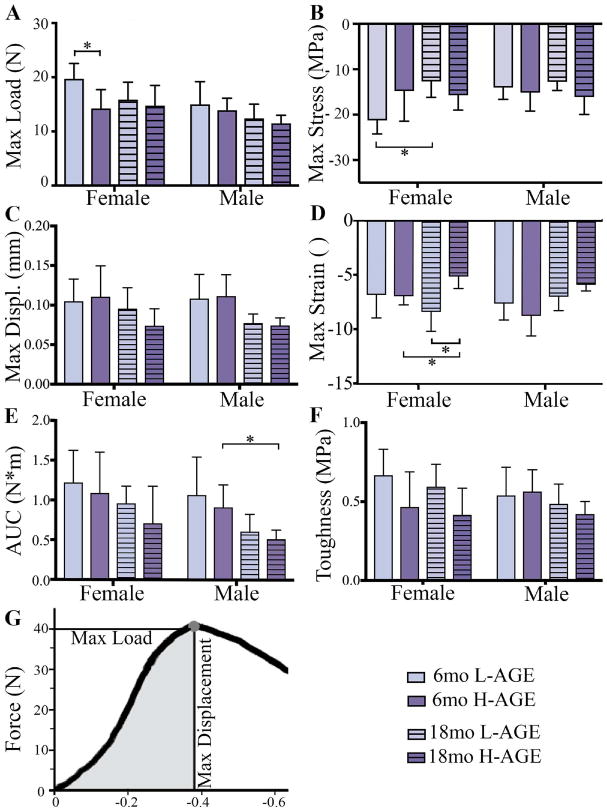
H-AGE diet led to lower ex vivo vertebral fracture resistance in mice. (A) Max load at failure; (B) max stress; (C) max displacement; (D) max strain; (E) AUC; and (F) toughness were defined by a fracture mechanics load-displacement curve. *p < 0.05. Max = maximum; AUC = area under the curve; Displ = displacement.
Fig. 6.
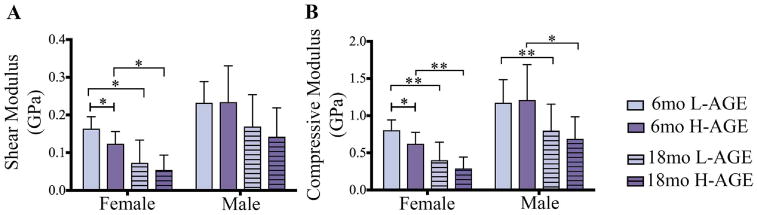
H-AGE diet led to lower Tb bone moduli in 6-month-old female mice with significantly lower (A) shear modulus and (B) compression modulus along the principal Tb axis that were calculated from an anisotropic model in the direction of the principal trabecular axis. Moduli were computed considering effects of mass density, porosity, and structural directionality. *p < 0.05, **p < 0.001. mo = months; Tb = trabecular.
Discussion
This study determined that a high-AGE diet can result in inferior vertebrae bone quality and inferior mechanical behaviors. We tested the hypothesis that ingestion of dietary AGEs induces vertebral changes in young female mice causing increased vertebral fracture risk that amplifies age-related vertebral changes in mice. The H-AGE diet primarily affected 6-month-old female mice and led to AGE accumulation in serum and cortical bone. The H-AGE diet caused changes in bone mechanical structure and mechanics including reduced trabecular BMD and bone mineral fraction, reduced maximum load to failure, and reduced compressive and shear moduli in 6-month-old females, as well as higher serum AGE, total fluorescent AGE accumulation, inferior vertebral microstructure, and mechanical properties. Aging dominated dietary effects of AGEs in the 18-month-old animals, yet the H-AGE groups had significantly reduced cortical BMD, reduced maximum strain and area under the curve, as well as the lowest mean values for shear and compressive moduli. Together, our data indicate that young females may be at higher risk for developing inferior vertebral structure and function by consuming high levels of dietary AGEs.
Chronic consumption of dietary AGEs can affect a broad-spectrum of diseases(39) and AGE accumulation in tissues is implicated in osteoarthritis,(40,41) atherosclerotic calcifcation,(42) and vascular/renal and diabetes-related complications.(8,25,43,44) In our study mice were fed an H-AGE diet originating from autoclaved mouse chow. Similar to autoclaved chow, bread crust also contains relatively high amounts of AGEs(45) and studies on young rats that were fed a diet enriched with bread crust demonstrated increased accumulation of AGEs in serum(45) and tibia,(29) which led to decreased BMD, and decreased stiffness with lower ability to withstand force and absorb energy to failure.(29) Ionova-Martin and colleagues(46) demonstrated that a high-fat diet caused AGE accumulation in tibias of 3-week-old adolescent and 15-week-old adult mice, which correlated with a marked reduction in mechanical performance of cortical bone. Although studies on high-fat diets demonstrate significant effects of diet on long bones and serum AGEs, high-fat diet mice are also obese and can develop diabetes, preventing a direct correlation of AGEs with bone morphology. Vertebral bone can have distinct responses compared to long bones, and our study isolated dietary AGEs on vertebral tissues. We concluded that dietary AGE ingestion, in the absence of obesity and diabetes, caused AGE accumulation in serum and vertebral bone tissue and resulted in inferior vertebral bone quantity and mechanical performance.
AGE accumulation is also known to occur in bones with aging, increasing by fourfold to 10-fold by age 50 years,(47) and increased levels of AGEs in bone tissues have been associated with diminished bone mechanical function(47–49) and reduced cortical and trabecular bone strength.(12,13) This aging-related increase in vertebral AGE accumulation has been considered a potential cause for vertebral fractures in elderly women and men.(50,51) In our study, trabecular and cortical AGE accumulation was also increased with aging, and effects were more prominent for the H-AGE animals than for the L-AGE animals. Together, results suggest that a high-AGE diet may result in an accelerated bone aging phenomena in both sexes. AGEs irreversibly alter proteins, and although we did not measure protein turnover in this study, the accumulation of AGEs in older animals might be due to the decline in protein turnover rate that is known to occur during aging.(15) On the other hand, we did not detect increased AGE content in trabecular bone of young animals, which could be associated with the relatively high protein turnover rate in young animals. AGEs increased in cortical bone of young female mice, and it is possible that other AGEs were present but not detectable with our measurement, which did not detect the entire spectrum of AGEs. The standard for AGE measurements in bone are based on fluorescent assays(52); however, the best-characterized dietary AGEs are the nonfluorescent AGEs methylglyoxal-H1 and carboxymethyl lysine (CML),(9,53) and it is likely that accumulation of these AGEs may have contributed to the inferior bone structure and properties observed in this study.
High-AGE diets and aging both resulted in reduced trabecular bone compression and shear moduli, and these effects were most significant in young female mice. Female mice also exhibited significant reductions in bone failure properties from diet and aging. Therefore, both analytical and experimental
biomechanical data point to functional differences in female vertebrae from diet and aging. Some discrepancies between biomechanical results identified from the analytical model of trabecular bone and whole-vertebra biomechanical testing are likely due to the differences in trabecular bone and whole-vertebrae assessments. Interestingly, a recent study on correlations of diabetes with hip fractures showed that diabetes exerted a much stronger effect on hip fracture risk in younger than older individuals.(54) Although that study did not assess sex-dependent effects, results from another study indicated that AGE accumulation could be correlated to vertebral fracture risk in women but not in men.(55) Taken together, these studies strongly support our finding that AGE accumulation is most detrimental for young female mice, where bone quantity is at lower levels than for males.
Bone morphology and strength differ between female and male mice, and during aging some of these properties change more rapidly in females than males, limiting the utility of direct comparison between sexes.(56) Willinghamm and col-leagues(56) reported that female BALB/c mice had superior vertebral mechanical properties with greater strength than male mice, despite inferior trabecular bone mass. In our studies, male mice had greater moduli than female mice, although no differences in failure behaviors were noted between the sexes. It was notable that L-AGE had the strongest effects in females, with young female mice having vertebrae with largest maximum load to failure and greatest compressive and shear moduli.
AGEs form intrafibrillar and interfibrillar crosslinks in collagen networks that can affect trabecular and cortical bone mechanical properties.(12,13) AGE accumulation is also thought to directly affect cells and bone formation by impairing osteoclastic bone resorption(57) and osteoblast proliferation and differentia-tion.(52,58) The literature and our study together show that AGE ingestion can result in AGE accumulation in bone, diminished microstructure and inferior vertebral mechanical properties, decreased whole-bone postyield strength and toughness, and potentially result in the phenomenon known clinically as brittle bone.(59,60) Sex hormones may play a role on the AGE-mediated changes in vertebral structure and function observed in this study. Chatzigeorgiou and colleagues(61) found that a high-AGE diet increased serum glucose, insulin, and testosterone levels, as well as decreased estradiol and progesterone levels, suggesting there may exist a metabolic and hormonal dysregulation attributed to high-AGE dietary ingestion. Consequently, this study highlights a need for future investigations to identify sex-dependent tissue and cellular mechanisms for these observed effects and means of intervention.
In this study we assessed the direct effects of AGEs on vertebral structures and therefore chose a relatively mild dietary intervention to avoid the development of prediabetes or obesity. AGE content in our autoclaved mouse chow resembled a typical western diet in its high abundance of a variety of different AGEs. One major AGE in the H-AGE diet is the stable and relatively inert CML, which is not very reactive. It is likely that diets higher in reactive AGEs might induce more severe vertebral pathologies, as observed in our previous studies on diabetic(7) and prediabetic(23) mice, so the risks associated with these dietary AGEs may be larger than those reported here. Compared to the L-AGE diet, the autoclaved diet was harder and crisper and H-AGE mice might have consumed less chow than L-AGE mice. Because of the difference in chow consistency and because mice were grouped housed, we were not able to determine the amount of food ingested.
To our knowledge, this is the first study to demonstrate a sex-dependent effect of a high-AGE diet on vertebral structures and function in mice. Results indicated that dietary AGE ingestion, independent of diabetes and obesity, caused younger female mice to have altered vertebral bone structure with reduced moduli and failure strength, with values that were similar to aged female mice. Results therefore suggest that dietary AGE ingestion is a potential cause of accelerated spinal aging, especially in females.
Table 4. Values of p From Two-Way ANOVA Results for Trabecular and Cortical Bone Quantity and Quality From μCT Analysis.
| Diet: Age (p) | Diet: Sex (p) | ||||||||||||
|---|---|---|---|---|---|---|---|---|---|---|---|---|---|
|
|
|
||||||||||||
| 6 months | 18 months | Female | Male | ||||||||||
|
|
|
|
|
||||||||||
| Interact | Diet | Sex | Interact | Diet | Sex | Interact | Diet | Age | Interact | Diet | Age | ||
| Trabecular | Tb.Th (mm) | 0.037 | 0.590 | 0.487 | 0.626 | 0.181 | 0.579 | 0.619 | 0.094 | 0.014 | 0.066 | 0.741 | 0.156 |
| Tb.N (1/mm) | 0.9120 | 0.032 | <0.001 | 0.675 | 0.362 | <0.001 | 0.918 | 0.122 | <0.001 | 0.521 | 0.239 | <0.001 | |
| Tb.Sp (mm) | 0.589 | 0.070 | <0.001 | 0.626 | 0.567 | <0.001 | 0.934 | 0.297 | <0.001 | 0.608 | 0.509 | <0.001 | |
| Tb.BS/BV (mm−1) | 0.041 | 0.693 | 0.552 | 0.910 | 0.113 | 0.234 | 0.618 | 0.016 | 0.651 | 0.155 | 0.984 | 0.384 | |
| Tb.DA ([]) | 0.891 | 0.460 | <0.001 | 0.820 | 0.903 | 0.986 | 0.707 | 0.875 | 0.413 | 0.794 | 0.603 | <0.001 | |
| Tb.TMD (g HA/cm3) | 0.0550 | 0.810 | 0.981 | 0.384 | 0.140 | 0.158 | 0.842 | 0.033 | 0.002 | 0.261 | 0.628 | <0.001 | |
| Tb.BMD (g/cm3) | 0.206 | 0.203 | <0.001 | 0.680 | 0.090 | <0.001 | 0.910 | 0.015 | <0.001 | 0.527 | 0.523 | 0.003 | |
| Tb.BV/TV (%) | 0.298 | 0.214 | <0.001 | 0.893 | 0.213 | <0.001 | 0.771 | 0.059 | <0.001 | 0.640 | 0.526 | <0.001 | |
| Cortical | Ct.BS/BV (mm−1) | 0.011 | 0.944 | <0.001 | 0.388 | 0.608 | 0.001 | 0.127 | 0.259 | <0.001 | 0.087 | 0.695 | <0.001 |
| Ct.TMD (g HA/cm3) | 0.132 | 0.850 | 0.001 | 0.942 | <0.001 | 0.606 | 0.290 | 0.002 | 0.001 | 0.007 | 0.236 | 0.510 | |
| Ct.BMD (g/cm3) | 0.159 | 0.992 | 0.001 | 0.955 | <0.001 | 0.613 | 0.202 | 0.004 | <0.001 | 0.010 | 0.281 | 0.842 | |
| Ct.Th (mm) | 0.023 | 0.823 | <0.001 | 0.863 | 0.907 | 0.015 | 0.206 | 0.227 | <0.001 | 0.256 | 0.395 | 0.001 | |
| Tt.Ar (mm2) | 0.174 | <0.001 | 0.958 | 0.321 | 0.169 | 0.612 | 0.752 | 0.133 | 0.097 | 0.235 | 0.494 | 0.003 | |
Bold values are signifcant.
Tb.Th = trabecular thickness; Tb.N = trabecular number; Tb.Sp=trabecular separation; Tb.BS/BV=trabecular bone surface to volume ratio; Tb. DA = trabecular degree of anisotropy; Tb.TMD= trabecular tissue mineral density; Tb.BMD =trabecular bone mineral density; Tb.BV/TV =trabecular bone volume density; Ct.BS/BV = cortical bone surface to volume ratio; Ct.TMD =cortical tissue mineral density; Ct.BMD= cortical bone mineral density; Ct.Th = cortical thickness; Tt.Ar=cortical total area.
Acknowledgments
We thank Ariel Harned and Dr. Luis Cardoso for their technical assistance.
Authors' roles: SIJ designed and planned the study, performed and analyzed experiments, wrote the manuscript and was involved in all aspects of the submission. PPM designed, performed and analyzed experiments and was involved in manuscript preparation. WFK performed and analyzed experiments and was involved in manuscript preparation. XC and GES developed assays, performed experiments, reviewed and edited the manuscript. DV analyzed and interpreted data, reviewed and edited the manuscript. JCI designed and planned the study, analyzed and interpreted data, and reviewed and edited the manuscript.
Disclosures: This work was supported by NIH/NIAMS (R01 AR069315-01A1) and the North American Spine Society.
References
- 1.Vos T, Flaxman AD, Naghavi M, et al. Years lived with disability (YLDs) for 1160 sequelae of 289 diseases and injuries 1990-2010: a systematic analysis for the Global Burden of Disease Study 2010. Lancet. 2012;380(9859):2163–96. doi: 10.1016/S0140-6736(12)61729-2. [DOI] [PMC free article] [PubMed] [Google Scholar]
- 2.Docking RE, Fleming J, Brayne C, Zhao J, Macfarlane GJ, Jones GT. Epidemiology of back pain in older adults: prevalence and risk factors for back pain onset. Rheumatology (Oxford) 2011;50(9):1645–53. doi: 10.1093/rheumatology/ker175. [DOI] [PubMed] [Google Scholar]
- 3.Pasco JA, Sanders KM, Hoekstra FM, Henry MJ, Nicholson GC, Kotowicz MA. The human cost of fracture. Osteoporos Int. 2005;16(12):2046–52. doi: 10.1007/s00198-005-1997-y. [DOI] [PubMed] [Google Scholar]
- 4.Samartzis D, Karppinen J, Chan D, Luk KD, Cheung KM. The association of lumbar intervertebral disc degeneration on magnetic resonance imaging with body mass index in overweight and obese adults: a population-based study. Arthritis Rheum. 2012;64(5):1488–96. doi: 10.1002/art.33462. [DOI] [PubMed] [Google Scholar]
- 5.Suri P, Boyko EJ, Smith NL, et al. Modifiable risk factors for chronic back pain: insights using the co-twin control design. Spine J. 2017;17(1):4–14. doi: 10.1016/j.spinee.2016.07.533. [DOI] [PMC free article] [PubMed] [Google Scholar]
- 6.Fields AJ, Berg-Johansen B, Metz LN, et al. Alterations in intervertebral disc composition, matrix homeostasis and bio-mechanical behavior in the UCD-T2DM rat model of type 2 diabetes. J Orthop Res. 2015;33(5):738–46. doi: 10.1002/jor.22807. [DOI] [PMC free article] [PubMed] [Google Scholar]
- 7.Illien-Junger S, Grosjean F, Laudier DM, Vlassara H, Striker GE, Iatridis JC. Combined anti-inflammatory and anti-AGE drug treatments have a protective effect on intervertebral discs in mice with diabetes. PLoS One. 2013;8(5):e64302. doi: 10.1371/journal.pone.0064302. [DOI] [PMC free article] [PubMed] [Google Scholar]
- 8.Vlassara H, Striker GE. AGE restriction in diabetes mellitus: a paradigm shift. Nat Rev Endocrinol. 2011;7(9):526–39. doi: 10.1038/nrendo.2011.74. [DOI] [PMC free article] [PubMed] [Google Scholar]
- 9.Uribarri J, Woodruff S, Goodman S, et al. Advanced glycation end products in foods and a practical guide to their reduction in the diet. J Am Diet Assoc. 2010;110(6):911–16e12. doi: 10.1016/j.jada.2010.03.018. [DOI] [PMC free article] [PubMed] [Google Scholar]
- 10.Willett TL, Pasquale J, Grynpas MD. Collagen modifications in postmenopausal osteoporosis: advanced glycation endproducts may affect bone volume, structure and quality. Curr Osteoporos Rep. 2014;12(3):329–37. doi: 10.1007/s11914-014-0214-3. [DOI] [PubMed] [Google Scholar]
- 11.Viguet-Carrin S, Roux JP, Arlot ME, et al. Contribution of the advanced glycation end product pentosidine and of maturation of type I collagen to compressive biomechanical properties of human lumbar vertebrae. Bone. 2006;39(5):1073–9. doi: 10.1016/j.bone.2006.05.013. [DOI] [PubMed] [Google Scholar]
- 12.Tang SY, Zeenath U, Vashishth D. Effects of non-enzymatic glycation on cancellous bone fragility. Bone. 2007;40(4):1144–51. doi: 10.1016/j.bone.2006.12.056. [DOI] [PMC free article] [PubMed] [Google Scholar]
- 13.Vashishth D, Gibson GJ, Khoury JI, Schaffler MB, Kimura J, Fyhrie DP. Influence of nonenzymatic glycation on biomechanical properties of cortical bone. Bone. 2001;28(2):195–201. doi: 10.1016/s8756-3282(00)00434-8. [DOI] [PubMed] [Google Scholar]
- 14.Jazini E, Sharan AD, Morse LJ, et al. Alterations in T2 relaxation magnetic resonance imaging of the ovine intervertebral disc due to nonenzymatic glycation. Spine. 2012;37(4):E209–15. doi: 10.1097/BRS.0b013e31822ce81f. [DOI] [PMC free article] [PubMed] [Google Scholar]
- 15.Odetti P, Rossi S, Monacelli F, et al. Advanced glycation end products and bone loss during aging. Ann N Y Acad Sci. 2005;1043:710–7. doi: 10.1196/annals.1333.082. [DOI] [PubMed] [Google Scholar]
- 16.Hein G, Wiegand R, Lehmann G, Stein G, Franke S. Advanced glycation end-products pentosidine and N epsilon-carboxymethyl-lysine are elevated in serum of patients with osteoporosis. Rheumatology (Oxford) 2003;42(10):1242–6. doi: 10.1093/rheumatology/keg324. [DOI] [PubMed] [Google Scholar]
- 17.Saito M, Marumo K, Fujii K, Ishioka N. Single-column high-performance liquid chromatographic-fluorescence detection of immature, mature, and senescent cross-links of collagen. Anal Biochem. 1997;253(1):26–32. doi: 10.1006/abio.1997.2350. [DOI] [PubMed] [Google Scholar]
- 18.de Paula FJA, Horowitz MC, Rosen CJ. Novel insights into the relationship between diabetes and osteoporosis. Diabetes-Metab Res. 2010;26(8):622–30. doi: 10.1002/dmrr.1135. [DOI] [PMC free article] [PubMed] [Google Scholar]
- 19.Yamamoto M, Yamaguchi T, Yamauchi M, Yano S, Sugimoto T. Serum pentosidine levels are positively associated with the presence of vertebral fractures in postmenopausal women with type 2 diabetes. J Clin Endocrinol Metab. 2008;93(3):1013–9. doi: 10.1210/jc.2007-1270. [DOI] [PubMed] [Google Scholar]
- 20.Anekstein Y, Smorgick Y, Lotan R, et al. Diabetes mellitus as a risk factor for the development of lumbar spinal stenosis. Isr Med Assoc J. 2010;12(1):16–20. [PubMed] [Google Scholar]
- 21.Ballotari P, Venturelli F, Greci M, Giorgi Rossi P, Manicardi V. Sex differences in the effect of type 2 diabetes on major cardiovascular diseases: results from a population-based study in Italy. Int J Endocrinol. 2017;2017:6039356. doi: 10.1155/2017/6039356. [DOI] [PMC free article] [PubMed] [Google Scholar]
- 22.Russo GT, Giandalia A, Romeo EL, et al. Fracture risk in type 2 diabetes: current perspectives and gender differences. Int J Endocrinol. 2016;2016:1615735. doi: 10.1155/2016/1615735. [DOI] [PMC free article] [PubMed] [Google Scholar]
- 23.Illien-Junger S, Lu Y, Qureshi SA, et al. Chronic ingestion of advanced glycation end products induces degenerative spinal changes and hypertrophy in aging pre-diabetic mice. PLoS One. 2015;10(2):e0116625. doi: 10.1371/journal.pone.0116625. [DOI] [PMC free article] [PubMed] [Google Scholar]
- 24.Viguet-Carrin S, Follet H, Gineyts E, et al. Association between collagen cross-links and trabecular microarchitecture properties of human vertebral bone. Bone. 2010;46(2):342–7. doi: 10.1016/j.bone.2009.10.001. [DOI] [PubMed] [Google Scholar]
- 25.Koschinsky T, He CJ, Mitsuhashi T, et al. Orally absorbed reactive glycation products (glycotoxins): an environmental risk factor in diabetic nephropathy. Proc Natl Acad Sci U S A. 1997;94(12):6474–9. doi: 10.1073/pnas.94.12.6474. [DOI] [PMC free article] [PubMed] [Google Scholar]
- 26.Mikulikova K, Eckhardt A, Kunes J, Zicha J, Miksik I. Advanced glycation end-product pentosidine accumulates in various tissues of rats with high fructose intake. Physiol Res. 2008;57(1):89–94. doi: 10.33549/physiolres.931093. [DOI] [PubMed] [Google Scholar]
- 27.Yamamoto T, Ozono K, Miyauchi A, et al. Role of advanced glycation end products in adynamic bone disease in patients with diabetic nephropathy. Am J Kidney Dis. 2001;38(4 Suppl 1):S161–4. doi: 10.1053/ajkd.2001.27428. [DOI] [PubMed] [Google Scholar]
- 28.Ganeko K, Masaki C, Shibata Y, et al. Bone aging by advanced glycation end products: a multiscale mechanical analysis. J Dent Res. 2015;94(12):1684–90. doi: 10.1177/0022034515602214. [DOI] [PubMed] [Google Scholar]
- 29.Delgado-Andrade C, Roncero-Ramos I, Carballo J, Rufian-Henares J, Seiquer I, Navarro MP. Composition and functionality of bone affected by dietary glycated compounds. Food Funct. 2013;4(4):549–56. doi: 10.1039/c2fo30187c. [DOI] [PubMed] [Google Scholar]
- 30.Patel R, Baker SS, Liu W, et al. Effect of dietary advanced glycation end products on mouse liver. PLoS One. 2012;7(4):e35143. doi: 10.1371/journal.pone.0035143. [DOI] [PMC free article] [PubMed] [Google Scholar]
- 31.Leach MC, Main DCJ. An assessment of laboratory mouse welfare in UK animal units. Anim Welf. 2008;17(2):171–87. [Google Scholar]
- 32.Cowin SC. The Relationship between the elasticity tensor and the fabric tensor. Mech Mater. 1985;4(2):137–47. doi: 10.1016/j.mechmat.2012.07.004. [DOI] [PMC free article] [PubMed] [Google Scholar]
- 33.Akhter MP, Otero JK, Iwaniec UT, Cullen DM, Haynatzki GR, Recker RR. Differences in vertebral structure and strength of inbred female mouse strains. J Musculoskelet Neuronal Interact. 2004;4(1):33–40. [PubMed] [Google Scholar]
- 34.Tommasini SM, Morgan TG, van der Meulen MCH, Jepsen KJ. Genetic variation in structure-function relationships for the inbred mouse lumbar vertebral body. J Bone Miner Res. 2005;20(5):817–27. doi: 10.1359/JBMR.041234. [DOI] [PubMed] [Google Scholar]
- 35.Kabel J, van Rietbergen B, Odgaard A, Huiskes R. Constitutive relationships of fabric, density, and elastic properties in cancellous bone architecture. Bone. 1999;25(4):481–6. doi: 10.1016/s8756-3282(99)00190-8. [DOI] [PubMed] [Google Scholar]
- 36.Turner CH, Cowin SC, Rho JY, Ashman RB, Rice JC. The fabric dependence of the orthotropic elastic constants of cancellous bone. J Biomech. 1990;23(6):549–61. doi: 10.1016/0021-9290(90)90048-8. [DOI] [PubMed] [Google Scholar]
- 37.Wagner DW, Lindsey DP, Beaupre GS. Deriving tissue density and elastic modulus from microCT bone scans. Bone. 2011;49(5):931–8. doi: 10.1016/j.bone.2011.07.021. [DOI] [PubMed] [Google Scholar]
- 38.The Jackson Laboratory. Body weight information for C57BL/6J. Bar Harbor, ME: The Jackson Laboratory; 2016. Available from: https://www.jax.org/jax-mice-and-services/strain-data-sheet-pages/body-weight-chart-000664. [Google Scholar]
- 39.Palimeri S, Palioura E, Diamanti-Kandarakis E. Current perspectives on the health risks associated with the consumption of advanced glycation end products: recommendations for dietary management. Diabetes Metab Syndr Obes. 2015;8:415–26. doi: 10.2147/DMSO.S63089. [DOI] [PMC free article] [PubMed] [Google Scholar]
- 40.Vos PA, Mastbergen SC, Huisman AM, et al. In end stage osteoarthritis, cartilage tissue pentosidine levels are inversely related to parameters of cartilage damage. Osteoarthritis Cartilage. 2012;20(3):233–40. doi: 10.1016/j.joca.2011.12.007. [DOI] [PubMed] [Google Scholar]
- 41.Sellam J, Berenbaum F. Is osteoarthritis a metabolic disease? Joint Bone Spine. 2013;80(6):568–73. doi: 10.1016/j.jbspin.2013.09.007. [DOI] [PubMed] [Google Scholar]
- 42.Wang Z, Jiang Y, Liu N, et al. Advanced glycation end-product Nepsilon-carboxymethyl-Lysine accelerates progression of atherosclerotic calcification in diabetes. Atherosclerosis. 2012;221(2):387–96. doi: 10.1016/j.atherosclerosis.2012.01.019. [DOI] [PubMed] [Google Scholar]
- 43.Peppa M, Brem H, Ehrlich P, et al. Adverse effects of dietary glycotoxins on wound healing in genetically diabetic mice. Diabetes. 2003;52(11):2805–13. doi: 10.2337/diabetes.52.11.2805. [DOI] [PubMed] [Google Scholar]
- 44.Cai W, Ramdas M, Zhu L, Chen X, Striker GE, Vlassara H. Oral advanced glycation endproducts (AGEs) promote insulin resistance and diabetes by depleting the antioxidant defenses AGE receptor-1 and sirtuin 1. Proc Natl Acad Sci U S A. 2012;109(39):15888–93. doi: 10.1073/pnas.1205847109. [DOI] [PMC free article] [PubMed] [Google Scholar]
- 45.Roncero-Ramos I, Delgado-Andrade C, Rufian-Henares JA, Carballo J, Navarro MP. Effects of model Maillard compounds on bone characteristics and functionality. J Sci Food Agric. 2013;93(11):2816–21. doi: 10.1002/jsfa.6107. [DOI] [PubMed] [Google Scholar]
- 46.Ionova-Martin SS, Wade JM, Tang S, et al. Changes in cortical bone response to high-fat diet from adolescence to adulthood in mice. Osteoporos Int. 2011;22(8):2283–93. doi: 10.1007/s00198-010-1432-x. [DOI] [PMC free article] [PubMed] [Google Scholar]
- 47.Kanis JA. Diagnosis of osteoporosis and assessment of fracture risk. Lancet. 2002;359(9321):1929–36. doi: 10.1016/S0140-6736(02)08761-5. [DOI] [PubMed] [Google Scholar]
- 48.Turner CH. Biomechanics of bone: determinants of skeletal fragility and bone quality. Osteoporos Int. 2002;13(2):97–104. doi: 10.1007/s001980200000. [DOI] [PubMed] [Google Scholar]
- 49.Griffith JF, Genant HK. Bone mass and architecture determination: state of the art. Best Pract Res Clin Endocrinol Metab. 2008;22(5):737–64. doi: 10.1016/j.beem.2008.07.003. [DOI] [PubMed] [Google Scholar]
- 50.Jalava T, Sarna S, Pylkkanen L, et al. Association between vertebral fracture and increased mortality in osteoporotic patients. J Bone Miner Res. 2003;18(7):1254–60. doi: 10.1359/jbmr.2003.18.7.1254. [DOI] [PubMed] [Google Scholar]
- 51.Center JR, Nguyen TV, Schneider D, Sambrook PN, Eisman JA. Mortality after all major types of osteoporotic fracture in men and women: an observational study. Lancet. 1999;353(9156):878–82. doi: 10.1016/S0140-6736(98)09075-8. [DOI] [PubMed] [Google Scholar]
- 52.Vashishth D. Advanced glycation end-products and bone fractures. IBMS Bonekey. 2009;6(8):268–78. doi: 10.1138/20090390. [DOI] [PMC free article] [PubMed] [Google Scholar]
- 53.Ames JM. Determination of N epsilon-(carboxymethyl)lysine in foods and related systems. Ann N Y Acad Sci. 2008;1126:20–4. doi: 10.1196/annals.1433.030. [DOI] [PubMed] [Google Scholar]
- 54.Leslie WD, Morin SN, Lix LM, Majumdar SR. Does diabetes modify the effect of FRAX risk factors for predicting major osteoporotic and hip fracture? Osteoporos Int. 2014;25(12):2817–24. doi: 10.1007/s00198-014-2822-2. [DOI] [PubMed] [Google Scholar]
- 55.Yang DH, Chiang TI, Chang IC, Lin FH, Wei CC, Cheng YW. Increased levels of circulating advanced glycation end-products in meno-pausal women with osteoporosis. Int J Med Sci. 2014;11(5):453–60. doi: 10.7150/ijms.8172. [DOI] [PMC free article] [PubMed] [Google Scholar]
- 56.Willinghamm MD, Brodt MD, Lee KL, Stephens AL, Ye J, Silva MJ. Age-related changes in bone structure and strength in female and male BALB/c mice. Calcif Tissue Int. 2010;86(6):470–83. doi: 10.1007/s00223-010-9359-y. [DOI] [PMC free article] [PubMed] [Google Scholar]
- 57.Sanguineti R, Storace D, Monacelli F, Federici A, Odetti P. Pentosidine effects on human osteoblasts in vitro. Ann N Y Acad Sci. 2008;1126:166–72. doi: 10.1196/annals.1433.044. [DOI] [PubMed] [Google Scholar]
- 58.Valcourt U, Merle B, Gineyts E, Viguet-Carrin S, Delmas PD, Garnero P. Non-enzymatic glycation of bone collagen modifies osteoclastic activity and differentiation. J Biol Chem. 2007;282(8):5691–703. doi: 10.1074/jbc.M610536200. [DOI] [PubMed] [Google Scholar]
- 59.Nyman JS, Roy A, Tyler JH, Acuna RL, Gayle HJ, Wang X. Age-related factors affecting the postyield energy dissipation of human cortical bone. J Orthop Res. 2007;25(5):646–55. doi: 10.1002/jor.20337. [DOI] [PMC free article] [PubMed] [Google Scholar]
- 60.Wang X, Shen X, Li X, Agrawal CM. Age-related changes in the collagen network and toughness of bone. Bone. 2002;31(1):1–7. doi: 10.1016/s8756-3282(01)00697-4. [DOI] [PubMed] [Google Scholar]
- 61.Chatzigeorgiou A, Kandaraki E, Piperi C, et al. Dietary glycotoxins affect scavenger receptor expression and the hormonal profile of female rats. J Endocrinol. 2013;218(3):331–7. doi: 10.1530/JOE-13-0175. [DOI] [PubMed] [Google Scholar]