

Abstract
Speed JS, Hyndman KA, Roth K, Heimlich JB, Kasztan M, Fox BM, Johnston JG, Becker BK, Jin C, Gamble KL, Young ME, Pollock JS, Pollock DM. High dietary sodium causes dyssynchrony of the renal molecular clock in rats. Am J Physiol Renal Physiol 314: F89–F98, 2018. First published September 27, 2017; doi:10.1152/ajprenal.00028.2017.—Dyssynchrony of circadian rhythms is associated with various disorders, including cardiovascular and metabolic diseases. The cell autonomous molecular clock maintains circadian control; however, environmental factors that may cause circadian dyssynchrony either within or between organ systems are poorly understood. Our laboratory recently reported that the endothelin (ET-1) B (ETB) receptor functions to facilitate Na+ excretion in a time of day-dependent manner. Therefore, the present study was designed to determine whether high salt (HS) intake leads to circadian dyssynchrony within the kidney and whether the renal endothelin system contributes to control of the renal molecular clock. We observed that HS feeding led to region-specific alterations in circadian clock components within the kidney. For instance, HS caused a significant 5.5-h phase delay in the peak expression of Bmal1 and suppressed Cry1 and Per2 expression in the renal inner medulla, but not the renal cortex, of control rats. The phase delay in Bmal1 expression appears to be mediated by ET-1 because this phenomenon was not observed in the ETB-deficient rat. In cultured inner medullary collecting duct cells, ET-1 suppressed Bmal1 mRNA expression. Furthermore, Bmal1 knockdown in these cells reduced epithelial Na+ channel expression. These data reveal that HS feeding leads to intrarenal circadian dyssynchrony mediated, in part, through activation of ETB receptors within the renal inner medulla.
Keywords: circadian rhythm, dyssynchrony, Bmal1, kidney, salt
INTRODUCTION
High salt (HS) intake is associated with hypertension and cardiovascular disease (CVD), and a recent global study attributed one out of five premature deaths caused by CVD to HS intake (19). The kidney is the organ ultimately responsible for maintaining Na+ balance, and, in chronic, steady-state situations, renal excretion of Na+ follows a diurnal rhythm that is independent of the timing of Na+ intake (18). Studies from the past 15–20 yr have clearly demonstrated that HS intake stimulates renal endothelin 1 (ET-1) production and activation of the ETB receptor to inhibit Na+ reabsorption, especially in the inner medullary collecting duct, to promote natriuresis. In rats lacking functional ETB receptors, we recently demonstrated a delayed natriuresis following an acute NaCl load (15). However, the degree of delay was dependent on the time of day when salt was given, suggesting a relationship between ETB-dependent natriuresis and diurnal control of Na+ excretion.
Intrinsic, cell autonomous molecular clocks consisting of a system of oscillating transcription factors mediate physiological rhythms (25). Molecular clocks are controlled by a number of negative and positive feedback loops (25). The suprachiasmatic nucleus of the hypothalamus contains the central clock, which is controlled by external light cues transmitted from the retina. The central clock is thought to synchronize the timing of the local or peripheral clocks; however, peripheral clocks are controlled by a variety of other zeitgeber (cues) independent of light, such as food intake or activity. Core components of the cell autonomous clocks in mammals are two transcription factors, aryl hydrocarbon receptor nuclear translocator-like protein (Arntl1, also called Bmal1) and circadian locomotor output cycles kaput (CLOCK). These proteins heterodimerize and drive the transcription of Period (Per) and Cryptochrome (Cry), which subsequently feed back to inhibit their own transcription by interfering with the binding of Bmal1 and CLOCK to E-box response elements located in the promoter region of each gene (21). Local or peripheral clocks exist in every cell type and help regulate tissue-specific function by affecting transcription of output genes. Within the kidney, clock genes modulate renal excretory function by controlling the expression and/or activity of Na+ channels and transporters (6, 7, 24). For example, Bmal1 knockout mice have a complete loss in diurnal variability in Na+ excretion (37). This is in part due to loss of Bmal1 function in the kidney because knockout of Bmal1 from renin-secreting cells results in a loss of a diurnal pattern of Na+ excretion (32). Taken together, these data indicate the importance of renal Bmal1 in the regulation of renal excretory function. However, it is unclear how external cues, such as HS diet, may regulate Bmal1 expression and renal salt handling.
Little is known about the relationship between salt intake and the renal molecular clock. Studies from the Gumz laboratory have demonstrated that Per1 facilitates the ability of aldosterone to increase Na+ reabsorption (7). Two recent studies from the Firsov group demonstrate a role for Bmal1 in regulating renal tubular function (20, 32). Overall, these findings suggest that activity of the renal molecular clock genes serves primarily to conserve Na+. However, neither of these groups has explored the role of the clock in response to an HS diet. Therefore, the present study was designed to test the hypothesis that HS intake impairs Bmal1 function through an ET-1-dependent mechanism to facilitate Na+ excretion and maintain long-term balance. Experiments utilized in vivo studies with a novel ETB receptor-deficient and transgenic control rat model on normal salt (NS) and HS diets as well as in vitro studies with cultured inner medullary collecting duct cells.
METHODS
The Institutional Animal Care and Use Committee at the University of Alabama at Birmingham approved all protocols in accordance with the NIH Guide for the Care and Use of Laboratory Animals. Male ETB-deficient rats (ETB def) or transgenic control (control) littermates 12–14 wk of age were obtained from our in-house colony (5). The ETB def strain was developed from a rat that has a naturally occurring mutation within the ETB receptor gene rendering it nonfunctional (5). Without the receptor, the enteric nervous system does not develop, leading to megacolon; therefore, the strain was “rescued” by inserting a functional receptor transgene into sympathetic tissues under the control of the dopamine beta hydroxylase promoter. The control littermates have functional ETB receptors expressed throughout the body and also express the transgene. Animals were fed a normal (0.2% Na+, TD.96208), or high (1.6% Na+, TD.92034) Na+ diet (Envigo, Indianapolis, IN) with free access to water. Rats were housed in temperature- and humidity-controlled, 12-h:12-h light/dark cycles.
Circadian clock gene study.
Control or ETB def rats were maintained on NS or placed on HS diet for 14 days. Rats were euthanized in 4-h intervals starting at ZT0, which is when the lights come on at 7:00 AM. Blood was collected in heparinized tubes, and plasma was immediately separated by centrifugation at 1,000 g for 10 min and snap frozen. Kidneys were removed, and cortex and inner medulla were then dissected and snap frozen in liquid nitrogen. Samples were stored at −80°C until analyses were performed. Plasma aldosterone was measured by EIA (Cayman Chemical, Ann Arbor, MI). Plasma ET-1 was measured by ELISA (QuantiGlo; R&D Systems, Minneapolis, MN).
Urinary ET-1 excretion.
Separate groups of control and ETB def rats were placed on an NS or HS diet for 14 days, before being placed in metabolic cages for urine collection. Animals were acclimated to the cages for 2 days before the urine collection. Collections and measurements were made from time periods ZT0-ZT12 (lights on, inactive phase) and ZT12-ZT24 (lights off, active phase). Urinary ET-1 concentration was measured by ELISA (QuantiGlo; R&D Systems). ET-1 concentration was multiplied by urine volume to determine excretion rate.
Quantitative real-time PCR.
A sample (50 mg) of cortical tissue or one renal inner medulla was homogenized in Trizol reagent, and RNA was extracted according to manufacturer’s instructions (ThermoFisher, Waltham, MA). Reverse transcription was carried out with 1 μg of mRNA using Bio-Rad cDNA synthesis kit (no. 1708891; Hercules, CA). Quantitative real-time PCR was performed on Bio-Rad CFX96 real-time apparatus using iTaq Universal Probes Supermix (no. 1725131; Bio-Rad). TaqMan gene expression assays (ThermoFisher) or custom primer and probe sets were purchased from IDT (Coralville, IA). All primers and TaqMan gene assays are listed in Table 1. For rat clock gene expression, standard curves were generated using a known concentration of the specific amplicon, and copy number/ng RNA is reported (36). For αENaC (Scnn1a) and Klf15 in which standards were not available, 2-ΔΔcT method was used to calculate relative mRNA expression from the global mean cycle threshold of the specific gene of interest.
Table 1.
Primer and probe sequences for real-time PCR
| Forward Primer (5′→3′) | Reverse Primer (5′→3′) | Probe (56-Fam-5′→3′-TAMTSp) | |
|---|---|---|---|
| Bmal1 | TCCGATGACGAACTGAAACAC | CTCGGTCACATCCTACGACAA | CAAAAATCCATCTGCTGCCCTGAGAAT |
| Cry1 | CATCAACAGGTGGCGATTTT | CCCGAATCACAAACAGACGA | TTTAATTTTCGTAGATTGGCATCAAGATCCTCAAGA |
| Cry2 | GTGTGAATGCAGGCAGCTG | ACAGGGCAGTAGCAGTGGAA | ATGTGGCTGTCCTGCAGTGCTTTCTTC |
| Per1 | GGTTCAGGATCCCACGAAG | AAGAGTCGATGCTGCCAAAG | AGCACCTCAGCCAGCATCACCC |
| Per2 | GCAGCCTTTCGATTATTCTTC | GCTCCACGGGTTGATGAAG | ATTCGATTCCGCACACGCAACG |
| ThermoFisher TaqMan Assay Number | |||
|---|---|---|---|
| ET-1 | Rn00561129_m1 | ||
| αENaC | Rn00580652_m1 | ||
| KLF15 | Rn00585508_m1 | ||
mIMCD-3 experiments.
For the in vitro ET-1 studies, mIMCD-3 (ATCC, Manassas, VA) were grown to confluency on 12-well plates in Dulbecco’s Modified Eagle Medium nutrient mixture F-12 (DMEM/F-12) with 10% fetal bovine serum and 1% penicillin/streptomycin. Only passages 3–6 were used in this study. At confluency, cells were exposed to DMEM/F-12 with 25% FBS for 1 h. Immediately following, media was changed to DMEM/F-12 with 1% FBS and 50 μM phosphoramidon to inhibit endogenous ET-1. Cells were treated with either vehicle or 100 nM ET-1 for 4 h. Cells were lysed using buffer from RNAqueous microRNA kit (ThermoFisher Scientific), and RNA was isolated according to manufacturer’s protocol. Reverse transcription was carried out with cDNA synthesis kit (Bio-Rad).
Mouse Bmal1 knockdown experiments were performed with commercially available small interfering RNA (siRNA, sc-38166; Santa Cruz Biotechnology, Dallas, TX) and control scramble siRNA (sc-37007). mIMCD-3 cells were transfected using the reverse siRNA protocol of Invitrogen (Carlsbad, CA) with Lipofectamine RNAiMax in opti-MEM reduced serum medium. Twelve-well plates for confirmation of knockdown or mRNA analyses were transfected using 10 and 60 pmol of siRNA and 1 μl of RNAiMax. At 100% confluence, cells were collected for Western blot and mRNA analyses. All cell culture experiments were replicated on three different days with three different passages.
Western blot analysis.
Western blots of mIMCD-3 cells from the siRNA experiments were performed to confirm Bmal1 knockdown. Nuclear fractions of control and Bmal1 siRNA-treated cells were extracted using the Cayman Chemical nuclear extraction kit. Ten micrograms of nuclear extraction were separated by 8% SDS-PAGE and transferred to PVDF membranes. Bmal1 was detected by a goat anti-human Bmal1 (0.2 μg/ml, sc-8550; Santa Cruz Biotechnology) with donkey anti-goat IgG-Alexa Fluor 680 (ThermoFisher) by the Odyssey CLx (Li-Cor, Lincoln, NE).
Statistics and data analysis.
Circadian data were analyzed by cosinor analysis using Graph Pad Prism with the assumption of a 24-h period. With cosinor analysis, mesor represents the midline of a rhythmic curve, amplitude represents the difference between the peak of the rhythm and the mesor, and acrophase represents the time of day (zeitgeber time) in which the rhythm peaks. These values were compared between diets by extra sum of squares F test. A separate cosinor analysis was performed to compare genotypes of the same diet. Urinary excretion data were compared by two-way ANOVA followed by Tukey’s post hoc test. In vitro data were compared by Student’s t-test. Statistical significance was set at P < 0.05.
RESULTS
Renal and extrarenal ET-1 follows a diurnal rhythm.
We determined whether renal ET-1 production varies by the time of day. Urinary excretion of ET-1 is often used as an index of renal ET-1 production, so we measured ET-1 excretion during the 12-h light (inactive) and the 12-h dark (active) periods. In control rats, urinary excretion of ET-1 was significantly greater during the active period vs. the inactive period in both NS- and HS-fed rats (Fig. 1A, pinteraction = ns, ptime < 0.05, pdiet = ns). In contrast, ETB def rats on NS exhibited a loss of the day-night difference in renal ET-1 production. However, a diurnal pattern of ET-1 excretion was observed with HS feeding in ETB def rats similar to controls (Fig. 1B, pinteraction = ns, ptime < 0.05, pdiet = ns). We also determined renal inner medullary Edn1 mRNA levels in 4-h time periods. Renal inner medullary Edn1 mRNA was lower during the inactive period compared with the active period in control rats on NS (Fig. 1C). HS intake had no significant effect on Edn1 mRNA in either genotype (Fig. 1, C and D).
Fig. 1.

Renal and extrarenal endothelin-1 (ET-1) production follows a circadian rhythm. A and B: 12-h urinary ET-1 excretion (pg/12 h) in control or ETB-deficient (ETB def) rats fed either normal salt (NS n = 5 and 4, respectively) or high salt (HS, n = 6 and 4, respectively) diet for 2 wk. C and D: circadian expression pattern (relative to average global Ct) of ET-1 by the renal inner medulla in control and ETB def rats fed either NS or HS diet for 2 wk (n = 5). E and F: plasma ET-1 (pg/ml) in control and ETB def rats in 4-h intervals (n = 6). Symbols represent means ± SE, and lines represent cosinor analysis. *P < 0.05 vs. NS inactive; †P < 0.05 vs. HS inactive. See Table 2 for data from cosinor analysis.
We also measured plasma ET-1, which is highly sensitive to ETB receptor expression because of its ability to clear ET-1 from the circulation (22). Similar to previous publications, we found an ~10-fold higher concentration of ET-1 in the plasma of ETB def rats vs. control (11). Plasma ET-1 levels were analyzed by cosinor analysis to determine the mesor (midline of cosine curve), amplitude (peak minus trough), and acrophase (time of peak) (Table 2). In control rats, circulating ET-1 followed a circadian rhythm in which the amplitude was suppressed by HS intake (Fig. 1E and Table 2). The amplitude and mesor in plasma ET-1 were higher in ETB def rats compared with control, yet HS did not suppress the circadian rhythm of circulating ET-1 (Fig. 1F and Table 2).
Table 2.
| Normal Salt |
High Salt |
|||||
|---|---|---|---|---|---|---|
| Mesor | Amplitude | Acrophase | Mesor | Amplitude | Acrophase | |
| Control | ||||||
| Plasma ET-1 | 0.66 ± 0.02 | 0.10 ± 0.03 | 9.70 ± 0.30 | 0.67 ± 0.02 | 0.04 ± 0.03* | 10.60 ± 0.70 |
| Plasma Aldo | 966.00 ± 80.00 | 594.00 ± 107.00 | 13.30 ± 0.20 | 618.00 ± 51.00* | 247.00 ± 71.00* | 16.10 ± 0.30 |
| ETB Def | ||||||
| Plasma ET-1 | 6.80 ± 0.10† | 0.70 ± 0.20 | 9.90 ± 0.30 | 6.70 ± 0.20† | 1.00 ± 0.02 | 10.20 ± 0.20 |
| Plasma Aldo | 1,174.00 ± 99.00 | 565.00 ± 138.00 | 14.30 ± 0.30 | 701.00 ± 60.00* | 328.00 ± 93.00 | 17.70 ± 0.20* |
Data are presented as means ± SE. Units are pg/ml for endothelin-1 (ET-1) and aldosterone (Aldo). Units for acrophase are zeitgeber time. ETB def, ETB deficient.
P < 0.05 vs. NS.
P < 0.05 vs. control.
HS intake desynchronizes renal clocks.
To examine the potential impact of high Na+ intake on circadian rhythms of the renal molecular clock, we determined mRNA expression of the major clock genes in the renal inner medulla and cortex in response to HS intake over the course of 24 h. Male rats were euthanized in 4-h intervals, and kidneys were dissected to measure clock gene expression. Molecular clock gene expression patterns were analyzed by cosinor analysis (Table 3). In response to 2 wk of HS intake, control rats had a significant 5.5-h phase delay in Bmal1 expression in the inner medulla (Fig. 2A) but not in the renal cortex (Fig. 2C). In contrast, ETB def rats had similar Bmal1 expression when fed NS or HS diets (Fig. 2, B and D). There were no significant differences in the expression of CLOCK in response to HS in either genotype (Fig. 2, E–I).
Table 3.
| Normal Salt |
High Salt |
|||||
|---|---|---|---|---|---|---|
| Mesor | Amplitude | Acrophase | Mesor | Amplitude | Acrophase | |
| Control | ||||||
| Bmal1 | 275.00 ± 12.00 | 232.00 ± 30.00 | 23.70 ± 0.10 | 302.00 ± 16.00 | 308.00 ± 32.00 | 5.30 ± 0.10* |
| Clock | 10,113.00 ± 331.00 | 453.00 ± 493.00 | 17.00 ± 1.00 | 11,097.00 ± 397.00 | 1,402.00 ± 588.00 | 6.90 ± 0.90 |
| Cry1 | 226.00 ± 19.00 | 268.00 ± 56.00 | 19.60 ± 0.20 | 157.00 ± 10.00* | 130.00 ± 28.00* | 20.30 ± 0.20 |
| Cry2 | 1,490.00 ± 56.00 | 872.00 ± 152.00 | 13.50 ± 0.20 | 1,440.00 ± 70.00 | 666.00 ± 198.00 | 14.40 ± 0.30 |
| Per1 | 197.50 ± 18.00 | 202.00 ± 50.00 | 14.80 ± 0.30 | 204.00 ± 18.00 | 214.00 ± 48.00 | 13.40 ± 0.20 |
| Per2 | 230.00 ± 11.00 | 304.00 ± 32.00 | 14.80 ± 0.10 | 176.00 ± 8.00* | 206.00 ± 24.00* | 15.10 ± 0.10 |
| Klf15 | 1.20 ± 0.08 | 0.59 ± 0.12 | 15.70 ± 0.20 | 0.77 ± 0.06 | 0.29 ± 0.08 | 13.80 ± 0.30 |
| Edn1 | 1.06 ± 0.06 | 0.20 ± 0.08 | 3.30 ± 0.40 | 1.10 ± 0.07 | 0.20 ± 0.09 | 20.30 ± 0.50 |
| αENaC | 1.38 ± 0.12 | 0.63 ± 0.18 | 16.80 ± 0.30 | 0.80 ± 0.07* | 0.28 ± 0.10* | 16.20 ± 0.30 |
| ETB Def | ||||||
| Bmal1 | 295.00 ± 17.00 | 496.00 ± 42.00 | 23.90 ± 0.10 | 315.00 ± 15.00 | 354.00 ± 40.00 | 23.60 ± 0.10 |
| Clock | 10,411.00 ± 379.00 | 1,090.00 ± 553.00 | 19.90 ± 0.50 | 11,418.00 ± 379.00 | 1,661.00 ± 491.00 | 0.10 ± 0.40 |
| Cry1 | 236.00 ± 18.00 | 126.00 ± 36.00 | 20.50 ± 0.20 | 170.00 ± 12.00* | 126.00 ± 36.00* | 20.20 ± 0.20 |
| Cry2 | 1,515.00 ± 70.00 | 692.00 ± 192.00 | 14.70 ± 0.30 | 1,482.00 ± 51.00 | 526.00 ± 138.00 | 14.70 ± 0.30 |
| Per1 | 221.00 ± 20.00 | 250.00 ± 66.00 | 15.00 ± 0.20 | 197.00 ± 18.00 | 252.00 ± 50.00 | 14.90 ± 0.20 |
| Per2 | 253.00 ± 9.00 | 278.00 ± 24.00 | 14.90 ± 0.10 | 190.00 ± 7.00* | 220.00 ± 20.00 | 14.80 ± 0.10 |
| Klf15 | 1.77 ± 0.13 | 1.20 ± 0.18 | 14.40 ± 0.20 | 0.99 ± 0.06 | 0.21 ± 0.08 | 14.10 ± 0.40 |
| Edn1 | 0.87 ± 0.04 | 0.30 ± 0.05 | 21.00 ± 0.20 | 1.00 ± 0.07 | 0.30 ± 0.09 | 23.50 ± 0.40 |
| αENaC | 1.96 ± 0.18† | 1.23 ± 0.26 | 16.40 ± 0.20 | 1.14 ± 0.11*† | 0.43 ± 0.17* | 17.20 ± 0.30 |
Data are presented as mean ± SE; n = 5 or 6. Units for mesor and amplitude are copy number/ng RNA for Bmal1, Clock, Cry1, Cry2, Per1, and Per2. Relative expression for Klf15, Edn1, and αENaC is shown. Units for acrophase: zeitgeber time. ETB def, ETB deficient.
P < 0.05 vs. NS.
P < 0.05 vs. control.
Fig. 2.

High salt intake desynchronizes kidney clocks via ETB receptors. mRNA expression (copy count) in 4-h intervals of renal medullary Bmal1 (A and B, n = 5–6), renal cortical Bmal1 (C and D, n = 5), renal inner medullary Clock (E and F, n = 5–6), and renal cortical Clock (G and H, n = 5) of control and ETB-deficient (ETB def) rats that have been maintained on normal or high salt diet for 2 wk is shown. Symbols represent means ± SE, and lines represent cosinor analysis. *P < 0.05 for acrophase. See Table 2 for data from cosinor analysis.
HS intake also altered expression of other key clock genes in both ETB def and control rats. In both control and ETB def rats fed HS, inner medullary Cry1 (Fig. 3, A and B, respectively) and Per2 (Fig. 3, G and H, respectively), expression was significantly suppressed at ZT16 compared with NS-fed rats (Table 3 for cosinor analysis). Expression of these clock genes was similar in ETB def rats compared with controls whether fed NS or HS. No difference was found in Cry2 (Fig. 3, C and D) or Per1 (Fig. 3, E and F) expression in either genotype or in response to HS intake. Kruppel-like Factor 15 (Klf15), thought to be under the control of Bmal1 (12), was also suppressed in the inner medulla by HS in both genotypes (Fig. 3, I and J). Expression of all clock genes was similar in the renal cortex between genotype and salt treatment (Fig. 4). Collectively, these data indicate that clock genes are regulated by HS intake specifically in the renal medulla and reveal a clear dyssynchrony of the molecular clock between different regions of the kidney. These results further suggest a role for the ETB receptor in modulating Bmal1 function during conditions of HS intake.
Fig. 3.

High salt (HS) intake dissociates molecular clock components independent of ETB receptor activation. mRNA expression (copy count, n = 5–6) in 4-h intervals of Cry1 (A and B), Cry2 (C and D), Per1 (E and F), Per2 (G and H), and Klf15 (I and J) in the renal inner medulla of control and ETB-deficient (ETB def) rats maintained on normal salt or HS diet for 2 wk is shown. Symbols represent means ± SE, and lines represent cosinor analysis. †P < 0.05 for amplitude. See Table 2 for data from cosinor analysis.
Fig. 4.

High salt (HS) intake has no significant effect on the molecular clock components of the renal cortex. mRNA expression (copy count, n = 5) in 4-h intervals of Cry1 (A and B), Cry2 (C and D), Per1 (E and F), and Per2 (G and H) in the renal cortex of control and ETB-deficient (ETB def) rats maintained on normal salt or HS diet for 2 wk is shown. Symbols represent means ± SE, and lines represent cosinor analysis (Table 2).
HS intake impacts diurnal Na+ excretion.
Because chronic HS intake impacts the circadian clock within the kidney, at least in part, via ETB receptor activation, we examined the physiological impact of ETB receptor deficiency on diurnal Na+ excretion (Table 4). HS diet stimulated a significant increase in Na+ excretion during both the inactive and active period compared with NS-fed animals; however, under these steady-state conditions, both genotypes had a similar diurnal rhythm in response to HS. Importantly, food and water intake followed a diurnal pattern that was similar in rats of both strains (Table 4). Furthermore, 24-h excretion as well as food and water intake were similar between genotypes. Diurnal excretion of K+ was similar between genotypes during both active and inactive periods on either salt diet (Table 4). These data suggest that alterations in renal clock gene function in response to HS do not have a steady-state impact on urinary excretion patterns.
Table 4.
Diurnal metabolic cage parameters in control and ETB def rats fed normal or high salt for 2 wk
| Normal Salt (n = 9) |
High Salt (n = 5) |
|||
|---|---|---|---|---|
| Control Rats | Active | Inactive | Active | Inactive |
| Na+, µEq/12 h | 921.0 ± 54.0 | 625.0 ± 32.0 | 8,796.0 ± 534.0* | 2,956.0 ± 368.0*† |
| K+, µEq/12 h | 1,528.0 ± 87.0 | 627.0 ± 29.0† | 2,187.0 ± 148.0* | 530.0 ± 97.0† |
| UV, ml/12 h | 6.9 ± 0.9 | 4.1 ± 0.3† | 25.6 ± 1.0* | 9.1 ± 0.9*† |
| Food intake, g/12 h | 17.8 ± 1.1 | 2.0 ± 0.4† | 17.3 ± 0.6 | 2.3 ± 0.7† |
| H2O intake, ml/12 h | 29.0 ± 3.5 | 2.3 ± 0.4† | 54.4 ± 2.3* | 4.7 ± 1.0† |
| Normal Salt (n = 8) |
High Salt (n = 5) | |||
|---|---|---|---|---|
| ETB def rats | Active | Inactive | Active | Inactive |
| Na+, µEq/12 h | 833.0 ± 57.0 | 720.0 ± 58.0 | 10,590.0 ± 575.0* | 3,395.0 ± 633.0*† |
| K+, µEq/12 h | 1,563.0 ± 74.0 | 661.0 ± 52.0† | 2,602.0 ± 93.0* | 680.0 ± 95.0† |
| UV, ml/12 h | 6.8 ± 0.6 | 4.7 ± 0.4† | 32.3 ± 1.9* | 9.3 ± 1.6† |
| Food intake, g/12 h | 19.3 ± 1.7 | 2.7 ± 0.6† | 17.8 ± 0.3 | 2.2 ± 0.3† |
| H2O intake, ml/12 h | 32.5 ± 2.8 | 3.1 ± 0.6† | 51.0 ± 0.6* | 4.6 ± 1.3† |
Data are presented as means ± SE. ETB def, ETB deficient.
P < 0.05 vs. NS.
P < 0.05 vs. active.
Suppression of αENaC expression in response to HS is blunted in ETB-deficient rats.
Activation of ETB receptors is known to promote Na+ excretion by inhibiting epithelial sodium channel (ENaC) expression and activity (2). αENaC expression also appears to be regulated by the molecular clock, specifically Per1, in the collecting duct of the kidney (30). In contrast to what has been shown in response to a low-salt diet, we hypothesized that suppression of αENaC expression during HS intake is at least in part mediated by suppression of core clock genes. In control rats, renal inner medullary αENaC mRNA expression displayed a circadian rhythm as determined by cosinor analysis and, as expected, was suppressed by HS intake (Fig. 5A; Table 3). On the other hand, ETB def rats on NS also displayed a rhythm in αENaC mRNA expression but with a larger mesor than control rats (Fig. 5A and Table 3). αENaC was also suppressed in ETB def rats in response to HS intake, but expression was higher than control rats (Table 3). These data suggest that renal αENaC gene expression may be under the control of the molecular clock in vivo, and ETB receptor activation may serve to suppress basal αENaC expression. The differences in αENaC between ETB def rats and control do not appear to be from differences in circulating aldosterone, as plasma aldosterone concentration was suppressed by HS and similar between the two genotypes (Fig. 5, C and D, Table 2).
Fig. 5.

High salt (HS) intake suppression of α-epithelial sodium channel (αENaC) is partially mediated by ETB receptor activation. A and B represent rhythmic expression of renal inner medullary αENaC expression (n = 4–5), and C and D represent plasma aldosterone (n = 4–6) in control and ETB-deficient (ETB def) rats fed either normal salt or HS for 2 wk. Symbols represent means ± SE, and lines represent cosinor analysis. See Table 2 for cosinor analysis and statistics.
Elucidating the ET-1/Bmal1/ENaC axis in vitro.
A phase shift in Bmal1 expression was observed in response to HS in control rats but not ETB def rats, suggesting a mechanism whereby HS intake causes a phase shift in the Bmal1 circadian rhythm via ET-1. To determine whether changes in ET-1 impact Bmal1 directly, we exposed mouse inner medullary collecting duct-3 (mIMCD-3) cells to 100 nM ET-1, a concentration that stimulates nitric oxide release by these cells (10) and reduces ENaC open probability in split-open mouse cortical collecting duct tubules (8). After 4 h of treatment, there was a significant (~26%) decrease in Bmal1 mRNA expression compared with vehicle-treated cells (Fig. 6A). To determine whether a reduction in Bmal1 can suppress αENaC expression, mIMCD-3 cells were treated with Bmal1 or scrambled siRNA. Bmal1 siRNA (60 pmol) led to an ~60% reduction in Bmal1 protein expression (Fig. 6B, inset). Knockdown of Bmal1 significantly reduced αENaC mRNA (Fig. 6B). These data support the hypothesis that activation of the ET-1/ETB pathway results in reduced αENaC expression in a Bmal1-dependent manner.
Fig. 6.
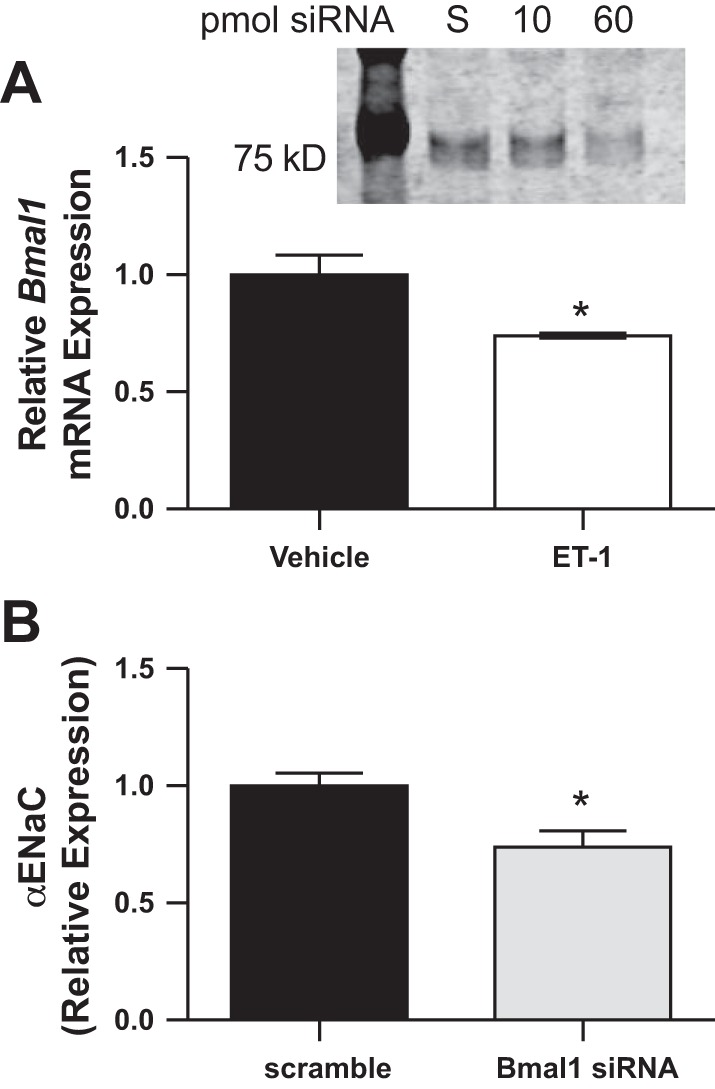
Bmal expression in mIMCD-3 cells treated with 100 nM endothelin-1 (ET-1) (A). α-Epithelial sodium channel (αENaC) expression in mIMCD cells treated with 60 pmol of siRNA to Bmal1 is shown (B). Inset: representative Western blot to confirm nuclear Bmal1 knockdown with siRNA. *P < 0.05, n = 3 separate experiments conducted in duplicate.
DISCUSSION
Disruption of normal circadian patterns, whether genetic or environmental, can increase the risk of many disorders, especially within the cardiovascular system (35). In addition, it is well documented that elevated Na+ intake contributes to overall mortality due to CVD (19). Our findings implicate several major processes that occur in the kidney in response to HS intake related to the renal circadian clock. First, HS causes a significant phase shift or suppression of clock gene expression in the renal inner medulla of control rats that are resistant to salt-induced hypertension. In addition, HS intake causes dyssynchronization of clock gene rhythms in a region-specific manner within the kidney. Finally, our studies also demonstrate that the ET-1/ETB receptor pathway contributes to the phase shift in Bmal1 produced by an HS diet, and loss of this phase shift may contribute to salt-dependent effects previously observed in the ETB def model.
Renal ET-1 regulates blood pressure by activating the ETB receptors and reducing Na+ reabsorption largely within the collecting duct (16, 28, 29). ET-1 inhibits ENaC activity in cortical collecting ducts, which most likely accounts for the natriuretic activity of the peptide. Our data also suggest that ET-1 plays a role in diurnal variation in Na+ excretion by modulating clock gene expression (2). It is interesting to speculate that ET-1 could serve as an immediate regulator of ENaC activity in the short term but also as a “sensor” of sodium delivery via feedback to Bmal1 expression and thus modulate a variety of circadian-controlled genes within the inner medulla.
The present findings indicate a diurnal rhythm in the renal production of ET-1 as measured in the urine that is associated with diurnal rhythms in Na+ excretion. Furthermore, our laboratory has shown that HS intake increases ET-1 receptor binding and shifts ET-1 binding in the inner medulla from 60/40% ETB/ETA to 100% ETB (9, 13). Finally, Richards et al. (26) reported higher levels of ETB receptor expression at midnight, or the middle of the active phase, in the inner medulla of mice with a concurrent decrease in ETA receptor expression compared with the middle of the inactive phase. Taken together, these data suggest that activation of ETB receptors in response to HS intake promotes a shift in Bmal1 expression in control rats and support our hypothesis that renal ET-1 regulates renal clock genes that may be responsible for diurnal patterns in renal Na+ handling.
Within the renal cortex and inner medulla, we observed oscillations in core clock genes that are similar to those reported by other investigators (34), and changes in gene expression are highly correlated to protein expression in vitro (3) and in vivo (27). One of the major findings of the present study is that several clock genes within the inner medulla of the kidney are suppressed or phase delayed in response to HS feeding, but this was not observed in the renal cortex of these same animals. The fact that clock genes within a single organ become desynchronized in terms of the molecular clock is contrary to the dogma that peripheral clock genes function as one synchronous unit. At least part of the mechanism leading to this discrepancy is most likely due to the fact that expression of ET-1 and ETB receptors is ~10-fold higher in the inner medullary collecting duct compared with the renal cortex (13, 29, 31). Given that disruption of the molecular clock leads to elevated CVD risk, we speculate that risk associated with HS intake may be partially due to dyssynchrony between peripheral clocks of the kidney (17).
The canonical paradigm is that zeitgebers, or cues, initiate the transcription of clock proteins Bmal1 and CLOCK. These proteins heterodimerize and promote the transcription of Cry and Per, which feed back in a negative loop to inhibit Bmal1 and CLOCK. Although this circuit is well documented in the central clock, these new data challenge the pattern of this regulatory scheme between the peripheral clocks within the kidney. In fact, HS affected several clock genes within the inner medulla, whereas Per1 oscillated similarly to NS-fed animals. Gumz et al. (6, 30) reported that aldosterone signals through Per1 in the collecting duct to increase expression of ENaC. A spike in aldosterone expression at zeitgeber time 12 (ZT12, or 7:00 PM/lights off) is observed in NS-fed animals and, to a lesser extent, in HS-fed animals. Therefore, it is reasonable to speculate that aldosterone may be maintaining circadian rhythm of Per1 expression in the collecting duct although other clock factors are suppressed. In addition to hormonal differences that may be regulating the molecular clock, it is also necessary to point out that a majority of what we know about clock gene regulation and function is derived from knockout mouse models. Interestingly, in the mouse, physiological rhythms continue when any single clock gene is knocked out, except for Bmal1 (23). This is possible because of functional overlap between core clock proteins with other isoforms or other transcription factors. However, Bmal1 knockout mice lose diurnal rhythm in both blood pressure (4) and Na+ excretion (D. M. Pollock, unpublished observations), suggesting that it is the master circadian clock protein. Our study, along with unpublished observations from our laboratory suggests that this may not be the case in peripheral tissues of the rat; however, more studies in knockout rats will be required to address these issues.
The major consequences of Bmal1 and Per1 appear to be antinatriuretic and prohypertensive effects (7), specifically by increasing transcription of Na+ transporters and channels in the kidney. Our findings that knockdown of Bmal1 significantly reduces αENaC mRNA in inner medullary collecting duct cells support this concept. This suggests that a reduction in clock gene expression in response to an HS diet would be beneficiary to excrete excess salt. The absence of a phase shift in Bmal1 expression, as seen in the ETB def rat, is consistent with a contribution of clock genes to an impaired ability to efficiently excrete a salt load (15) and thus may contribute to salt-sensitive hypertension observed in this model. To date, the nature of clock gene interactions within the renal tubular system has not been established. Two experimental models reported by Firsov’s group have begun to delineate the role of the renal molecular clock in control of renal excretory function (20, 32). First, it was observed that knockout of Bmal1 from renin-secreting cells, including juxtaglomerular cells and collecting duct, reduced blood pressure and altered circadian patterns in Na+ excretion (32). Second, knockout of Bmal1 only in the nephron reduced systolic blood pressure with no effect on the circadian pattern of blood pressure or Na+ excretion in NS-fed animals (20). To understand how tubular Bmal1 affects Na+ handling, more studies involving HS intake or an acute Na+ challenge are necessary.
Klf15, a transcription factor that has been shown to be under the control of the molecular clock, specifically in the heart, is abundantly expressed in the kidney (1). In the present study, we observed that Klf15 expression is significantly reduced by HS intake. Work from Jain et al. (38) indicates that, within the heart, Klf15 is responsible for the oscillation of over 1,300 genes while also suppressing the oscillation of 473 genes. Thus we speculate that HS may suppress downstream targets though Klf15 while also allowing other genes to begin oscillating. Little work has been done to identify the downstream targets of Klf15 within the kidney; however, our study provides a potential link between Klf15 and Na+ homeostasis.
The impact of dietary salt intake on clock gene expression could provide insights into clinical complications of HS diets. Perturbations in circadian rhythms such as disturbances in sleep patterns or night shift work are risk factors for CVD. Importantly, in human subjects, clusters of single nucleotide polymorphisms (haplotypes) in the Bmal1 gene were associated with hypertension or type II diabetes (33). These studies highlight the importance of circadian regulation at the molecular level in contributing to cardiovascular function. The present study provides evidence of molecular and circadian mechanisms whereby HS intake may contribute to CVD risk, and this is in part through modulation of renal clock gene expression by the endothelin system.
GRANTS
This work was supported by National Institutes of Health grants to J. Speed (K99 HL127178 and T32DK079337), D. Pollock and J. Pollock (P01 HL69999, P01 HL95499, and HL136267), K. Hyndman (K01 DK105038), B. Fox (F30 DK107194), M. Kasztan (American Society of Nephrology, Joseph A. Carlucci Research Fellowship), and B. Becker (T32HL007457).
DISCLOSURES
No conflicts of interest, financial or otherwise, are declared by the authors.
AUTHOR CONTRIBUTIONS
Conceptualization, J.S.S., K.A.H., M.E.Y, J.S.P., D.M.P.; Methodology, J.S.S., K.A.H., J.S.P., D.M.P.; Validation, J.S.S., K.A.H., K.J.R., J.S.P., D.M.P.; Formal Analysis, J.S.S., K.L.G., M.E.Y.; Investigation, J.S.S., K.A.H., K.J.R., J.B.H., M.K., B.M.F, J.G.J., B.K.B, C.J., D.M.P.; Resources, J.S.S., K.L.G., M.E.Y., J.S.P., D.M.P., Data Curation, J.S.S., D.M.P., Writing-Original Draft, J.S.S., D.M.P., Writing-Review and Editing, J.S.S., K.A.H., K.J.R., J.B.H., M.K., B.M.F., J.G.J., B.K.B, C.J., K.L.G., M.E.Y., J.S.P., D.M.P; Visualization, J.S.S, D.M.P.; Supervision, J.S.S, D.M.P.; Project Administration, J.S.S, D.M.P.; Funding Acquisition; J.S.S., K.A.H., J.S.P., D.M.P.
ACKNOWLEDGMENTS
The authors thank the Center for Clinical and Translation Science at UAB for statistical advice (UL1TR001417).
REFERENCES
- 1.Banerjee SS, Feinberg MW, Watanabe M, Gray S, Haspel RL, Denkinger DJ, Kawahara R, Hauner H, Jain MK. The Krüppel-like factor KLF2 inhibits peroxisome proliferator-activated receptor-gamma expression and adipogenesis. J Biol Chem 278: 2581–2584, 2003. doi: 10.1074/jbc.M210859200. [DOI] [PubMed] [Google Scholar]
- 2.Bugaj V, Mironova E, Kohan DE, Stockand JD. Collecting duct-specific endothelin B receptor knockout increases ENaC activity. Am J Physiol Cell Physiol 302: C188–C194, 2012. doi: 10.1152/ajpcell.00301.2011. [DOI] [PMC free article] [PubMed] [Google Scholar]
- 3.Busino L, Bassermann F, Maiolica A, Lee C, Nolan PM, Godinho SI, Draetta GF, Pagano M. SCFFbxl3 controls the oscillation of the circadian clock by directing the degradation of cryptochrome proteins. Science 316: 900–904, 2007. doi: 10.1126/science.1141194. [DOI] [PubMed] [Google Scholar]
- 4.Curtis AM, Cheng Y, Kapoor S, Reilly D, Price TS, Fitzgerald GA. Circadian variation of blood pressure and the vascular response to asynchronous stress. Proc Natl Acad Sci USA 104: 3450–3455, 2007. doi: 10.1073/pnas.0611680104. [DOI] [PMC free article] [PubMed] [Google Scholar]
- 5.Gariepy CE, Ohuchi T, Williams SC, Richardson JA, Yanagisawa M. Salt-sensitive hypertension in endothelin-B receptor-deficient rats. J Clin Invest 105: 925–933, 2000. doi: 10.1172/JCI8609. [DOI] [PMC free article] [PubMed] [Google Scholar]
- 6.Gumz ML, Cheng KY, Lynch IJ, Stow LR, Greenlee MM, Cain BD, Wingo CS. Regulation of αENaC expression by the circadian clock protein Period 1 in mpkCCD(c14) cells. Biochim Biophys Acta 1799: 622–629, 2010. doi: 10.1016/j.bbagrm.2010.09.003. [DOI] [PMC free article] [PubMed] [Google Scholar]
- 7.Gumz ML, Stow LR, Lynch IJ, Greenlee MM, Rudin A, Cain BD, Weaver DR, Wingo CS. The circadian clock protein Period 1 regulates expression of the renal epithelial sodium channel in mice. J Clin Invest 119: 2423–2434, 2009. doi: 10.1172/JCI36908. [DOI] [PMC free article] [PubMed] [Google Scholar]
- 8.Hyndman KA, Bugaj V, Mironova E, Stockand JD, Pollock JS. NOS1-dependent negative feedback regulation of the epithelial sodium channel in the collecting duct. Am J Physiol Renal Physiol 308: F244–F251, 2015. doi: 10.1152/ajprenal.00596.2013. [DOI] [PMC free article] [PubMed] [Google Scholar]
- 9.Hyndman KA, Dugas C, Arguello AM, Goodchild TT, Buckley KM, Burch M, Yanagisawa M, Pollock JS. High salt induces autocrine actions of ET-1 on inner medullary collecting duct NO production via upregulated ETB receptor expression. Am J Physiol Regul Integr Comp Physiol 311: R263–R271, 2016. doi: 10.1152/ajpregu.00016.2015. [DOI] [PMC free article] [PubMed] [Google Scholar]
- 10.Hyndman KA, MacDonell AH, Pollock JS. Extracellular signal-regulated kinases 1/2 signaling pathways are not involved in endothelin regulation of mouse inner medullary collecting duct nitric oxide production. Life Sci 91: 578–582, 2012. doi: 10.1016/j.lfs.2012.01.014. [DOI] [PMC free article] [PubMed] [Google Scholar]
- 11.Ivy D, McMurtry IF, Yanagisawa M, Gariepy CE, Le Cras TD, Gebb SA, Morris KG, Wiseman RC, Abman SH. Endothelin B receptor deficiency potentiates ET-1 and hypoxic pulmonary vasoconstriction. Am J Physiol Lung Cell Mol Physiol 280: L1040–L1048, 2001. [DOI] [PubMed] [Google Scholar]
- 12.Jeyaraj D, Haldar SM, Wan X, McCauley MD, Ripperger JA, Hu K, Lu Y, Eapen BL, Sharma N, Ficker E, Cutler MJ, Gulick J, Sanbe A, Robbins J, Demolombe S, Kondratov RV, Shea SA, Albrecht U, Wehrens XH, Rosenbaum DS, Jain MK. Circadian rhythms govern cardiac repolarization and arrhythmogenesis. Nature 483: 96–99, 2012. doi: 10.1038/nature10852. [DOI] [PMC free article] [PubMed] [Google Scholar]
- 13.Jin C, Speed JS, Pollock DM. High salt intake increases endothelin B receptor function in the renal medulla of rats. Life Sci 159: 144–147, 2016. 10.1016/j.lfs.2015.12.038. [DOI] [PMC free article] [PubMed] [Google Scholar]
- 15.Johnston JG, Speed JS, Jin C, Pollock DM. Loss of endothelin B receptor function impairs sodium excretion in a time- and sex-dependent manner. Am J Physiol Renal Physiol 311: F991–F998, 2016. doi: 10.1152/ajprenal.00103.2016. [DOI] [PMC free article] [PubMed] [Google Scholar]
- 16.Lynch IJ, Welch AK, Kohan DE, Cain BD, Wingo CS. Endothelin-1 inhibits sodium reabsorption by ET(A) and ET(B) receptors in the mouse cortical collecting duct. Am J Physiol Renal Physiol 305: F568–F573, 2013. doi: 10.1152/ajprenal.00613.2012. [DOI] [PMC free article] [PubMed] [Google Scholar]
- 17.Martino TA, Sole MJ. Molecular time: an often overlooked dimension to cardiovascular disease. Circ Res 105: 1047–1061, 2009. doi: 10.1161/CIRCRESAHA.109.206201. [DOI] [PubMed] [Google Scholar]
- 18.Mills JN, Stanbury SW. Persistent 24-hour renal excretory rhythm on a 12-hour cycle of activity. J Physiol 117: 22–37, 1952. [PMC free article] [PubMed] [Google Scholar]
- 19.Mozaffarian D, Fahimi S, Singh GM, Micha R, Khatibzadeh S, Engell RE, Lim S, Danaei G, Ezzati M, Powles J; Global Burden of Diseases Nutrition and Chronic Diseases Expert Group . Global sodium consumption and death from cardiovascular causes. N Engl J Med 371: 624–634, 2014. doi: 10.1056/NEJMoa1304127. [DOI] [PubMed] [Google Scholar]
- 20.Nikolaeva S, Ansermet C, Centeno G, Pradervand S, Bize V, Mordasini D, Henry H, Koesters R, Maillard M, Bonny O, Tokonami N, Firsov D. Nephron-specific deletion of circadian clock gene Bmal1 alters the plasma and renal metabolome and impairs drug disposition. J Am Soc Nephrol 27: 2997–3004, 2016. doi: 10.1681/ASN.2015091055. [DOI] [PMC free article] [PubMed] [Google Scholar]
- 21.Partch CL, Green CB, Takahashi JS. Molecular architecture of the mammalian circadian clock. Trends Cell Biol 24: 90–99, 2014. doi: 10.1016/j.tcb.2013.07.002. [DOI] [PMC free article] [PubMed] [Google Scholar]
- 22.Pollock DM, Schneider MP. Clarifying endothelin type B receptor function. Hypertension 48: 211–212, 2006. doi: 10.1161/01.HYP.0000229908.62191.6e. [DOI] [PMC free article] [PubMed] [Google Scholar]
- 23.Richards J, Diaz AN, Gumz ML. Clock genes in hypertension: novel insights from rodent models. Blood Press Monit 19: 249–254, 2014. doi: 10.1097/MBP.0000000000000060. [DOI] [PMC free article] [PubMed] [Google Scholar]
- 24.Richards J, Greenlee MM, Jeffers LA, Cheng KY, Guo L, Eaton DC, Gumz ML. Inhibition of αENaC expression and ENaC activity following blockade of the circadian clock-regulatory kinases CK1δ/ε. Am J Physiol Renal Physiol 303: F918–F927, 2012. doi: 10.1152/ajprenal.00678.2011. [DOI] [PMC free article] [PubMed] [Google Scholar]
- 25.Richards J, Gumz ML. Mechanism of the circadian clock in physiology. Am J Physiol Regul Integr Comp Physiol 304: R1053–R1064, 2013. doi: 10.1152/ajpregu.00066.2013. [DOI] [PMC free article] [PubMed] [Google Scholar]
- 26.Richards J, Welch AK, Barilovits SJ, All S, Cheng KY, Wingo CS, Cain BD, Gumz ML. Tissue-specific and time-dependent regulation of the endothelin axis by the circadian clock protein Per1. Life Sci 118: 255–262, 2014. doi: 10.1016/j.lfs.2014.03.028. [DOI] [PMC free article] [PubMed] [Google Scholar]
- 27.Saifur Rohman M, Emoto N, Nonaka H, Okura R, Nishimura M, Yagita K, van der Horst GT, Matsuo M, Okamura H, Yokoyama M. Circadian clock genes directly regulate expression of the Na(+)/H(+) exchanger NHE3 in the kidney. Kidney Int 67: 1410–1419, 2005. doi: 10.1111/j.1523-1755.2005.00218.x. [DOI] [PubMed] [Google Scholar]
- 28.Speed JS, George EM, Arany M, Cockrell K, Granger JP. Role of 20-hydroxyeicosatetraenoic acid in mediating hypertension in response to chronic renal medullary endothelin type B receptor blockade. PLoS One 6: e26063, 2011. doi: 10.1371/journal.pone.0026063. [DOI] [PMC free article] [PubMed] [Google Scholar]
- 29.Speed JS, Pollock DM. Endothelin, kidney disease, and hypertension. Hypertension 61: 1142–1145, 2013. doi: 10.1161/HYPERTENSIONAHA.113.00595. [DOI] [PMC free article] [PubMed] [Google Scholar]
- 30.Stow LR, Richards J, Cheng KY, Lynch IJ, Jeffers LA, Greenlee MM, Cain BD, Wingo CS, Gumz ML. The circadian protein period 1 contributes to blood pressure control and coordinately regulates renal sodium transport genes. Hypertension 59: 1151–1156, 2012. doi: 10.1161/HYPERTENSIONAHA.112.190892. [DOI] [PMC free article] [PubMed] [Google Scholar]
- 31.Taylor TA, Gariepy CE, Pollock DM, Pollock JS. Unique endothelin receptor binding in kidneys of ETB receptor deficient rats. Am J Physiol Regul Integr Comp Physiol 284: R674–R681, 2003. doi: 10.1152/ajpregu.00589.2002. [DOI] [PubMed] [Google Scholar]
- 32.Tokonami N, Mordasini D, Pradervand S, Centeno G, Jouffe C, Maillard M, Bonny O, Gachon F, Gomez RA, Sequeira-Lopez ML, Firsov D. Local renal circadian clocks control fluid-electrolyte homeostasis and BP. J Am Soc Nephrol 25: 1430–1439, 2014. doi: 10.1681/ASN.2013060641. [DOI] [PMC free article] [PubMed] [Google Scholar]
- 33.Woon PY, Kaisaki PJ, Bragança J, Bihoreau MT, Levy JC, Farrall M, Gauguier D. Aryl hydrocarbon receptor nuclear translocator-like (BMAL1) is associated with susceptibility to hypertension and type 2 diabetes. Proc Natl Acad Sci USA 104: 14412–14417, 2007. doi: 10.1073/pnas.0703247104. [DOI] [PMC free article] [PubMed] [Google Scholar]
- 34.Wu T, Ni Y, Dong Y, Xu J, Song X, Kato H, Fu Z. Regulation of circadian gene expression in the kidney by light and food cues in rats. Am J Physiol Regul Integr Comp Physiol 298: R635–R641, 2010. doi: 10.1152/ajpregu.00578.2009. [DOI] [PubMed] [Google Scholar]
- 35.Young ME, Bray MS. Potential role for peripheral circadian clock dyssynchrony in the pathogenesis of cardiovascular dysfunction. Sleep Med 8: 656–667, 2007. doi: 10.1016/j.sleep.2006.12.010. [DOI] [PMC free article] [PubMed] [Google Scholar]
- 36.Young ME, Razeghi P, Taegtmeyer H. Clock genes in the heart: characterization and attenuation with hypertrophy. Circ Res 88: 1142–1150, 2001. doi: 10.1161/hh1101.091190. [DOI] [PubMed] [Google Scholar]
- 37.Zhang DNG, Chen D, Obi I, Jin C, Speed JS, Pollock JS, Pollock DM. Loss of Bmal1 impairs the diurnal rhythm in sodium excretion that parallels the loss of circadian blood pressure rhythm. FASEB J 31: 855, 2017.28246298 [Google Scholar]
- 38.Zhang L, Prosdocimo DA, Bai X, Fu C, Zhang R, Campbell F, Liao X, Coller J, Jain MK. KLF15 Establishes the landscape of diurnal expression in the heart. Cell Reports 13: 2368–2375, 2015. doi: 10.1016/j.celrep.2015.11.038. [DOI] [PubMed] [Google Scholar]