

Abstract
Introduction
The paper assesses social disparities in the burdens of metabolic and inflammatory risks for cancer in the U.S. young adult population and examines psychosocial and behavioral mechanisms in such disparities.
Methods
Using data of 7,889 individuals aged 12 to 32 from the National Longitudinal Study of Adolescent to Adult Health (Add Health) 1994 to 2009, generalized linear models were used to assess the sex, race/ethnicity, and socioeconomic status (SES) differences in the risks of obesity and inflammation, measured by C-reactive protein (CRP). Further tests examined the extent to which social isolation, smoking, physical inactivity, alcohol abuse, and illicit drug use explain social differentials in each biomarker outcome.
Results
Females, blacks, Hispanics, and socioeconomically disadvantaged groups had higher risks of obesity and elevated CRP, with the SES gradients being more pronounced in females. Health related behaviors showed large variation across sex, race, and SES strata. Adjusting for these behavioral variables, sex and race disparities in obesity and black excess in inflammation diminished, whereas the adolescent SES disparity in obesity remained. The associations of adolescent and young adult SES disadvantage and inflammation were also explained away by behavioral mechanisms. Behavioral factors associated with higher risks of obesity and inflammation differed, with the exception of fast food consumption, a risk factor for both.
Conclusions
The study provides new knowledge of social distribution of early-life exposures to physiological precedents to cancer development later in life with implications for prevention and early intervention of modifiable risky behaviors in adolescents and young adults.
INTRODUCTION
Cancer is a major and increasing public health concern.1, 2 Prior research on cancer and its risk factors has focused on later adulthood. However, cancer is a chronic disease of aging that takes decades to develop and manifest. Research suggests that cancer onset is often preceded by a lengthy latency period, with clinically detectable levels of cellular dysfunction often not occurring until years after initial exposure to carcinogenic agents.3,4 Adolescent and early adult circumstances may have enduring impacts on late life chronic disease outcomes, with implications for cancer in particular.5, 6 While the specific etiology linking early life circumstances to later life cancer development remains unknown, previous studies indicate that young adulthood exposures to socioeconomic disadvantage, nutrition, physical activity, and risky behaviors such as cigarette smoking may all play a role.7–10
The links between adolescence and early adulthood and cancer in later life remain under-studied. Previous research suggests that certain developmental time periods, particularly the transition from adolescence into early adulthood, may represent a ‘sensitive period’ for health. As a developmental turning point, adolescence marks a transition where the environment becomes increasingly important for health as young people have more control over the environment and their behavioral choices.6, 11 A better understanding of the behavioral and psychosocial risk factors in adolescence and young adulthood linked to cancer development later in life would facilitate the development of early interventions to prevent cancer onset.
Given the low incidence rates of cancer in young adulthood, intermediary physiological pathways involved in carcinogenesis signal the earliest, preclinical stage of the disease process. Obesity and inflammation are two prominent examples of pre-disease pathways amenable to early life course intervention for cancer prevention. Obesity has been linked to increased risks of multiple cancers, accounting for an estimated 20% of all cancer cases.12–14 While the specific metabolic and hormonal mechanisms linking obesity to cancer are under investigation, the high likelihood of adolescent obesity status persisting into adulthood suggests the necessity of reducing obesity risk early on to curtail the growth of cancers. Systemic inflammation can act synergistically with obesity to increase cancer risk.15–17 While obesity increases low-grade inflammation, the presence of inflammation as indicated by elevated acute phase protein (e.g., C-reactive protein or CRP) also plays a crucial role in tumorigenesis independent of obesity.18, 19
The rate of obesity in adolescents has quadrupled over the past 30 years to 17% and more recent cohorts show increased risks of obesity than earlier cohorts, with the increase being particularly sharp for black females.20–22 Previous studies have documented substantial social differentials in obesity as well as biomarkers of low-grade inflammation, with women, blacks and Hispanics, and lower socioeconomic status (SES) at greater risk of obesity23–25 and elevated CRP.26–29 Much less is known about patterns of social disparities in the distributions of these biological risk factors for cancer in young adulthood.
Multiple behavioral and psychosocial factors have hypothesized links with inflammation, obesity, and cancer. Cigarette smoking is associated with elevated risks of CRP and a well-established cause of many leading cancers and related mortality.30–32 Social isolation increases inflammation and the risk of cancer mortality.33–38 A large body of research shows clear associations between nutritious diets and cancer.39–41 In fact, obesity and the high-fat, low-vegetable western diet may represent the “largest avoidable cause of cancer in nonsmokers.”14 Physical inactivity may further heighten the risk of various cancers via its effects on adiposity and obesity, as well as immune activation and inflammation.8 Alcohol consumption and illicit drug use (such as cocaine and opioids) have been linked to certain cancers, although the findings are mixed.41–44 Individuals of lower social status are disproportionally exposed to adversities and higher levels of social stress that in turn increase disease susceptibilities through harmful behaviors and prolonged physiological stress response.45–48 Singular cross-sectional measures of SES are widely used but fail to capture the dynamic and multidimensional nature of socioeconomic standing specific to each life period. The extent to which disadvantaged and poor adolescent and young adult population in the U.S. suffer from high risks of obesity and inflammation is unknown. The role of early-life social behavioral factors in shaping social disparities in biological precursors to cancer is also unclear.
Despite remaining uncertainty of the mechanisms linking obesity and CRP to cancer causation, research demonstrates clear associations between these biomarkers and tumorigenesis.1, 12–17 Given the rise of obesity and corresponding inflammation burdens in young adulthood, an examination of the population patterns of these biomarkers, as well as modifiable behavioral risk factors, could lead to a better understanding of possible strategies to reduce future disparities in cancer incidence. This study fills this gap using the largest population-based prospective cohort study of adolescents and young adults in the U.S. It examines the sex, race/ethnicity, and life-course SES differences in obesity and CRP. It further assesses six health-related behaviors–including social isolation, daily smoking, physical inactivity, consumption of fast food, alcohol abuse, and illicit drug use–as behavioral mechanisms underlying social disparities in obesity and inflammation.
METHODS
Data for the study come from the National Longitudinal Study of Adolescent and Adult Health (Add Health), a nationally representative study of adolescents in grades 7–12 in the US in 1994–95 who were followed into adulthood. Add Health used a stratified school-based design and selected a nationally representative sample of all high schools and a feeder school in the United States. The Add Health cohort were initially surveyed via in-school and in-home questionnaires in 1994–95 (wave I), and followed up in 1996 (wave II), 2001–2002 (wave III), and finally in 2008–2009 (wave IV). The current study includes 7,889 participants aged 12–19 at wave I (adolescence) and followed up at ages 24–32 in wave IV (young adulthood) with valid responses on all covariates of interest. High-sensitive C-reactive protein (hsCRP) comes from assays of dried blood spots collected at wave IV. The measure of CRP indicates generalized inflammation in the analyses below. Height and weight measured at interviews at both wave I and IV were used to calculate the body mass index (BMI).49
The independent variables and covariates for the present study are drawn from the in-school questionnaire and the in-home interviews at wave I as well as the in-home interview at wave IV All psychosocial and behavioral covariates were collected via self-reported survey questionnaires (see appendix Table S1 for detail of coding).
An adolescent SES disadvantage index was constructed as a count of items reflecting parents’ status at wave I including parental welfare receipt, education and/or income in the bottom quartile of the sample, parent unemployment, and single-parent household structure. The adolescent index ranges from 0-5, with 5 representing the highest level of disadvantage. A similar index was compiled based on the respondents’ own status at wave IV. The young adult SES disadvantage index ranges from 0–3 with items for welfare receipt, low-education, and low-income. Adolescent social isolation is a binary indicator of no participation in any volunteer work, low levels of interaction with parents living in the household (in the bottom quartile of responses), being in the bottom quartile for number of friendship contacts, and less than monthly religious attendance at wave I. Respondents were classified as regular cigarette smokers in young adulthood if they had smoked at least one cigarette each day for the past 30 days. Respondents were considered to be physically inactive if they reported participation in aerobic activities less than three times per week. An item for fast food consumption indicates whether respondents had eaten at a fast food restaurant at least once in the past seven days. Alcohol abuse was defined as having been regularly drunk three or more time per week, experiencing legal problems due to drinking, and/or having been a risk to oneself or others due to drinking. Finally, illicit drug-use was defined as the use of one or more illegal drugs or the abuse of prescription drugs at least once in the past year. Self-reported race/ethnicity includes four categories: white, black, Hispanics, and other.
The analytic sample for each biomarker outcome (N = 7,889 for BMI; N = 6,747 for CRP) included respondents who had complete data on all covariates used in the analysis and those with valid sampling weights. Most missing data are due to respondents lacking in-school surveys at wave I for the construction of social isolation variable (N = 3,474). Those with missing measures of smoking and other covariates were also excluded. Detailed information on missing data is included in appendix S1. The weighted descriptive statistics of all variables in the sample are reported in Table S3 (appendix).
Statistical Analysis
Multivariate regression analyses were conducted to examine the associations between each biomarker outcome with social status characteristics and behavioral factors. Model fit statistics such as the Bayes Information Criterion (BICs) suggest that the logistics models of obesity and OLS models of log(CRP) provide the best fit to data on each outcome. Models were estimated in a stepwise fashion: 1) bivariate models with no adjustment of other covariates; and 2) full models adjusting for all covariates. We further presented the predicted outcomes in figures based on post-estimation analysis of regression models including interaction terms between SES and race/ethnicity and SES and gender, respectively. We tested the significance of group differences as estimated by these interaction effects using the Wald test of equality of coefficients (see list of figures).50 All analyses adjusted for survey design effects and nonresponse using sampling weights. Analyses were conducted using Stata SE 14.
RESULTS
Figure 1 shows the sex, race/ethnicity, and SES gradients in the proportions of obesity and elevated CRP in young adults in the Add Health sample. Females, blacks, and Hispanics were more likely to be obese and had elevated CRP than their male and white counterparts. The “other” race group had significantly lower risks of obesity and elevated CRP among women, but higher risks among men. A lower count of SES disadvantages in adolescence is related to lower proportions of obesity and elevated CRP. And these differentials are all statistically significant, as are early life SES measured for early adulthood (see coefficients in Table 1). Race differences in the likelihood of obesity and elevated CRP appeared to converge at low levels of adolescent SES disadvantage for men more so than among women. Although the mean levels of obesity and inflammation varied by sex and race/ethnicity, the general SES gradient did not vary significantly across these groups, with a possible exception of obesity in black and Hispanic males who showed increases in obesity risk with increases in SES (p<.09, two-tailed).
Figure 1.
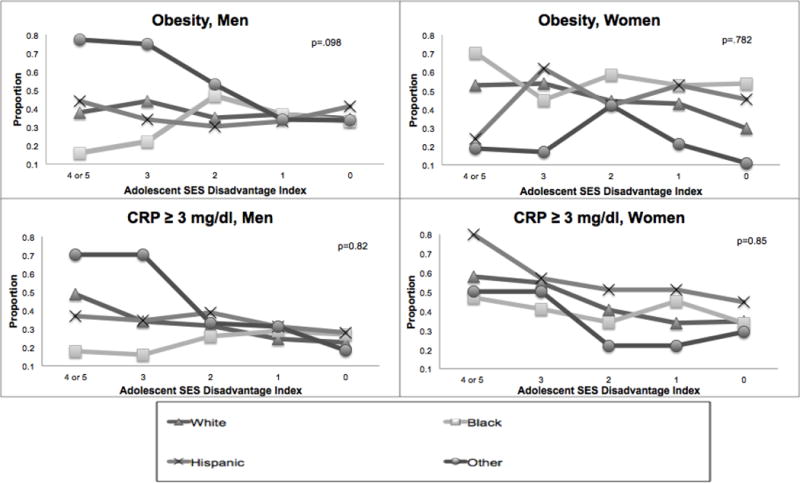
Obesity and Inflammation Outcomes by Sex, Race, and SES
Note: Figure based on adjusted linear regression for each biomarker outcome with an interaction term for race/ethnicity and adolescent SES disadvantage. P-value derived from post-estimation Wald test for equality of coefficients for the interaction between race/ethnicity and SES for each model. For illustration purposes, the lines for each race/ethnicity category demonstrate the estimated prevalence of obesity or elevated CRP at each level of adolescent SES disadvantage, calculated separately for each gender.
Adolescent SES Disadvantage Index- ranges from 0 (no disadvantage) to 5 (most disadvantage).
Abbreviations: CRP, C-reactive protein; SES, Socioeconomic Status
Table 1.
Estimated Associations of Social Status and Health Behaviors with Biomarkers of Cancer Risk
| Young Adult Obesity (N = 7,889) |
Log CRP (N = 6,747) |
|||||||
|---|---|---|---|---|---|---|---|---|
|
|
||||||||
| Variable | Unadjusted | Fully Adjusted | Unadjusted | Fully Adjusted | ||||
| Odds Ratio | (95% CI) | Odds Ratio | (95% CI) | Coefficient | (s.e.) | Coefficient | (s.e.) | |
| Sex (Female = 1) | 1.16* | 1.01-1.34 | 1.10 | 0.92-1.31 | 0.57*** | 0.05 | 0.56*** | 0.07 |
| Race/Ethnicity | ||||||||
| White (ref.) | ||||||||
| Black | 1.67*** | 1.40-1.95 | 1.22 | 0.91-1.64 | 0.19* | 0.08 | 0.04 | 0.1 |
| Hispanic | 0.68* | 0.49-0.95 | 1.31 | 0.93-1.85 | 0.16 | 0.09 | 0.27* | 0.12 |
| Others | 1.23+ | 0.98- 1.56 | 0.70 | 0.43-1.16 | −0.54*** | 0.11 | −0.41** | 0.13 |
| SES Disadvantage | ||||||||
| Adolescent | 1.18*** | 1.09-1.25 | 1.13* | 1.01-1.26 | 0.09** | 0.027 | 0.01 | 0.03 |
| Young Adult | 1.21*** | 1.11-1.32 | 1.11 | 0.98-1.27 | 0.11** | 0.034 | 0.03 | 0.04 |
| Age | 1.05* | 1.00-0.47 | 1.00 | 0.94-1.06 | 0.02 | 0.016 | 0.01 | 0.02 |
| Social Isolation (Adolescent) | 1.23* | 1.02-1.48 | 1.19 | 0.91-1.57 | −0.005 | 0.07 | 0.122* | 0.05 |
| Current Cigarette Smoker | 0.87 | 0.73-1.03 | 0.77 | 0.59-1.00 | −0.031 | 0.068 | 0.109* | 0.05 |
| Physically Inactive | 1.36** | 1.12-1.65 | 1.31 | 0.95-1.79 | 0.24** | 0.078 | 0.18 | 0.09 |
| Fast Food Consumption | 1.35*** | 1.14-1.60 | 1.64*** | 1.28-2.08 | 0.26*** | 0.07 | 0.24** | 0.08 |
| Alcohol Abuse | 0.59* | 0.38-0.88 | 0.71 | 0.43-1.16 | 0.007 | 0.15 | 0.24 | 0.17 |
| Illicit Drug Use | 0.71** | 0.56-0.89 | 0.71* | 0.51-.99 | −0.037 | 0.1 | 0.15 | |
| Obesity | ||||||||
| Adolescent | 22.88*** | 14.55-35.98 | 19.33*** | 10.81-34.55 | 1.03*** | 0.09 | 0.62*** | 0.62 |
| Young Adult | N/A | N/A | 1.1*** | 0.05 | 0.96*** | 0.96 | ||
Note: boldface indicates statistical significance
p<.05;
p<.01;
p<.00, two-tailed)
Abbreviations:
CRP, C-reactive protein
SES, Socioeconomic Status
Table 1 shows evidence for the associations of risky psychosocial and health behaviors with obesity and inflammation. The bivariate model of obesity shows that in addition to the large positive association of adolescent obesity with young adult obesity, adolescent social isolation increased the odds of obesity in young adulthood by 23% (Odds Ratio [95%CI] = 1.23 [1.02-1.48], p<.05). Physical inactivity and fast food consumption are also associated with significant increases in the odds of obesity in young adulthood (OR= 1.36 and 1.35 respectively). Alcohol abuse (OR = 0.59) and illicit drug use (OR=0.71), on the other hand, have negative associations with obesity. The corresponding CRP model shows significant bivariate associations of physical inactivity and fast food consumption as well as obesity with inflammation.
To examine the extent to which social gradients in obesity and inflammation may be due to corresponding gradients in behavioral factors, results compared patterns of variation in risky psychosocial and health behaviors by social status characteristics. Figure 2 illustrates that the proportions of unhealthy behaviors generally declined as SES increased. However, there are significant sex differences in both the mean levels and SES differentials in these behaviors. Males had higher levels of social isolation, cigarette smoking, fast food consumption, alcohol abuse, and drug use, but lower rates of physical inactivity than females. The sex gaps declined among those with lower adolescent SES disadvantage. Figure 3 presents distributions of each behavioral factor by race among males (results for females similar). White males had lower levels of physical inactivity and fast food consumption than the other race groups, but the highest rates of cigarette smoking and drug use. Black males had the highest levels of physical inactivity, fast food consumption, and alcohol abuse, but the lowest rates of drug use. Hispanic males and the other race category were similar in levels of smoking, physical inactivity, and alcohol abuse, falling between the rates for whites and blacks. And the “other” race group had lower rates of fast food consumption. Race differences in the prevalence of social isolation and alcohol abuse were not statistically significant.
Figure 2.
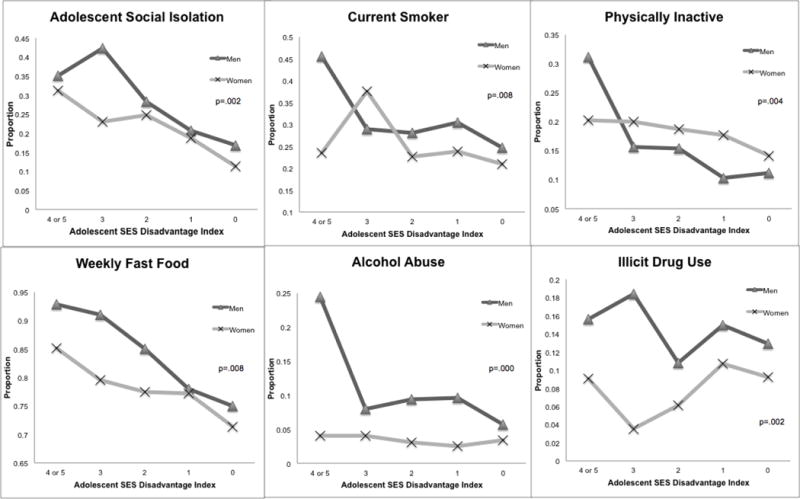
Sex and SES Differentials in Risky Psychosocial and Health Behaviors
Note: Figure based on adjusted logistic regression for each psychosocial and health behavioral outcome with an interaction term for gender and adolescent SES disadvantage. P-value derived from post-estimation Wald test for equality of coefficients for the interaction between gender and SES for each model. For illustration purposes, the lines for each gender demonstrate the estimated population prevalence of each psychosocial and health behavior outcome at each level of adolescent SES disadvantage, averaged across all race/ethnic groups.
Adolescent SES Disadvantage Index- ranges from 0 (no disadvantage) to 5 (most disadvantage).
Abbreviations: SES, Socioeconomic Status
Figure 3.
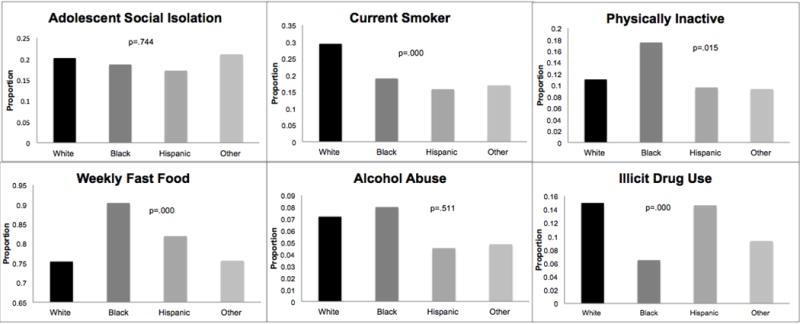
Race/Ethnicity Differentials in Risky Psychosocial and Health Behaviors, Men
Note: Figure based on adjusted logistic regression for each psychosocial and health behavioral outcome, with only men included in the models. P-value derived from post-estimation Wald test for equality of coefficients for the race/ethnicity for each model. For illustration purposes, the bars for each race/ethnicity category demonstrate the estimated population prevalence for each health behavior outcome for each race/ethnicity category, calculated for males only.
Multivariate results in Table 1 show that adjusting for all social and behavioral variables, social disparities in obesity and inflammation decreased. In the full model for obesity, the ORs for sex and race effects were no longer statistically significant, suggesting that SES disadvantage and other social behavioral factors accounted for much of the sex and racial differences in obesity risk. While the adolescent SES disadvantage remained a significant predictor of obesity risk in young adulthood, the effect of young adult SES disadvantage was explained by health behaviors. Net of other factors, obesity in adolescence, fast food consumption, and physical inactivity are all significantly associated with the likelihood of obesity in young adulthood, while smoking and drug use are negatively associated with the likelihood of obesity.
In the full model for CRP, sex and race coefficients remained statistically significant, but blacks no longer showed more inflammation than whites after adjusting for behavioral risk factors. SES disadvantage in either adolescence or young adulthood was no longer predictive of CRP levels. The significant coefficients for social isolation, cigarette smoking, physical inactivity, fast food consumption, and obesity suggest that they are potentially important mechanisms underlying the SES-inflammation link.
DISCUSSION
This study contributes to extant literature on cancer disparities and prevention. First, the mechanisms underlying the social gradient in cancer risk were not well documented. Metabolic dysregulation and inflammatory processes are integral parts of the initiation and progression of many cancers. This study of the biosocial linkages shows how social status “gets under the skin” to influence cancer biology. Second, a life course approach was used to illuminate points of intervention in early life periods that can more effectively curtail the emergence of adverse bodily change relevant to cancer and delay or prevent the onset of malignancy. Third, substantial heterogeneity in biological risk factors by sex, race, and SES in the current study sheds light on the early life origins of social disparities in cancer risks later in life. The specification of SES disadvantage as well as other environmental exposures at different points in time allows the examination of the timing and duration of their harmful effects in early life. In support of a sensitive period model, the findings indicate the lasting influences of the adolescent SES on obesity risk and social isolation on inflammation in early adulthood.4 Other behavioral risk factors are contemporaneously associated with obesity and inflammation and contribute to the social stratification of these biomarkers in young adults. These findings aid the ascertainment of the specific time window in which modification would provide maximum benefits.
The findings from this study also have important implications for clinical intervention and control strategies that were not known before in the absence of nationally representative data on young adults. The social demographic distribution of cancer precursors and their behavioral underpinning helps to pinpoint unusual at-risk subpopulation groups. Adolescent social isolation predicted CRP but not obesity in the final models. Adolescent isolation may be indirectly associated with obesity in young adulthood via the other behavioral covariates included in the full model. Higher SES respondents showed higher rates of illicit drug use, consistent with previous studies that find young people from both the least and most privileged backgrounds might be at elevated risk of substance abuse problems.51 Black males with relatively high SES are at elevated risks for obesity and inflammation. Interventions targeted at these specific groups of young adult population would thus be particularly effective to reduce cancer disparities later in life. The differential associations of race and SES with various biological and behavioral outcomes also suggest that these two are not synonymous risk factors and should be treated as independent contributors to cancer related outcomes.
Limitations
The study has limitations for future investigations to consider. First, there are other biomarkers of immune functions that may be important to include in studies of cancer biology. Additionally, BMI is an indirect indicator of body fat percentage, and the accuracy of clinically significant cutoffs for obesity may vary between population sub-groups.52, 53 Second, CRP is not available at wave I to permit a longitudinal analysis of change in inflammation over time. The findings in this study are thus best interpreted as prospective associations of baseline social status and inflammation at the follow-up. Third, Add Health is an on-going study and has yet to provide more longitudinal follow-up data on the current cohort of young adults as they age into mid adulthood when cancer incidence starts to increase. Until then, there can be no definitive conclusion about the life course pathways linking social status, inflammation and related biological mechanisms, and cancer outcomes. Despite these limitations, the novel use of individual-level data and biomarker CRP represent major strengths of the study.
Conclusions
This study has provided new knowledge about differential exposures early in life to physiological precedents to cancer development later in life in the general population. Many social and cultural changes occurring in the U.S. related to gender, race, and SES based exposures to risk factors for cancer in younger adults may continue to shape and modify the projections of cancer burden on the aging society in the future. Social, structural and behavioral mechanisms examined over the life course provide insights into possible approaches to influence the development of cancer, potentially years before the cancers become clinically evident.
Supplementary Material
Appendix Table S1. Missing Data Description
Appendix Table S2. Detailed Description of Covariates
Appendix Table S3. Sample Characteristics: Weighted Descriptive Statistics, Add Health: 1994 – 2009
Acknowledgments
Yang Claire Yang, Moira P. Johnson, Kristen M. Schorpp, Courtney E. Boen, and Kathleen Mullan Harris contributed to this study.
Research was supported by the National Science Foundation Graduate Research Fellowship under Grant No. DGE-1144081. This research is also supported by the University Cancer Research Funds at Lineberger Cancer Center and Carolina Population Center NICHD-NRSA training grant 5-T32-HD07168, University of North Carolina at Chapel Hill. This research uses data from Add Health, a program project directed by Kathleen Mullan Harris and designed by J. Richard Udry, Peter S. Bearman, and Kathleen Mullan Harris at the University of North Carolina at Chapel Hill, and funded by grant P01-HD31921 from the Eunice Kennedy Shriver National Institute of Child Health and Human Development, with cooperative funding from 23 other federal agencies and foundations. Special acknowledgment is due Ronald R. Rindfuss and Barbara Entwisle for assistance in the original design. Information on how to obtain the Add Health data files is available on the Add Health website (http://www.cpc.unc.edu/addhealth). No direct support was received from grant P01-HD31921 for this analysis. The design and interpretation of the analysis conducted by the authors were not directly influenced by any of the funding sources.
Yang Claire Yang led the conceptual and analytic designs of the study, drafted and revised the paper. Moira P. Johnson conducted the statistical analyses, created tables and figures, and contributed to the substantive writing of all sections of the paper. Kristen M. Schorpp, Courtney E. Boen, and Kathleen Mullan Harris contributed to the study design, the interpretation and implications of the analyses, and provided crucial feedback for the final written version of the study.
The findings from this article have been previously presented at the UNC Chapel Hill Lineberger Cancer Center.
Footnotes
Financial Disclosure: No financial disclosures were reported by the authors of this paper.
The research presented in this paper is that of the authors and does not reflect the official policy of the NICHD.
Appendix Materials
References
- 1.Eheman C, Henley SJ, Ballard-Barbash R, et al. Annual report to the nation on the status of cancer, 1975-2008, featuring cancers associated with excess weight and lack of sufficient physical activity. Cancer. 2012;118(9):2338–2366. doi: 10.1002/cncr.27514. [DOI] [PMC free article] [PubMed] [Google Scholar]
- 2.Siegel R, Naishadham D, Jemal A. Cancer statistics, 2013. CA Cancer J Clin. 2013;63(1):11–30. doi: 10.3322/caac.21166. [DOI] [PubMed] [Google Scholar]
- 3.Alberg AJ, Ford JG, Samet JM. Epidemiology of lung cancer: ACCP evidence-based clinical practice guidelines. Chest. 2007;132(3_suppl):29S–55S. doi: 10.1378/chest.07-1347. [DOI] [PubMed] [Google Scholar]
- 4.Kuh D, Shlomo YB. A life course approach to chronic disease epidemiology. Oxford University Press; 2004. [Google Scholar]
- 5.Siegel RL, Miller KD, Jemal A. Cancer statistics, 2016. CA Cancer J Clin. 2016;66(1):7–30. doi: 10.3322/caac.21332. [DOI] [PubMed] [Google Scholar]
- 6.Ben-Shlomo Y, Kuh D. A life course approach to chronic disease epidemiology: Conceptual models, empirical challenges and interdisciplinary perspectives. Int J Epidemiol. 2002;31(2):285–293. [PubMed] [Google Scholar]
- 7.Blackwell DL, Hayward MD, Crimmins EM. Does childhood health affect chronic morbidity in later life? Soc Sci Med. 2001;52(8):1269–1284. doi: 10.1016/s0277-9536(00)00230-6. [DOI] [PubMed] [Google Scholar]
- 8.Friedenreich CM, Orenstein MR. Physical activity and cancer prevention: Etiologic evidence and biological mechanisms. J Nutr. 2002;132(11 Suppl):3456S–3464S. doi: 10.1093/jn/132.11.3456S. [DOI] [PubMed] [Google Scholar]
- 9.Kushi LH, Byers T, Doyle C, et al. American cancer society guidelines on nutrition and physical activity for cancer prevention: Reducing the risk of cancer with healthy food choices and physical activity. CA Cancer J Clin. 2006;56(5):254–281. doi: 10.3322/canjclin.56.5.254. [DOI] [PubMed] [Google Scholar]
- 10.Galobardes B, Lynch JW, Davey Smith G. Childhood socioeconomic circumstances and cause-specific mortality in adulthood: Systematic review and interpretation. Epidemiol Rev. 2004;26:7–21. doi: 10.1093/epirev/mxh008. [DOI] [PubMed] [Google Scholar]
- 11.Bengtsson T, Mineau GP. Early-life effects on socio-economic performance and mortality in later life: A full life-course approach using contemporary and historical sources. Soc Sci Med. 2009;68(9):1561–1564. doi: 10.1016/j.socscimed.2009.02.012. [DOI] [PubMed] [Google Scholar]
- 12.Wolin KY, Carson K, Colditz GA. Obesity and cancer. Oncologist. 2010;15(6):556–565. doi: 10.1634/theoncologist.2009-0285. [DOI] [PMC free article] [PubMed] [Google Scholar]
- 13.De Pergola G, Silvestris F. Obesity as a major risk factor for cancer. J Obes. 2013;2013:291546. doi: 10.1155/2013/291546.. [DOI] [PMC free article] [PubMed] [Google Scholar]
- 14.Calle EE, Thun MJ. Obesity and cancer. Oncogene. 2004;23(38):6365–6378. doi: 10.1038/sj.onc.1207751. [DOI] [PubMed] [Google Scholar]
- 15.Ungefroren H, Gieseler F, Fliedner S, Lehnert H. Obesity and cancer. Horm Mol Biol Clin Investig. 2015;21(1):5–15. doi: 10.1515/hmbci-2014-0046. [DOI] [PubMed] [Google Scholar]
- 16.Renehan AG, Tyson M, Egger M, Heller RF, Zwahlen M. Body-mass index and incidence of cancer: A systematic review and meta-analysis of prospective observational studies. Lancet. 2008;371(9612):569–578. doi: 10.1016/S0140-6736(08)60269-X. [DOI] [PubMed] [Google Scholar]
- 17.O’Rourke RW. Obesity and cancer: At the crossroads of cellular metabolism and proliferation. Surg Obes Relat Dis. 2014;10(6):1208–1219. doi: 10.1016/j.soard.2014.08.012. [DOI] [PMC free article] [PubMed] [Google Scholar]
- 18.Grivennikov SI, Greten FR, Karin M. Immunity, inflammation, and cancer. Cell. 2010;140(6):883–899. doi: 10.1016/j.cell.2010.01.025. [DOI] [PMC free article] [PubMed] [Google Scholar]
- 19.Takahashi H, Ogata H, Nishigaki R, Broide DH, Karin M. Tobacco smoke promotes lung tumorigenesis by triggering IKKβ-and JNK1-dependent inflammation. Cancer Cell. 2010;17(1):89–97. doi: 10.1016/j.ccr.2009.12.008. [DOI] [PMC free article] [PubMed] [Google Scholar]
- 20.Ogden CL, Carroll MD, Kit BK, Flegal KM. Prevalence of childhood and adult obesity in the united states, 2011-2012. JAMA. 2014;311(8):806–814. doi: 10.1001/jama.2014.732. [DOI] [PMC free article] [PubMed] [Google Scholar]
- 21.Reither EN, Hauser RM, Yang Y. Do birth cohorts matter? age-period-cohort analyses of the obesity epidemic in the united states. Soc Sci Med. 2009;69(10):1439–1448. doi: 10.1016/j.socscimed.2009.08.040. [DOI] [PMC free article] [PubMed] [Google Scholar]
- 22.Ng M, Fleming T, Robinson M, et al. Global, regional, and national prevalence of overweight and obesity in children and adults during 1980–2013: A systematic analysis for the global burden of disease study 2013. Lancet. 2014;384(9945):766–781. doi: 10.1016/S0140-6736(14)60460-8. [DOI] [PMC free article] [PubMed] [Google Scholar]
- 23.Ogden CL, Lamb MM, Carroll MD, Flegal KM. Obesity and socioeconomic status in adults: United states, 2005–2008. NCHS Data Brief. 2010;50(51):1–8. [PubMed] [Google Scholar]
- 24.Bleich SN, Thorpe RJ, Jr, Sharif-Harris H, Fesahazion R, Laveist TA. Social context explains race disparities in obesity among women. J Epidemiol Community Health. 2010;64(5):465–469. doi: 10.1136/jech.2009.096297. [DOI] [PMC free article] [PubMed] [Google Scholar]
- 25.McLaren L. Socioeconomic status and obesity. Epidemiol Rev. 2007;29:29–48. doi: 10.1093/epirev/mxm001. doi: mxm001 [pii] [DOI] [PubMed] [Google Scholar]
- 26.Yang Y, Kozloski M. Change of sex gaps in total and cause-specific mortality over the life span in the united states. Ann Epidemiol. 2012;22(2):94–103. doi: 10.1016/j.annepidem.2011.06.006. [DOI] [PMC free article] [PubMed] [Google Scholar]
- 27.Khera A, McGuire DK, Murphy SA, et al. Race and gender differences in C-reactive protein levels. J Am Coll Cardiol. 2005;46(3):464–469. doi: 10.1016/j.jacc.2005.04.051. [DOI] [PubMed] [Google Scholar]
- 28.Khera A, Vega GL, Das SR, et al. Sex differences in the relationship between C-reactive protein and body fat. J Clin Enocrinol Metab. 2009;94(9):3251–3258. doi: 10.1210/jc.2008-2406. [DOI] [PMC free article] [PubMed] [Google Scholar]
- 29.Gruenewald TL, Cohen S, Matthews KA, Tracy R, Seeman TE. Association of socioeconomic status with inflammation markers in black and white men and women in the coronary artery risk development in young adults (CARDIA) study. Soc Sci Med. 2009;69(3):451–459. doi: 10.1016/j.socscimed.2009.05.018. [DOI] [PMC free article] [PubMed] [Google Scholar]
- 30.Short SE, Yang YC, Jenkins TM. Sex, gender, genetics, and health. Am J Public Health. 2013;103(S1):S93–S101. doi: 10.2105/AJPH.2013.301229. [DOI] [PMC free article] [PubMed] [Google Scholar]
- 31.Adhikari B, Kahende J, Malarcher A, et al. Smoking-attributable mortality, years of potential life lost, and productivity losses–united states, 2000–2004. MMWR Morb Mortal Wkly Rep. 2008;57(45):1226–1228. doi: mm5745a3 [pii] [PubMed] [Google Scholar]
- 32.Abrams DB. The health consequences of smoking—50 years of progress: A report of the surgeon general. Atlanta, GA: US Department of Health and Human Services, Centers for Disease Control and Prevention, National Center for Chronic Disease Prevention and Health Promotion, Office on Smoking and Health; 2014. p. 17. [Google Scholar]
- 33.Yang YC, Schorpp K, Harris KM. Social support, social strain and inflammation: Evidence from a national longitudinal study of US adults. Soc Sci Med. 2014;107:124–135. doi: 10.1016/j.socscimed.2014.02.013. [DOI] [PMC free article] [PubMed] [Google Scholar]
- 34.Yang YC, Boen C, Gerken K, Li T, Schorpp K, Harris KM. Social relationships and physiological determinants of longevity across the human life span. Proc Natl Acad Sci U S A. 2016;113(3):578–583. doi: 10.1073/pnas.1511085112. [DOI] [PMC free article] [PubMed] [Google Scholar]
- 35.Kroenke CH, Kwan ML, Neugut AI, et al. Social networks, social support mechanisms, and quality of life after breast cancer diagnosis. Breast Cancer Res Treat. 2013;139(2):515–527. doi: 10.1007/s10549-013-2477-2. [DOI] [PMC free article] [PubMed] [Google Scholar]
- 36.Ikeda A, Kawachi I, Iso H, Iwasaki M, Inoue M, Tsugane S. Social support and cancer incidence and mortality: The JPHC study cohort II. Cancer Causes Control. 2013;24(5):847–860. doi: 10.1007/s10552-013-0147-7. [DOI] [PubMed] [Google Scholar]
- 37.Yang YC, Li T, Frenk SM. Social network ties and inflammation in US adults with cancer. Biodemogr Soc Biol. 2014;60(1):21–37. doi: 10.1080/19485565.2014.899452. [DOI] [PMC free article] [PubMed] [Google Scholar]
- 38.Yang YC, McClintock MK, Kozloski M, Li T. Social isolation and adult mortality: The role of chronic inflammation and sex differences. J Health Soc Behav. 2013;54(2):183–203. doi: 10.1177/0022146513485244. [DOI] [PMC free article] [PubMed] [Google Scholar]
- 39.Cordain L, Eaton SB, Sebastian A, et al. Origins and evolution of the western diet: Health implications for the 21st century. Am J Clin Nutr. 2005;81(2):341–354. doi: 10.1093/ajcn.81.2.341. doi: 81/2/341 [pii] [DOI] [PubMed] [Google Scholar]
- 40.Key TJ, Schatzkin A, Willett WC, Allen NE, Spencer EA, Travis RC. Diet, nutrition and the prevention of cancer. Public Health Nutr. 2004;7(1a):187–200. doi: 10.1079/phn2003588. [DOI] [PubMed] [Google Scholar]
- 41.Pelucchi C, Tramacere I, Boffetta P, Negri E, Vecchia CL. Alcohol consumption and cancer risk. Nutr Cancer. 2011;63(7):983–990. doi: 10.1080/01635581.2011.596642. [DOI] [PubMed] [Google Scholar]
- 42.Ye W, Lagergren J, Weiderpass E, Nyren O, Adami HO, Ekbom A. Alcohol abuse and the risk of pancreatic cancer. Gut. 2002;51(2):236–239. doi: 10.1136/gut.51.2.236. [DOI] [PMC free article] [PubMed] [Google Scholar]
- 43.Calabria B, Degenhardt L, Hall W, Lynskey M. Does cannabis use increase the risk of death? systematic review of epidemiological evidence on adverse effects of cannabis use. Drug Alcohol Rev. 2010;29(3):318–330. doi: 10.1111/j.1465-3362.2009.00149.x. [DOI] [PubMed] [Google Scholar]
- 44.Randall D, Degenhardt L, Vajdic CM, et al. Increasing cancer mortality among opioid dependent persons in australia: A new public health challenge for a disadvantaged population. Aust N Z J Public Health. 2011;35(3):220–225. doi: 10.1111/j.1753-6405.2011.00682.x. [DOI] [PubMed] [Google Scholar]
- 45.Link BG, Phelan J. Social conditions as fundamental causes of disease. J Health Soc Behav. 1995;35:80–94. [PubMed] [Google Scholar]
- 46.Baum A, Garofalo J, YALI A. Socioeconomic status and chronic stress: Does stress account for SES effects on health? Ann N Y Acad Sci. 1999;896(1):131–144. doi: 10.1111/j.1749-6632.1999.tb08111.x. [DOI] [PubMed] [Google Scholar]
- 47.McEwen BS, Gianaros PJ. Central role of the brain in stress and adaptation: Links to socioeconomic status, health, and disease. Ann N Y Acad Sci. 2010;1186(1):190–222. doi: 10.1111/j.1749-6632.2009.05331.x. [DOI] [PMC free article] [PubMed] [Google Scholar]
- 48.Crimmins EM, Seeman TE. Integrating biology into the study of health disparities. Popul Dev Rev. 2004;30:89–107. [Google Scholar]
- 49.Whitsel EA, Cuthbertson CC, Tabor JW, et al. Add health wave IV documentation measures of inflammation and immune function. Chapel Hill: Carolina Population Center; 2012. [Google Scholar]
- 50.Kodde DA, Palm FC. Wald criteria for jointly testing equality and inequality restrictions. Econometrica. 1986:1243–1248. [Google Scholar]
- 51.Humensky JL. Are adolescents with high socioeconomic status more likely to engage in alcohol and illicit drug use in early adulthood? Subst Abuse Treat Prev. 2010;5(1):5–19. doi: 10.1186/1747-597X-5-19. [DOI] [PMC free article] [PubMed] [Google Scholar]
- 52.Prentice AM, Jebb SA. Beyond body mass index. Obes Rev. 2001;2(3):141–147. doi: 10.1046/j.1467-789x.2001.00031.x. [DOI] [PubMed] [Google Scholar]
- 53.Barba Corazon, Cavalli-Sforza T, Cutter J, Darnton-Hill I. Appropriate body-mass index for asian populations and its implications for policy and intervention strategies. Lancet. 2004;363(9403):157–163. doi: 10.1016/S0140-6736(03)15268-3. [DOI] [PubMed] [Google Scholar]
Associated Data
This section collects any data citations, data availability statements, or supplementary materials included in this article.
Supplementary Materials
Appendix Table S1. Missing Data Description
Appendix Table S2. Detailed Description of Covariates
Appendix Table S3. Sample Characteristics: Weighted Descriptive Statistics, Add Health: 1994 – 2009