Summary
DNA is strictly compartmentalised within the nucleus to prevent autoimmunity1; despite this cGAS, a cytosolic sensor of dsDNA, is activated in autoinflammatory disorders and by DNA damage2–6. Precisely how cellular DNA gains access to the cytoplasm remains to be determined. Here, we report that cGAS localises to micronuclei arising from genome instability in a model of monogenic autoinflammation, after exogenous DNA damage and spontaneously in human cancer cells. These micronuclei occur after mis-segregation of DNA during cell division and consist of chromatin surrounded by their own nuclear membrane. Breakdown of the micronuclear envelope, a process associated with chromothripsis7, leads to rapid accumulation of cGAS, providing a mechanism by which self-DNA becomes exposed to the cytosol. cGAS binds to and is activated by chromatin and, consistent with a mitotic origin, micronuclei formation and the proinflammatory response following DNA-damage are cell-cycle dependent. Furthermore, by combining live-cell laser microdissection with single cell transcriptomics, we establish that induction of interferon stimulated gene expression occurs in micronucleated cells. We therefore conclude that micronuclei represent an important source of immunostimulatory DNA. As micronuclei formed from lagging chromosomes also activate this pathway, cGAS recognition of micronuclei may act as a cell-intrinsic immune surveillance mechanism detecting a range of neoplasia-inducing processes.
DNA is a key pathogen-associated molecular pattern sensed by innate immune receptors in the cytosol and endosomal compartments8, so strict compartmentalisation of cellular DNA in the nucleus and in mitochondria is necessary to avoid sensing of self-DNA1. Cyclic GMP-AMP synthase (cGAS) is a major cytosolic nucleic acid sensor with dsDNA as its canonical ligand9,10. cGAS activation generates the cyclic dinucleotide cyclic GMP-AMP (cGAMP), which in turn activates a Type I Interferon response via the adaptor Stimulator of Interferon Genes (STING)11. Aberrant recognition of immunostimulatory cytosolic DNA has been implicated in neoplasia and systemic autoinflammatory disease12–14, with cGAS/STING-dependent inflammation associated with mutations in multiple nucleases15.
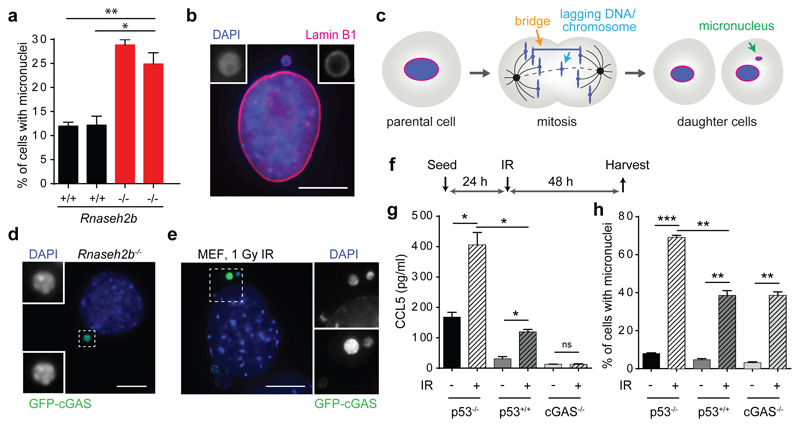
One such nuclease, RNase H2 maintains mammalian genome integrity through its role in ribonucleotide excision repair16, suggesting that endogenous DNA damage may generate the nucleic acid ligands sensed by cGAS. Notably, micronuclei occur at high frequency in Rnaseh2b-/- p53-/- mouse embryonic fibroblasts (MEFs) compared with Rnaseh2b+/+ p53-/- MEFs (hereafter referred to as Rnaseh2b-/- and Rnaseh2b+/+ MEFs respectively; Fig 1a,16). This led us to consider them as a potential source of immunostimulatory DNA. Such micronuclei, surrounded by their own nuclear envelope (Fig 1b), arise during mitosis from lagging chromosomal DNA and chromatin bridges as a consequence of unresolved genome instability (Fig 1c; Supplementary Video 1; Extended data Fig 1a, b). Increased micronuclei formation was also observed in Rnaseh2bA174T/A174T mice (P = 0.0031, Extended data Fig 1c, d), a model for the autoinflammatory disorder Aicardi-Goutières syndrome, confirming that micronuclei as a result of RNase H2 deficiency occur both in vitro and in vivo, irrespective of p53 status. Since the interferon-stimulated gene (ISG) upregulation and proinflammatory response in both Rnaseh2b-/- MEFs and Rnaseh2bA174T/A174T mice is cGAS and STING-dependent5, accumulation of micronuclear DNA correlated with cGAS/STING pathway activation. Investigation of the subcellular localisation of cGAS in Rnaseh2-/- MEFs stably expressing GFP-cGAS established that cGAS was strongly enriched in micronuclei (Fig 1d; 83.3 ± 1.4% of micronuclei were GFP-cGAS positive), whereas GFP alone showed no such localisation (Extended data Fig 1e, f), consistent with cGAS binding micronuclear DNA.
Fig 1. cGAS localises to micronuclei resulting from endogenous and exogenous DNA damage.
(a) Micronuclei form frequently in Rnaseh2b-/- MEFs, associated with genome instability. Percentage of cells with micronuclei in 2 Rnaseh2b+/+ control and 2 Rnaseh2b-/- MEF lines. Mean ± SEM of n=3 independent experiments (≥500 cells counted per line). (b) Micronuclear DNA is surrounded by its own nuclear envelope. Representative image with Lamin B1 (red) staining the nuclear envelope and DAPI staining DNA (blue). (c) Micronuclei form after mitosis as a consequence of impaired segregation of DNA during mitosis, originating from chromatin bridges and lagging chromosomes/chromatin fragments (further description, Supplementary Text). (d) GFP-cGAS localises to micronuclei in Rnaseh2b-/- MEFs. Representative image of GFP-cGAS expressing Rnaseh2b-/- MEFs. (e-h) cGAS localises to micronuclei induced by ionising radiation, and is associated with a cGAS-dependent proinflammatory response. (e) Representative image of GFP-cGAS positive micronuclei following 1 Gy IR in p53-/- MEFs. (f) p53-/-, p53+/+ and cGAS-/- MEFs were irradiated (1 Gy), and CCL5 production (g) and percentage of cells with micronuclei (h) assessed at 48 h. Mean ± SEM of n=2 independent experiments. * = P<0.05, ** = P<0.01, *** = P<0.001, two-tailed t-test; ns = not significant. Scale bars, 10 µm. Rnaseh2b+/+ and Rnaseh2b-/- MEFs in this figure and subsequent figures, are on a p53-/- C57BL/6J background (absence of p53 is a prerequisite for generation of Rnaseh2b-/- MEFs (20)).
To determine if cGAS localisation to micronuclei was a general phenomenon, exogenous DNA damage was induced in GFP-cGAS expressing MEFs. After 1 Gy irradiation cGAS localisation to micronuclei was frequently observed (Fig 1e), along with a cGAS-dependent proinflammatory response. Increased CCL5 secretion (a robust indicator of cGAS-dependent ISG responses in MEFs5) correlated with increased frequency of micronuclei in both p53+/+ and p53-/- MEFs (Fig 1f-h). Furthermore, consistent with increased propensity for micronuclei generation in p53-/- cells, both micronuclei formation and CCL5 production were significantly enhanced. ISG transcript induction was also observed (Extended data Fig 1g) at levels comparable to previous studies of genotoxic damage2,4. In human cells endogenous cGAS could be detected by immunofluorescence, with cGAS observed in spontaneously formed micronuclei in U2OS osteosarcoma epithelial cells (Extended data Fig 1h-j). Strong micronuclear enrichment contrasted with weak diffuse cytoplasmic localisation in cells without micronuclei, consistent with endogenous cGAS re-localisation to micronuclei. We therefore conclude that cGAS frequently localises to micronuclei, irrespective of the source of DNA damage initiating their formation. However, given that a nuclear envelope normally encloses micronuclei, it was not evident how cGAS gains access to these structures.
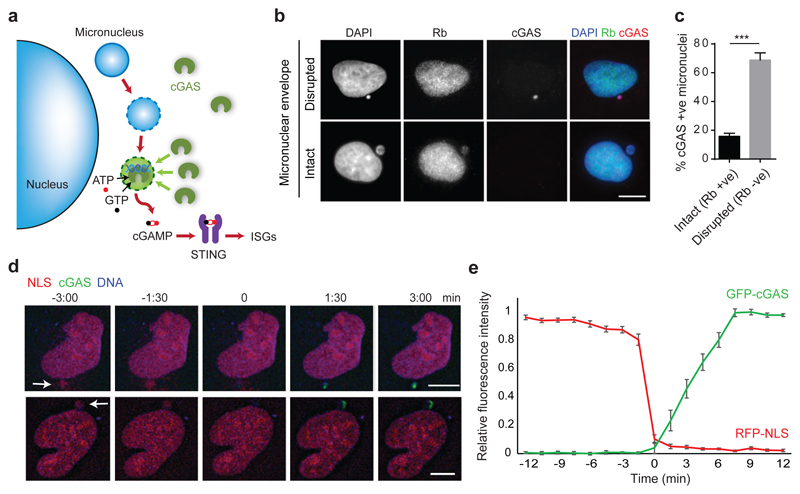
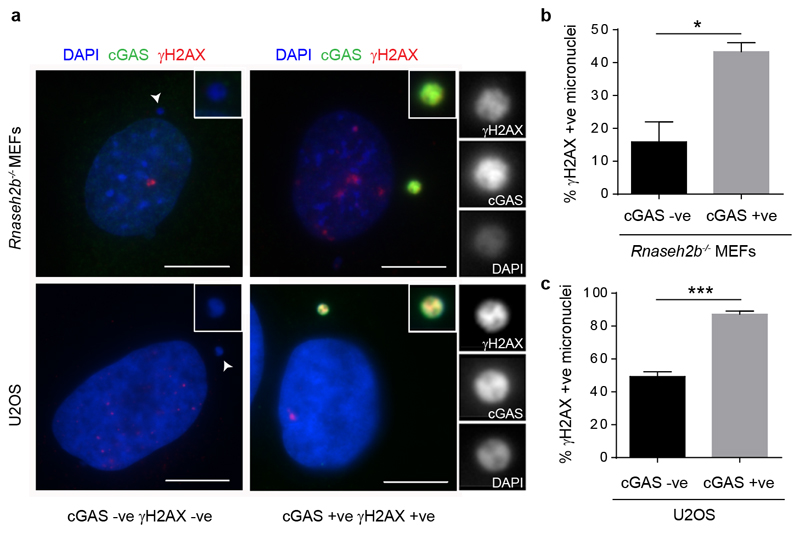
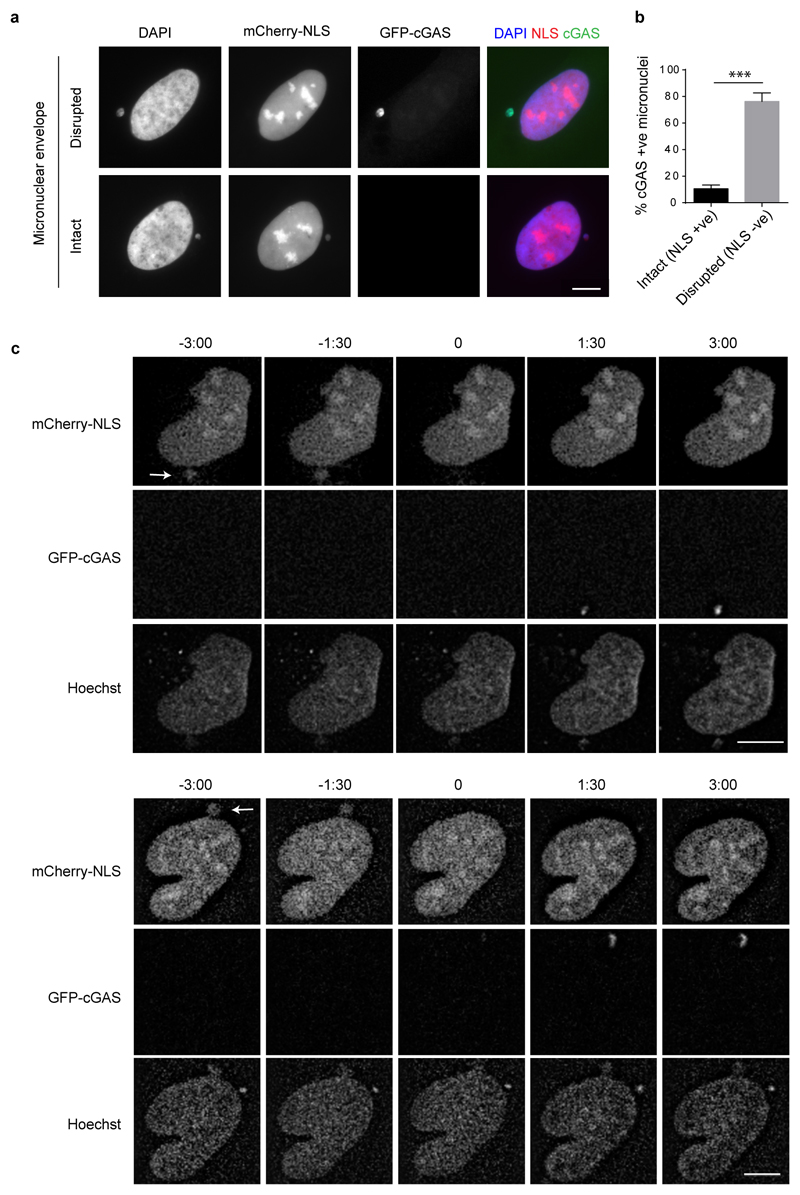
Micronuclear DNA is particularly susceptible to DNA damage, leading to chromothripsis7,17. This occurs as a consequence of irreversible nuclear envelope collapse, which arises frequently in micronuclei due to defective nuclear lamina organisation18. Given that this leads to partial loss of compartmentalisation, we postulated that membrane rupture also results in cGAS relocalisation to micronuclei, to induce a cGAMP-driven proinflammatory response (Fig 2a). Consistent with this, we observed that micronuclei positive for γH2AX, a marker of DNA damage, more often contained cGAS than those without γH2AX staining (P = 0.0169, Rnaseh2b-/- MEFs, P = 0.0005, U2OS cells, Extended data Fig 2a-c). Moreover, co-staining U2OS cells with cGAS and the nuclear protein retinoblastoma (Rb), the latter a marker for micronuclei with intact nuclear envelopes18, demonstrated that the majority of cGAS-positive micronuclei had ruptured nuclear envelopes (Fig 2b, c). Loss of mCherry-tagged nuclear localisation signal (mCherry-NLS) was also strongly associated with cGAS localisation to micronuclei (Extended data Fig 3a, b), further supporting the link between membrane integrity failure and cGAS relocalisation. To establish a direct temporal relationship between nuclear envelope rupture and cGAS relocalisation, live imaging was performed in U2OS cells expressing mCherry-NLS and GFP-cGAS (Fig 2d; Extended data Fig 3c; Supplementary Video 2). cGAS entry occurred rapidly following loss of membrane integrity, as measured by loss of micronuclear mCherry-NLS signal (Fig 2e). We therefore concluded that nuclear envelope rupture results in exposure of DNA to the cytoplasmic compartment, leading to cGAS relocalisation to micronuclear chromatin.
Fig 2. cGAS localises to micronuclei upon nuclear envelope rupture.
(a) Model: Micronuclear membrane rupture leads to cGAS sensing of DNA. Micronuclei are susceptible to nuclear envelope collapse, which permits cytosolic cGAS access to genomic dsDNA, initiating a cGAS-STING dependent proinflammatory immune response through production of the second messenger cGAMP. (b, c) cGAS localisation to micronuclei in U2OS cells inversely correlates with localisation of Rb, the latter present only in micronuclei with an intact nuclear envelope. (b) Representative images. (c) Quantification. Mean ± SEM of n=3 independent experiments (≥250 micronuclei counted per experiment); cGAS +ve : cGAS-stained micronuclei; Rb +ve/-ve: micronuclei positive/negative for Rb staining. (d) Representative stills from live imaging of U2OS cells expressing mCherry-NLS and GFP-cGAS. DNA visualised with Hoechst. Time (min) relative to loss of mCherry-NLS from micronucleus (t=0, micronuclear membrane rupture). Arrows indicate micronuclei undergoing rupture. (e) Quantification of cGAS signal accumulating in micronuclei after loss of nuclear envelope integrity. Relative mean fluorescence intensity plotted. Error bars, SEM of n=11 micronuclei.
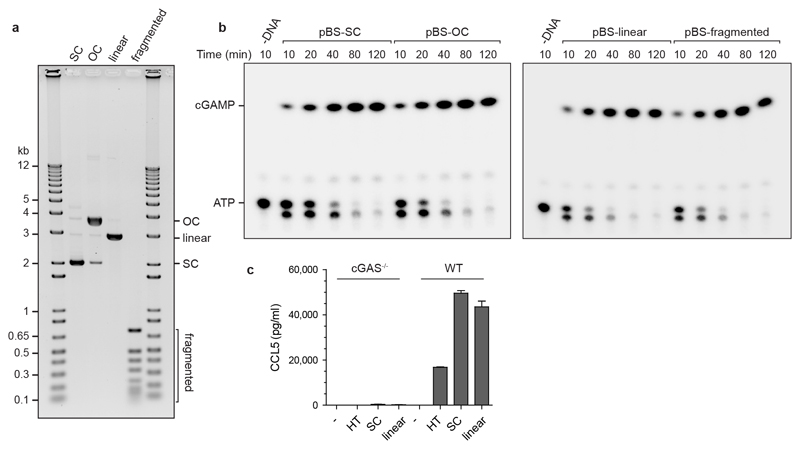
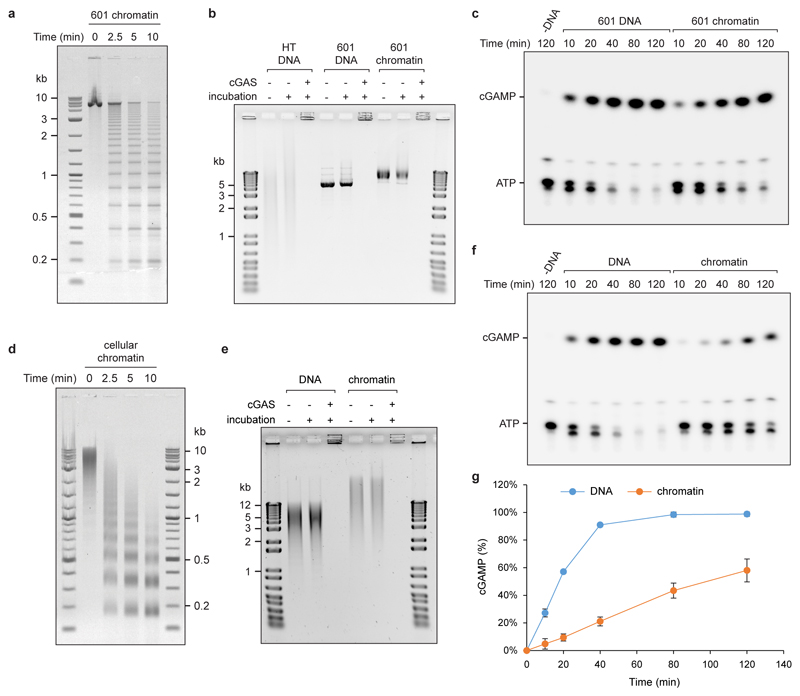
cGAS activation requires dimerization, with each cGAS monomer binding a dsDNA molecule19, which might therefore preclude activation of cGAS-bound chromatin. Additionally, a published model suggests steric clashes between bound DNA molecules and predicts that cGAS activation therefore occurs near dsDNA ends20. However, we reasoned that the flexible nature of DNA could permit cGAS dimerization on continuous DNA and also chromatin, given the accessibility of linker DNA between nucleosomes. To experimentally test if cGAS can be activated by DNA that does not contain free ends, we measured cGAMP production by recombinant cGAS in the presence of plasmid DNA using a chromatography-based assay, demonstrating that cGAMP production was similar for circular DNA and fragmented plasmid DNA (Fig 3a, b; Extended data Fig 4a, b), establishing that DNA ends are not required for cGAS activation. Furthermore, supercoiled plasmid DNA induced strong cGAS-dependent CCL5 production in MEFs (Extended data Fig 4c). We then prepared synthetic chromatin and found that cGAS can also bind to DNA in the presence of nucleosomes (Extended data Fig 5a, b), and that this leads to substantial cGAMP production (Fig 3c; Extended data Fig 5c). Isolated cellular chromatin also activated recombinant cGAS (Extended data Fig 5d-g). We therefore conclude that cGAS can bind to and be activated by chromatin.
Fig 3. Continuous and chromatinised DNA activate cGAS.
(a, b) Supercoiled and fragmented pBluescript (pBS) both activate recombinant cGAS to produce cGAMP. (a) Representative image of thin layer chromatography (TLC) detection of cGAMP. (b) Quantification of cGAMP measured by TLC over time demonstrates no significant difference in cGAS activation by open circle, linear and fragmented plasmid DNA, with supercoiled DNA showing a minor reduction in cGAMP production. Mean ± SD, n=3 independent experiments. (c) Synthetic chromatin activates cGAS at the same level as herring testis (HT) DNA, but slightly less than the corresponding naked 601 DNA. Quantification of cGAMP measured by TLC. Mean ± SD, n=3 experiments.
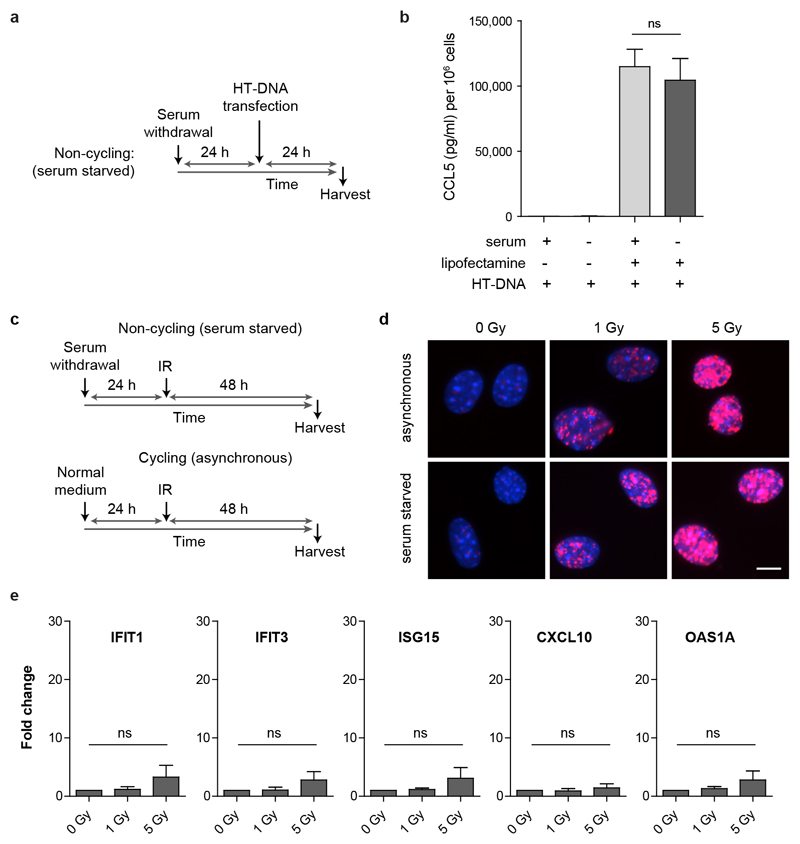
Small DNA fragments detected by dsDNA antibodies have been proposed to leak from sites of DNA damage through the interphase nuclear envelope into the cytoplasm as a cause of cGAS/STING pathway activation2,21. In contrast, as micronuclei are generated at mitosis, a prediction of our model is that the immune response will be cell-cycle dependent. To test this we induced DNA damage in embryonic fibroblasts arrested in G0 by serum starvation. Such cell-cycle arrested fibroblasts still displayed functional cGAS signalling, producing similar amounts of cytokine to actively cycling cells in response to transfected exogenous DNA (Extended data Fig 6a, b). However, they did not form micronuclei, nor did they exhibit innate immune activation after equivalent levels of ionizing radiation, despite equal levels of DNA damage (Fig 4a-d; Extended data Fig 6d, e). Therefore, DNA damage is not sufficient by itself for innate immune activation in response to ionizing radiation, with the dependence on cell-cycle progression consistent with mis-segregated DNA at mitosis as the origin of cGAS activation. Quantification of the levels of micronuclear DNA (Extended data Fig 7, supplementary text) indicates it would be sufficient to generate a relevant cytokine response, also supporting micronuclei as an important source of cell-intrinsic immunostimulatory DNA.
Fig 4. Innate immune activation after radiation induced DNA damage is cell cycle dependent.
(a) Schematic of experimental protocol. (b) CCL5 production is significantly increased after IR for cycling (asynchronous) cells, but not for cells arrested in G0 after serum starvation. (c) Micronuclei levels are elevated after IR in cycling but not G0-arrested cells. Mean ± SEM, n=3 independent experiments. (d) Cycling and G0-arrested cells exhibit the same level of DNA damage as measured by γH2AX foci formation per cell. Mean ± SD, n=2 independent experiments, ≥100 cells analysed per condition per experiment. (Only 1 Gy quantified, as γH2AX foci overlapped substantially at 5 Gy, see EDF6). ** = P<0.01, *** = P<0.001, two-tailed t-test; ns = not significant.
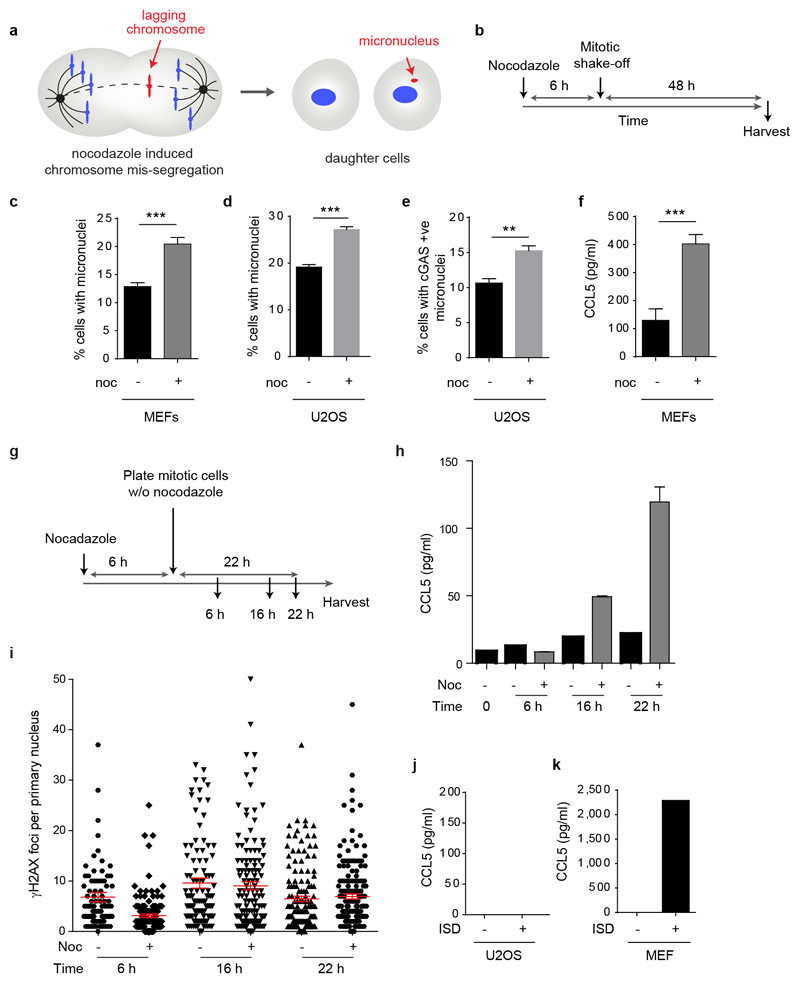
Additionally, we examined whether micronuclei initiated by a DNA damage-independent mechanism similarly resulted in cGAS relocalisation and an associated inflammatory response. Micronuclei containing whole chromosomes were generated through pharmacological induction of lagging chromosomes by nocodazole treatment (Extended data Fig 8a, b), a previously validated method7,18. This resulted in a substantially increased frequency of micronuclei in both MEFs and U2OS cells (Extended data Fig 8c, d). Numbers of cGAS positive micronucleated cells were also significantly increased (Extended data Fig 8e), leading us to conclude that nocodazole-induced micronuclei were also detectable by endogenous cGAS. An inflammatory response following micronuclei induction by nocodazole was also observed with significantly elevated CCL5 cytokine production detected in MEFs (Extended data Fig 8f). This was detectable from ~16 h after nocodazole treatment, consistent with a post-mitotic origin (Extended data Fig 8h). We therefore conclude that micronuclei arising from missegregated chromosomes, as well as genome instability, may induce cGAS signalling.
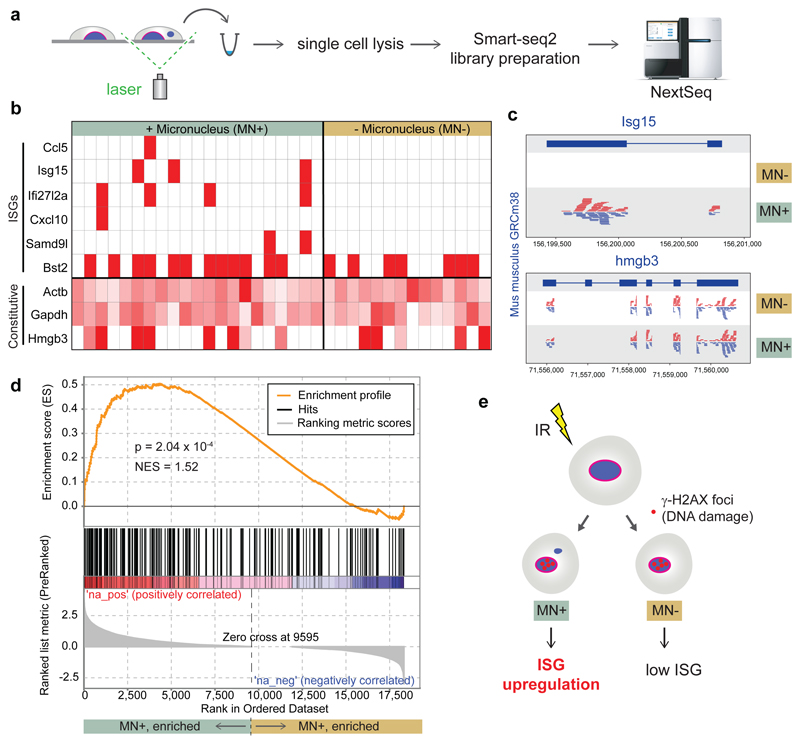
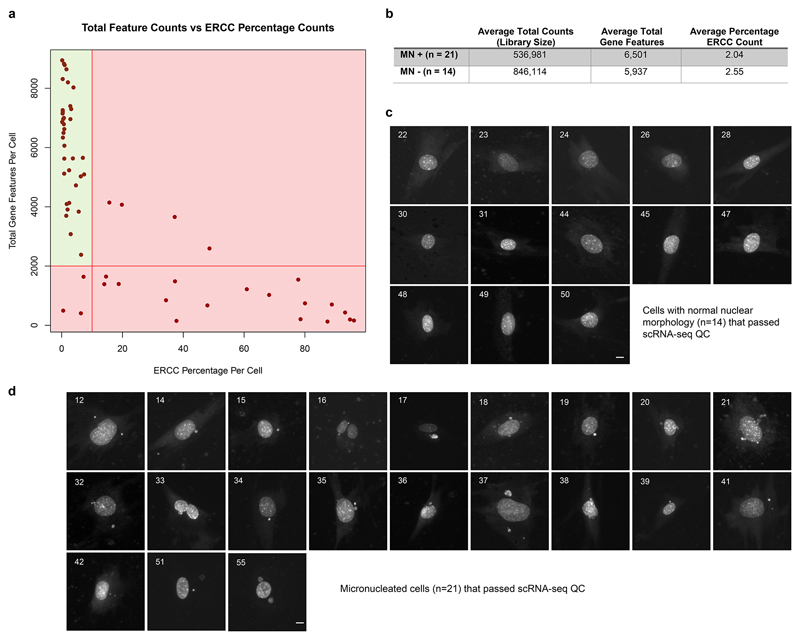
To confirm a direct relationship between micronuclei and cGAS pathway activation we assessed at the single cell level whether the induction of ISGs was specific to micronucleated cells. At 48 h post-irradiation (1Gy) we identified individual micronucleated cells (MN+) and control cells with normal nuclear morphology (MN-) microscopically (Extended Data Fig 9), and isolated these using laser capture microdissection for subsequent single-cell mRNA-seq (Fig 5A). Thirty five RNA sequencing libraries passed QC (Extended data Fig 9a). To avoid confounding biases all cells were collected from the same culture dish, processed in parallel, with library preparation performed in a single 96-well plate with MN+ and MN- cells interdigitated, and sequencing datasets down-sampled to the same number of reads after mapping. We first examined a high confidence list of 11 ISGs that we had previously observed to be induced by endogenous genome instability in MEFs5. Six of the ISG were represented in the RNA sequencing data, and strikingly we detected transcripts for five of these, Ccl5, Isg15, Ifi27l2a, Samd9l and Cxcl10 specifically in micronucleated cells (P = 0.047, Fisher’s exact, Fig 5b). Examination of pooled cells down-sampled to identical numbers of sequence reads aligned to these individual genes confirmed differential expression between the MN+ and MN- control cells (Fig 5c).
Fig 5. ISG upregulation occurs specifically in micronucleated cells following DNA damage.
(a) Experimental outline: 48 h after irradiation (1 Gy) of C57BL/6J MEFs, individual live cells with normal nuclear morphology (MN-) or with micronuclei (MN+) were identified microscopically and excised by laser microdissection. Single cell transcriptomes were then generated. (b, c) Transcripts of multiple ISGs were detected only in micronucleated cells. (b) Heat map for individual cells, with ISGs and constitutively expressed control genes (Actb, Gapdh, Hmgb3) indicated. Red boxes denote detection of ≥1 read per ISG. Control genes shaded in red according to read count relative to the maximum observed for each gene. (c) Alignment of pooled sequence reads to Isg15 and Hmg3b. (d) Transcriptome-wide analysis (GSEA) demonstrates that a set of 336 ISG genes is significantly enriched (P = 2.04 x 10⁻⁴) in transcriptomes of micronucleated cells. (e) Interpretation of single cell data: After induction of DNA damage by IR, ISG upregulation preferentially occurs in micronucleated cells to those with normal nuclear morphology exposed to identical experimental conditions.
We next assessed the MN+ specific upregulation of a large set of independently defined type I IFN induced genes (n=336 ISGs) on a transcriptome-wide basis. We performed a gene set enrichment analysis (GSEA), against genes ranked by z-scores for differential expression (MN+ versus MN-) calculated by the Single Cell Differential Expression (SCDE) analysis package. GSEA confirmed that expression of these ISGs was significantly enriched in the pool of micronucleated cells over control cells (Fig 5d; Normalized Enrichment Score = 1.52, P = 2.04x10⁻⁴). These single-cell analyses were therefore consistent with micronucleated cells being the source of DNA damage-induced ISGs (Fig 5E). We conclude that, while the formal possibility remains that other dsDNA fragments in cells with micronuclei also activate cGAS, this and our other experimental findings strongly implicate micronuclei as a substantial source of cell intrinsic immunostimulatory DNA.
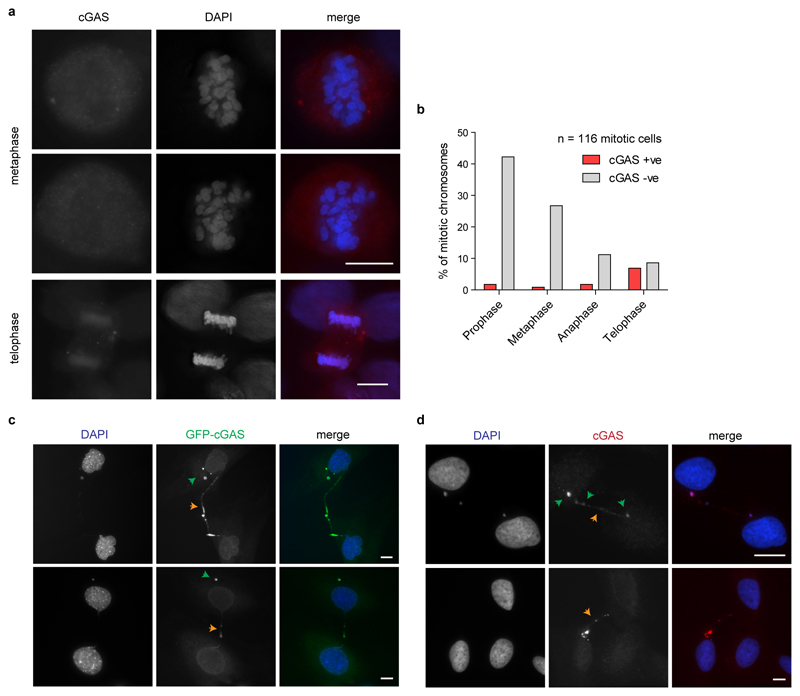
Micronuclear membrane breakdown provides a mechanism by which dsDNA is exposed to the cytoplasmic sensor cGAS, with spontaneous rupture frequent and generally irreversible18. As chromatin activates cGAS, physiological ruptures in the primary nuclear membrane when cells migrate through tight interstitial spaces may also cause transient cGAS activation22,23. Notably, mitotic chromosomes are temporarily exposed to the cytosol, prompting an important question for the field as to how cGAS/STING pathway activation is prevented during cell division. While cGAS can localise to nuclear DNA at mitosis (Extended data Fig 10a, b), the transient nature of mitosis, hyper-compaction of DNA and the peri-chromosomal layer of proteins may mitigate against cGAS binding and activation. Additionally, post-translational regulation of cGAS or downstream pathway components in conjunction with transcriptional silencing of mitotic chromosomes could also prevent ISG induction.
Conversely, nuclear membrane breakdown in disease states24, may be of pathological significance. Additionally, other aberrant structures generated during cell division may lead to cytosolic DNA exposure. For instance, we infrequently observed cGAS on interphase chromatin bridges in Rnaseh2b-/- cells and in U20S cancer cells (Extended data Fig 10c, d); so persistent chromatin bridges, such as those arising after telomere crisis25, could also activate cGAS. Furthermore, while we observe significantly enhanced ISG induction in micronucleated cells, free dsDNA fragments, perhaps released at mitosis, may also activate cGAS in specific contexts. Therefore, while micronuclei provide a substantial source of immunostimulatory DNA, in other pathological contexts additional mechanisms that impair nuclear compartment integrity may play a role.
Micronuclei frequently form in cancer cells26, and chromosome and genome instability are key drivers of neoplasia27,28. Hence, our work predicts that cGAS will often become activated by this route during neoplastic transformation, leading to cGAS/STING-dependent tumour suppressive immune responses29,30. Consequently, this may lead to selection pressures during cancer evolution to inactivate cGAS/STING signalling, providing an additional explanation for its frequent inactivation in tumours31, alongside oncogene-mediated silencing associated with virally-induced neoplasia32. In conclusion, cGAS sensing of ruptured micronuclei represents a cell-intrinsic surveillance mechanism linking genome instability to innate immune responses, of relevance to both cancer and autoinflammation.
Methods
Mice
The following lines (intercrossed where necessary) were used to provide cells and cell lines for this study: C57BL/6J Rnaseh2btm1d/+ (referred to as Rnaseh2b+/−)5, C57BL/6J Rnaseh2btm2‐hgu‐A174T (referred to as Rnaseh2bA174T/A174T)5, Trp53tm1tyj/J (referred to as p53+/-)33 and 57BL/6NTac‐Mb21d1tm1a(EUCOMM)Hmgu/IcsOrl (referred to as cGas−/−)34. The latter was obtained from the Institute Clinique de la Souris via the European Mouse Mutant Archive. All mouse work was performed in accordance with UK Home Office regulations under a UK Home Office project licence (PPL 60/4424).
Cells and cell culture
C57BL/6J Rnaseh2b-/- p53-/- and Rnaseh2b+/+ p53-/- MEFs were generated from individual E10.5 embryos as previously described5. C57BL/6NTac cGas−/− MEFs and C57BL/6J (p53+/+) MEFs were generated from E13.5 embryos. MEFs were maintained in DMEM supplemented with 10% FCS, 50 U/ml penicillin, 50 μg/ml streptomycin and 0.1 mM β-mercaptoethanol at 37°C in 5% CO2 and 3% O2.
U2OS cells were purchased from the European Collection of Authenticated Cell Cultures (ECACC, Cat no. 92022711) and maintained in McCoy’s 5A medium with L-Glutamine (Gibco) supplemented with 10% FCS, 50 U/ml penicillin and 50 μg/ml streptomycin at 37°C in 5% CO2. All cells were mycoplasma-free, with regular checks performed using the Lonza-Mycoalert Mycoplasma Detection Kit.
Generation of stable cell lines
Rnaseh2b+/+ p53-/- and Rnaseh2b-/- p53-/- MEFs, and U2OS cells stably expressing GFP or GFP-cGAS were generated as follows. GFP-cGAS (the result of cloning the mouse or human cGAS coding sequence into a Gateway-compatible version of pEGFP-C1) and GFP were amplified by PCR and cloned into pMSCV. The resulting pMSCV vectors were transfected into Phoenix packaging cells to generate ecotropic or amphotropic viral particles35, and retroviral supernatant was used to infect the relevant cell lines in the presence of 4 μg/ml polybrene. Cells were selected for stable integration using 2 μg/ml puromycin, and maintained as a heterogeneous pool of stably expressing cells. Stable U2OS GFP-cGAS cells were transfected with pmCherry-NLS (a gift from Martin Offterdinger, Addgene plasmid # 39319,36) using lipofectamine 3000 and selected with 500 μg/ml neomycin (G418, Sigma).
Immunofluorescence
Cells were grown on glass coverslips and fixed in 4% Paraformaldehyde (PFA) in PBS for 20 min at room temperature (RT). Cells were permeabilised in 0.5% Triton X-100 for 5 min prior to blocking for 30 min with 1% BSA in PBS. Coverslips were then incubated with primary antibody for 1 h, followed by incubation with a secondary antibody for 45 min. Primary and secondary antibodies were diluted in blocking buffer and all incubations were performed at RT. Coverslips were mounted using Vectashield Antifade Mounting Medium with DAPI (Vector Laboratories) and imaged using a Photometrics Coolsnap HQ2 CCD camera and a Zeiss Axioplan II fluorescence microscope with Plan-neofluar objectives and images captured with iVision software (BioVision Technologies). All scoring was performed under blinded conditions.
The following antibodies were used for immunofluorescence: cGAS (D1D3G, Cell Signalling, 1:200), phospho-Histone H2A.X (Ser139) (2577, Cell signalling, 1:800), Lamin B1 (ab16048, Abcam, 1:1,000) and Retinoblastoma (554136, BD Biosciences, 1:200). Secondary antibodies, anti-mouse-Alexa488 (A11029), anti-rabbit-Alexa 488 (A11008) and anti-rabbit-Alexa568 (A11036) (all Invitrogen), were used at 1:500 or 1:1,000 dilution.
Determination of micronuclei frequency
Following fixation and DAPI staining, percentage of cells with micronuclei was determined by microscopy under blinded conditions. Micronuclei were defined as discrete DNA aggregates separate from the primary nucleus in cells where interphase primary nuclear morphology was normal. Cells with an apoptotic appearance were excluded.
Erythrocyte micronucleus assay
The presence of micronuclei in erythrocytes was quantified using previously described methods37. 50 µl of blood from female Rnaseh2bA174T/A174T mice and age (209 days old) and sex-matched control C57BL/6J mice was collected and expelled into a 250 µl of heparin solution (500 USP units/ml PBS) on ice. 180 µl of this suspension was expelled into 2 ml of pre-cooled (-80˚C) methanol and aggregates removed by robust tube tapping. The cell suspension was incubated at -80˚C for at least 24 h prior to staining for flow cytometry.
To stain, 12 ml ice cold saline solution (0.9% w/v NaCl, 5.3 mM NaHCO3, pH 7.3) was added to the cell suspension, the tube inverted to mix and placed on ice. Cells were centrifuged at 600 g for 5 min at 4˚C, supernatant removed and cells resuspended by pipetting. 10 µl of cells per sample were stained with 90 µl of staining solution containing 79 µl saline solution, 10 µl RNase A at 10 mg/ml (Sigma) and 1 µl rat anti-mouse CD71-FITC (Invitrogen RM5301) for 30 min on ice followed by 30 min at room temperature (RT). 1 ml of 1.25 µg/ml propidium iodide (Sigma) was added prior to data acquisition, using a LSR Fortessa (BD Biosciences). Data were analysed using FlowJo v.7.6.5 software (Tree Star). As experiment was based on genotypes, no randomisation was possible. Samples were blinded for the FACS procedure but not for analysis.
Assessment of immune responses
Concentration of CCL5 was determined in supernatants by ELISA (R&D Systems). Cellular response to dsDNA was determined using Herring Testes (HT-DNA) (Sigma) at a final concentration of 1 µg/ml (Extended data Fig 6) or interferon stimulatory DNA (ISD naked, InvivoGen) at a final concentration of 1.33 µg/ml (Extended data Fig 1). Cells were incubated overnight and transfected the following using Lipofectamine 2000/3000 in Opti-MEM reduced serum medium (both Thermo Fisher Scientific). Immune response was assessed at 24 h by ELISA using collected supernatant.
Dose response to HT-DNA
C57BL/6J (p53+/+) MEFs (5 x 10⁴) were seeded per well of a 12-well plate, incubated overnight and transfected the following day with HT-DNA at the specified concentrations (between 0-3,000ng per well; Extended data Fig 7) using Lipofectamine 3000 in Opti-MEM reduced serum medium (Thermo Fisher Scientific). After 6 h the medium was replaced, supernatants collected at 24 h and CCL5 concentrations assessed by ELISA.
RT-qPCR
RNA was extracted from adherent cells using the RNeasy kit (Qiagen) as per manufacturer’s instructions and included DNase I treatment. cDNA was prepared using Superscript III RT and random oligomer primers (Thermo Fisher Scientific). qRT-PCR was performed using SYBR Select Master Mix (Thermo Fisher Scientific) on an LC480 Real-Time PCR machine (Roche). The expression of target genes was normalised to the housekeeping gene HPRT using the formula (2−ΔCt). Supplementary Table I shows the primers used.
X-ray irradiation
1.3 × 10⁵ cells were seeded per well of a 6-well plate onto glass coverslips (Fig 1). The following day, cells were irradiated for 1 min at a dose rate of 1 Gy/min using an X-ray irradiation system (Faxitron 43855D, Faxitron X-ray Corporation) operated at 130 kVp. After a further 48 h the culture medium was removed and CCL5 concentration assessed by ELISA (R&D systems). Cells on coverslips were fixed with 4% PFA in PBS for 20 min at RT for immunofluorescence imaging.
Live cell imaging
For live cell imaging, Rnaseh2b-/- p53-/- MEFs transiently expressing RFP-H2B or U2OS cells stably expressing GFP-cGAS and mCherry-NLS were seeded onto glass bottom plates (Greiner Bio One). pRFP-H2B (kind gift from P. Vagnarelli, Brunel University London) was transfected by electroporation with the Neon transfection system (Thermo Fischer Scientific) according to manufacturers’ instructions. Prior to imaging, U2OS cells were treated with 200 ng/ml Nocodazole (Sigma) for 12 h and additionally stained with 0.5 µM SiR-DNA (Spirochrome). Cells were maintained at 37°C in Leibovitz L-15 medium (Gibco). TRITC, FITC and Cy5 image data sets were collected using a 40x PLAN NEOFLUOR (0.75NA) objective on an Axiovert 200 fluorescence microscope (Zeiss) equipped with a Retiga6000 CCD camera (Qimaging) or an Axio-Observer Z1 fluorescence microscope (Zeiss) equipped with an Evolve EMCCD camera (Photometics). Images were recorded every 1.5 min over a 4 h period (U2OS) or every 5 min over a 16 h period (MEFs) using Micromanager (https://open-imaging.com/) and subsequently deconvolved using Volocity software (PerkinElmer).
cGAS recruitment following micronuclear envelope disruption was analysed by measuring the mean fluorescence intensity of mCherry-NLS or GFP-cGAS over time. The mean fluorescence intensity for a cytoplasmic background of matched area was subtracted from the micronuclear signal. The background subtracted fluorescence intensity values were then normalised so that highest fluorescence intensity was 1 and lowest fluorescence intensity 0. The time of rupture (t=0) was set at the point of maximal decline in the mean mCherry-NLS fluorescence signal. Rupture was observed in n=40 micronuclei during live imaging experiments, in 29 of which detectable levels of cGAS were observed subsequently, and time of entry was then quantified in 11 of these, where movie length was sufficient to follow cGAS accumulation to maximal intensity.
Serum Starvation experiments
C57BL/6J (p53+/+) MEFs (1.5 x 10⁵ for asynchronous and 6 x 10⁵ for serum starvation) were seeded per well of a 6-well plate (seeding densities were chosen to achieve similar cell numbers for both conditions at assay endpoint). After 5 h the medium was replaced with low-serum medium (0.25% FCS) for serum starvation, and with fresh medium (10% FCS) for asynchronous/cycling cells. After a further 24 h medium was again replaced with 1.6 ml (0.25% FCS for serum starved cells; 10% FCS for control cells), and cells irradiated with 1 or 5 Gy (at 1 Gy per min) (Faxitron 43855D, Faxitron X-ray Corporation). After 48 h the supernatants and cells were harvested, CCL5 determined by ELISA and RT-qPCR performed.
To assess the immune response of serum starved cells to HT-DNA, C57BL/6J (p53+/+) MEFs (1.5 x 10⁵) were seeded per well of a 6-well plate and grown in 10% or 0.25% FCS containing medium for 24 h. Cells were then transfected with 1 μg per ml Herring testes (HT)DNA in Opti-MEM using Lipofectamine 3000 (Thermo Fisher Scientific). After 6 h the medium was replaced with 10% or 0.25% FCS containing medium respectively, and 24 h after transfection supernatants were taken for ELISA. To ensure differences in cell number (arising from G0 arrest or IR) were not confounders for ELISA results, adherent cells were counted after trypsinization, with ELISA results corrected for final cell number per well.
To assess the frequency of micronuclei by immunofluorescence cells were fixed with 4% PFA for 20 min at room temperature (RT) and permeabilised with 0.5% Triton-X100 for 5 min, cover slips mounted with Vectashield (with DAPI) and the percentage of cells with discrete micronuclei determined under blinded conditions. MN counts : >500 cells per condition per experiment were counted. To assess DNA damage by γH2AX immunofluorescence in serum starved and asynchronous cells after IR, 2 x 10⁵ cells per well of a 6-well plate were seeded on coverslips and incubated in normal or 0.25% FCS medium. Cells were then irradiated with 1 or 5 Gy, and fixed at 2 h post IR. n>100 cells per condition per experiment (n=2).
Chromosome mis-segregation assay
Micronuclei induced by chromosome missegregation were generated pharmacologically by nocodazole treatment as described previously7,18. MEFs were plated at 8 × 10⁵ cells per 100-mm plate, and 24 h later incubated with 100 ng/ml Nocodazole (Sigma) for 6 h. Mitotic cells were then harvested by shake-off and washed three times with PBS before counting and plating. 1 × 10⁵ mitotic cells were plated per well of a 12-well plate into 800 µl of fresh media. 1.5 × 10⁴ mitotic cells were concurrently plated onto a coverslip in one well of a 12-well plate. At 48 h culture medium was removed for ELISA, and cells on coverslips fixed for imaging to determine micronuclei frequency.
To induce micronuclei in U2OS cells, 7 × 10⁵ cells were seeded per 100-mm plate and incubated for 9 h. Cells were then synchronised with 2 mM thymidine (ACROS Organics) for 27 h and released by washing twice and replacing with fresh medium. After 14 h U2OS cells were incubated with 100 ng/ml Nocodazole (Sigma) for 6 h and mitotic cells harvested by shake-off. 3 × 10⁴ mitotic cells were plated onto a coverslip in one well of a 12-well plate and incubated for 48 h prior to processing for microscopic analysis.
Chromosome mis-segregation time course assay
C57BL/6J (p53-/-) MEFs (8 x 10⁵) were plated in 10-cm plates. The next day cells were incubated with 100 ng/ml Nocodazole (Sigma) for 6 h and mitotic cells harvested using the shake-off method. At this point supernatant was taken for the t=0 time point. Mitotic cells (1 x 10⁵) were then plated per well of a 12-well plate; or 7 x 10⁴ on coverslips for immunofluorescence analysis. Asynchronous cells were plated at the same number concurrently. Supernatants were taken and coverslips fixed at 6, 16 and 22 h. Immune response was analysed by ELISA and coverslips were pre-extracted on ice using 0.5% Triton-X100 in PBS for 5 min, cells were then fixed with 4% PFA for 15 min at room temperature (RT). After blocking for 30 min with 3% BSA at RT, γH2AX Ser139 (05-636 Millipore) was added for 2 hr at RT. Alexa Fluor 568 goat anti-mouse secondary antibody (Life technologies) was then applied and incubated for 1 h at RT. Coverslips were mounted using Vectashield antifade mounting medium with DAPI (Vector laboratories) and imaged at RT using a Coolsnap HQ CCD camera (Photometrics) and a Zeiss Axioplan II fluorescence microscope with x40 and x63 Plan-neofluar objectives and acquired using micromanager (http://open-imaging.com/) n≥100 cells per condition (n=1).
siRNA knockdown
Cells were plated at an optimized density (2.5 x 10⁵ U2OS cells in 6-cm dish) before overnight incubation and transfected the following day with siRNA oligonucleotides targeting cGAS (Dharmacon, M-015607-01-0005, siGENOME 115004) or luciferase (CUUACGCUGAGUACUUCGA, Sigma) at a final concentration of 25 nM. Transfections were performed using Oligofectamine (Thermo Fisher Scientific) as per manufacturers’ instructions, in Opti-MEM reduced serum medium (Thermo Fisher Scientific). Transfection medium was replaced with complete medium after 6 h and protein depletion confirmed at 48 h post-transfection by immunoblotting.
Immunoblotting
Whole cell extracts were prepared by lysis and sonication of cells in UTB buffer (8 M urea, 50 mM Tris, pH 7.5, 150 mM β-mercaptoethanol, protease inhibitor cocktail (Roche)) and subsequently analysed by SDS-PAGE following standard procedures. In brief, protein samples (20 µg) were resolved on a 4–12% NuPAGE Novex Bis-Tris mini gel (Thermo Fisher Scientific) and transferred onto a nitrocellulose membrane (GE Healthcare Life Sciences). The following antibodies were used for immunoblotting: cGAS (D1D3G, Cell Signalling, 1:1,000) and Actin (A2066, Sigma, 1:5,000).
cGAS purification
The coding sequence of the enzymatically active portion of human cGAS (aa157-522) was cloned into pGEX6P1 and protein expressed overnight at 18°C by induction with 0.3 mM IPTG in Rosetta-2 cells. Cells were lysed by sonication in 25 mM Tris-HCl pH 8, 1 M NaCl, 10% glycerol, 0.5% IGEPAL CA-630, 1 mM DTT. GST-cGAS was affinity purified using Glutathione Sepharose 4B (GE Healthcare Life Sciences) and cGAS released by PreScission Protease cleavage in 50 mM Tris-HCl pH7.5, 0.5 M NaCl, 1 mM MgCl2, 1 mM DTT.
In vitro assay for cGAS activity
The cGAS enzyme activity assay was performed as described11 with minor modifications. Reactions were carried out at 37°C in 10 μl with 2 μM recombinant cGAS (aa157-522), 100 ng of DNA (or equivalent chromatin), 1 mM GTP and 10 μCi [α-32P]-ATP in 13.75 mM Tris-HCl pH7.5, 37.5 mM NaCl, 4 mM MgCl2. Reactions were stopped by the addition of EDTA. To separate ATP and cGAMP thin layer chromatography (TLC) was performed on 10 x 10 cm HPTLC Silica gel 60 F254 glass plates (Merck Millipore). Samples were spotted onto the plate and separation was performed in n-propanol/ammonium hydroxide/water (11:7:2 v/v/v). The plate was air-dried and images collected using phosphorimaging screens and the FLA-5100 imaging system (Fujifilm).
Chromatin synthesis and purification
Soluble chromatin was prepared from NIH3T3 cells as previously described38,39 but an increased concentration of NP40 detergent (0.2%) was used in buffer NBB and buffer NBR was replaced by buffer NBR2 (buffer NBR modified to contain 1 mM MgCl2 and 1 mM CaCl2). Nuclei were resuspended at 20 A260 in buffer NBR2 and digested with MNase (400 units.ml-1 nuclei; NEB) for 10 min at room temperature. The reaction was stopped by adding EDTA to 10 mM, nuclei were re-suspend in 500 µl of TEP20N (10 mM Tris, pH8; 1 mM EDTA; 20 mM NaCl, 0.5 µM PMSF, 0.05% NP40) and incubated at 4°C overnight. Soluble chromatin was recovered by centrifugation (5 min, 20,000g) and purified on a 10/50% step gradient in TEP80 (10 mM Tris, pH8; 1 mM EDTA; 80 mM NaCl, 0.5 µM PMSF) in a SW55 centrifuge tube (Beckman) and centrifuged at 50,000 RPM for 105 min in a SW55 rotor as described40. Chromatin was recovered by upward displacement whilst monitoring the absorbance at 254 nm in 10 samples of 0.5 ml. Aliquots of each fraction were analysed for DNA and protein to check sample integrity. Peak chromatin fractions were dialysed into TEP80 overnight and the concentration determined by measuring the absorbance at 260 nm in 2 M NaCl, 5 M Urea. Naked DNA was prepared from chromatin by proteinase K treatment in 0.25% SDS, 50 mM NaCl, 5 mM EDTA for 2 h at 55°C, followed by phenol/chloroform extraction and ethanol precipitation.
Synthetic chromatin was prepared using standard approaches adapted from41,42. Essentially a 601 DNA template (25x197bp 601 DNA) was reconstituted with purified chicken core histone octamers at a 1:1 molar ratio in TEP2000 (10 mM Tris, pH 7.5, and 0.2 mM EDTA, 2 M NaCl NaCl, 0.5 µM PMSF) and dialysed from 2 M to 400 mM over 6 hours and then into 10 mM NaCl overnight, using Thermofisher microdialysis cap (10,000 MWCO) in a linear gradient maker. Chromatin concentration was measured by measuring absorbance at 254 nm and reconstitution chromatin was analysed by band-shifts, sucrose gradient sedimentation and nuclease digestion.
Single cell Laser Capture Microdissection
C57Bl/6J MEFs were irradiated (1 Gy) and re-seeded onto 50 mm PEN membrane dishes (Zeiss) 32 h later. Picogreen-containing medium (Quant-iT PicoGreen dsDNA reagent, 4 μl per ml) was added to the cells 48 h post-IR to stain DNA, and laser capture microdissection (LCM) performed as follows. Micronucleated cells (n=32) and control cells with normal nuclear morphology (n=28) were identified from the same dish using a GFP filter, and LCM of individual cells performed using a Zeiss Palm Microbeam 4 Microscope. Cells were collected into 5 μl 0.2% (v/v) Triton-X100, 2 U/μl RNasin Ribonuclease Inhibitor (Promega), snap frozen on dry ice and stored at -80°C until library preparation
cDNA and library preparation
All 60 cells obtained from LCM were processed in two batches (until cDNA amplification), with approximately equal numbers of MN+ and MN- cells in each batch and cDNA from single cells was obtained using the SMART-seq2 protocol43 with minor modifications, as described previously44. Cells from each batch were processed in LCM compatible 0.5 ml Eppendorf tubes until cDNA amplification and both batches then transferred to a single 96 well plates for library generation using Illumina Nextera reagents. Libraries were assessed for size distribution on an Agilent Bioanalyser (Agilent Technologies) with the DNA HS Kit, and then quantified using a Qubit 2.0 Fluorometer (Thermo Fisher Scientific) and the Qubit dsDNA HS assay Kit. Finally, parallel paired end sequencing (2 x 75 bp) was performed using the NextSeq 500/550 Mid-Output v2 (150 cycle) Kit on the NextSeq 550 platform (Illumina).
scRNA-seq data analysis
Reads were mapped against the Ensembl mouse reference genome version GRCm38.p5 with the inclusion of the reference for the spike in controls from the ERCC consortium 45 using STAR RNA-seq aligner 46. For quality control and pre-processing, quantification of mapped reads per gene was calculated using Rsubread 47. Genes with no expression detected in all cells were excluded. The gene counts were loaded into the R package scater and standard QC metrics were calculated 48. QC exclusion criteria were cells with more than 10% of reads mapping to ERCCs or less than 40k reads or less than 2,000 genes detected (at least one read/gene). For the GSEA analysis, genes were ranked from MN+ to MN- using a z-score calculated with the SCDE R package49. The ranked gene list was loaded into GSEA and tested against a list of 336 genes shown by Saleiro et al to be induced in MEFs in response to type I IFN50. For direct comparisons of genes between MN+ and MN- cells in the heat map and browser shots, mapped reads were imported into SeqMonk (https://www.bioinformatics.babraham.ac.uk/projects/seqmonk/) and down-sampled to the same number of reads for every cell. Raw reads were counted over genes and genes with at least one read were scored as detected genes. Heatmaps were generated using Matrix2png51. The upper part of the heatmap (Fig. 5B) shows detected ISGs, from a high confidence list of genome instability induced ISGs, calculated as the overlap between genes identified by Schoggins et al52 and Mackenzie et al5. Out of these 11 genes, transcripts for 5 were not detected in any cell. A Fisher’s exact test was performed under the null hypothesis that there was no excess of transcribed ISGs in MN+ versus MN- cells. Genome browser shots were taken from pooled reads from all MN+ and MN- cells after pools were down-sampled to the same number of reads.
Statistics
All data plotted as averages, with variance as standard error of the mean (SEM) unless stated otherwise. Statistical analysis was performed using Prism (Graphpad Software Inc.). For all quantitative measurements, normal distribution was assumed, with t-tests performed, unpaired and two-sided unless otherwise stated. No statistical methods were used to predetermine sample sizes, which were determined empirically from previous experimental experience with similar assays, and/or from sizes generally employed in the field.
Extended Data
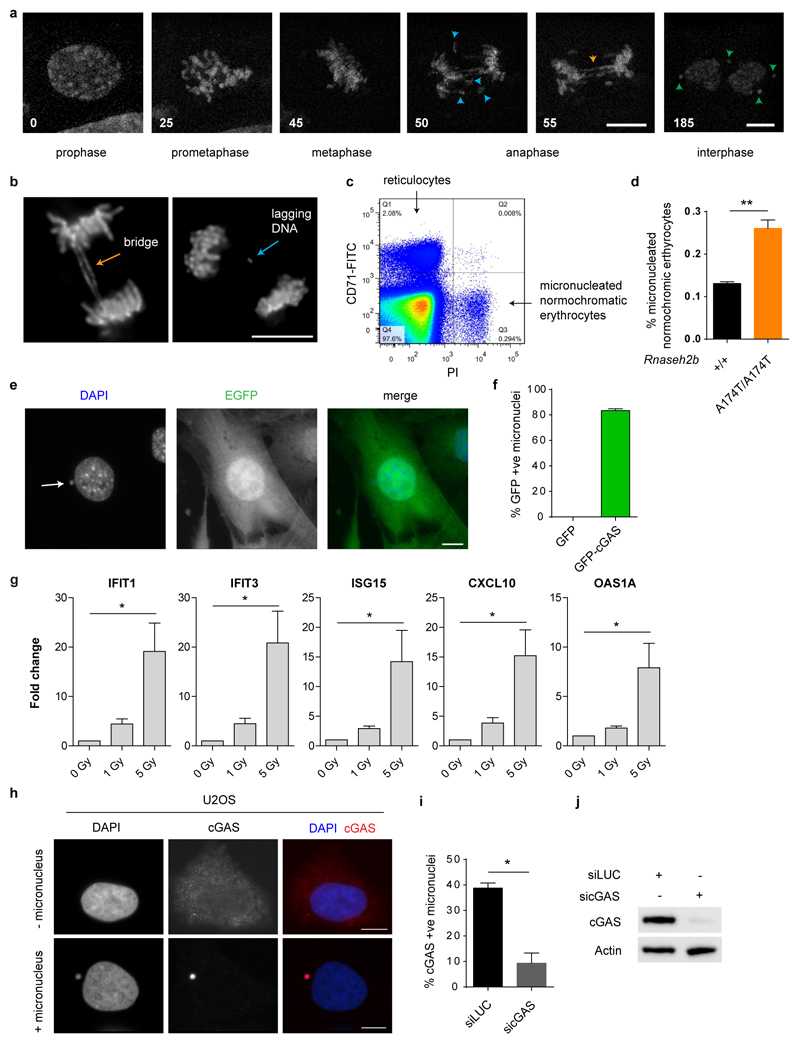
Extended data Fig 1. Micronuclei form in RNase H2 deficiency, with cGAS localising to these structures and inducing an ISG response.
(a) Still images of live imaging in Rnaseh2b-/- MEFs, time in minutes; t=0, prophase. Lagging DNA (blue arrowheads) and DNA bridges (orange) at anaphase can result in interphase micronuclei (green). (b) Chromatin bridges and lagging chromosomal DNA (indicated by arrows) occur in Rnaseh2b-/- MEFs. Representative fixed cell images. (c, d) Erythrocyte micronuclei assay37 (c) Representative FACS plot with quadrants containing reticulocytes and micronucleated normochromatic erythrocytes indicated. (d) Rnaseh2bA174T/A174T mice have a significantly increased frequency of micronucleated erythrocytes. Mean ± SEM, n=3 mice per group; two-tailed t-test, ** = P<0.01. (e, f) EGFP does not accumulate in micronuclei, whereas the majority of micronuclei show strong accumulation of GFP-cGAS. (e) Representative image of micronucleus containing Rnaseh2b-/- MEF stably expressing EGFP. (f) Quantification of GFP positive micronuclei for GFP-cGAS and GFP expressing Rnaseh2b-/- MEF lines. Mean ± SEM, n=4 experiments (≥500 cells counted per experiment). Scale bars, 10 µm. (g) Increased levels of ISG transcripts, IFIT1, IFIT3, ISG15, CXCL10 and OAS1A, were detected in C57Bl/6 (p53+/+) MEFs 48 h after IR (1 Gy). Transcript levels were normalised to HPRT. Mean ± SEM, n=3 independent experiments. One-way ANOVA, 2 degrees of freedom, * = P<0.05 (h) Endogenous cytosolic cGAS accumulates in micronuclei in U2OS cells. Representative images of cGAS distribution in cells with or without micronuclei. Images taken using different exposure times (200 vs 700 ms) to visualise weaker cytosolic cGAS signal. (i, j) Verification of anti-cGAS antibody specificity in human cells. (i) The percentage of cGAS positive micronuclei, using anti-cGAS immunofluorescence, was determined microscopically after cGAS or luciferase siRNA knockdown. Mean ± SEM, n=2 experiments (500 cells counted per experiment); two-tailed t-test. While several commercial cGAS antibodies were assessed, specific detection of mouse cGAS by immunofluorescence was not possible with these reagents (data not shown). (j) Immunoblot after siRNA knockdown of cGAS in U2OS cells. siRNA targeting luciferase (siLUC) was used as a negative control. Probing with anti-actin antibody shows equal loading.
Extended data Fig 2. cGAS localisation is associated with DNA damage in micronuclei.
γH2AX foci in micronuclei correlate with GFP-cGAS localisation in Rnaseh2b-/- MEFs and endogenous cGAS localisation in U2OS cells. (a) Representative immunofluorescence images, γH2AX, red; cGAS, green. (b) Percentage of γH2AX stained micronuclei (γH2AX +ve), either co-stained with cGAS (cGAS +ve), or in which cGAS was not detected (cGAS -ve). Rnaseh2b-/- MEFs; ≥500 cells counted per experiment. (c) Quantification for U2OS cells, ≥250 micronuclei counted per experiment. Mean ± SEM, n=3 experiments; * = P<0.05, *** = P<0.001, two-tailed t-test. While our biochemical studies demonstrate that unbroken DNA and chromatin are sufficient to activate cGAS (Fig 3, Extended data Fig 4 and 5), the increased accessibility of DNA after damage53 could further assist cGAS binding and activation.
Extended data Fig 3. cGAS localises to micronuclei upon nuclear envelope rupture.
(a, b) cGAS localisation to micronuclei in U2OS cells inversely correlates with localisation of mCherry-NLS, the latter present only in micronuclei with an intact nuclear envelope. (a) Representative images of cells containing micronuclei with disrupted or intact nuclear envelope. (b) Percentage of intact and disrupted cGAS positive micronuclei. Mean ± SEM, n=3 independent experiments (≥250 micronuclei counted per experiment). NLS +ve and NLS -ve, mCherry-NLS present in or absent from micronuclei respectively. cGAS +ve, GFP-cGAS present in micronuclei. (c) Single channel image for representative stills shown in Fig 2d from live imaging of U2OS cells expressing mCherry-NLS and GFP-cGAS. DNA visualised with Hoechst. Time (min) relative to loss of mCherry-NLS from micronucleus (t=0, micronuclear membrane rupture). Arrows indicate micronuclei undergoing rupture. Scale bars, 10 µm.
Extended data Fig 4. cGAS is activated by circular plasmid DNA.
(a) Plasmid DNA (SC, supercoiled; OC, open circle; linear and fragmented) separated by agarose gel electrophoresis. pBluescript II SK(+) supercoiled plasmid DNA was treated with Nt.BspQI nicking endonuclease to generate open circle DNA; with EcoRI to generate a single 3 kb linear fragment; or with HpaII to generate 13 fragments between 710 and 26 bp in size. (b) Supercoiled, open circle, linear and fragmented pBluescript (pBS) all activate recombinant cGAS to produce cGAMP. Representative images shown. Quantification of n=3 experiments shown in Fig 3b. (c) Plasmid DNA induces cGAS-dependent CCL5 production in MEFs. Wildtype and cGAS-/- MEFs were transfected with 400 ng of HT-DNA, supercoiled or linearised pBluescript, and CCL5 production after 24 h measured by ELISA. Mean ± SEM, n=3 independent experiments.
Extended data Fig 5. cGAS is activated by chromatin.
(a) Agarose gel of micrococcal nuclease (MNase) digested synthetic chromatin assembled onto a ‘601’ DNA template indicates it has a regular nucleosomal structure. (b) Chromatin and DNA bind recombinant cGAS; DNA in wells could be the result of near charge neutrality of cGAS-DNA complexes or previously reported cGAS oligomerisation. Chromatin is stable under cGAS assay conditions remaining intact during incubation in cGAS reaction buffer, as evidenced by the bandshift compared to naked DNA. (c) Representative TLC image demonstrating cGAMP generation by recombinant cGAS in the presence of chromatin. (d) MNase treatment confirms a nucleosomal ladder pattern for chromatin isolated from mouse NIH3T3 cells. (e) cGAS binds chromatin, and cellular chromatin is stable under cGAS assay conditions. (f, g) Cellular chromatin activates recombinant cGAS, but at a slower rate than the same amount of deproteinised DNA. Representative images shown. Graphs shows quantification from n=3 independent experiments, mean ± SD. Reduced cGAS activation in vitro by chromatin isolated from cells is expected due to 1) the presence of linker histones in addition to the nucleosomal core histones, which has been shown to bind part of the linker DNA, reducing the available sites for cGAS binding, and 2) the use of MNase during the isolation of cellular chromatin. Whereas MNase treatment is needed to fragment the chromatin to allow its purification it will preferentially cleave accessible non-protein-bound portions, which will further reduce the available sites to which cGAS can bind in the final chromatin preparation. However, such nucleosome-free regions are more likely to allow efficient binding and activation of cGAS in vivo.
Extended data Fig 6. ISG induction by ionizing radiation is abrogated in non-cycling cells.
(a) Experimental setup: To arrest cells in G0, serum was withdrawn 24 h before transfection with Herring testis DNA (HT-DNA), and supernatant harvested 24 h later. (b) CCL5 production in response to transfected HT-DNA was equivalent between cycling and serum starved MEFs. Mean ± SEM, n=2 independent experiments. (c) Schematic of experimental protocol. (d) Cycling and G0-arrested cells exhibit the same level of DNA damage as measured by γH2AX foci formation per cell. Representative images; scale bar 10 μm. Quantifications shown in Fig 4d. (e) No significant increase in ISG transcripts, IFIT1, IFIT3, ISG15, CXCL10 and OAS1A, for cells arrested in G0 after serum starvation (experimental setup as in c). Transcript levels were normalised to HPRT. Mean ± SEM. One-way ANOVA, 2 degrees of freedom, n=3 independent experiments; ns = not significant. Compare to Extended data Fig 1g, showing data for matched cycling cells assessed concurrently.
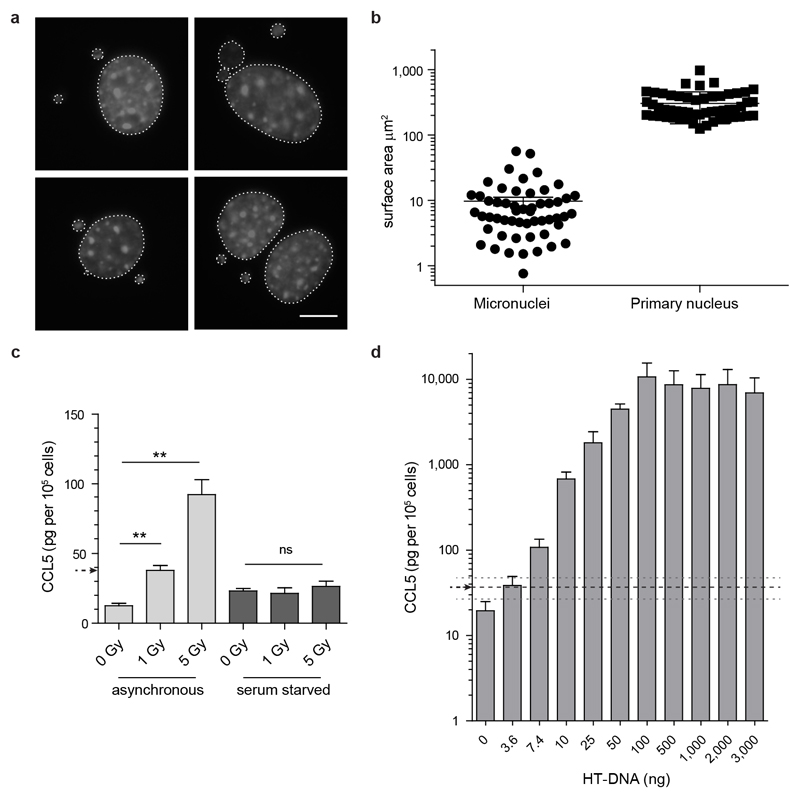
Extended data Fig 7. Micronuclear DNA is sufficient to account for the radiation-induced cytokine response.
(a, b) Measurement of micronuclear DNA content. (a) Representative images. DAPI stained primary nuclei and micronuclei surrounded by dotted lines. Scale bar, 10µm. (b) Quantification of surface area of micronuclei and primary nuclei 48 h after 1 Gy IR. Micronuclear surface area per cell 9.72 ± 1.46 µm2, primary nucleus surface area 303 ± 21 µm2. Horizontal line and error bars: mean ± SEM, n=54 cells. Hence, micronuclear content is ~3.2% of the total MEF genome, post-IR, equating to 190 Mbp of DNA. This corresponds to a total of 8.1 ng of micronuclear DNA in 105 cells post 1 Gy IR (105 diploid murine cells contain a total of 650 ng of genomic DNA, with 39% of cells containing micronuclei, Fig 1h). (c) CCL5 response of wild-type C57/BL6 MEFs to ionizing radiation plotted in pg per 105 cells. Reanalysis of this dataset (first depicted in Fig 4b) confirms that the prior statistical analysis is robust to data normalisation on basis of cell counts at assay endpoint. 1 Gy of irradiation in cycling MEFs results in 38 ± 5 pg (mean ± SD) of CCL5 per 105 cells. (d) Dose response curve of secreted CCL5 in wild-type C57BL/6 (p53+/+) MEFs transfected with serial dilutions of transfected HT-DNA. Therefore around 4 ng of transfected DNA resulted in a similar level of cytokine production to c. Mean, and 95% confidence interval indicated by black and grey dashed lines respectively. Given the similarity of the two estimates, within the same order of magnitude, micronuclear DNA is likely sufficient to account for the immune response observed. Conversely ionizing radiation would not be expected to generate this quantity of small DNA fragments as 1 Gy irradiation generates ~40 double strand breaks (DSBs)54, and ~1,000 base lesions and single-stranded breaks. DSBs will have an average separation of 150 Mbp, and will therefore be too widely spaced to directly generate small dsDNA fragments. Repair of DNA lesions can generate small single-stranded DNA fragments through endonuclease activity. The best characterised are those generated by nucleotide excision repair where endonucleolytic cleavage yields 24-32 nt ssDNA fragments55. As such these are not an ideal substrate for cGAS activation, and 5 million such lesions per cell would have to be generated to produce 4 ng of cytosolic DNA in 105 cells. Hence on the basis of our understanding of the current literature, such DNA fragments are likely to be generated at a level that is orders of magnitude lower than that of micronuclear DNA, after radiation-induced damage.
Extended data Fig 8. Induction of micronuclei originating from lagging chromosomes leads to a proinflammatory response, but not increased DNA damage in the primary nucleus.
(a) Model: micronuclei formation after nocodazole treatment. (b) Schematic of experimental protocol. (c) Percentage of micronucleated cells following nocodazole (noc) treatment of p53-/- MEFs or (d) U2OS cells. Mean ± SEM, n=5 experiments for p53-/- MEFs, n=3 for U2OS cells (e) Percentage of U2OS cells with cGAS positive micronuclei following nocodazole treatment. Mean ± SEM, n=3 experiments. c-e, ≥500 cells counted per experiment. (f) CCL5 secretion following nocodazole treatment of p53-/- MEFs. Mean ± SEM of n=5 experiments. ** = p<0.01, *** = p<0.001, two-tailed t-test; ns = not significant.(g-i) Increased CCL5 production after nocodazole release is observed after 16 h and not associated with increased DNA damage in the primary nucleus. (g) Experimental setup: p53-/- MEFs were arrested with nocodazole for 6 h, mitotic cells harvested by mitotic shake-off and re-plated in fresh media with nocodazole omitted. Supernatants and cells were then collected at indicated time points after growth in medium. (h) Increased CCL5 production was observed from 16 h after release from nocodazole block. Technical duplicate, mean ± SD. Noc (-), asynchronously grown, plated at the same time as mitotic shake-off Noc (+) cells, arrested with nocodazole. (i) No increase in numbers of γH2AX foci in the primary nucleus was observed after release from nocodazole block. n≥100 cells counted per condition. (j, k) CCL5 response to interferon stimulatory DNA (ISD) is absent in (j) U2OS cells but (k) present in MEFs. CCL5 measured by ELISA 8 h after transfection with ISD. n=2 experiments for U2OS cells, n=1 experiment for MEFs.
Extended Data Fig 9. scRNA-seq QC and microscopy images of the individual LCM captured cells.
(a) Total gene feature counts (reads mapping to a protein coding gene) vs ERCC (RNA spike-in) percentage of total counts per cell. Cells with ERCC percentage counts >10% and/or with feature counts < 2,000 were rejected, indicated by red shaded regions. (b) Summary statistics of 21 micronucleated (MN+) cells and 14 non-micronucleated (MN-) cells that passed QC. (c, d) Microcopy images of cells captured by LCM, that passed QC after scRNA-seq. (c) 14 live cells without micronuclei and (d) 21 live cells with micronuclei were isolated from the same culture dish using laser capture microdissection, and used for single cell mRNA sequencing. DNA was stained with picogreen dsDNA stain. Cells shown are those that passed QC; numbers indicate the order in which cells were captured. Scale bars, 10 μm.
Extended data Fig 10. cGAS localises to telophase chromosomes and DNA bridges.
(a) Endogenous cGAS was stained by immunofluorescence of U2OS cells in mitosis, showing a diffuse staining pattern without accumulation at the DAPI stained condensed chromosomes at metaphase. Two representative images shown. During anaphase/telophase cGAS staining can be seen on DNA in some cells. Overexpressed GFP-cGAS is also observed to localise more widely to mitotic DNA in U2OS cells and MEFs (data not shown). (b) Quantification of cGAS staining during mitosis, by stage. (c) Rnaseh2b-/- p53-/- MEFs stably expressing GFP-cGAS show localisation of cGAS at DNA bridges (orange arrowheads). (d) Endogenous cGAS can also be seen to localise to DNA bridges that occasionally occur in U2OS cells. cGAS also localised to micronuclei that occurred in the same cells (green arrow heads). Interphase chromatin bridges with cGAS bound in Rnaseh2b-/- p53-/- MEFs 0.08% of n=1,223 cells; U2OS cells 0.06% of n=1,632 cells. Scale bars, 10 μm.
Supplementary Material
Acknowledgements
We thank J. Rehwinkel, N. Hastie, I. Adams, D. Papadopoulos, C. Ponting and W. Bickmore for discussions and comments on the manuscript, A. Wood, G. Taylor, D. Jamieson, H. Kato, P. Gao and B. Ramsahoye for technical advice and assistance, and Kevin Mackenzie, P. Vagnarelli, H. Kato and T. Fujita for sharing reagents. We thank Roger Greenberg for discussion of unpublished data. We thank the IGMM Transgenic, Sequencing, Imaging and Flow Cytometry facilities and C. Nicol and A. Colley for graphics assistance. This work was funded by the Medical Research Council HGU core grant (MRC, U127580972) (A.P.J., N.G), the Newlife Foundation for Disabled Children (K.J.M.), the Wellcome Trust‐University of Edinburgh ISSF2 (K.J.M.), MRC Discovery Award (MC_PC_15075, TC), by an International Early Career Scientist grant from the Howard Hughes Medical Institute (MN),.an EMBO Long-Term Fellowship (ALTF 7-2015), the European Commission FP7 (Marie Curie Actions, LTFCOFUND2013, GA-2013-609409) and the Swiss National Science Foundation (P2ZHP3_158709) (O.M.).
Footnotes
Data availability statement
Single cell RNA sequencing data that support the findings of this study have been deposited in GEO with the accession code GSE100771.
Author Contributions
KJM, PC, MAMR, CAM, OM, AF, DS, NO, JR, AR, RO, HS, AW, MN and NG performed experiments and analysed data. KJM, NG, TC, MAMR and APJ planned the project/supervised experiments. MAMR, KJM and APJ wrote the manuscript.
The authors declare no competing financial interests.
References
- 1.Roers A, Hiller B, Hornung V. Recognition of Endogenous Nucleic Acids by the Innate Immune System. Immunity. 2016;44:739–754. doi: 10.1016/j.immuni.2016.04.002. [DOI] [PubMed] [Google Scholar]
- 2.Ahn J, et al. Inflammation-driven carcinogenesis is mediated through STING. Nature communications. 2014;5:5166. doi: 10.1038/ncomms6166. [DOI] [PMC free article] [PubMed] [Google Scholar]
- 3.Gao D, et al. Activation of cyclic GMP-AMP synthase by self-DNA causes autoimmune diseases. Proceedings of the National Academy of Sciences of the United States of America. 2015;112:E5699–5705. doi: 10.1073/pnas.1516465112. [DOI] [PMC free article] [PubMed] [Google Scholar]
- 4.Hartlova A, et al. DNA damage primes the type I interferon system via the cytosolic DNA sensor STING to promote anti-microbial innate immunity. Immunity. 2015;42:332–343. doi: 10.1016/j.immuni.2015.01.012. [DOI] [PubMed] [Google Scholar]
- 5.Mackenzie KJ, et al. Ribonuclease H2 mutations induce a cGAS/STING-dependent innate immune response. The EMBO journal. 2016;35:831–844. doi: 10.15252/embj.201593339. [DOI] [PMC free article] [PubMed] [Google Scholar]
- 6.Pokatayev V, et al. RNase H2 catalytic core Aicardi-Goutieres syndrome-related mutant invokes cGAS-STING innate immune-sensing pathway in mice. The Journal of experimental medicine. 2016;213:329–336. doi: 10.1084/jem.20151464. [DOI] [PMC free article] [PubMed] [Google Scholar]
- 7.Zhang CZ, et al. Chromothripsis from DNA damage in micronuclei. Nature. 2015;522:179–184. doi: 10.1038/nature14493. [DOI] [PMC free article] [PubMed] [Google Scholar]
- 8.Paludan SR. Activation and regulation of DNA-driven immune responses. Microbiology and molecular biology reviews : MMBR. 2015;79:225–241. doi: 10.1128/MMBR.00061-14. [DOI] [PMC free article] [PubMed] [Google Scholar]
- 9.Gao P, et al. Cyclic [G(2',5')pA(3',5')p] is the metazoan second messenger produced by DNA-activated cyclic GMP-AMP synthase. Cell. 2013;153:1094–1107. doi: 10.1016/j.cell.2013.04.046. [DOI] [PMC free article] [PubMed] [Google Scholar]
- 10.Sun L, Wu J, Du F, Chen X, Chen ZJ. Cyclic GMP-AMP synthase is a cytosolic DNA sensor that activates the type I interferon pathway. Science. 2013;339:786–791. doi: 10.1126/science.1232458. [DOI] [PMC free article] [PubMed] [Google Scholar]
- 11.Ablasser A, et al. cGAS produces a 2'-5'-linked cyclic dinucleotide second messenger that activates STING. Nature. 2013;498:380–384. doi: 10.1038/nature12306. [DOI] [PMC free article] [PubMed] [Google Scholar]
- 12.Ohkuri T, et al. STING contributes to antiglioma immunity via triggering type I IFN signals in the tumor microenvironment. Cancer immunology research. 2014;2:1199–1208. doi: 10.1158/2326-6066.CIR-14-0099. [DOI] [PMC free article] [PubMed] [Google Scholar]
- 13.Shen YJ, et al. Genome-derived cytosolic DNA mediates type I interferon-dependent rejection of B cell lymphoma cells. Cell reports. 2015;11:460–473. doi: 10.1016/j.celrep.2015.03.041. [DOI] [PubMed] [Google Scholar]
- 14.Barber GN. STING: infection, inflammation and cancer. Nature reviews. Immunology. 2015;15:760–770. doi: 10.1038/nri3921. [DOI] [PMC free article] [PubMed] [Google Scholar]
- 15.Chen Q, Sun L, Chen ZJ. Regulation and function of the cGAS-STING pathway of cytosolic DNA sensing. Nature immunology. 2016;17:1142–1149. doi: 10.1038/ni.3558. [DOI] [PubMed] [Google Scholar]
- 16.Reijns MA, et al. Enzymatic removal of ribonucleotides from DNA is essential for mammalian genome integrity and development. Cell. 2012;149:1008–1022. doi: 10.1016/j.cell.2012.04.011. [DOI] [PMC free article] [PubMed] [Google Scholar]
- 17.Crasta K, et al. DNA breaks and chromosome pulverization from errors in mitosis. Nature. 2012;482:53–58. doi: 10.1038/nature10802. [DOI] [PMC free article] [PubMed] [Google Scholar]
- 18.Hatch EM, Fischer AH, Deerinck TJ, Hetzer MW. Catastrophic nuclear envelope collapse in cancer cell micronuclei. Cell. 2013;154:47–60. doi: 10.1016/j.cell.2013.06.007. [DOI] [PMC free article] [PubMed] [Google Scholar]
- 19.Zhang X, et al. The cytosolic DNA sensor cGAS forms an oligomeric complex with DNA and undergoes switch-like conformational changes in the activation loop. Cell reports. 2014;6:421–430. doi: 10.1016/j.celrep.2014.01.003. [DOI] [PMC free article] [PubMed] [Google Scholar]
- 20.Li X, et al. Cyclic GMP-AMP synthase is activated by double-stranded DNA-induced oligomerization. Immunity. 2013;39:1019–1031. doi: 10.1016/j.immuni.2013.10.019. [DOI] [PMC free article] [PubMed] [Google Scholar]
- 21.Lan YY, Londono D, Bouley R, Rooney MS, Hacohen N. Dnase2a deficiency uncovers lysosomal clearance of damaged nuclear DNA via autophagy. Cell reports. 2014;9:180–192. doi: 10.1016/j.celrep.2014.08.074. [DOI] [PMC free article] [PubMed] [Google Scholar]
- 22.Denais CM, et al. Nuclear envelope rupture and repair during cancer cell migration. Science. 2016;352:353–358. doi: 10.1126/science.aad7297. [DOI] [PMC free article] [PubMed] [Google Scholar]
- 23.Raab M, et al. ESCRT III repairs nuclear envelope ruptures during cell migration to limit DNA damage and cell death. Science. 2016;352:359–362. doi: 10.1126/science.aad7611. [DOI] [PubMed] [Google Scholar]
- 24.Hatch E, Hetzer M. Breaching the nuclear envelope in development and disease. J Cell Biol. 2014;205:133–141. doi: 10.1083/jcb.201402003. [DOI] [PMC free article] [PubMed] [Google Scholar]
- 25.Maciejowski J, Li Y, Bosco N, Campbell PJ, de Lange T. Chromothripsis and Kataegis Induced by Telomere Crisis. Cell. 2015;163:1641–1654. doi: 10.1016/j.cell.2015.11.054. [DOI] [PMC free article] [PubMed] [Google Scholar]
- 26.Gisselsson D, et al. Abnormal nuclear shape in solid tumors reflects mitotic instability. The American journal of pathology. 2001;158:199–206. doi: 10.1016/S0002-9440(10)63958-2. [DOI] [PMC free article] [PubMed] [Google Scholar]
- 27.Aguilera A, Gomez-Gonzalez B. Genome instability: a mechanistic view of its causes and consequences. Nature reviews. Genetics. 2008;9:204–217. doi: 10.1038/nrg2268. [DOI] [PubMed] [Google Scholar]
- 28.Bakhoum SF, Compton DA. Chromosomal instability and cancer: a complex relationship with therapeutic potential. The Journal of clinical investigation. 2012;122:1138–1143. doi: 10.1172/JCI59954. [DOI] [PMC free article] [PubMed] [Google Scholar]
- 29.Ablasser A, Gulen MF. The role of cGAS in innate immunity and beyond. Journal of molecular medicine. 2016 doi: 10.1007/s00109-016-1423-2. [DOI] [PubMed] [Google Scholar]
- 30.Woo SR, et al. STING-dependent cytosolic DNA sensing mediates innate immune recognition of immunogenic tumors. Immunity. 2014;41:830–842. doi: 10.1016/j.immuni.2014.10.017. [DOI] [PMC free article] [PubMed] [Google Scholar]
- 31.Xia T, Konno H, Ahn J, Barber GN. Deregulation of STING Signaling in Colorectal Carcinoma Constrains DNA Damage Responses and Correlates With Tumorigenesis. Cell reports. 2016;14:282–297. doi: 10.1016/j.celrep.2015.12.029. [DOI] [PMC free article] [PubMed] [Google Scholar]
- 32.Lau L, Gray EE, Brunette RL, Stetson DB. DNA tumor virus oncogenes antagonize the cGAS-STING DNA-sensing pathway. Science. 2015;350:568–571. doi: 10.1126/science.aab3291. [DOI] [PubMed] [Google Scholar]
- 33.Jacks T, et al. Tumor spectrum analysis in p53-mutant mice. Current biology : CB. 1994;4:1–7. doi: 10.1016/s0960-9822(00)00002-6. [DOI] [PubMed] [Google Scholar]
- 34.Bridgeman A, et al. Viruses transfer the antiviral second messenger cGAMP between cells. Science. 2015;349:1228–1232. doi: 10.1126/science.aab3632. [DOI] [PMC free article] [PubMed] [Google Scholar]
- 35.Swift S, Lorens J, Achacoso P, Nolan GP. Rapid production of retroviruses for efficient gene delivery to mammalian cells using 293T cell-based systems. Curr Protoc Immunol. 2001 doi: 10.1002/0471142735.im1017cs31. Chapter 10, Unit 10 17C. [DOI] [PubMed] [Google Scholar]
- 36.Micutkova L, et al. Analysis of the cellular uptake and nuclear delivery of insulin-like growth factor binding protein-3 in human osteosarcoma cells. International journal of cancer. 2012;130:1544–1557. doi: 10.1002/ijc.26149. [DOI] [PubMed] [Google Scholar]
- 37.Balmus G, et al. A high-throughput in vivo micronucleus assay for genome instability screening in mice. Nat Protoc. 2015;10:205–215. doi: 10.1038/nprot.2015.010. [DOI] [PMC free article] [PubMed] [Google Scholar]
- 38.Gilbert N, et al. Chromatin architecture of the human genome: gene-rich domains are enriched in open chromatin fibers. Cell. 2004;118:555–566. doi: 10.1016/j.cell.2004.08.011. [DOI] [PubMed] [Google Scholar]
- 39.Naughton C, Sproul D, Hamilton C, Gilbert N. Analysis of active and inactive X chromosome architecture reveals the independent organization of 30 nm and large-scale chromatin structures. Molecular cell. 2010;40:397–409. doi: 10.1016/j.molcel.2010.10.013. [DOI] [PMC free article] [PubMed] [Google Scholar]
- 40.Gilbert N, et al. DNA methylation affects nuclear organization, histone modifications, and linker histone binding but not chromatin compaction. J Cell Biol. 2007;177:401–411. doi: 10.1083/jcb.200607133. [DOI] [PMC free article] [PubMed] [Google Scholar]
- 41.Huynh VA, Robinson PJ, Rhodes D. A method for the in vitro reconstitution of a defined "30 nm" chromatin fibre containing stoichiometric amounts of the linker histone. J Mol Biol. 2005;345:957–968. doi: 10.1016/j.jmb.2004.10.075. [DOI] [PubMed] [Google Scholar]
- 42.Rogge RA, et al. Assembly of nucleosomal arrays from recombinant core histones and nucleosome positioning DNA. J Vis Exp. 2013 doi: 10.3791/50354. [DOI] [PMC free article] [PubMed] [Google Scholar]
- 43.Picelli S, et al. Full-length RNA-seq from single cells using Smart-seq2. Nat Protoc. 2014;9:171–181. doi: 10.1038/nprot.2014.006. [DOI] [PubMed] [Google Scholar]
- 44.Kirschner K, et al. Proliferation Drives Aging-Related Functional Decline in a Subpopulation of the Hematopoietic Stem Cell Compartment. Cell reports. 2017;19:1503–1511. doi: 10.1016/j.celrep.2017.04.074. [DOI] [PMC free article] [PubMed] [Google Scholar]
- 45.Baker SC, et al. The External RNA Controls Consortium: a progress report. Nature methods. 2005;2:731–734. doi: 10.1038/nmeth1005-731. [DOI] [PubMed] [Google Scholar]
- 46.Dobin A, et al. STAR: ultrafast universal RNA-seq aligner. Bioinformatics. 2013;29:15–21. doi: 10.1093/bioinformatics/bts635. [DOI] [PMC free article] [PubMed] [Google Scholar]
- 47.Liao Y, Smyth GK, Shi W. The Subread aligner: fast, accurate and scalable read mapping by seed-and-vote. Nucleic acids research. 2013;41:e108. doi: 10.1093/nar/gkt214. [DOI] [PMC free article] [PubMed] [Google Scholar]
- 48.McCarthy DJ, Campbell KR, Lun AT, Wills QF. Scater: pre-processing, quality control, normalization and visualization of single-cell RNA-seq data in R. Bioinformatics. 2017;33:1179–1186. doi: 10.1093/bioinformatics/btw777. [DOI] [PMC free article] [PubMed] [Google Scholar]
- 49.Kharchenko PV, Silberstein L, Scadden DT. Bayesian approach to single-cell differential expression analysis. Nature methods. 2014;11:740–742. doi: 10.1038/nmeth.2967. [DOI] [PMC free article] [PubMed] [Google Scholar]
- 50.Saleiro D, et al. Central role of ULK1 in type I interferon signaling. Cell reports. 2015;11:605–617. doi: 10.1016/j.celrep.2015.03.056. [DOI] [PMC free article] [PubMed] [Google Scholar]
- 51.Pavlidis P, Noble WS. Matrix2png: a utility for visualizing matrix data. Bioinformatics. 2003;19:295–296. doi: 10.1093/bioinformatics/19.2.295. [DOI] [PubMed] [Google Scholar]
- 52.Schoggins JW, et al. Pan-viral specificity of IFN-induced genes reveals new roles for cGAS in innate immunity. Nature. 2014;505:691–695. doi: 10.1038/nature12862. [DOI] [PMC free article] [PubMed] [Google Scholar]
- 53.Green CM, Almouzni G. When repair meets chromatin. First in series on chromatin dynamics. EMBO reports. 2002;3:28–33. doi: 10.1093/embo-reports/kvf005. [DOI] [PMC free article] [PubMed] [Google Scholar]
- 54.Ciccia A, Elledge SJ. The DNA damage response: making it safe to play with knives. Molecular cell. 2010;40:179–204. doi: 10.1016/j.molcel.2010.09.019. [DOI] [PMC free article] [PubMed] [Google Scholar]
- 55.Staresincic L, et al. Coordination of dual incision and repair synthesis in human nucleotide excision repair. The EMBO journal. 2009;28:1111–1120. doi: 10.1038/emboj.2009.49. [DOI] [PMC free article] [PubMed] [Google Scholar]
Associated Data
This section collects any data citations, data availability statements, or supplementary materials included in this article.


