Abstract
The individual sample heterogeneity is one of the biggest obstacles in biomarker identification for complex diseases such as cancers. Current statistical models to identify differentially expressed genes between disease and control groups often overlook the substantial human sample heterogeneity. Meanwhile, traditional nonparametric tests lose detailed data information and sacrifice the analysis power, although they are distribution free and robust to heterogeneity. Here, we propose an empirical likelihood ratio test with a mean–variance relationship constraint (ELTSeq) for the differential expression analysis of RNA sequencing (RNA-seq). As a distribution-free nonparametric model, ELTSeq handles individual heterogeneity by estimating an empirical probability for each observation without making any assumption about read-count distribution. It also incorporates a constraint for the read-count overdispersion, which is widely observed in RNA-seq data. ELTSeq demonstrates a significant improvement over existing methods such as edgeR, DESeq, t-tests, Wilcoxon tests and the classic empirical likelihood-ratio test when handling heterogeneous groups. It will significantly advance the transcriptomics studies of cancers and other complex disease.
Keywords: cancer transcriptome, differential expression analysis, empirical likelihood ratio test, heterogeneity, RNA-seq
Introduction
The individual heterogeneity hurdles biomarker identification for complex diseases and complicates the study of cancer pathology. An enormous amount of individual heterogeneity has been observed across multiple cancer types, such as breast cancer, renal cell carcinoma and prostate cancer [1–3]. In our own analysis of RNA sequencing (RNA-seq) data, we also observed that tumor samples are more heterogeneous compared with normal tissue samples (Supplementary Figure S1). Additionally, different cancer types exhibit different degree of heterogeneity (Supplementary Figure S2). The heterogeneity may result from the disease etiological heterogeneity, sample preparation contamination or simply from individual-level variability. It is crucial to take such heterogeneity into account when aiming to identify biomarkers accurately and reproducibly.
High-throughput RNA-seq has been widely used to quantify transcriptomes. However, differential expression analysis of genes based on read counts remains statistically complicated and challenging. Most of the current statistical models such as edgeR and DESeq [4, 5] use negative binomial (NB) distributions to identify differentially expressed (DE) genes. These parametric models aim to handle the overdispersion problem in RNA-seq data (i.e. a larger variation across samples is observed than that expected from Poisson variables). However, the substantial human sample heterogeneity complicates the situation and makes the distribution fitting difficult. Meanwhile, traditional nonparametric tests, such as rank-based Wilcoxon tests, lose detailed data information and sacrifice the analysis power, although they are distribution free and robust to heterogeneity.
Here, we propose a novel nonparametric test, which preserves much information from original data and is specifically designed to the characteristics of RNA-seq data. More importantly, it can deal with the different degree of heterogeneity for each group. Specifically, we propose an empirical likelihood ratio test with a mean–variance relationship constraint (named as ‘ELTSeq’) for the identification of DE genes through RNA-seq read counts. We tested our method through simulations and publicly available cancer RNA-seq data sets. ELTSeq demonstrates a significant improvement over existing methods such as edgeR and DESeq.
Materials and methods
Empiricallikelihood ratiotest
The empirical likelihood ratio test (ELT) is a nonparametric method first proposed by Owen [6], and the two-sample ELT was later developed [7]. Here, we further modify the model by introducing additional constraints on the mean–variance relationship for the overdispersion characteristics of RNA-seq data (named as ‘ELTSeq’).
In the classic ELT, supposing that is a random sample from a distribution F, we define the empirical cumulative distribution of the sample as . If there are no ties in the observations (i.e. all values are distinct), is the probability that the distribution F places on the distinct value . The empirical likelihood function is , and the unconstrained maximum empirical likelihood is So the empirical likelihood ratio is as follows:
| (1) |
If there are ties [8], supposing that the distinct values appear times in the sample, and has probability under F, the likelihood function can be expressed as , where k is the number of distinct values in the data. The unconstrained maximum empirical likelihood is . So the empirical likelihood ratio is as follows:
| (2) |
where the weight is acquired by splitting equally on observation with value . As Equations (1) and (2) are equivalent, we proceed with Equation (1) as if there were no ties in the calculation.
Supposing that an RNA-seq experiment has been conducted to generate a data set of two groups, the sample size is and , respectively. For a gene g, let represent the mapped read count in sample i of Group 1, and be the mapped read count in sample j of Group 2. The read counts are prenormalized so that the sequence depth of two groups is the same (more details in ‘Normalization’). Here, and are used to denote the true expression level of the gene g in Groups 1 and 2, respectively. The hypotheses to test are as follows:
Denote as the empirical probability for the observed read counts in Group 1, and for Group 2. The constraints for empirical probabilities can be written as follows:
| (c1) |
Other constraints include the following:
| (c2) |
| (c3) |
| (c4) |
where stands for the null hypothesis; and are our proposed overdispersion constraints. The classic ELT only has and constraints without the overdispersion constraints. As the unconstrained maximum empirical likelihood is , let R be the maximum empirical likelihood ratio:
Under the null hypothesis, −2log(R) approximates distribution based on [6]. Then, we can obtain P-values for ELTSeq.
Simulationstudies
As we know, if
Then,
As r is the shape parameter and is the scale parameter of gamma distribution, we define the scale ratio between two NB distributions as follows:
Ten samples of transcriptomes with 1000 genes as Group 1 were simulated in which 100 of those genes were DE genes compared with the other 10 simulated samples of Group 2. The expression ratio (i.e. the ratio of the two means of the two NB distributions) was fixed for DE genes and was 1 for non-DE genes. Thus, the means were the same for non-DE genes. For Group 1, was sampled from estimates from real ata, and was chosen from 1, 2, 3,…, 15. The scale ratio was chosen from 0.1, 0.2, …, 0.9, 1, 2, …, 16. These values were determined based on the estimated parameters of real data. Specifically, two of eight cancer types from The Cancer Genome Atlas (TCGA) data were randomly selected and fitted into NB models. By repeating this procedure 10 times, we observed that r was <15, and s was <16 for a large majority of genes (∼94.3%). After of Group 1 and scale ratio were chosen, the corresponding and of Group 2 can be calculated as follows:
For each pair of r and s, the simulation was run for 100 times to obtain the average power for different methods with the false discovery rate (FDR) [9] controlled at 0.05.
Real data studies
Three data sets were involved in the real data analysis. The prostate cancer data [10] were downloaded from the NCBI GEO data base (GSE22260), which was obtained by sequencing the transcriptome (polyA+) of 20 prostate cancer tumor samples and 10 matched normal tissues using the Illumina GAII platform. The lung cancer data [11] were also downloaded from the NCBI GEO database (GSE40419), which contains RNA-Seq data for 87 lung adenocarcinomas and 77 adjacent normal tissues with the Illumina HiSeq 2000 platform. Eight types of cancer data were downloaded from TCGA [12], and the details can be found in Supplementary Table S1.
In the analysis of the prostate cancer data, we started from raw sequence reads. We performed read mapping through Bowtie2 [13] and summarized the read counts. In the analysis of the lung cancer data, we downloaded the RPKM (Reads Per Kilobase of transcript per Million mapped reads) values and then converted them to read counts based on the sequence depth. For the TCGA data, eight cancer types including UCEC, LUAD, READ, LUSC, KIRC, HNSC, COAD and BLCA were selected, and gene-level read counts were directly downloaded from the TCGA Web site (https://tcga-data.nci.nih.gov/tcga/).
Normalization
RNA-seq read count data were normalized before applying ELTSeq. The normalizing factor for a given sample was calculated as the following. Let be the mean read count across all genes among all samples (including both populations). Let be the mean read count across all genes for sample i. Then, the normalization factor for sample i is :
Normalized read count for sample i was obtained by multiplying . In this way, the total number of read counts for each sample was normalized to the same value.
Software
The results presented in this article were obtained by using ELTSeq (programmed in MATLAB version R2013b with the Optimization Toolbox), as well as the R packages edgeR 3.2.4, DESeq 1.12.1. These R packages were used with the default differential expression pipelines as recommended in the software. ELTSeq needs to optimize a convex function in a nonconvex space, which is a nonconvex optimization problem. We apply the interior-point algorithm implemented in the Optimization Toolbox of MATLAB [14] to solve this problem. Similar to other rank-based nonparametric models, when the minimum read count of a group is even larger than the maximum read count of the other group, we lose the detailed difference information. No solution exists for our ELTSeq theoretically, and we rank these genes as the most significant DE genes. But this scenario was rare in real data analysis. In the analysis of the prostate cancer data, only 6 of 23 384 (0.0257%) genes were such extreme cases with no solutions. In the analysis of the TCGA tumor samples, we did 28 pairwise DE analyses. On average, only 0.0788% of 20 532 genes were such extreme cases. Our ELTSeq is available at http://www-rcf.usc.edu/~liangche/software.html.
Results
The classical ELT was first proposed by Owen [6, 15], which usually relies on the mean constraint. Our ELTSeq uses the fact that large majority of genes show overdispersion in expression levels quantified by RNA-seq and introduce another constraint on the mean–variance relationship.
Simulation studies
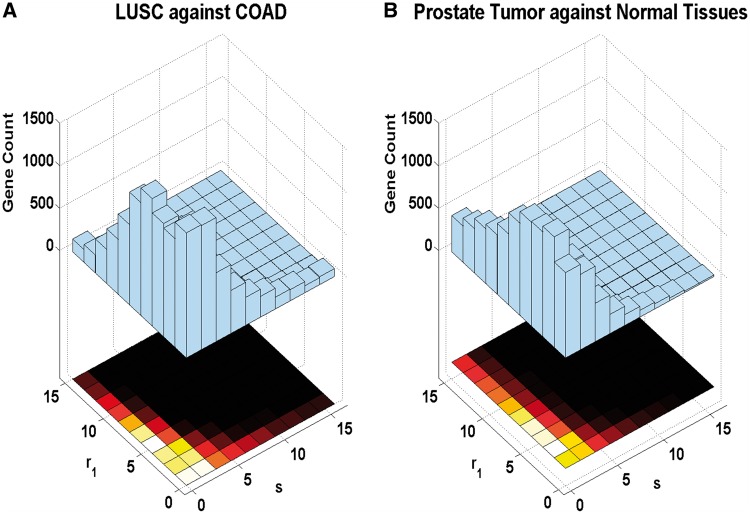
To investigate the power of our ELTSeq model, we simulated RNA-seq data according to NB distributions specified by the fitting of real data sets from TCGA [12, 16–20]. As expected, NB distributions only fit around 70% of expressed genes (excluding genes with a median of zero read count across samples) from these cancer RNA-seq data (Supplementary Table S2). A NB distribution can be formed as a mixture of Poisson and gamma distributions. The mean parameter of the Poisson distribution further follows a gamma distribution with the scale parameter p/(1 − p) and the shape parameter r [21]. In our simulations, p1 for Group 1 was randomly sampled from the estimates from the real data. The shape parameter r1 was chosen between 1 and 15, and the scale ratio s between the two samples was chosen from 0.1 to 16. The ranges of r1 and s were again determined by the fitting of the TCGA data to NB distributions. The expression ratio for non-DE genes was 1, and different values were tested for DE genes. Once p1, r1, s and the expression ratio are set, the p2 and r2 values can be set correspondingly. The detailed distribution of the r1 and s estimates for the TCGA data can be found in Figure 1A. The majority of genes exhibit an r1 value between 0 and 5, or an s value between 0.1 and 1. A similar distribution of the r1 and s estimates was observed when we conducted the same procedure to a prostate RNA-seq data set [10] (Figure 1B).
Figure 1.
Distribution of parameters r and s estimates from real data. (A) Comparison between two cancer types from the TCGA data. (B) Comparison between the prostate tumor and normal tissues.
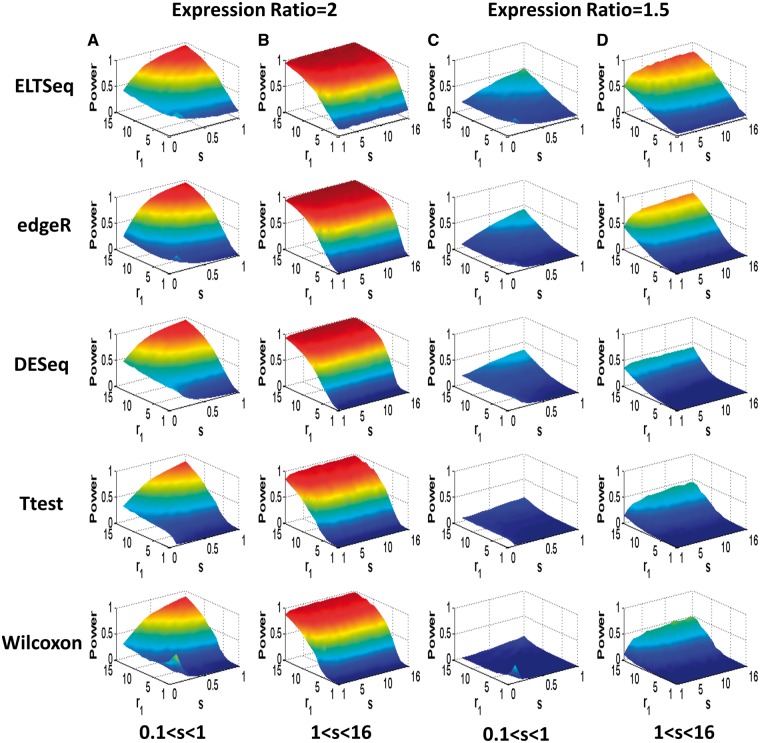
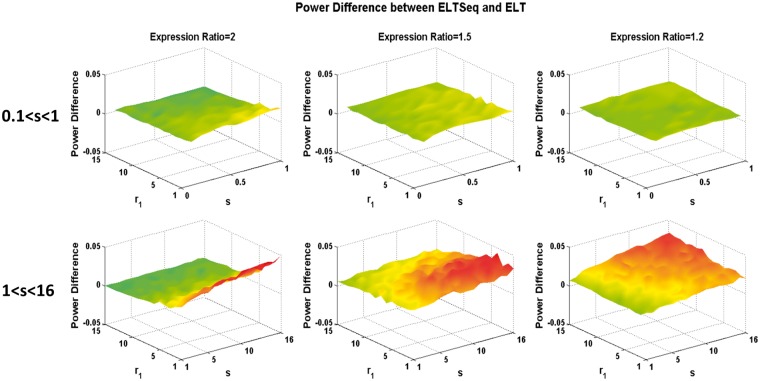
We simulated NB distributions with different shape and scale ratio parameters chosen from the above ranges. For each pair of parameters chosen, 10 samples of transcriptomes with 1000 genes as Group 1 were simulated in which 100 of those genes were DE when compared with the other 10 simulated samples of Group 2. The expression ratio of the DE genes was fixed as 2 or 1.5. Average power of DE gene identification with the FDR [9] of 0.05 was then obtained after 100 runs of simulation. As shown in Figure 2A and C, ELTSeq shows a significantly improved statistical power compared with other methods when s was between 0.1 and 1. When s is >1, ELTSeq still performs much better than others, especially where the majority genes are distributed, i.e. r1 value between 0 and 5 (Figure 2B and D). We should emphasize that the simulations were designed based on NB distributions, which favors edgeR and DESeq, as they were built on the NB assumption. Our ELTSeq, however, still performs better than them. More simulations with different expression ratios (Supplementary Figures S3 and S4) or with larger sample sizes (Supplementary Figures S5–S6) still show that ELTSeq is better than or comparable with other NB-based methods even when the data were simulated according to their NB distribution assumptions. Similar conclusions can be drawn when the false discovery proportion (FDP) or the type I error rate is controlled (Supplementary Figure S7). As we mentioned, NB distributions only fit around 70% of expressed genes. However, the rest of genes are still overdispersed (Supplementary Table S3). We further found that >90% of those unfitted genes are with extreme outliers >3×inter-quartile range. To investigate the performance of the different methods when read counts are not NB distributed, we further simulated transcriptomes from NB distributions with manually added extreme outliers. As we expect, when the NB assumption is violated and outliers are present, ELTSeq establishes even larger advantages compared with other methods (Supplementary Figure S8). The poor performance of edgeR and DESeq indicates that these parametric models are not reliable when outliers are present and the NB assumption does not hold. The benefits from the constraint on the mean–variance relationship can be observed by the comparison between our ELTSeq and the classic ELT (Figure 3). ELTSeq shows a larger analysis power than ELT especially when the between-group difference is subtle with small expression ratios. One-sided Wilcoxon signed-rank tests were conducted to statistically compare the power of ELTSeq with that of ELT, and the advantage of ELTSeq is statistically significant especially for subtle between-group differences (Supplementary Figure S9). The above simulations were for the sample size of 10. We further compared the power of ELTSeq and ELT for different sample sizes when the differential signal is strong (i.e. expression ratio = 2) and the FDP or the type I error rate was controlled. Again, the advantage of ELTSeq is statistically significant when the sample size is small (i.e. 10) with a P-value of 3.63 × 10⁻¹⁸ (one-sided Wilcoxon signed-rank test, Supplementary Figure S10). However, when the sample size is large (i.e. 50 or 100) and the differential signal is strong (i.e. expression ratio = 2), ELTSeq performs similarly to ELT.
Figure 2.
Average power for different methods in simulations. (A) The expression ratio is 2 and the scale ratio s is between 0.1 and 1. (B) The expression ratio is 2 and s is between 1 and 16. (C) The expression ratio is 1.5 and s is between 0.1 and 1. (D) The expression ratio is 1.5 and s is between 1 and 16. For each pair of chosen parameters, simulation was run for 100 times to obtain the average power of true DE gene identification with a FDR of 0.05. The parameter p1 for Group 1 was randomly sampled from real data estimates.
Figure 3.
Power differences between ELTSeq and ELT. Z axis plots the power difference with a FDR of 0.05. It is always nonnegative, suggesting that ELTSeq is better than the classic ELT under all circumstances when the sample size is 10.
Real data analysis
Biomarker identification
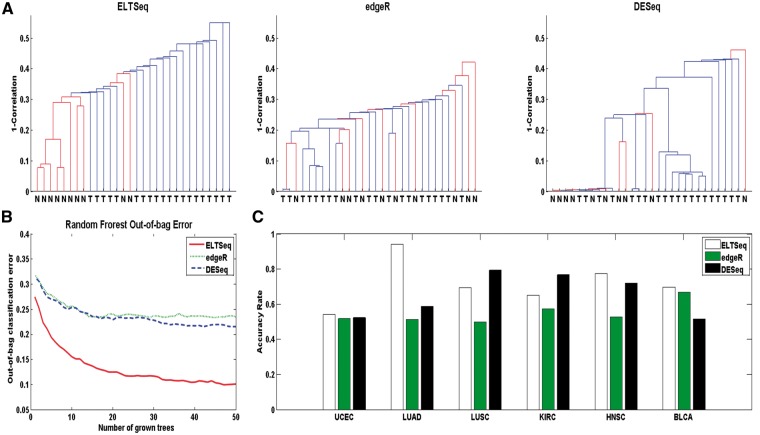
Biomarkers’ identification is of great importance in cancer studies. Robust DE genes between patients and healthy controls can serve as biomarkers for disease. The DE analysis of the prostate cancer RNA-seq data [10] was conducted with ELTSeq, edgeR and DESeq. Top 50 DE genes identified from each of the three methods were used as biomarkers to perform the sample clustering, respectively. The clustering accuracy rate calculated from the K-means (K = 2) clustering was 0.83 for ELTSeq, 0.53 for edgeR and 0.63 for DESeq. By using top 50 DE genes identified by ELTSeq, all normal samples except two are clustered together, and the two groups can be almost perfectly classified through the hierarchical clustering (Figure 4A), while the performance of edgeR and DESeq is much worse. Besides the hierarchical clustering, the random forest algorithm [22] was also carried out to perform the classification. The top 50 DE genes identified by ELTSeq establishes the smallest out-of-bag errors compared with those from edgeR and DESeq (Figure 4B), which again suggests that the DE genes identified by our ELTSeq can be efficient biomarkers of cancers. Similar conclusions were achieved when analyses were carried out with top 100 DE genes (Supplementary Figure S11) or with DE genes under the FDR control of 0.01 (Supplementary Figure S12). Comparison between ELTSeq and ELT also shows the advantages of ELTSeq in real data analysis (Supplementary Figure S13). Similarly, we performed the DE analysis to identify biomarkers of cancers in TCGA [12]. We used 50% of normal and tumor samples as the training set to identify DE genes. The remaining 50% of both groups of samples were used as the testing set to investigate how well these DE genes can serve as biomarkers for the cancers. A total of six different cancers with both tumor and normal RNA-seq data were analyzed. For each comparison, top 100 DE genes were obtained. They were used as features to perform the K-means (K = 2) clustering in the testing set to distinguish tumor and normal samples. The classification accuracy was acquired for different methods, and ELTSeq shows the highest accuracy in four of six clustering results (Figure 4C).
Figure 4.
Performance of different methods for biomarker identification. (A) Dendrogram of the prostate tumor and normal tissue samples clustered by top 50 DE genes identified by ELTSeq, edgeR and DEseq, respectively. (B) Out-of-bag classification errors when running the random forest algorithm by growing 50 trees using top 50 DE genes of the prostate cancer data as features. (C) Clustering accuracy rate of the K-means (K=2) clustering for tumor and normal tissue samples in the testing set. Top 100 DE genes identified by each method were used as features, respectively. The classification accuracy rate is defined as the number of correctly classified samples divided by the total number of samples.
Disease classification
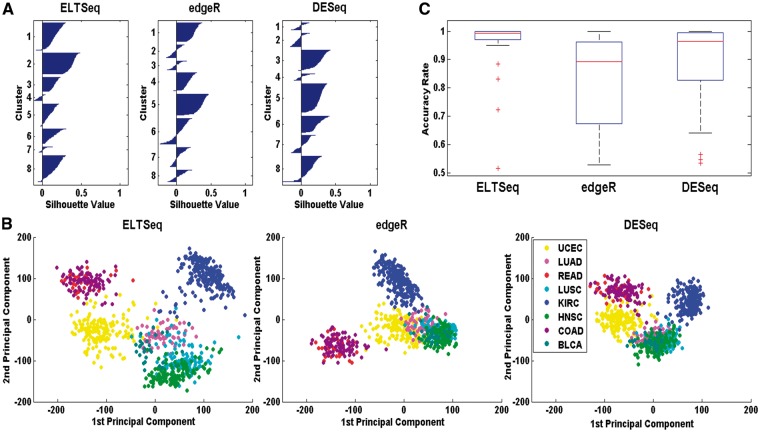
Similarly, we performed the DE analysis to distinguish different cancer types. Eight different types of tumor RNA-seq data from TCGA were analyzed, which resulted in 28 pairwise comparisons among these different tumors (only tumor samples were used). For each pairwise comparison, top 20 DE genes were obtained. The union of all these top genes was used as features to cluster the samples of the eight tumor types in the testing set. Silhouette plots (Figure 5A) were generated based on the results of the K-means clustering (K=8). The silhouette value is a measure of how similar a point is to points in its own cluster, when compared with points in other clusters. Negative silhouette values mean this point may not be correctly clustered. The cluster results of ELTSeq show less number of negative silhouette values compared with edgeR and DESeq, which suggests that these different cancer types can be well classified by the top DE genes identified by ELTSeq. Additionally, we calculated the average silhouette values for the three methods. The average silhouette value for ELTSeq is 0.1639, while 0.1223 for edgeR and 0.1432 for DESeq. All these prove that the cluster strength of ELTSeq is the highest of the three methods studied. We further calculated the principal components of samples in the testing set only using the union of top 20 DE genes. The tumor samples in the testing set can be better separated using the first two principal components generated by DE genes identified from ELTSeq, compared with edgeR and DESeq (Figure 5B). Even more, the results of ELTSeq are more consistent with a previous study, which classifies different cancer types in TCGA through integrative analysis of multiple types of genomics and proteomics data [23]. For example, UCEC samples formed their own cluster and were distinct from other cancer types. LUSC and HNSC samples were clustered together but were in a different cluster from most LUAD samples. Our ELTSeq obtained similar results, although only RNA-seq data were analyzed here. We also used top 20 DE genes identified in each pairwise comparison as features to cluster the corresponding two cancer samples in the testing set with the K-means (K =2) clustering. The overall classification accuracy rate was obtained for each DE analysis (Figure 5C). ELTSeq achieved the highest accuracy rates in 21 of 28 pairwise comparisons. Similar results were obtained when we used top 50 DE genes (Supplementary Figure S14). We therefore concluded that ELTSeq can greatly facilitate the disease classification through the accurate DE gene identification.
Figure 5.
Performance of different methods for tumor classification. (A) Silhouette plots based on the results of the K-means clustering (K = 8 for eight tumor types). The union of top 20 DE genes across all 28 pairwise comparisons was used as features to cluster the samples in the testing set. (B) Scatter plots of eight different types of tumor samples in the testing set using the first two principal components calculated with the union of top 20 DE genes. (C) Boxplot of pairwise classification accuracy rate of the K-means (K=2) clustering using top 20 DE genes identified by each method.
Reproducibility of DE gene identification
To show that ELTSeq can provide robust DE gene identification by taking individual heterogeneity into account, we designed a resampling analysis. The DE analysis of a lung cancer data set [11] was performed with ELTSeq, edgeR and DESeq. We applied a P-value threshold of 0.05 to declare significant DE genes. Then, we took bootstrap samples from the 87 tumor and 77 normal samples, respectively, by sampling with replacement, and the sample sizes for both groups were kept the same. The same DE analysis was performed for the bootstrap samples. We investigated the percentage of overlapping significant DE genes with the original result. This resampling process was conducted for 50 times, and overlapping percentages were obtained for every run. Boxplots of the overlapping percentages (i.e. reproducibility) were plotted for each method (Figure 6). ELTSeq clearly shows higher overlapping percentages compared with edgeR and DESeq. Similar results were obtained with the P-value cutoff equal to 0.005 or the FDR cutoff equal to 0.05 (Supplementary Figures S15 and S16). Thus, the reproducibility of DE gene identification is much improved because of the fact that ELTSeq can handle sample heterogeneity well.
Figure 6.
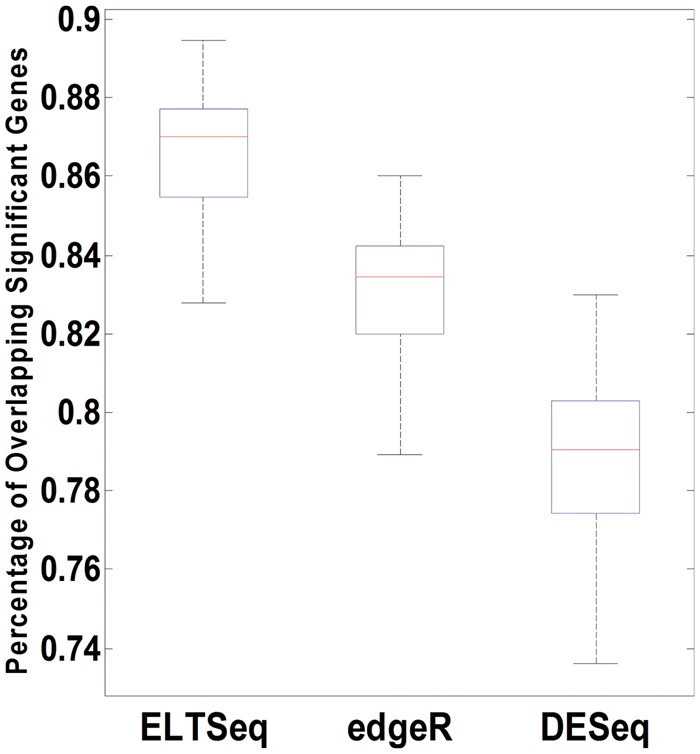
Robustness of biomarker identification. For the analysis of the lung cancer data set, DE gene overlapping percentages between 50 runs of bootstrap sampling and the original data were calculated and plotted as boxplots for each method. The overlapping percentage was calculated as the ratio between the sizes of intersection and union sets of DE genes identified from the original data and the bootstrap data.
Discussion
Here, we proposed an ELT, which is robust to individual heterogeneity for DE analysis of RNA-seq. Heterogeneity (because of sample contamination, individual variation and so on) has been observed in various cancer types, and the widespread existence of outliers in gene expression further confirms the severity of this issue (Supplementary Figures S1 and S2). For DE analysis of RNA-seq, most analysis tools focus on the overdispersion across samples, while the presence of individual heterogeneity is more difficult to handle. Our ELTSeq takes both problems into account and demonstrates its advantage in simulations and real data analysis.
The ELT method combines the reliability of nonparametric methods and the effectiveness of the likelihood approach [24]. Confidence regions generated by ELT models are usually better than confidence regions based on the asymptotic normality when the sample size is small [24]. Our consideration of the ‘variance larger than mean’ constraint was specifically designed to the characteristics of RNA-seq data and benefits the DE analysis of RNA-seq. By taking both individual heterogeneity and overdispersion into account, ELTSeq further improves the DE analysis of RNA-seq data by providing more robust statistics. Our simulation results show the advantages of ELTSeq over ELT when the differential signal is weak or the sample size is small (Figure 3, Supplementary Figures S9 and S10). We observed that sometimes the variance constraint is satisfied automatically during the numerical calculation without additional procedures, which may explain the similar performance between ELTSeq and ELT when the differential signal is strong or the sample size is large.
Besides the overdispersion of read counts across different regions of the same gene [25], the overdispersion of gene-level read counts is also observed across samples. The NB model has been widely used in RNA-seq data analysis to handle the overdispersion [26]. Although for many genes, the read count can be fitted into NB models, tests built on NB models are still imprecise because the parameter estimators are not accurate enough especially when the sample size is small [27, 28]. Both edgeR and DESeq used special techniques to improve the parameter estimation by pooling genes. Specifically, in edgeR, an empirical Bayes procedure was used to shrink the dispersions toward a consensus value [5]. In DESeq, the variance was assumed to be a smooth function of the mean and it allows the pooling of genes with similar expression for parameter estimation [4]. However, the improvement of parameter estimation is still limited, and the overall performance of edgeR and DEseq is generally worse than our ELTSeq, even though our simulation based on NB models benefits edgeR and DEseq.
The real RNA-seq data analysis further demonstrates that our ELTSeq can provide robust and reliable biomarkers for cancers. In our real data analysis, we ignored the pairing information for some of the individuals with matched tumor and normal samples to fully use all available samples. The pairing violates the independence assumption. However, its effect on the P-values for these two specific data sets is negligible (Supplementary Figures S17 and S18). On the other hand, we must admit that the negligible effect could be case specific, and the violation may cause biased results for other data sets. More advanced methods are expected in the future to consider the partially paired data design. The identified disease genes provide starting points for developing risk-modifying or disease-modifying therapeutic interventions for cancers or other complex disease.
Key Points
Heterogeneity (because of sample contamination, individual variation and so on) has been observed in various cancer types, and the widespread existence of outliers in gene expression further confirms the severity of this issue.
For the DE analysis of RNA-seq, most analysis tools model the overdispersion across samples based on NB distributions. However, the NB distributions cannot well capture the individual heterogeneity in cancers.
We propose ELTSeq which can take both overdispersion and heterogeneity into account. It is distribution free and enjoys the analysis convenience of likelihood ratio tests. Simulations show that ELTSeq is even better than NB-based methods when the reads were simulated from NB distributions.
The real RNA-seq data analysis further demonstrates that ELTSeq can provide robust and reliable biomarkers for cancers. The identified disease genes provide starting points for developing risk-modifying or disease-modifying therapeutic interventions for cancers or other complex disease.
Supplementary data
Supplementary data are available online at http://bib.oxfordjournals.org/.
Funding
This work has been supported by the National Institutes of Health (grant number R01GM097230).
Supplementary Material
Maoqi Xu is a PhD student at the University of Southern California, USA. He is interested in RNA-seq data analysis and cancer transcriptomics under the supervision of an associate professor Liang Chen.
Liang Chen is an associate professor at the University of Southern California, USA. Her research group focuses on computational biology and statistical genomics and genetics.
References
- 1. Ricketts CJ, Linehan WM.. Intratumoral heterogeneity in kidney cancer. Nat Genet 2014;46:214–5. [DOI] [PMC free article] [PubMed] [Google Scholar]
- 2. Nagai Y, Miyazawa H, Huqun, et al. Genetic heterogeneity of the epidermal growth factor receptor in non-small cell lung cancer cell lines revealed by a rapid and sensitive detection system, the peptide nucleic acid-locked nucleic acid PCR clamp. Cancer Res 2005;65:7276–82. [DOI] [PubMed] [Google Scholar]
- 3. Ford D, Easton DF, Stratton M, et al. Genetic heterogeneity and penetrance analysis of the BRCA1 and BRCA2 genes in breast cancer families. The Breast Cancer Linkage Consortium. Am J Hum Genet 1998;62:676–89. [DOI] [PMC free article] [PubMed] [Google Scholar]
- 4. Anders S, Huber W.. Differential expression analysis for sequence count data. Genome Biol 2010;11:R106.. [DOI] [PMC free article] [PubMed] [Google Scholar]
- 5. Robinson MD, McCarthy DJ, Smyth GK.. edgeR: a Bioconductor package for differential expression analysis of digital gene expression data. Bioinformatics 2010;26:139–40. [DOI] [PMC free article] [PubMed] [Google Scholar]
- 6. Owen AB. Empirical likelihood ratio confidence intervals for a single functional. Biometrika 1988;75:237–49. [Google Scholar]
- 7. Jing B-Y. Two-sample empirical likelihood method. Stat Prob Lett 1995;24:315–9. [Google Scholar]
- 8. Owen AB. Empirical Likelihood. Boca Raton, FL: Chapman & Hall/CRC, 2001. [Google Scholar]
- 9. Benjamini Y, Hochberg Y.. Controlling the false discovery rate - a practical and powerful approach to multiple testing. J R Stat Soc Ser B Methodol 1995;57:289–300. [Google Scholar]
- 10. Kannan K, Wang J, Wang L, et al. Recurrent chimeric RNAs enriched in human prostate cancer identified by deep sequencing. Proc Natl Acad Sci USA 2011;108:9172–7. [DOI] [PMC free article] [PubMed] [Google Scholar]
- 11. Seo J-S, Ju YS, Lee W-C, et al. The transcriptional landscape and mutational profile of lung adenocarcinoma. Genome Res 2012;22:2109.. [DOI] [PMC free article] [PubMed] [Google Scholar]
- 12. Cancer Genome Atlas Research N. Comprehensive genomic characterization of squamous cell lung cancers. Nature 2012;489:519–25. [DOI] [PMC free article] [PubMed] [Google Scholar]
- 13. Langmead B, Salzberg SL.. Fast gapped-read alignment with Bowtie 2. Nat Methods 2012;9:357–U354. [DOI] [PMC free article] [PubMed] [Google Scholar]
- 14. Byrd RH, Gilbert JC, Nocedal J.. A trust region method based on interior point techniques for nonlinear programming. Math Program 2000;89:149–85. [Google Scholar]
- 15. Qin J, Lawless J.. Empirical likelihood and general estimating equations. Ann Stat 1994;22:300–25. [Google Scholar]
- 16. Cancer Genome Atlas Research N. Comprehensive molecular characterization of clear cell renal cell carcinoma. Nature 2013;499:43–9. [DOI] [PMC free article] [PubMed] [Google Scholar]
- 17. Cancer Genome Atlas Research N. Genomic and epigenomic landscapes of adult de novo acute myeloid leukemia. N Engl J Med 2013;368:2059–74. [DOI] [PMC free article] [PubMed] [Google Scholar]
- 18. Cancer Genome Atlas Research N. Integrated genomic characterization of endometrial carcinoma. Nature 2013;497:67–73. [DOI] [PMC free article] [PubMed] [Google Scholar]
- 19. Cancer Genome Atlas Research N. Comprehensive molecular characterization of urothelial bladder carcinoma. Nature 2014;507:315–22. [DOI] [PMC free article] [PubMed] [Google Scholar]
- 20. Cancer Genome Atlas N. Comprehensive molecular characterization of human colon and rectal cancer. Nature 2012;487:330–7. [DOI] [PMC free article] [PubMed] [Google Scholar]
- 21. Wu H, Wang C, Wu Z.. A new shrinkage estimator for dispersion improves differential expression detection in RNA-seq data. Biostatistics 2013;14:232–43. [DOI] [PMC free article] [PubMed] [Google Scholar]
- 22. Breiman L. Random forests, Mach Learn 2001;45:5–32. [Google Scholar]
- 23. Hoadley KA, Yau C, Wolf DM, et al. Multiplatform analysis of 12 cancer types reveals molecular classification within and across tissues of origin. Cell 2014;158:929–44. [DOI] [PMC free article] [PubMed] [Google Scholar]
- 24. Chen SX, van Keilegom I.. A review on empirical likelihood methods for regression. Test 2009;18:415–47. [DOI] [PMC free article] [PubMed] [Google Scholar]
- 25. Srivastava S, Chen LA.. A two-parameter generalized Poisson model to improve the analysis of RNA-seq data. Nucleic Acids Res 2010;38: [DOI] [PMC free article] [PubMed] [Google Scholar]
- 26. Oshlack A, Robinson MD, Young MD.. From RNA-seq reads to differential expression results. Genome Biol 2010;11:220-220.. [DOI] [PMC free article] [PubMed] [Google Scholar]
- 27. Robles JA, Qureshi SE, Stephen SJ, et al. Efficient experimental design and analysis strategies for the detection of differential expression using RNA-Sequencing. BMC Genomics 2012;13:484-484.. [DOI] [PMC free article] [PubMed] [Google Scholar]
- 28. Soneson C, Delorenzi M.. A comparison of methods for differential expression analysis of RNA-seq data. BMC Bioinform 2013;14:91.. [DOI] [PMC free article] [PubMed] [Google Scholar]
Associated Data
This section collects any data citations, data availability statements, or supplementary materials included in this article.


