

Summary
Identifying reliable drug response biomarkers is a significant challenge in cancer research. We present CARE, a computational method focused on targeted therapies, to infer genome-wide transcriptomic signatures of drug efficacy from cell line compound screens. CARE outputs genome-scale scores to measure how the drug target gene interacts with other genes to affect the inhibitor efficacy in the compound screens. Such statistical interactions between drug targets and other genes were not considered in previous studies but are critical in identifying predictive biomarkers. When evaluated using transcriptome data from clinical studies, CARE can predict the therapy outcome better than signatures from other computational methods and genomics experiments. Moreover, the CARE signatures for the PLX4720 BRAF inhibitor are associated with an anti-PD1 clinical response, suggesting a common efficacy signature between a targeted therapy and immunotherapy. When searching for genes related to lapatinib resistance, CARE identified PRKD3 as the top candidate. PRKD3 inhibition, by both siRNA and compounds, significantly sensitized breast cancer cells to lapatinib. Thus, CARE should enable large-scale inference of response biomarkers and drug combinations for targeted therapies using compound screen data.
Keywords: Gene interaction, Drug resistance, Targeted therapy, Immunotherapy
eTOC blurb
Data from cell line compound screens could derive clinically predictive biomarkers for targeted cancer therapies by testing how drug target genes interact with other genes to affect drug efficacy.
Introduction
Despite the rapid development of cancer treatment methods, many issues such as drug resistance and severe side effects are still limiting the effectiveness of most anticancer drugs (Holohan et al., 2013; Widakowich et al., 2007). Predictive biomarkers of clinical benefits are valuable components to assist personalized treatment decisions (Issaq et al., 2011). In an ideal scenario, a genomics biomarker could analyze the DNA sequences or gene expression profiles of a patient’s tumor and make a reliable prediction regarding therapy response to an anticancer drug. However, despite a few successful biomarkers from clinical genomics studies (Trifiletti et al., 2017), finding reliable prognostic biomarkers is still an open research area for most anticancer drugs in most cancer types (Mabert et al., 2014).
Many approaches have been adopted to identify gene biomarkers and regulators of response and resistance to anticancer therapies from clinical genomics data. For example, post-treatment tumors that are resistant to drugs could be profiled for recurrent genomic and transcriptomic alterations, with pre-treatment sensitive tumors as the reference (Hugo et al., 2015). When associated with patient therapy and clinical outcome, the gene expression or mutation profiles of pre-treatment tumors could also provide insight on prognostic biomarkers (Filipits et al., 2011; Guarneri et al., 2015; van ‘t Veer et al., 2002). The ideal dataset from which to build predictive biomarkers would be systematic drug sensitivities and tumor molecular profiles (e.g., mutation, expression) across a large cohort of patients with clinical information. However, these data incur significant efforts and expenses and have limitations on the number of drugs tested.
A faster and cheaper alternative to profile clinical samples is to use cell lines as experimental systems. Genomic profiling and screening technologies, together with immortalized cell line models, are important experimental strategies to investigate the efficacy of therapeutic compounds. For example, molecular profiling of drug-resistant cell lines derived from chronic treatment of sensitive cell lines is widely used to identify cell-intrinsic gene signatures of drug resistance (McDermott et al., 2014; Nazarian et al., 2010). Genome-wide screens using clustered regularly interspaced short palindromic repeats (CRISPR) have been developed to investigate the impact of gene knockout on drug efficacy in cell line and mouse models (Manguso et al., 2017; Shalem et al., 2014). Additionally, CRISPR activation and open reading frame (ORF) screens can induce gene expression and reveal the associations between gene activation and drug resistance (Johannessen et al., 2013; Konermann et al., 2015).
With the rapid advance of automation technology, high-throughput compound screening is rapidly becoming a rich source of information about the mechanisms of drug response and resistance (Hu and Zhang, 2016). Early efforts in NCI60 cell lines correlated gene expression and drug activity patterns across a panel of 59 cancer cell lines to explore mechanisms of drug resistance (Scherf et al., 2000; Shoemaker, 2006). Several new consortiums have conducted both molecular profiling and drug efficacy measurements on hundreds of cancer cell lines. The Cancer Cell Line Encyclopedia (CCLE), Genomics of Drug Sensitivity in Cancer (GDSC), and Cancer Therapeutics Response Portal (CTRP) projects screened 24, 250, and 545 compounds, respectively, across almost 1000 cell lines (Barretina et al., 2012; Iorio et al., 2016; Seashore-Ludlow et al., 2015). These compound screen projects used statistical approaches such as Elastic Net and ANOVA to identify drug efficacy signatures by testing the associations between gene mutation or expression status and drug efficacy across cell lines. Several studies also explored machine-learning approaches that incorporate high-dimensional nonlinear relationships to analyze compound screens (Costello et al., 2014). A limitation of these previous studies is that they applied the same analysis procedures to all types of compounds without distinguishing between targeted therapies on specific oncogenes and chemotherapies with general cytotoxicity. Since different drug types may follow distinct mechanisms of action, it is likely that customized approaches may achieve better predictive performance depending on the specific drug categories. Additionally, the clinical relevance of cell line models has been continuously questioned (Gillet et al., 2011; Gillet et al., 2013). It remains to be systematically tested whether the biomarkers identified from cell line data have sufficient relevance to the patient clinical response.
In this study, we use large-scale compound screening data to identify biomarkers that predict the clinical response to targeted therapies. We focused on targeted therapies and built a framework, Computational Analysis of REsistance (CARE). Different from previous methods analyzing compound screens, CARE evaluates how drug targets interact with other genes to affect drug efficacy by testing the interaction effects in multivariate models. Such interaction effects between drug targets and other genes were not considered in previous studies but are critical in identifying predictive biomarkers for targeted therapies. Additionally, CARE scores each gene in the genome and uses the correlation between the CARE scores and tumor expression to predict drug response and is therefore robust against noise on individual genes. In the following sections, we will introduce the algorithmic design of CARE and demonstrate its performance in predicting clinical outcomes of targeted cancer therapies. We will also show the better performance of our approach by systematic method comparisons and experimentally validate new synergistic drug combinations predicted by CARE. The source code and results of our study are available at http://care.dfci.harvard.edu.
Results
CARE identifies robust genome-wide signatures of targeted therapy efficacy
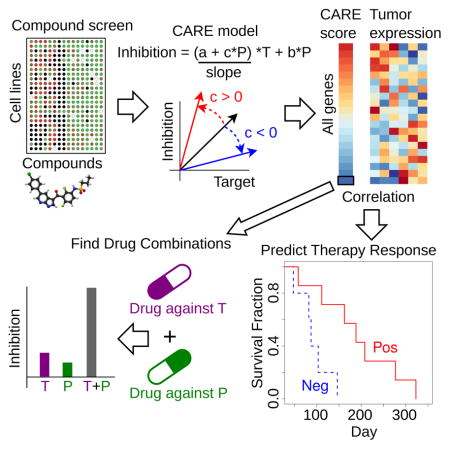
Compound screens on cancer cell lines, which measure the growth inhibition of drugs across many cell lines with diverse molecular characteristics, contain abundant information about factors determining drug efficacy (Hu and Zhang, 2016). We observed that many known biomarkers of targeted therapy efficacy had significant interaction associations with the drug target genes in the compound screening data. For example, CCLE screens show that the BRAF V600E mutation correlates with increased cell line sensitivity to the BRAF inhibitor PLX4720 (Barretina et al., 2012). However, this association between drug target and drug efficacy (gaps between the BRAF V600E mutant and other cell lines in Figure 1A) decreases with increased EGFR expression. This observation is consistent with the knowledge that EGFR activation promotes resistance to BRAF inhibitors (Sun et al., 2014). In contrast, the increased expression of LEF1, a gene known to sensitize tumor cells to BRAF inhibitors (Hugo et al., 2015), is associated with increased PLX4720 inhibition of BRAF mutant cells in CCLE screens (Figure 1A). In statistics, an interaction between two variables happens if the effect of one variable (e.g., BRAF mutation’s effect on PLX4720 efficacy) depends on the other variable (e.g., EGFR or LEF1 expression). These observations on known targeted therapy biomarkers motivated us to develop a statistical method, Computational Analysis of REsistance (CARE), to systematically identify genes with similar behaviors.
Figure 1. Inference of genome-scale gene signatures for targeted therapy efficacy.

(A) Association between BRAF mutation and inhibitor efficacy conditioned on other gene variables. All CCLE cell lines were divided into three categories ranked by EGFR or LEF1 expression (Low: below 25%, Mid: between 25% and 75%, High: above 75%). In each category, the PLX4720 inhibition values are shown for cell lines with a BRAF V600E mutation and others without the mutation, with the median value as a thick bar in the box-plot. The bottom and top of the boxes are the 25th and 75th percentiles (interquartile range). Whiskers on the top and bottom represent the maximum and minimum data points within 1.5 times the inter-quartile range.
(B) Interaction test in multivariate regression. Variables T and P represent the statuses of drug target and candidate gene in the test, respectively. The coefficient of product covariate (T*P) in regression represents the interaction effect between T and P on drug inhibition outcome. The slopes between drug target status and drug inhibition efficacy are shown by arrows, with red and black colors indicating the direction of change when variable P increases.
(C) CARE score definition. The effect of variable P on drug inhibition efficacy is computed as a t-value conditioned on drug target status T as one. The standard error (s.e.) is estimated through the coefficient covariance.
(D) CARE framework of clinical response prediction. For each targeted therapy, CARE will first calculate a genome-wide vector of scores with one value per gene using compound screen data. To predict drug responses, CARE computes Pearson correlations between the tumor gene expression profiles and CARE scores on genome-scale, with positively correlated patients labeled as responders and negatively correlated ones labeled as non-responders.
Figure 360: Available as Movie S1. See also Figure S1 and Table S2.
To evaluate how genes impact targeted therapy efficacy, CARE examines how the expression or mutation state of a gene P interacts with the drug target gene status T to influence the drug inhibition efficacy in a multivariate linear model (Figure 1B). An interaction term is created as the product between the statuses of candidate gene P and drug target T and evaluated toward drug inhibition outcome through multivariate regression. A negative interaction coefficient “c” indicates activation of gene P to be associated with a decreased correlation between drug target and drug inhibition efficacy and thus with drug resistance (Figure 1B). In contrast, a positive coefficient “c” indicates activation of P to be associated with an increased correlation between drug target status and inhibition efficacy and thus with drug sensitivity.
The overall effect of gene P on drug efficacy is computed as a conditional effect when the drug target T is active, combining both interaction and base coefficients in a linear model (Figure 1C, STAR methods) (Brambor et al., 2006). To estimate the statistical significance of the conditional effect, CARE computes a t-value (coefficient/standard deviation) using the ordinary least square method (Figure 1C) (Freedman, 2009). For example, CARE correctly identified EGFR as a resistant gene for the BRAF inhibitor, as indicated by a negative CARE score (Table 1), and LEF1 as having a sensitizing role for the BRAF inhibitor, as shown by a positive CARE score (Table 2). CARE also identified AXL to be a resistant gene for lapatinib (a dual ERBB2 and EGFR inhibitor) through the negative CARE scores with ERBB2 as lapatinib target (Table S1), which is consistent with previous knowledge (Liu et al., 2009). Finally, instead of selecting specific genes, CARE outputs a vector with one score for every human gene (Figure 1C). This score vector allows us to identify potential biomarker genes, whose expression or mutation status has significant associations with drug efficacy. When predicting whether a tumor will respond to the drug, we calculate the genome-wide Pearson correlation between the tumor expression profile and CARE score (Figure 1D), which provides a robust estimation and avoids noise from individual genes.
Table 1. Negative interaction between BRAF mutation and EGFR.
The interaction between BRAF mutation and EGFR gene expression is evaluated by linear regression with PLX4720 efficacy as the outcome. The t-value is defined as regression coefficient divided by the standard error, and the p-value is calculated by the two-sided Student’s t-test.
See also Table S1.
| Coef | Stderr | t-value | p-value | |
|---|---|---|---|---|
|
| ||||
| BRAF.V600E | 0.16504 | 0.00972 | 16.984 | 5.03E-51 |
| EGFR | −0.00117 | 0.00248 | −0.473 | 6.37E-01 |
| EGFR*BRAF.V600E | −0.04905 | 0.01042 | −4.706 | 3.31E-06 |
| CARE score | −0.05023 | 0.01012 | −4.962 | 9.72E-07 |
Table 2. Positive interaction between BRAF mutation and LEF1.
The interaction between BRAF mutation and LEF1 gene expression is evaluated by linear regression with PLX4720 efficacy as the outcome. The t-value is defined as regression coefficient divided by the standard error, and the p-value is calculated by the two-sided Student’s t-test.
See also Table S1.
| Coef | Stderr | t-value | p-value | |
|---|---|---|---|---|
|
| ||||
| BRAF.V600E | 0.16107 | 0.0107 | 15.06 | 2.90E-42 |
| LEF1 | 0.00282 | 0.00264 | 1.07 | 2.86E-01 |
| LEF1*BRAF.V600E | 0.02849 | 0.00793 | 3.59 | 3.62E-04 |
| CARE score | 0.03131 | 0.00748 | 4.19 | 3.37E-05 |
To systematically identify gene signatures associated with response and resistance to different targeted therapies, we applied CARE to three large-scale compound screen datasets. The CCLE (Barretina et al., 2012), GDSC (Iorio et al., 2016) and CTRP (Seashore-Ludlow et al., 2015) projects screened numerous compounds across hundreds (approximately 500 to 1000) of cancer cell lines (Figure S1A and Table S2). For each compound with annotated target genes, we first used a forward selection algorithm to ensure that the status (e.g., expression, mutation) of the annotated drug target gene has sufficient correlation with drug efficacy (Jiang et al., 2015) (STAR methods). There are 17, 118 and 190 compounds passing the selection criteria in the CCLE, GDSC and CTRP cohorts, respectively. The response measurements of these targeted therapies are reasonably consistent across different datasets (Figure S1B, C).
We applied CARE to identify genes associated with drug efficacy for many compounds across the three cohorts and focused on druggable genes with significant negative CARE scores for visualization (Figure 2). For example, AXL, a druggable kinase implicated as a resistance driver for many targeted therapies (Liu et al., 2009; Zhang et al., 2012), has significant negative CARE scores for multiple compounds screened in three cohorts (Figure 2A, B). Another example is that SRC has negative CARE scores on most drugs (Figure 2A, C), which corroborates previous findings that SRC activation promotes resistance towards several targeted therapies (Wilson et al., 2014; Zhao et al., 2017). In contrast, CSK, a negative regulator of SRC (Okada et al., 1991), has significant positive CARE scores for many compounds (Figure 2C), suggesting that loss of CSK may promote drug resistance towards many targeted therapies. Notably, the interaction test in Figure 1B can evaluate both expression and mutation of gene P on drug efficacy. For example, the significant negative CARE scores of KRAS mutations in many compound screens (Figure S2) support the role of KRAS mutations in promoting drug resistance (Misale et al., 2012; Sameen et al., 2016).
Figure 2. CARE scores for genes associated with resistance to multiple drugs.

(A) CARE scores of druggable genes associated with resistance to more than one compound. To uniformly compare scores across different cohorts, we normalized all CARE scores within each cohort to zero mean and unit variation.
(B) Statistically significant CARE scores of AXL for compounds analyzed in each cohort. The median value in each group is shown as a thick bar in the box-plot. The bottom and top of the boxes are the 25th and 75th percentiles (interquartile range). Whiskers on the top and bottom represent the maximum and minimum data points within the range represented by 1.5 times the inter-quartile range.
(C) Statistically significant CARE scores for SRC and its inhibitor CSK for compounds analyzed in each cohort. All values are shown in the same way as panel B.
See also Figure S2.
CARE outperforms other genomic signatures in predicting the clinical outcome of targeted therapies
Encouraged by the consistent results of previous studies, we systematically tested the clinical utility of CARE by evaluating the accuracy of CARE scores in predicting the patient clinical outcome of targeted therapies. To this end, we used the expression profiles of pre-treatment tumors from 12 melanoma patients that had a BRAF V600E mutation and were treated with vemurafenib, each with progression-free survival (PFS) information (Hugo et al., 2015). Patients are predicted to be responders if their tumor expression profiles are positively correlated with CARE scores of PLX4720, a chemical analog of vemurafenib (Bollag et al., 2012), and non-responders if the profiles are negatively correlated (Figure 1D). The correlations between patient tumor expression profile and CARE scores were significantly associated with the PFS time, verifying CARE’s predictive power in clinical samples (Figure 3A).
Figure 3. CARE can reliably predict clinical outcome of targeted therapies.

(A) CARE prediction results on the anti-BRAF clinical outcome. For 12 patients treated with vemurafenib (Hugo et al., 2015), CARE computed the Pearson correlations between PLX4720 CARE scores and tumor gene expression profiles. The progression-free survival (PFS) was compared between positively and negatively correlated patients by the Kaplan-Meier curves, with p-values from the two-sided Wald test in Cox-PH regression.
(B) Performance comparison on predicting anti-BRAF vemurafenib response. For each gene signature (Table S3A), the response was predicted for patients by correlating between tumor expression profiles and signature gene scores. The prediction accuracy metrics were compared. AUC: area under ROC curve.
(C) CARE prediction results on the anti-HER2 clinical outcome. For 32 patients treated with lapatinib (Guarneri et al., 2015), the patient-wise correlations with CARE signature were shown according to the clinical response status, with the p-value computed by one-sided Wilcoxon rank-sum test.
(D) Performance comparison on predicting anti-HER2 lapatinib response among several signatures (Table S3B) as panel B.
(E) Prediction results on the anti-PD1 clinical outcome using the anti-BRAF CARE scores. For 25 patients treated with pembrolizumab (Hugo et al., 2016), the patient-wise correlations with PLX4720 CARE signature were shown according to the response status, with the p-value computed by one-sided Wilcoxon rank-sum test.
(F) Performance comparison on predicting anti-PD1 pembrolizumab response. PDL1: CD274 expression; CD8: expression sum of CD8A and CD8B; BRCA2: BRCA2 mutation status; Mutation: non-synonymous mutation load; CRISPR: anti-PD1 resistance signature determined by in-vivo CRISPR screen (Table S3C).
(G) Association between CARE signature and tumor immune evasion. CARE predicted all TCGA melanoma patients as either responders or non-responders using the PLX4720 signature computed from CCLE data. In each category, the overall survival (OS) was shown for patients with positive and negative values of immune cytolytic activity (CYT, computed as expression sum of GZMA, GZMB, and PRF1). The p-values were computed by two-sided Wald test in Cox-PH regression.
(H) Gene set enrichment analysis for the PLX4720 CARE signature. The epithelial-to-mesenchymal transition (EMT) was the highest enrichment term. All CARE gene scores are shown in ascending order in the bottom. The genes with EMT function are labeled with black bars in the middle. The enrichment score of EMT signature at each score rank is shown on the top. NES: normalized enrichment score. P-value: permutation test p-value with 1000 shuffles.
(I) CARE prediction results on the paclitaxel response. For paclitaxel, we identified three studies with both tumor gene expression data and pathologic complete response (pCR) status. There are 193, 115 and 92 patients in the studies of Pusztai, Noguchi, and Symmans, respectively. The correlation between patient expression profiles and CARE scores of paclitaxel was shown according to the response status. The two-sided rank-sum p-values, testing the correlation difference between responders and non-responders, are 7.25e-4, 4.95e-5, and 2.25e-2 for the Pusztai, Noguchi, and Symmans studies, respectively.
(J) Performance comparison on predicting paclitaxel response among signatures (Table S3D) as panel B, with accuracy metrics averaged among three cohorts in panel I.
To compare CARE with other experimental methods conducted on cell lines, we collected the gene scores associated with drug efficacy derived from CRISPR knockout, CRISPRa, shRNA, ORF screens, and expression profiles of drug-resistant cell lines (Table S3A). For each signature, we stratified the patients according to the correlation between tumor gene expression values and cell line gene scores (such as differential expression or screen selection level) published in these experiments. Then, we predicted positively correlated patients as the responders and negatively correlated patient as the nonresponders. As an evaluation standard to test prediction accuracy, we defined patients with the top and bottom 50% PFS as the responders and non-responders, respectively. The prediction accuracy metrics are highest for CARE, followed by CRISPRa/CRISPR knockout screens and other experimental methods (Figure 3B). When evaluated with an alternative association metric computed by the Cox-PH model, CARE also demonstrated the highest association with PFS outcome among all methods (Figure S3A).
To further investigate the clinical utility of CARE, we next tested another drug, lapatinib, on HER2+ breast cancer. The CHER-LOB clinical trial released complete pathological response statuses of patients together with their gene expression profiles (Guarneri et al., 2015). We computed the Pearson correlation between gene expression values and CARE scores for lapatinib from the CCLE cohort and found that responders have significantly higher correlations with the CARE scores than non-responders (Figure 3C, one-tailed rank-sum test p-value = 0.047). We also collected gene signatures profiled by many experimental methods (Table S3B) and used the other signatures to correlate with patient gene expression profiles to predict response. When evaluating the fraction of patients with correctly predicted response status, we found CARE prediction to give the highest accuracy over other signatures (Figure 3D).
The CARE signature for the PLX4720 BRAF inhibitor, computed from cell line screens, is also indicative of the clinical response to anti-PD1 immune therapy in melanoma (Figure 3E). The accuracy metric of CARE is even higher than several known biomarkers of anti-PD1 response (Figure 3F) (Hugo et al., 2016; Nishino et al., 2017), as well as a gene signature from an in vivo CRISPR screen (Table S3C) (Manguso et al., 2017). The clinical outcome of melanoma patients was known to be associated with the cytolytic activity (CYT), defined as the sum of GZMA, GZMB, and PRF1 expression in a bulk tumor as an infiltration estimation of cytolytic lymphocytes (Rooney et al., 2015). Among TCGA melanoma tumors, a higher CYT level predicts better patient overall survival but only in patients predicted to be responders by the CARE PLX4720 signature (Figure 3G). Thus, the cell-autonomous gene signature of CARE is associated with both immunotherapy response and tumor immune evasion. To explore the possible mechanisms, we applied gene set enrichment analysis on the PLX4720 CARE signature and found epithelial-to-mesenchymal transition (EMT) to be the most enriched category (Figure 3H). EMT was a known driver process in drug resistance and tumor immune evasion (Dongre et al., 2017; Shibue and Weinberg, 2017) and was implicated in resistance to anti-PD1 therapy (Hugo et al., 2016). We explored the prediction performance of other compound CARE signatures on the anti-PD1 response. In all screen cohorts, CARE signatures more correlated with the EMT signature show the better predictive power of anti-PD1 response (Figure S3B). Therefore, the CARE signature has predictive power on immune resistance through enrichment of EMT, a common resistance mechanism between targeted therapies and immunotherapies.
One limitation of our evaluation of clinical prediction accuracy on targeted therapies is that published studies only profiled a small number of patients. For example, there are only 12, 25, and 31 patients with complete clinical information and pre-treatment transcriptome for vemurafenib (Hugo et al., 2015), pembrolizumab (Hugo et al., 2016), and lapatinib (Guarneri et al., 2015), respectively. In contrast, there are published studies with data for hundreds of patients undergoing chemotherapy treatment. Even though the focus of our study is targeted therapy, we can also apply CARE to chemotherapies with known targets. For example, TUBB is the target gene of paclitaxel by the CCLE annotation (Barretina et al., 2012). There are three independent studies on paclitaxel treatment that include 193, 115 and 92 patients, respectively (Figure 3I) (Hatzis et al., 2011; Miyake et al., 2012; Popovici et al., 2010). We used the paclitaxel CARE scores, computed from CCLE data, to predict therapy response in the clinical cohorts and achieved approximately 70% accuracy (Figure S3C), a performance better than other genomics signatures (Figure 3J and Table S3D).
We also examined how well the paclitaxel response signatures derived from one clinical cohort predict responses in another cohort compared to the CARE signature derived from cell line compound screens. To this end, we computed associations between gene expression levels and therapy response using logistic regression in each clinical cohort. Then, we used the computed gene associations to predict responses in another clinical cohort and calculated the average accuracy among all six pairwise combinations across three paclitaxel studies. The CARE signature, although derived from cell line compound screens, achieved comparable performance with signatures derived from independent clinical cohorts (“Clinical” in Figure 3J).
CARE is more robust than other computational methods in finding biomarkers
Previously, several computational methods were utilized by different studies to analyze compound screen data. Therefore, we compared CARE with other computational methods in predicting gene signatures of drug efficacy using the evaluation standards from both cell models and clinical studies. These methods include Correlation, Elastic Net, support vector regression (SVR), and the GDSC tool that uses the ANOVA test to identify response biomarkers (Iorio et al., 2016). Correlation refers to the Pearson correlation between the gene expression or mutation status and drug inhibition outcome. ANOVA estimates the difference among group means and variations of drug response according to the gene status. Elastic Net, which applies penalties to constrain the regression coefficients, is a popular method used in previous compound screen projects to identify gene alterations associated with compound efficacy (Barretina et al., 2012; Garnett et al., 2012). SVR is similar to the support vector machine (SVM) (Smola and Scholkopf, 2004), but the response variable modeled is continuous in SVR instead of categorical as in SVM. Both Elastic Net and SVR use regression coefficients on each gene as associations with drug efficacy.
To set up the first evaluation standard, we collected several differential gene expression profiles between drug-resistant cell lines derived from chronic drug treatment and their parental cell lines. For PLX4720 and lapatinib screened in all three cohorts, we collected expression profiles from several studies (Bailey et al., 2014; Giles et al., 2013; Liu et al., 2009; Nazarian et al., 2010; Zhang et al., 2012). We defined the positive set in evaluation standard as the upregulated genes in a resistant cell line compared to its parental line and the negative set as the down-regulated genes. We then compared the computational methods using a receiver operating characteristic (ROC) curve (Figure 4A and Figure S4A, B) in which a reliable prediction should curve toward the upper left corner. Elastic Net predicted a small number of genes and missed most efficacy-associated genes in the evaluation standard (Figure S4C, D and Table S4A) (Barretina et al., 2012; Garnett et al., 2012). Although GDSC, Correlation, and SVR all have better performance than Elastic Net, CARE outperformed them all (Figure 4A and Figure S4A, B). We also tested the performance of different model variations. The current form of CARE score combined both interaction and base coefficients (Figure 1C). Alternatively, we can compute a t-value for only the interaction coefficient (“c” in Figure 1B, C) or the base coefficient (“b” in Figure 1B, C) without an interaction term in the linear model. Similarly, for other statistical methods, we also fitted model variations considering the combination, interaction, and base effects (STAR methods). On average, the combination form of CARE score outperformed all the other variations (Figure 4B).
Figure 4. CARE outperforms other computational methods in finding drug efficacy biomarkers.

(A) Performance comparison on predicting transcriptome signatures of drug resistant cell lines. Receiver operating characteristics (ROC) curves were used to compare different computational methods for their performance in predicting gene expression signatures of PLX4720 and lapatinib resistant cell lines.
(B) Performance comparison among model variations. For each method, we computed several variations of scores and compared their performance in predicting drug resistance associated genes as panel A. The mean of the area under ROC curve (AUC) across three screen cohorts are compared among all methods with standard deviations as error bars. Combination: the association calculated for the sum of both interaction and base coefficients. Interaction: only the interaction coefficient. Partial: only the coefficient of each gene P in a model without interactions.
(C) Performance comparison on predicting clinical outcome. For each method, the response was predicted for patients through the correlation between patient gene expression values and the result scores from each model. The accuracy metrics are compared in the same way as Figure 3B.
To set up the second evaluation standard of comparison, we utilized the metrics for predicting clinical response to targeted therapies (Figure 3B, D, F, J) and compared the drug efficacy signatures predicted from different computational methods (Figure 4C). Among all targeted therapies, CARE achieved robust prediction performance based on various accuracy metrics (Figure 4C). Thus, based on the comparisons above with evaluation standards from both cell-line models and clinical studies, CARE outperformed other computational approaches in predicting gene signatures of drug response and resistance from compound screening data.
For all the comparisons above, we only focused on drugs with high correlation between drug target status and drug efficacy. We further tested the CARE performance for drugs whose efficacy has low correlation with gene status of annotated targets, since the target gene status may not be the feature most correlated with drug efficacy. For example, the Pearson correlations between topotecan effectiveness and TOP1 expression levels are 0.099 and 0.105 in the CCLE and CTRP data, respectively, which all rank below 70% among all gene feature correlations. Using a ROC curve, we found that the CARE statistics and Pearson correlation achieved similar performance and that the interaction-only statistic has the worst prediction performance (Figure S4E, F). Thus, CARE may not have better performance than correlation when the annotated target gene does not correlate well with drug efficacy.
CARE predicts synergistic drug targets in treating HER2+ breast cancer cells
Finally, we evaluated whether CARE can identify synergistic drug targets to enhance the effectiveness of targeted therapies through combination medicine. We focused on the gene signatures for the ERBB2 inhibitor lapatinib, an orally active drug for HER2+ breast cancer and other solid tumors (Geyer et al., 2006; Janjigian, 2016). To this end, we selected genes with significantly negative CARE scores, indicating that high gene expression levels correlate with lapatinib resistance. We further selected genes upregulated in lapatinib-resistant cell lines (Bailey et al., 2014; Liu et al., 2009) and negatively associated with patient response in the CHER-LOB trial (Guarneri et al., 2015). Among the 47 genes meeting these criteria, only PRKD3 and AKT3 have compound inhibitors available (Table S5A). AKT3 has been reported to promote resistance to anti-HER2 therapy in breast cancer (Moody et al., 2015). PRKD3 was predicted by CARE to have a stronger association with the clinical outcome than the known lapatinib resistance drivers AKT3 and the previously discussed AXL (Figure S5A) and yet has never been reported to promote lapatinib resistance. Thus, we decided to validate PRKD3 experimentally.
We first knocked down PRKD3 using a pooled mixture of 30 different siRNAs targeting PRKD3 to reduce off-target effects and observed significantly increased lapatinib sensitivity in the HER2+ breast cancer cell line SKBR3 (Figure 5A, B). Encouraged by this result, we searched publicly available inhibitors and found three pan-PRKD kinase family (PRKD1, PRKD2, and PRKD3) inhibitors, KBNB14270, CRT0066101, and CID2011756. Using the Bliss independence model (Bliss, 1939) to evaluate the synergy between two compounds, we tested the effect of each PRKD inhibitor in combination with lapatinib. The Bliss independence model assumes no drug interaction and defines the co-treatment additive inhibition as IA + IB – IA * IB, where IA and IB represent the inhibition by compound A and B alone, respectively. The drug combination is synergistic if the measured co-treatment inhibition is higher than the expected additive effect and antagonistic if the measured inhibition is lower than the additive effect. At varying lapatinib doses, the inhibition effect of co-treatment with 4 μM PRKD inhibitor KBNB14270 is consistently better than the additive effect, indicating a consistent synergy between KBNB14270 and lapatinib (Figure 5C and Figure S5B). We also observed a similar synergy for CRT0066101 (Figure S5B, C). We next tested the drug synergy by varying the dose of different PRKD inhibitors. KBNB14270 and CRT0066101 consistently showed positive synergy with lapatinib (Figure 5D, E), and CID2011756 showed synergy at low lapatinib doses (Figure S5D). Besides lapatinib, trastuzumab is another targeted therapy used in HER2+ breast cancer. We also observed significant synergy between PRKD inhibitors and trastuzumab on the SKBR3 cell line (Figure S5C, D). Thus, our results suggest PRKD inhibitors as potentially synergistic therapies with anti-HER2 treatment in breast cancers.
Figure 5. Inhibition of PRKD3 increases lapatinib sensitivity.

(A) The siRNA pool knockdown efficiency against PRKD3 measured by qPCR and western blot (WB). (NC: negative control siRNA of scrambled sequences)
(B) The inhibition effects on SKBR3 growth from both PRKD3 knock-down and negative control conditions on a series of lapatinib doses by twofold dilution from 5 μM. Each inhibition fraction is the median value from three replicate experiments, with standard deviations as the error bars.
(C) The inhibition effects on SKBR3 growth from lapatinib mono-treatment and co-treatment with PRKD inhibitor KBNB14270 in 4 μM. The additive effect of co-treatment is estimated from the Bliss independence model. Each inhibition fraction is the median value from three replicate experiments, with standard deviations as the error bars.
(D) The synergy scores (the difference between co-treatment and Bliss additive inhibition) for dose combinations between lapatinib (Lap) and KBNB14270 (KBNB). Each score is the median value from three replicate experiments.
(E) The synergy scores for combinations between lapatinib and CRT0066101 (CRT).
During the gene prioritization process for lapatinib resistance, we only explored those genes with consistently high CARE scores across all three screen cohorts. However, some genes prioritized without this stringent threshold may still have very significant CARE scores in a subset of cohorts. For example, SERPINE1 has very significant CARE scores in CCLE and CTRP cohorts, but not GDSC, therefore not included in our previous prioritization result (Table S5B). While other genes may not have consistently significant CARE scores (Table S5B), which indicates that their association with drug resistance may not be valid across a broad range of cell lines in the compound screens.
Discussion
We developed a computational method, CARE, to systematically identify genes associated with response and resistance to targeted therapies based on compound screens. Comparisons based on multiple clinical datasets demonstrated the superior performance of CARE over other computational and experimental methods. Notably, we predicted PRKD3 as a potential regulator of anti-HER2 resistance and validated it as a promising target to increase lapatinib and trastuzumab efficacy through combinatorial treatment with PRKD inhibitors. Further experiments on animal models are needed to increase the clinical potential for these drug combinations.
CARE outperformed the gene signatures from CRISPR screens in predicting the patient clinical outcome (Figure 3B, F). One possible explanation is that the quality of CRISPR screens awaits further improvement at this early stage of technology development, as indicated by the low agreement between replicates (Figure S3D). Another possibility is that CARE analysis is based on drug sensitivity measurements in many cell lines with diverse characteristics, whereas current CRISPR/CRISPRa (or shRNA) screens on drug treatment were only available in individual cell lines.
For standard drugs in clinics, the data from drug-resistant cell models and human clinical studies could help to identify the response biomarker genes independently from CARE signatures. However, the molecular profiles of drug-resistant models are typically available on the scale of one or two cell lines. Additionally, most drug clinical studies only profiled a small number of patients (e.g., 12 patients for vemurafenib, 32 for lapatinib). In contrast, the CARE signature is trained using the genomics and pharmacological data from approximately 1,000 cell lines with distinct characteristics; thus, it is generalized from a broad genetic background. Second, for most compounds that are not used in clinics, the molecular profiles of drug-resistant cell lines and clinical response do not exist. However, CARE signatures would still be available to understand potential drug resistance mechanisms for these compounds.
A limitation of CARE is that some driver mutations of drug resistance may not exist in sufficient frequency in the screened cell lines. For example, there is only one CCLE cell line harboring the EGFR T790M mutation, the dominant mechanism of resistance to EGFR inhibitors (Holohan et al., 2013). As a result, CARE cannot make statistical inferences on this mutation. Meanwhile, although current compound screening projects have tested almost 1000 cell lines, the number of cell lines in each cancer type is still limited (Figure S4G). CARE has better performance in pan-cancer analysis than lineagespecific analysis due to the sample size limitation in each cancer lineage (Figure S4H, I). Another limitation is that CARE currently utilizes only cell line data that describe cell autonomous behavior. However, the efficacy of many targeted therapies not only involves direct cytotoxic effects but also relies on the activation of tumor-targeting immune responses (Galluzzi et al., 2015). Thus, future computational methods should model the impact of the tumor microenvironment in predicting therapy response.
Despite these limitations, CARE has demonstrated reliable performance in inferring gene biomarkers to predict the efficacy of targeted therapy, as well as synergistic drug combinations. Recent years have seen the advances in high-throughput technologies and increased data volumes for cancer drug research (Chen and Butte, 2016). We foresee that CARE will provide future assistance in the development of anticancer drug biomarkers and combination therapies.
STAR Methods
Contact for Reagent and Resource Sharing
Further information and requests for resources and reagents should be directed to and will be fulfilled by the Lead Contact, Xiaole Shirley Liu (xsliu@jimmy.harvard.edu). All cell lines, chemicals, and reagents can be attained directly from the original supplier.
Experimental Model and Subject Details
The SKBR3 is a female breast cancer cell line of HER2+ subtype purchased from ATCC. All models are regularly tested for being free of mycoplasma, and their identities are verified.
Method Details
Pharmacological screen data collection
Compound inhibition, gene expression, and mutation profiles were available from the websites of CCLE (Barretina et al., 2012), GDSC (previously named CGP) (Iorio et al., 2016) and CTRP (Seashore-Ludlow et al., 2015) with data version until 07/10/2016. All compound names are converted to the standard names in PubChem database (Kim et al., 2016). The CARE framework uses a sigmoid function to fit drug inhibition values at different doses into a response curve, and compute the drug inhibition as the area under the dose-response curve, ranging from 0% to 100%. The source code of response curve fitting is released as program “nls_logsig” (Key Resources Table).
Key Resources Table.
| REAGENT or RESOURCE | SOURCE | IDENTIFIER |
|---|---|---|
| Antibodies | ||
| Rabbit monoclonal anti-PRKD3 | Cell Signaling Technology | Cat# 5655S; RRID: AB_10695917 |
| Mouse monoclonal anti-ACTB | Sigma-Aldrich | Cat# A1978; RRID: AB_476692 |
| HRP-linked anti-mouse IgG | Cell Signaling Technology | Cat# 7076S; RRID: AB_330924 |
| HRP-linked anti-rabbit IgG | Cell Signaling Technology | Cat# 7074S; RRID: AB_2099233 |
| Trastuzumab | Dana Farber Pharmacy | CAS: 180288-69-1 |
| Chemicals, Peptides, and Recombinant Proteins | ||
| Lapatinib | Selleck Chemicals | Cat# S2111; CAS: 231277-92-2 |
| KBNB14270 | Sigma-Aldrich | Cat# SML0525; CAS: 1233533-04-4 |
| CRT0066101 | Sigma-Aldrich | Cat# SML1507; CAS: 956123-34-5 |
| CID2011756 | Sigma-Aldrich | Cat# SML0369; CAS: 638156-11-3 |
| Critical Commercial Assays | ||
| Cell Titer-Blue Cell Viability Assay | Promega | Cat# G8081 |
| Experimental Models: Cell Lines | ||
| SKBR3 | ATCC | HTB-30 |
| Oligonucleotides | ||
| siRNA pool targeting PRKD3 | siTOOLs Biotech | siPOOL-5 Kit - 23683 |
| siRNA pool negative control | siTOOLs Biotech | siPOOL-5 Kit – negative control |
| qPCR Primer: PRKD3: Forward: CTTTCAGCTTTAGCCACAGTAG | This paper | N/A |
| qPCR Primer: PRKD3: Reverse: AGAGCATCTCACCACAGTAATC | This paper | N/A |
| qPCR Primer: ACTB: Forward: GACCCAGATCATGTTTGAGACC | This paper | N/A |
| qPCR Primer: ACTB: Reverse: CCAGAGGCGTACAGGGATAG | This paper | N/A |
| Software and Algorithms | ||
| CARE | This paper | http://care.dfci.harvard.edu/download |
| nls_logsig | This paper | http://care.dfci.harvard.edu/download |
| Limma | Bioconductor | http://bioconductor.org/packages/limma |
| glmnet | CRAN | http://cran.r-project.org/web/packages/glmnet |
| scikit-learn | Anaconda | http://scikit-learn.org/stable/ |
| RABIT | (Jiang et al., 2015) | http://rabit.dfci.harvard.edu/download |
| GSL scientific library | GNU | http://www.gnu.org/software/gsl/ |
| Other | ||
| CCLE compound screen data | (Barretina et al., 2012) | https://portals.broadinstitute.org/ccle |
| GDSC compound screen data | (Iorio et al., 2016) | http://www.cancerrxgene.org/downloads |
| CTRP compound screen data | (Seashore-Ludlow et al., 2015) | https://portals.broadinstitute.org/ctrp |
Clinical data collection
The gene expression profiles of pre-treatment tumors and patient clinical information were collected for vemurafenib in melanoma (Hugo et al., 2015), lapatinib in HER2+ breast cancer (Guarneri et al., 2015), pembrolizumab in melanoma (Hugo et al., 2016), and paclitaxel in breast cancer (Hatzis et al., 2011; Miyake et al., 2012; Popovici et al., 2010). In each dataset, the expression value of each gene is normalized by subtracting the mean value across all samples. Only genes with top 50% expression variance in each study were considered in response prediction. In the pembrolizumab study, 28 patients were profiled in the original study (Hugo et al., 2016). However, one patient is profiled on-treatment, one patient has duplicated profiles, and one patient does not have survival information. Therefore, only the pre-treatment expression profiles of 25 patients with complete clinical information are included in further analysis.
Selection of drug target gene statuses
For each compound, we used the drug target gene annotation provided by each screen projects. Among annotated targets, we ran a forward feature selection algorithm RABIT (Jiang et al., 2015) to minimize the Mallow’s Cp and make sure that included target gene status can jointly predict the drug efficacy without redundancy. Mallow’s Cp estimates the prediction precision of a linear model with drug target features as covariates and drug efficacy as the response (Mallows, 1973). The stepwise selection procedure stops at the minimum Mallow’s Cp value (James et al., 2013). Our analysis only included reliable drug target gene statuses with positive coefficients in the final linear model. There are 17, 190, and 118 compounds with reliable targets selected in the CCLE, CTRP, and GDSC cohorts, respectively.
The drug target selection process above may not select the primary drug target status. For example, our procedure selected EGFR gene expression for erlotinib and gefitinib through high correlation with drug efficacy (Figure S1D), but EGFR mutation is known as the primary drug target status. The reason is that the cell line collection screened in three projects have a very low frequency of EGFR mutation. The most common EGFR activating mutations are in-frame deletions of exon 19 and L858R point mutation in exon 21, which account for ~90% of all EGFR mutations in lung cancer (Ladanyi and Pao, 2008). Among the CCLE cell lines screened by both CCLE and CTRP project, only five cell lines harbor these mutations (Figure S1E upper). In the COSMIC cell collection screened by GDSC project, only four cell lines harbor these mutations (Figure S1E bottom). In both CCLE and COSMIC cohorts, only one cell line has T790M mutation that drives EGFR inhibitor resistance (Figure S1E). Among about 1000 cancer cell lines in each collection, less than five cell lines in total cannot lead to any reliable statistical inference. We only included mutation variables with more than 10% frequency among tested cell lines. Thus, we excluded EGFR mutation in our analysis and used the expression as alternative target status. Consistent with the results from cell screens, several clinical studies also reported that EGFR gene level as a strong predictor of erlotinib and gefitinib efficacy (Cappuzzo et al., 2005; Haas-Kogan et al., 2005; Jazieh et al., 2013; Tsao et al., 2005).
For CDK4/6 inhibitor palbociclib, we noticed that the status of RB1, but not CDK4/6, is used as the patient selection criterion in palbociclib clinical trials (O’Leary et al., 2016). Indeed, the correlations between RB1 expression and palbociclib efficacy rank above 98% among all gene correlations in both CCLE and GDSC screens (Figure S1F). Thus, in our current analysis, we included RB1 as the target.
Interaction test in multivariate linear regression
For each targeted therapy, the drug efficacy associations of all genes are tested by an interaction test in linear regression (Figure 1B). Variable T and P represent the statuses of the drug target gene and a candidate gene in the test, respectively. For gene mutation status, a value of zero on variable T or P indicates an absence of mutation; and a value of one indicates a presence of the mutation. For gene expression status, our analysis normalized all values to zero mean and one standard deviation. Thus, a value of zero on variable T or P represents the average expression level of a gene across all cell lines; and a value of one represents one standard deviation higher than average. We solve a linear model “Inhibition = a*T + b*P + c*T*P + Intercept + ε” using the ordinary least square method (OLS) (Freedman, 2009). Since we have selected compounds whose inhibition efficacy positively correlates with the drug target status T, the coefficient “a” is always positive. The slope between drug target status and drug inhibition efficacy is “ a + cP” (Figure 1B). If the coefficient “c” is negative, increasing P will decrease the slope. In contrast, if the coefficient “c” is positive, increasing P will increase the slope.
To estimate the overall association between gene P and drug inhibition efficacy, we computed the sum of coefficients “b + c” (Figure 1C), defined as the conditional effect (Brambor et al., 2006). The linear model of CARE has the form “Inhibition = a T + b P + c T P + Intercept + ε”. The covariates T and P represent gene statuses. For mutation status, value “0” represents the absence of mutation, and value “1” represents the presence of the mutation. For expression status, we have transformed the values for each gene to zero-mean and one standard deviation. Thus, value “0” represents the average expression level among all cell lines, and value “1” represents the expression level of one standard deviation higher than average. The association between drug inhibition response and candidate gene P when target gene T is activated could be represented as “Inhibition = a + b P + c P + Intercept + ε | T = 1”. Thus, “b + c” represents the association between drug inhibition and candidate gene P when drug target is activated (i.e., T = 1).
For coefficient sum b + c, the t-value is calculated following the procedure of general linear hypothesis testing (Figure 1C) (Hothorn et al., 2008). If a linear model has the form y = X β + ε, following OLS conditions, we could estimate coefficient β and its covariance matrix Σ as β̂ and Σ̂. For any linear combinations of parameters cβ (c is a linear vector), we can estimate it as cβ̂ and its covariance matrix as c′Σ̂ c (Freedman, 2009). Under the OLS assumptions, the t-statistics follows student t-distribution with n-p-1 as the degree of freedom (Hothorn et al., 2008). In the hypothesis test, the null hypothesis is cβ = 0 and alternative hypothesis is cβ ≠ 0. In our CARE method, we use the linear combination of two coefficients b and c as a special case of t-statistics described above. CARE computes a two-sided p-value for the t-statistics through the student t-test. For all p-values of tested genes in each screen profile, the Benjamini Hochberg procedure can convert p-values to false discovery rates (FDR) with 0.05 as result selection threshold.
Interaction test for compounds with multiple drug targets
Certain drugs may have multiple annotated drug targets (e.g., Lapatinib targets both ERBB2 and EGFR). For such cases, we solve a single linear model with all covariates: , where N is the number of drug targets. Then, for each target gene Ti, CARE computes the t-value as (Table S1). For lapatinib, the CHER-LOB trial only considered the ERBB2 level in patient selection. Thus, we used the CARE scores associated with ERBB2 to predict therapy response.
Difference between CARE and other regression, correlation, and ANOVA methods
Most computational approaches tested in this study involved computing products among different variables. However, the products among these methods are different. The product “T*P” in CARE is a covariate for testing the interaction effects “c” in linear model “Inhibition = a*T + b*P + c*T*P” (Figure 1B). After computing “T*P”, we still need to use the ordinary least square approach to calculate all coefficients (e.g., b, c) as the final output (Freedman, 2009). In contrast, for correlation, the product of normalized variables “Inhibition * P” is directly the final output. ANOVA is different from correlation in that ANOVA is testing the difference among group variations associated with categorical variables. We used the ANOVA implemented in the GDSC package (Iorio et al., 2016), which requires the gene expression level of P as discrete values of either high or low with a cutoff on the average value among all patients. In contrast, both correlation and CARE work on continuous variables without any cut-off threshold.
Annotation of druggable genes
For all genes with drug score larger than 5 in the Pfizer OASIS database (Fernandez-Banet et al., 2016), we further searched their gene name on Selleck website (http://www.selleckchem.com), and only keep genes with inhibitors commercially available.
Experimental validation on PRKD3 as synergistic target of anti-HER2 therapies
The siRNA pool targeting PRKD3 and non-target control siRNAs were purchased from the siTools Biotech company (http://www.sitoolsbiotech.com). The antibody to PRKD3 was from Cell Signaling Technology (D57E6, 1:500 dilution). The antibody to ACTB was from Sigma Aldrich (A1978, 1:5000 dilution). Secondary antibody HRP anti-mouse was from Cell Signaling Technology (#7076S, 1:2500). HRP anti-rabbit was from Cell Signaling Technology (#7074S, 1:2500). Lapatinib was from SelleckChem, and trastuzumab was from Dana-Farber Pharmacy store. All PRKD inhibitors (KBNB14270, CRT0066101, and CID2011756) were purchased from Sigma Aldrich.
The SKBR3 cell line (ATCC, Mycoplasma tested free) was cultured in Mccoy 5A medium (Fisher Scientific) with 10% FBS. On day 1, siRNA pools (siTools Biotech) targeting PRKD3 and control were reverse transfected at a concentration of 20nM with Lipofectamine RNAiMax (Invitrogen), and seeded in 96 well plates at 10,000 cells per well. We examined the knockdown efficiency at 24 hours with qPCR and 72 hours with western blot. ACTB is the control gene for both qPCR and western blot. On day 2, the cell line was treated with lapatinib with ten concentrations, starting from 5uM with a dilution factor of two. After three days, we used the Cell Titer Blue assay (Promega) to test the cell viability.
In the drug co-treatment experiments, different dose combinations of PRKD inhibitors and lapatinib or trastuzumab are seeded together with the SKBR3 cell at 10,000 cells per well. The inhibition effects are measured after three days using Cell Titer Blue assay.
Quantification and Statistical Analysis
Gene biomarkers from different computational methods
We trained each statistical model on the full range of screen data. The coefficient or statistical metric associated with each gene feature is the genome-wide biomarker to predict drug efficacy. Specifically, the CARE biomarker is the genome-scale score vector of t-values computed from interaction test (Figure 1C). For correlation, the biomarker is the genome-scale vector of Pearson correlation values between molecular gene status and drug inhibition values across cell lines. The ANOVA analysis was implemented in the GDSC software package (Iorio et al., 2016), and the biomarker is the vector of delta values comparing the difference of drug response by gene mutation status, or discrete status of gene expression.
For support vector regression (SVR), we trained linear epsilon-SVM using Python model scikit-learn. The input matrix X is composed of gene expression and mutation status. The response Y consists of drug inhibition values across cell lines. For CCLE screen, the dimension of X matrix is 18,293 (gene variables of expression and mutation) × 493 (cell lines). For CTRP screen, the dimension of X matrix is 18,293 × 821. For GDSC screen, the dimension of X matrix is 31657 × 962. For each compound, the SVM training is done together with ten-fold cross validation (CV) with the high dimensional X matrix. Using the linear kernel, we tuned the cost parameter among 1, 10, 100, 1000, and selected an optimal value with best CV R2 score. The biomarker from the linear SVM consists of the coefficients of all genes.
For elastic net, we trained one linear model for each compound, using ten-fold cross validation by R glmnet package with the same SVR input (Friedman et al., 2010). The parameter “alpha” controls the combination between the L1 penalty of lasso and the L2 penalty of ridge regression. We explored alpha values from 0 to 1 with 0.1 as the step and took the value with the best CV R2 score. The biomarker from elastic net consists of the coefficients of all genes.
Gene biomarkers from different genomics experiments
The gene biomarker from each genetic screen (CRISPR, CRISPRa, shRNA, siRNA, and ORF) consist of all gene log-fold-change values that test the difference of median guide RNA frequency between drug treatment and control conditions. The biomarker from each chronic cell line experiment consists of the gene differential expression t-values computed by Limma between the drug resistant cell line and parental sensitive line (Ritchie et al., 2015). For clinical studies (Hatzis et al., 2011; Miyake et al., 2012; Popovici et al., 2010), we tested the association between gene expression values and patient clinical response with logistic regression, and the biomarker comes from the t-values of gene coefficients.
Clinical response prediction through genome-scale biomarkers
For each genome-scale biomarker, the Pearson correlation between gene expression values and biomarker gene scores predicts the treatment response for each patient in a clinical study (Figure 1D). Positively correlated patients are responders, and negatively correlated patients are nonresponders. For each clinical study, we ranked all human genes according to the standard deviation of expression values across patients and only used the top 50% genes in a correlation analysis. Certain genomic screen studies did not release their data (Table S3) (Eichhorn et al., 2008; Moody et al., 2015). For these studies, we extracted the top gene hits reported in the publication and computed the average gene expression value over these top gene hits as therapy response prediction.
Comparison of methods for finding genes associated with drug efficacy
As the evaluation standard of gene signatures associated with response and resistance to targeted therapy, we utilized gene expression data from drug resistant cell lines derived from chronic treatment on sensitive cell lines. For microarray data, we used Limma to extract the differential expressed genes between drug resistant cell line and parental sensitive cell line (Ritchie et al., 2015). The evaluation standard positive set consists of the upregulated genes selected by Limma, and the evaluation standard negative set consists of those down-regulated genes.
For BRAF inhibitor, we used the data from a previous study that derived drug resistant cell lines from chronic drug treatment and compared the gene expression profiles between drug resistant cell lines and their parental lines (Nazarian et al., 2010). Among three drug resistant cell lines, only M229-R5 and M238-R1 (but not M249-R4) have more than ten differential upregulated genes with default Limma parameters. We used the intersection of differential expressed genes between M229-R5 and M238-R1 as the evaluation standard set for BRAF inhibitor. Comparing to the union, the overlap of differentially expressed genes could give a more consistent result in a third drug resistant cell line SKMel28 (Figure S4J, K) (Hugo et al., 2015). Many previously known genes involved in anti-BRAF resistance are differentially expressed in the M229-R5 and M238-R1 cell lines (Table S4B, C).
For lapatinib, we found microarray data of drug resistant cell lines derived from BT474 (Liu et al., 2009) and SKBR3 (Bailey et al., 2014), and used the overlap of differentially expressed genes between these two cell lines as evaluation standard. For topotecan, we found microarray data of drug resistant cell line derived from A2780 (Januchowski et al., 2014), and used the overlap of differentially expressed genes between two independent resistant clones as the evaluation standard.
Based on the evaluation standard defined above, we used receiver operating characteristic (ROC) curve to compare computational methods in predicting drug efficacy gene scores from compound screen data (Figure 4A). The ROC curve plots the true positive rate against the false positive rate at various thresholds of gene scores. If a method makes random predictions, the ROC curve will stay on diagonal. If a method makes perfect predictions, the ROC curve will stay on upper left corner. The area under ROC curve (AUC) can measure the overall performance of a method (Figure 4B).
Data and Software Availability
The open source CARE package is available under GNU Public License v3 on our website: http://care.dfci.harvard.edu/download/. The source code for our Bliss synergy analysis is also available on the download page. Users can query our analysis results with drug or gene names on our website (http://care.dfci.harvard.edu). Also, all of our processed input data, analysis output data, and an example script to repeat our major results are available at http://care.dfci.harvard.edu/download/.
Supplementary Material
Movie S1. Methodology of CARE framework, Related to Figure 1.
Highlights.
CARE predicts clinical efficacy of targeted therapies using compound screen data
Interaction testing in multivariate models is the key methodology of CARE
Common response signatures exist between targeted therapies and immunotherapies
PRKD3 inhibition synergizes with lapatinib in HER2-positive breast cancer cells
Acknowledgments
We thank Wenbin Li, Pan Lee, Jixin Yang, Shaokun Shu, Bo Li, Chongzhi Zang, Eric Severson, Levi Garraway, and William Sellers for helpful discussions. The work is supported by NIH/NCI, 1U01CA180980 and National Natural Science Foundation of China 31329003.
Footnotes
Author Contributions
P.J., and X.S.L. designed the research, analyzed data and wrote the paper. P.J. performed both computational analysis and experimental validation. J.C.A provided the experimental platforms and reagents. X.L. collected and preprocessed the compound screen data. J.C.A., M.B., and J.S.L discussed with P.J. about the study. W.L., C.J., M.B., and J.C.A. advised P.J. on the experimental techniques.
Declaration of Interests
The authors declare no competing interests.
Publisher's Disclaimer: This is a PDF file of an unedited manuscript that has been accepted for publication. As a service to our customers we are providing this early version of the manuscript. The manuscript will undergo copyediting, typesetting, and review of the resulting proof before it is published in its final citable form. Please note that during the production process errors may be discovered which could affect the content, and all legal disclaimers that apply to the journal pertain.
References
- Bailey ST, Miron PL, Choi YJ, Kochupurakkal B, Maulik G, Rodig SJ, Tian R, Foley KM, Bowman T, Miron A, et al. NF-kappaB activation-induced anti-apoptosis renders HER2-positive cells drug resistant and accelerates tumor growth. Molecular cancer research : MCR. 2014;12:408–420. doi: 10.1158/1541-7786.MCR-13-0206-T. [DOI] [PMC free article] [PubMed] [Google Scholar]
- Barretina J, Caponigro G, Stransky N, Venkatesan K, Margolin AA, Kim S, Wilson CJ, Lehar J, Kryukov GV, Sonkin D, et al. The Cancer Cell Line Encyclopedia enables predictive modelling of anticancer drug sensitivity. Nature. 2012;483:603–607. doi: 10.1038/nature11003. [DOI] [PMC free article] [PubMed] [Google Scholar]
- Bliss CI. THE TOXICITY OF POISONS APPLIED JOINTLY1. Annals of Applied Biology. 1939;26:585–615. [Google Scholar]
- Bollag G, Tsai J, Zhang J, Zhang C, Ibrahim P, Nolop K, Hirth P. Vemurafenib: the first drug approved for BRAF-mutant cancer. Nature reviews Drug discovery. 2012;11:873–886. doi: 10.1038/nrd3847. [DOI] [PubMed] [Google Scholar]
- Brambor T, Clark WR, Golder M. Understanding interaction models: Improving empirical analyses. Political Analysis. 2006;14:63–82. [Google Scholar]
- Cappuzzo F, Hirsch FR, Rossi E, Bartolini S, Ceresoli GL, Bemis L, Haney J, Witta S, Danenberg K, Domenichini I, et al. Epidermal growth factor receptor gene and protein and gefitinib sensitivity in non-small-cell lung cancer. Journal of the National Cancer Institute. 2005;97:643–655. doi: 10.1093/jnci/dji112. [DOI] [PubMed] [Google Scholar]
- Chen B, Butte AJ. Leveraging big data to transform target selection and drug discovery. Clinical pharmacology and therapeutics. 2016;99:285–297. doi: 10.1002/cpt.318. [DOI] [PMC free article] [PubMed] [Google Scholar]
- Costello JC, Heiser LM, Georgii E, Gonen M, Menden MP, Wang NJ, Bansal M, Ammad-ud-din M, Hintsanen P, Khan SA, et al. A community effort to assess and improve drug sensitivity prediction algorithms. Nature biotechnology. 2014;32:1202–1212. doi: 10.1038/nbt.2877. [DOI] [PMC free article] [PubMed] [Google Scholar]
- Dongre A, Rashidian M, Reinhardt F, Bagnato A, Keckesova Z, Ploegh HL, Weinberg RA. Epithelial-to-mesenchymal Transition contributes to Immunosuppression in Breast Carcinomas. Cancer research. 2017 doi: 10.1158/0008-5472.CAN-16-3292. [DOI] [PMC free article] [PubMed] [Google Scholar]
- Eichhorn PJ, Gili M, Scaltriti M, Serra V, Guzman M, Nijkamp W, Beijersbergen RL, Valero V, Seoane J, Bernards R, et al. Phosphatidylinositol 3-kinase hyperactivation results in lapatinib resistance that is reversed by the mTOR/phosphatidylinositol 3-kinase inhibitor NVP-BEZ235. Cancer research. 2008;68:9221–9230. doi: 10.1158/0008-5472.CAN-08-1740. [DOI] [PMC free article] [PubMed] [Google Scholar]
- Fernandez-Banet J, Esposito A, Coffin S, Horvath IB, Estrella H, Schefzick S, Deng S, Wang K, KAC, Ding Y, et al. OASIS: web-based platform for exploring cancer multi-omics data. Nat Methods. 2016;13:9–10. doi: 10.1038/nmeth.3692. [DOI] [PubMed] [Google Scholar]
- Filipits M, Rudas M, Jakesz R, Dubsky P, Fitzal F, Singer CF, Dietze O, Greil R, Jelen A, Sevelda P, et al. A new molecular predictor of distant recurrence in ER-positive, HER2-negative breast cancer adds independent information to conventional clinical risk factors. Clinical cancer research : an official journal of the American Association for Cancer Research. 2011;17:6012–6020. doi: 10.1158/1078-0432.CCR-11-0926. [DOI] [PubMed] [Google Scholar]
- Freedman D. Statistical models : theory and practice. Cambridge ; New York: Cambridge University Press; 2009. [Google Scholar]
- Friedman J, Hastie T, Tibshirani R. Regularization Paths for Generalized Linear Models via Coordinate Descent. Journal of statistical software. 2010;33:1–22. [PMC free article] [PubMed] [Google Scholar]
- Galluzzi L, Buque A, Kepp O, Zitvogel L, Kroemer G. Immunological Effects of Conventional Chemotherapy and Targeted Anticancer Agents. Cancer cell. 2015;28:690–714. doi: 10.1016/j.ccell.2015.10.012. [DOI] [PubMed] [Google Scholar]
- Garnett MJ, Edelman EJ, Heidorn SJ, Greenman CD, Dastur A, Lau KW, Greninger P, Thompson IR, Luo X, Soares J, et al. Systematic identification of genomic markers of drug sensitivity in cancer cells. Nature. 2012;483:570–575. doi: 10.1038/nature11005. [DOI] [PMC free article] [PubMed] [Google Scholar]
- Geyer CE, Forster J, Lindquist D, Chan S, Romieu CG, Pienkowski T, Jagiello-Gruszfeld A, Crown J, Chan A, Kaufman B, et al. Lapatinib plus capecitabine for HER2-positive advanced breast cancer. The New England journal of medicine. 2006;355:2733–2743. doi: 10.1056/NEJMoa064320. [DOI] [PubMed] [Google Scholar]
- Giles KM, Kalinowski FC, Candy PA, Epis MR, Zhang PM, Redfern AD, Stuart LM, Goodall GJ, Leedman PJ. Axl mediates acquired resistance of head and neck cancer cells to the epidermal growth factor receptor inhibitor erlotinib. Molecular cancer therapeutics. 2013;12:2541–2558. doi: 10.1158/1535-7163.MCT-13-0170. [DOI] [PubMed] [Google Scholar]
- Gillet JP, Calcagno AM, Varma S, Marino M, Green LJ, Vora MI, Patel C, Orina JN, Eliseeva TA, Singal V, et al. Redefining the relevance of established cancer cell lines to the study of mechanisms of clinical anti-cancer drug resistance. Proceedings of the National Academy of Sciences of the United States of America. 2011;108:18708–18713. doi: 10.1073/pnas.1111840108. [DOI] [PMC free article] [PubMed] [Google Scholar]
- Gillet JP, Varma S, Gottesman MM. The clinical relevance of cancer cell lines. Journal of the National Cancer Institute. 2013;105:452–458. doi: 10.1093/jnci/djt007. [DOI] [PMC free article] [PubMed] [Google Scholar]
- Guarneri V, Dieci MV, Frassoldati A, Maiorana A, Ficarra G, Bettelli S, Tagliafico E, Bicciato S, Generali DG, Cagossi K, et al. Prospective Biomarker Analysis of the Randomized CHER-LOB Study Evaluating the Dual Anti-HER2 Treatment With Trastuzumab and Lapatinib Plus Chemotherapy as Neoadjuvant Therapy for HER2-Positive Breast Cancer. The oncologist. 2015;20:1001–1010. doi: 10.1634/theoncologist.2015-0138. [DOI] [PMC free article] [PubMed] [Google Scholar]
- Haas-Kogan DA, Prados MD, Tihan T, Eberhard DA, Jelluma N, Arvold ND, Baumber R, Lamborn KR, Kapadia A, Malec M, et al. Epidermal growth factor receptor, protein kinase B/Akt, and glioma response to erlotinib. Journal of the National Cancer Institute. 2005;97:880–887. doi: 10.1093/jnci/dji161. [DOI] [PubMed] [Google Scholar]
- Hatzis C, Pusztai L, Valero V, Booser DJ, Esserman L, Lluch A, Vidaurre T, Holmes F, Souchon E, Wang H, et al. A genomic predictor of response and survival following taxane-anthracycline chemotherapy for invasive breast cancer. Jama. 2011;305:1873–1881. doi: 10.1001/jama.2011.593. [DOI] [PMC free article] [PubMed] [Google Scholar]
- Holohan C, Van Schaeybroeck S, Longley DB, Johnston PG. Cancer drug resistance: an evolving paradigm. Nature reviews Cancer. 2013;13:714–726. doi: 10.1038/nrc3599. [DOI] [PubMed] [Google Scholar]
- Hothorn T, Bretz F, Westfall P. Simultaneous inference in general parametric models. Biometrical journal Biometrische Zeitschrift. 2008;50:346–363. doi: 10.1002/bimj.200810425. [DOI] [PubMed] [Google Scholar]
- Hu X, Zhang Z. Understanding the Genetic Mechanisms of Cancer Drug Resistance Using Genomic Approaches. Trends in genetics : TIG. 2016;32:127–137. doi: 10.1016/j.tig.2015.11.003. [DOI] [PubMed] [Google Scholar]
- Hugo W, Shi H, Sun L, Piva M, Song C, Kong X, Moriceau G, Hong A, Dahlman KB, Johnson DB, et al. Non-genomic and Immune Evolution of Melanoma Acquiring MAPKi Resistance. Cell. 2015;162:1271–1285. doi: 10.1016/j.cell.2015.07.061. [DOI] [PMC free article] [PubMed] [Google Scholar]
- Hugo W, Zaretsky JM, Sun L, Song C, Moreno BH, Hu-Lieskovan S, Berent-Maoz B, Pang J, Chmielowski B, Cherry G, et al. Genomic and Transcriptomic Features of Response to Anti-PD-1 Therapy in Metastatic Melanoma. Cell. 2016;165:35–44. doi: 10.1016/j.cell.2016.02.065. [DOI] [PMC free article] [PubMed] [Google Scholar]
- Iorio F, Knijnenburg TA, Vis DJ, Bignell GR, Menden MP, Schubert M, Aben N, Goncalves E, Barthorpe S, Lightfoot H, et al. A Landscape of Pharmacogenomic Interactions in Cancer. Cell. 2016;166:740–754. doi: 10.1016/j.cell.2016.06.017. [DOI] [PMC free article] [PubMed] [Google Scholar]
- Issaq HJ, Waybright TJ, Veenstra TD. Cancer biomarker discovery: Opportunities and pitfalls in analytical methods. Electrophoresis. 2011;32:967–975. doi: 10.1002/elps.201000588. [DOI] [PubMed] [Google Scholar]
- James G, Witten D, Hastie T, Tibshirani R. An introduction to statistical learning : with applications in R. 1. Springer; 2013. [Google Scholar]
- Janjigian YY. Lapatinib in Gastric Cancer: What Is the LOGiCal Next Step? Journal of clinical oncology : official journal of the American Society of Clinical Oncology. 2016;34:401–403. doi: 10.1200/JCO.2015.64.2892. [DOI] [PubMed] [Google Scholar]
- Januchowski R, Zawierucha P, Rucinski M, Zabel M. Microarray-based detection and expression analysis of extracellular matrix proteins in drugresistant ovarian cancer cell lines. Oncology reports. 2014;32:1981–1990. doi: 10.3892/or.2014.3468. [DOI] [PubMed] [Google Scholar]
- Jazieh AR, Al Sudairy R, Abu-Shraie N, Al Suwairi W, Ferwana M, Murad MH. Erlotinib in wild type epidermal growth factor receptor non-small cell lung cancer: A systematic review. Annals of thoracic medicine. 2013;8:204–208. doi: 10.4103/1817-1737.118503. [DOI] [PMC free article] [PubMed] [Google Scholar]
- Jiang P, Freedman ML, Liu JS, Liu XS. Inference of transcriptional regulation in cancers. Proceedings of the National Academy of Sciences of the United States of America. 2015;112:7731–7736. doi: 10.1073/pnas.1424272112. [DOI] [PMC free article] [PubMed] [Google Scholar]
- Johannessen CM, Johnson LA, Piccioni F, Townes A, Frederick DT, Donahue MK, Narayan R, Flaherty KT, Wargo JA, Root DE, et al. A melanocyte lineage program confers resistance to MAP kinase pathway inhibition. Nature. 2013;504:138–142. doi: 10.1038/nature12688. [DOI] [PMC free article] [PubMed] [Google Scholar]
- Kim S, Thiessen PA, Bolton EE, Chen J, Fu G, Gindulyte A, Han L, He J, He S, Shoemaker BA, et al. PubChem Substance and Compound databases. Nucleic acids research. 2016;44:D1202–1213. doi: 10.1093/nar/gkv951. [DOI] [PMC free article] [PubMed] [Google Scholar]
- Konermann S, Brigham MD, Trevino AE, Joung J, Abudayyeh OO, Barcena C, Hsu PD, Habib N, Gootenberg JS, Nishimasu H, et al. Genome-scale transcriptional activation by an engineered CRISPR-Cas9 complex. Nature. 2015;517:583–588. doi: 10.1038/nature14136. [DOI] [PMC free article] [PubMed] [Google Scholar]
- Ladanyi M, Pao W. Lung adenocarcinoma: guiding EGFR-targeted therapy and beyond. Modern pathology : an official journal of the United States and Canadian Academy of Pathology, Inc 21 Suppl. 2008;2:S16–22. doi: 10.1038/modpathol.3801018. [DOI] [PubMed] [Google Scholar]
- Liu L, Greger J, Shi H, Liu Y, Greshock J, Annan R, Halsey W, Sathe GM, Martin AM, Gilmer TM. Novel mechanism of lapatinib resistance in HER2-positive breast tumor cells: activation of AXL. Cancer research. 2009;69:6871–6878. doi: 10.1158/0008-5472.CAN-08-4490. [DOI] [PubMed] [Google Scholar]
- Mabert K, Cojoc M, Peitzsch C, Kurth I, Souchelnytskyi S, Dubrovska A. Cancer biomarker discovery: current status and future perspectives. International journal of radiation biology. 2014;90:659–677. doi: 10.3109/09553002.2014.892229. [DOI] [PubMed] [Google Scholar]
- Mallows C. Some Comments on CP. Technometrics. 1973;15:661–675. [Google Scholar]
- Manguso RT, Pope HW, Zimmer MD, Brown FD, Yates KB, Miller BC, Collins NB, Bi K, LaFleur MW, Juneja VR, et al. In vivo CRISPR screening identifies Ptpn2 as a cancer immunotherapy target. Nature. 2017 doi: 10.1038/nature23270. [DOI] [PMC free article] [PubMed] [Google Scholar]
- McDermott M, Eustace AJ, Busschots S, Breen L, Crown J, Clynes M, O’Donovan N, Stordal B. In vitro Development of Chemotherapy and Targeted Therapy Drug-Resistant Cancer Cell Lines: A Practical Guide with Case Studies. Frontiers in oncology. 2014;4:40. doi: 10.3389/fonc.2014.00040. [DOI] [PMC free article] [PubMed] [Google Scholar]
- Misale S, Yaeger R, Hobor S, Scala E, Janakiraman M, Liska D, Valtorta E, Schiavo R, Buscarino M, Siravegna G, et al. Emergence of KRAS mutations and acquired resistance to anti-EGFR therapy in colorectal cancer. Nature. 2012;486:532–536. doi: 10.1038/nature11156. [DOI] [PMC free article] [PubMed] [Google Scholar]
- Miyake T, Nakayama T, Naoi Y, Yamamoto N, Otani Y, Kim SJ, Shimazu K, Shimomura A, Maruyama N, Tamaki Y, et al. GSTP1 expression predicts poor pathological complete response to neoadjuvant chemotherapy in ER-negative breast cancer. Cancer science. 2012;103:913–920. doi: 10.1111/j.1349-7006.2012.02231.x. [DOI] [PMC free article] [PubMed] [Google Scholar]
- Moody SE, Schinzel AC, Singh S, Izzo F, Strickland MR, Luo L, Thomas SR, Boehm JS, Kim SY, Wang ZC, et al. PRKACA mediates resistance to HER2-targeted therapy in breast cancer cells and restores anti-apoptotic signaling. Oncogene. 2015;34:2061–2071. doi: 10.1038/onc.2014.153. [DOI] [PMC free article] [PubMed] [Google Scholar]
- Nazarian R, Shi H, Wang Q, Kong X, Koya RC, Lee H, Chen Z, Lee MK, Attar N, Sazegar H, et al. Melanomas acquire resistance to B-RAF(V600E) inhibition by RTK or N-RAS upregulation. Nature. 2010;468:973–977. doi: 10.1038/nature09626. [DOI] [PMC free article] [PubMed] [Google Scholar]
- Nishino M, Ramaiya NH, Hatabu H, Hodi FS. Monitoring immune-checkpoint blockade: response evaluation and biomarker development. Nature reviews Clinical oncology. 2017 doi: 10.1038/nrclinonc.2017.88. [DOI] [PMC free article] [PubMed] [Google Scholar]
- O’Leary B, Finn RS, Turner NC. Treating cancer with selective CDK4/6 inhibitors. Nature reviews Clinical oncology. 2016;13:417–430. doi: 10.1038/nrclinonc.2016.26. [DOI] [PubMed] [Google Scholar]
- Okada M, Nada S, Yamanashi Y, Yamamoto T, Nakagawa H. CSK: a protein-tyrosine kinase involved in regulation of src family kinases. The Journal of biological chemistry. 1991;266:24249–24252. [PubMed] [Google Scholar]
- Popovici V, Chen W, Gallas BG, Hatzis C, Shi W, Samuelson FW, Nikolsky Y, Tsyganova M, Ishkin A, Nikolskaya T, et al. Effect of training-sample size and classification difficulty on the accuracy of genomic predictors. Breast cancer research : BCR. 2010;12:R5. doi: 10.1186/bcr2468. [DOI] [PMC free article] [PubMed] [Google Scholar]
- Ritchie ME, Phipson B, Wu D, Hu Y, Law CW, Shi W, Smyth GK. limma powers differential expression analyses for RNA-sequencing and microarray studies. Nucleic acids research. 2015;43:e47. doi: 10.1093/nar/gkv007. [DOI] [PMC free article] [PubMed] [Google Scholar]
- Rooney MS, Shukla SA, Wu CJ, Getz G, Hacohen N. Molecular and genetic properties of tumors associated with local immune cytolytic activity. Cell. 2015;160:48–61. doi: 10.1016/j.cell.2014.12.033. [DOI] [PMC free article] [PubMed] [Google Scholar]
- Sameen S, Barbuti R, Milazzo P, Cerone A, Del Re M, Danesi R. Mathematical modeling of drug resistance due to KRAS mutation in colorectal cancer. Journal of theoretical biology. 2016;389:263–273. doi: 10.1016/j.jtbi.2015.10.019. [DOI] [PubMed] [Google Scholar]
- Scherf U, Ross DT, Waltham M, Smith LH, Lee JK, Tanabe L, Kohn KW, Reinhold WC, Myers TG, Andrews DT, et al. A gene expression database for the molecular pharmacology of cancer. Nature genetics. 2000;24:236–244. doi: 10.1038/73439. [DOI] [PubMed] [Google Scholar]
- Seashore-Ludlow B, Rees MG, Cheah JH, Cokol M, Price EV, Coletti ME, Jones V, Bodycombe NE, Soule CK, Gould J, et al. Harnessing Connectivity in a Large-Scale Small-Molecule Sensitivity Dataset. Cancer discovery. 2015;5:1210–1223. doi: 10.1158/2159-8290.CD-15-0235. [DOI] [PMC free article] [PubMed] [Google Scholar]
- Shalem O, Sanjana NE, Hartenian E, Shi X, Scott DA, Mikkelsen TS, Heckl D, Ebert BL, Root DE, Doench JG, et al. Genome-scale CRISPR-Cas9 knockout screening in human cells. Science. 2014;343:84–87. doi: 10.1126/science.1247005. [DOI] [PMC free article] [PubMed] [Google Scholar]
- Shibue T, Weinberg RA. EMT, CSCs, and drug resistance: the mechanistic link and clinical implications. Nature reviews Clinical oncology. 2017 doi: 10.1038/nrclinonc.2017.44. [DOI] [PMC free article] [PubMed] [Google Scholar]
- Shoemaker RH. The NCI60 human tumour cell line anticancer drug screen. Nature reviews Cancer. 2006;6:813–823. doi: 10.1038/nrc1951. [DOI] [PubMed] [Google Scholar]
- Smola AJ, Scholkopf B. A tutorial on support vector regression. Statistics and Computing. 2004;14:199–222. [Google Scholar]
- Sun C, Wang L, Huang S, Heynen GJ, Prahallad A, Robert C, Haanen J, Blank C, Wesseling J, Willems SM, et al. Reversible and adaptive resistance to BRAF(V600E) inhibition in melanoma. Nature. 2014;508:118–122. doi: 10.1038/nature13121. [DOI] [PubMed] [Google Scholar]
- Trifiletti DM, Sturz VN, Showalter TN, Lobo JM. Towards decision-making using individualized risk estimates for personalized medicine: A systematic review of genomic classifiers of solid tumors. PloS one. 2017;12:e0176388. doi: 10.1371/journal.pone.0176388. [DOI] [PMC free article] [PubMed] [Google Scholar]
- Tsao MS, Sakurada A, Cutz JC, Zhu CQ, Kamel-Reid S, Squire J, Lorimer I, Zhang T, Liu N, Daneshmand M, et al. Erlotinib in lung cancer - molecular and clinical predictors of outcome. The New England journal of medicine. 2005;353:133–144. doi: 10.1056/NEJMoa050736. [DOI] [PubMed] [Google Scholar]
- van ‘t Veer LJ, Dai H, van de Vijver MJ, He YD, Hart AA, Mao M, Peterse HL, van der Kooy K, Marton MJ, Witteveen AT, et al. Gene expression profiling predicts clinical outcome of breast cancer. Nature. 2002;415:530–536. doi: 10.1038/415530a. [DOI] [PubMed] [Google Scholar]
- Widakowich C, de Castro G, Jr, de Azambuja E, Dinh P, Awada A. Review: side effects of approved molecular targeted therapies in solid cancers. The oncologist. 2007;12:1443–1455. doi: 10.1634/theoncologist.12-12-1443. [DOI] [PubMed] [Google Scholar]
- Wilson C, Nicholes K, Bustos D, Lin E, Song Q, Stephan JP, Kirkpatrick DS, Settleman J. Overcoming EMT-associated resistance to anti-cancer drugs via Src/FAK pathway inhibition. Oncotarget. 2014;5:7328–7341. doi: 10.18632/oncotarget.2397. [DOI] [PMC free article] [PubMed] [Google Scholar]
- Zhang Z, Lee JC, Lin L, Olivas V, Au V, LaFramboise T, Abdel-Rahman M, Wang X, Levine AD, Rho JK, et al. Activation of the AXL kinase causes resistance to EGFR-targeted therapy in lung cancer. Nature genetics. 2012;44:852–860. doi: 10.1038/ng.2330. [DOI] [PMC free article] [PubMed] [Google Scholar]
- Zhao Y, Yang Y, Xu Y, Lu S, Jian H. AZD0530 sensitizes drug-resistant ALK-positive lung cancer cells by inhibiting SRC signaling. FEBS Open Bio. 2017;7:472–476. doi: 10.1002/2211-5463.12162. [DOI] [PMC free article] [PubMed] [Google Scholar]
Associated Data
This section collects any data citations, data availability statements, or supplementary materials included in this article.
Supplementary Materials
Movie S1. Methodology of CARE framework, Related to Figure 1.