

Abstract
Type 2 diabetes and hypertension overlap in the population. In many subjects, development of diabetes is characterized by a relatively rapid increase in plasma glucose values. Whether a similar phenomenon occurs during the development of hypertension is not known. We analyzed the pattern of blood pressure (BP) changes during the development of hypertension in patients with or without diabetes using data from the Mexico City Diabetes Study (MCDS, a population-based study of diabetes in Hispanic Whites) and in the Framingham Offspring Study (FOS, a community-based study in non-Hispanic Whites) over a 7-year follow-up. Diabetes at baseline was a significant predictor of incident hypertension (in FOS, OR=3.14 [95% CI=2.17–4.54]) independently of gender, age, BMI, and familial diabetes. Conversely, hypertension at baseline was an independent predictor of incident diabetes (in FOS, OR=3.33 [95% CI=2.50–4.44]). In >60% of the converters, progression from normotension to hypertension was characterized by a steep increase in BP values, averaging 20 mmHg for systolic BP within 3.5 years (in MCDS). In comparison with the non-converters group, hypertension and diabetes converters shared a metabolic syndrome phenotype (hyperinsulinemia, higher BMI, waist girth, BP, heart rate and pulse pressure, dyslipidemia). Overall, results were similar in the two ethnic groups. We conclude that (1) development of hypertension and diabetes track each other over time, (2) transition from normotension to hypertension is characterized by a sharp increase in BP values, and (3) insulin resistance is one common feature of both prediabetes and prehypertension, and an antecedent of progression to two respective disease states
Keywords: diabetes, hypertension, trajectories, co-prediction, tracking variables, insulin resistance
Introduction
Diabetes mellitus and hypertension are among the most common diseases and cardiovascular risk factors, respectively, worldwide, and their frequency increases with increasing age 1. Elevated blood pressure (BP) values are a common finding in patients with type 2 diabetes (T2D) and are thought to reflect, at least in part, the impact of the underlying insulin resistance on the vasculature and kidney 1. On the other hand, accumulating evidence suggests that disturbances in carbohydrate metabolism are more common in hypertensive individuals 2, 3, thereby indicating that the etiologic relationship between diabetes and hypertension is actually bidirectional.
The development of hypertension in diabetic individuals not only complicates treatment strategy and increases health care costs but also heightens the risk for macrovascular and microvascular complications considerably 2, 4. Although BP lowering is followed by a significant reduction in cardiovascular and microvascular morbidity and mortality 5, 6, a large proportion of diabetic subjects exhibit poorly controlled hypertension. This observation may reflect delayed recognition of the presence of hypertension, clinical inertia, poor adherence to the prescribed regimen, but also uncertainty regarding the treatment targets, as well as etiologic correlation.
A previous report from the Mexico City Diabetes Study (MCDS) showed that, in ~2/3 of patients with either normoglycemia or impaired glucose tolerance the development of overt diabetes is characterised by an abrupt (within approximately 3.5 years) increase in plasma glucose values by ~50 mg/dL 7. Whether a similar phenomenon is seen during the development of hypertension is not known. Therefore, the first aim of the present analysis was to determine the pattern of BP changes during the development of hypertension in patients with or without diabetes in MCDS. The second aim was to quantify the longitudinal association of T2D and hypertension in this population-based study over the follow-up period of 7 years. Within this scope, we tried to identify clinical and laboratory characteristics that may reflect an increased risk for the development of diabetes, hypertension or both. Since the population of MCDS included Hispanic individuals from low-income areas with a high risk for the development of diabetes, we explored the generizability of any results by asking the same questions in the non-Hispanic white population of the Framingham Offspring Study (FOS).
Materials and Methods
The authors declare that all supporting data are available within the article [and its online supplementary files].
Study populations
(a) The Mexico City Diabetes Study (MCDS) is a population-based cohort participating in a longitudinal survey of incident diabetes and cardiovascular risk factors. Low-income neighborhoods in Mexico City were identified, and a complete enumeration of these was carried out from November 1989 to October 1992. Among the 15,532 inhabitants of these neighborhoods, 2,280 men and women (aged 35 to 64 years) randomly selected from 6 low-income “colonias” examined between 1990–1992 and invited to return for 2 follow-up examinations, the first conducted between 1993–1995 and the second between 1997–1999. Of the 1,770 subjects participating in the first follow up (at 3,25 years), 1,753 returned for the second follow up (at 7 years). The clinical characteristics of the subjects not returning for the second follow up were essentially superimposable on those of the subjects who did (data not shown).
Examinations were standardised and included interviews, anthropometry, blood pressure (BP) measurements, a fasting blood draw, and a 75-g oral glucose tolerance test (OGTT). Trained interviewers obtained information on medical history, medication use, and smoking status.
The protocol was approved by the Ethics Committee of the Centro de Estudios en Diabetes, Centro de Investigacion en Salud Poblacional, Instituto Nacional de Salud Publica, Mexico City, and all subjects gave informed consent.
(b) The Framingham Offspring Study (FOS) is a community-based cohort including 3,754 men and women who attended the fifth clinic examination (1989–1992) of the Framingham Offspring Study. Participants were followed up from baseline to the sixth (1995–1998) and seventh (1998–2001) Offspring exams, for an average period of 7 years. We used the exam visit date when a new case of diabetes or hypertension were identified as the date of diagnosis; otherwise, follow-up was censored at last follow-up (exam 6 or 7) for participants remaining non-diabetic or non-hypertensive. The protocol was approved by the Ethics Committee of Boston University Medical Canter, and all subjects gave written informed consent.
In both cohorts, hypertension was defined as a systolic BP ≥140 mmHg or a diastolic BP ≥90 mmHg or current anti-hypertensive treatment. In both studies, subjects whose BP was <140/90 mmHg at baseline and both follow-up visits were classified as normotensives, those whose BP was <140/90 mmHg at the first visit who became hypertensive at the second or third visit were classified as converters. Type 2 diabetes was classified as a fasting plasma glucose concentration ≥126 mg/dL or a 2-hour plasma glucose concentration ≥200 mg/dL on a standard 75-g oral glucose tolerance test (OGTT). Subjects who gave a history of diabetes and who at the time of their clinical examination were taking oral antidiabetic agents were also considered to have type 2 diabetes regardless of their plasma glucose values. Insulin-taking diabetic subjects whose age of onset was ≥40 years or whose body mass index (BMI) was >30 kg/m2 were also considered to have type 2 diabetes. Subjects with type 1 diabetes were excluded. Subjects who developed diabetes at the first or second follow-up were denoted as converters. Subjects who tested normal on the OGTT on all three examinations were considered to be bona fide non-converters over the observation period.
Anthropometric measurements
Diabetes in at least one parent or sibling was coded as a positive family history of diabetes. Prior to examinations, all participants were asked to fast for at least 12 hours. Height, weight, waist and hip circumferences, and systolic and diastolic BP were measured; pulse pressure (PP) was calculated as the difference between systolic and diastolic BP, mean BP as the sum of diastolic BP and one third of PP.
Biochemical measurements
Blood samples were obtained in the fasting state and 2 hours after a standard 75-g oral glucose load. Serum samples were centrifuged, divided into aliquots, and stored at −70°C until assayed. Fasting concentrations of serum insulin, proinsulin, plasma glucose, total cholesterol, low-density-lipoprotein cholesterol, high-density-lipoprotein cholesterol, triglycerides, and plasma glucose and insulin concentrations 2 hours after an oral glucose load were determined as described elsewhere 7 at baseline and follow up.
Statistical analysis
The study design is that of a longitudinal cohort study of incident diabetes as a function of baseline hypertension, or of incident hypertension as a function of baseline diabetes, both with confounder covariate adjustment. We also assessed the rate of change of blood pressure as hypertension developed. Baseline data are presented as mean ± SD; median and [interquartile range] are reported for variables with non-normal distribution, which were log-transformed for use in statistical analyses. Categorical variables were compared by the χ2 test, continuous variables by ANOVA, with Bonferroni-Dunn testing of multiple post hoc comparisons. Logistic regression for incident events was carried out by defining response as a diagnosis of hypertension (or diabetes) at either of the two follow-up visits and non-response as no hypertension (or diabetes) at the last visit; results are expressed as the odds ratio (OR) with 95% confidence intervals (95% CI) as a function of baseline exposures. For each continuous variable in a multivariate model, OR was calculated for 1 SD of the population value of that variable. A p value ≤0.05 was considered statistically significant for the test of the hypothesis that diabetes predicts hypertension, or vice versa.
Results
Development of hypertension
At the 3 examinations, 16–46% of the study subjects were hypertensive; among them, the prevalence of diabetes (20–39%) was significantly higher than among normotensive subjects (p<0.0001 for all 3 datasets) (Table 1). Among subjects who were normotensive at baseline (n=1,876), 108 became hypertensive at 3.25 years; another 107 subjects who were normotensive at both baseline and 3.25 years were found to be hypertensive at 7 years, and 28 other subjects who were normotensive at baseline and missed examination 2 were hypertensive at examination 3. Thus, a total of 243 subjects converted to hypertension over the 7-year follow up, yielding a crude conversion rate of ~2% per year.
Table 1.
The Mexico City Diabetes Study (MCDS) and the Framingham Offspring Study (FOS)*
| Baseline | 1st follow up | 2nd follow up | ||||
|---|---|---|---|---|---|---|
|
| ||||||
| Patients | MCDS | FOS | MCDS | FOS | MCDS | FOS |
| n | 2280 | 3754 | 1770 | 3353 | 1753 | 3132 |
| NT | 1876 (82%) | 2461 (66%) | 1487 (84%) | 1947 (58%) | 1381 (79%) | 1678 (54%) |
| ND | 1656 (88%) | 2321 (94%) | 1198 (81%) | 1814 (93%) | 1102 (80%) | 1541 (92%) |
| D | 220 (12%) | 140 (6%) | 289 (19%) | 133 (7%) | 279 (20%) | 137 (8%) |
| HT | 404 (18%) | 1293 (34%) | 283 (16%) | 1406 (42%) | 372 (21%) | 1454 (46%) |
| ND | 310 (77%) | 1040 (80%) | 199 (70%) | 1406 (80%) | 227 (61%) | 1097 (75%) |
| D | 94 (23%) | 253 (20%) | 84 (30%) | 283 (20%) | 145 (39%) | 357 (25%) |
Number (percentage) of subjects examined at baseline, 1st follow up (3.25 years in MCDS and 4 years in FOS), and 2nd follow up (7 years in MCDS and 9 years in FOS) by blood pressure (NT=normotensive, HT=hypertensive) and glucose tolerance status (ND=non-diabetic, D=diabetic).
In comparison with subjects who were seen and found to be normotensive at all 3 examinations (non-converters), converters to hypertension were older, heavier with a more central fat distribution, and had higher systolic and diastolic BP values and higher pulse rate at baseline regardless of their time of conversion. Diabetes was more prevalent among either group of converters than in non-converters (Table 2). Moreover, among normotensive individuals diabetes at baseline was a significant predictor of incident hypertension (in FOS, OR = 3.14 [95% CI = 2.17–4.54]) independently of age, BMI and family history of diabetes (Figure 1). Of note, when the baseline mean blood pressure was included in the model the predictive value of diabetes was attenuated and became non-significant (in the MCDS OR = 1.44 [95% CI = 0.97–2.14].
Table 2.
Clinical phenotype of normotensive subjects converting to hypertension at the 1st or the 2nd follow-up and in subjects remaining normotensive at all 3 examinations (non-converters).
| 1st follow-up | 2nd follow up | Non-converters | |||||
|---|---|---|---|---|---|---|---|
|
| |||||||
| Dataset | MCDS | FOS | MCDS | FOS | MCDS | FOS | p° |
| n | 108 | 436 | 107 | 235 | 1154 | 1443 | |
| Sex (M/F) | 39/69 | 218/218° | 38/69 | 113/122 | 479/675 | 606/837 | <0.01 |
| Age (years) | 51 ± 8* | 61 ± 9* | 50 ± 8* | 62 ± 9* | 45 ± 8 | 58 ± 9 | <0.0001 |
| BMI (kg/m2) | 29.3 ± 4.4* | 28.3 ± 5.1* | 28.6 ± 4.4* | 28.7 ± 4.9* | 27.6 ± 4.2 | 26.9 ± 4.6 | <0.0001 |
| Waist (cm) | 100 ± 11* | 99 ± 13* | 98 ± 11* | 102 ± 13* | 95 ± 12 | 97 ± 13 | <0.0001 |
| Systolic BP (mmHg) | 124 ± 10* | 126 ± 5* | 119 ± 9* | 124 ± 7* | 111 ± 11 | 116 ± 11 | <0.0001 |
| Diastolic BP (mmHg) | 76 ± 7* | 80 ± 10* | 74 ± 9* | 79 ± 10* | 70 ± 8 | 71 ± 8 | <0.0001 |
| Pulse rate (bpm) | 76 ± 10* | - | 74 ± 9* | - | 72 ± 9 | - | <0.0001 |
| Diabetes (%) | 50° | 13° | 41° | 16° | 34 | 7 | <0.0001 |
ANOVA or χ2 for the 3 groups for each dataset
p≤0.05 vs non-converters by Bonferroni-Dunn test for each dataset
Figure 1.
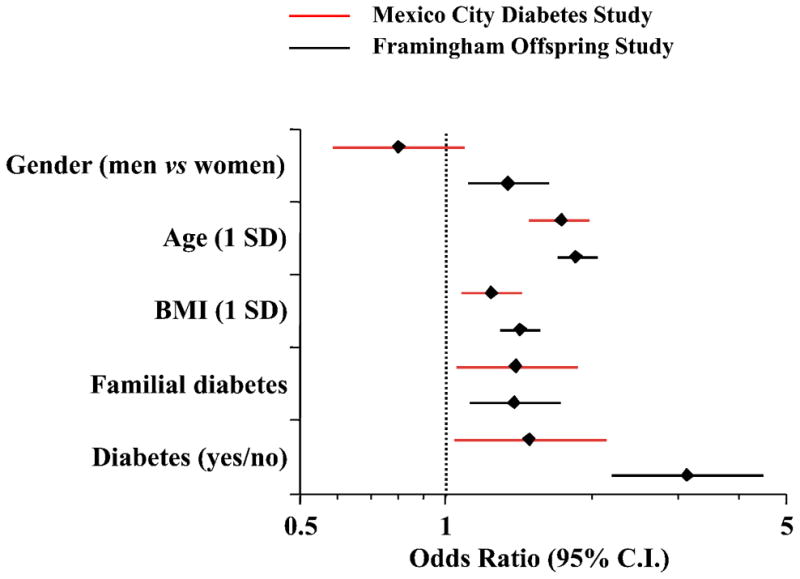
Multivariate logistic analysis of incident hypertension in normotensive individuals in the Mexico City Diabetes Study (MCDS) and Framingham Offspring Study (FOS). Plots are odds ratios and 95% confidence intervals (calculated for 1 SD of continuous predictor variable).
All subject groups exhibited weight gain during the observation period independently of the conversion status or the time of conversion. In MCDS, the increase in BMI was a significant independent predictor of incident hypertension (the HR for 1SD change in BMI was 1.31 [95% CI 1.12–1.55]; in the same model the corresponding HR for the presence of diabetes at baseline was 1.79 [95% CI 1.14–2.77]). Upon conversion, both systolic and diastolic BP values rose markedly and similarly in both groups of hypertension converters (Figure 2). Using only the data of MCDS subjects not receiving antihypertensive treatment, the rise in systolic BP was 19 [14] mmHg in subjects converting at examination 2 (n=65) and 19 [17] mmHg in those (n=60) converting at examination 3. Values higher than the 90th percentile of the changes in systolic BP observed in non-converters were found in 70% of the subjects converting at examination 2 and in 58% of those converting at examination 3. Similar changes were observed in the converters of FOS. The presence of diabetes did not consistently affect the pattern of blood pressure change in patients developing hypertension during the follow-up. Thus, in MCDS patients not receiving antihypertensive medications the increase in SBP in those converting to hypertension at examination 2 was 18 mmHg if nondiabetic and 20 mmHg if diabetic. On the other hand, the corresponding changes in SBP for patients converting at examination 3 were 27 mmHg in diabetic vs 17 mmHg in nondiabetic patients (p<0.05).
Figure 2.
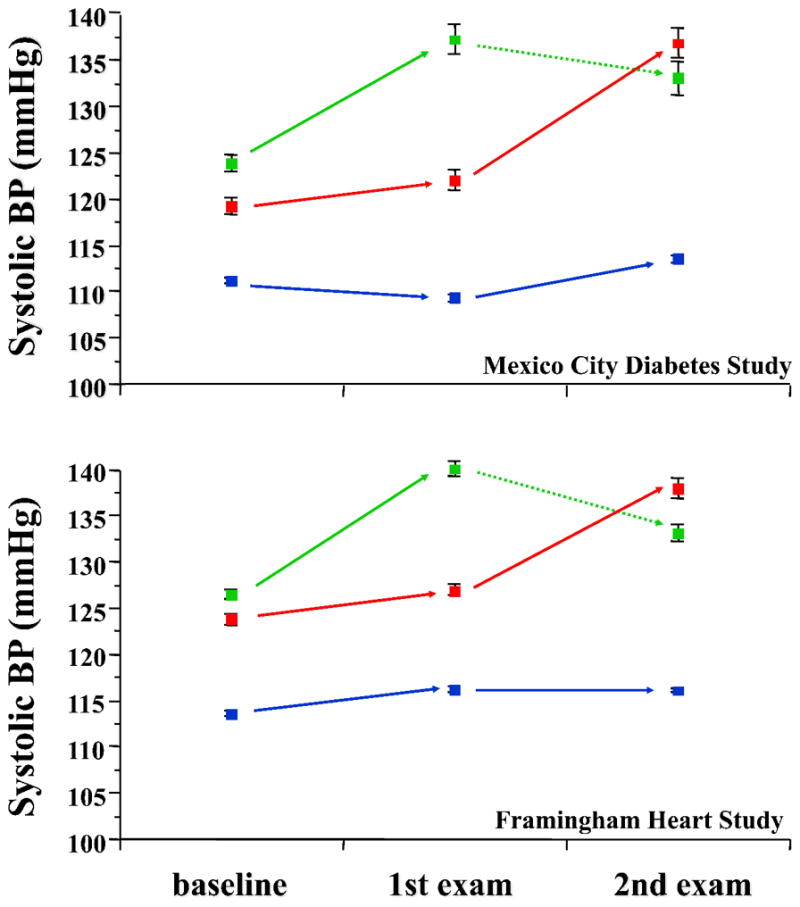
Systolic and diastolic blood pressure values in normotensive subjects who remained normotensive at both follow-up examinations (blue lines), became hypertensive at the first examination (green lines) or at the second examination (red lines). Plots are mean±SD. The dotted green lines indicate that the apparent decline in BP values after diagnosis are likely due to anthypertensive treatment.
Development of diabetes
Among subjects who were non-diabetic at baseline (n=1,966), 89 had developed diabetes by 3.25 years; another 71 subjects who were non-diabetic at both baseline and 3.25 years were found to be diabetic at 7 years, and 10 other subjects who were non-diabetic at baseline and missed examination 2 were diabetic at examination 3. Thus, a total of 170 subjects converted to diabetes over the 7-year follow up, yielding a crude conversion rate of 1.2% per year. Among nondiabetic individuals, hypertension at baseline was more prevalent among diabetes converters than non-converters (25% vs 15%, p=0.001), and was a significant predictor of incident diabetes (in FOS, OR = 3.33 [95% CI = 2.50–4.44]) independently of gender, age, BMI, and familial diabetes (Figure 3). Again, the increase in BMI during the observation period was a significant predictor of incident diabetes (in MCDS, the HR for 1SD change in BMI was 1.36 [95% CI 1.16–1.60]; the corresponding HR for presence of hypertension at baseline in the same model was 1.80 [95% CI 1.03–3.04]). Among the 1,656 participants who were normotensive and non-diabetic at baseline, 104 had converted to diabetes at 7 years, 165 to hypertension and 24 to both diabetes and hypertension. In comparison with the non-converters group, hypertension and diabetes converters shared most phenotypic traits, namely, higher BMI, waist girth, BP, heart rate and pulse pressure values, serum triglycerides and plasma insulin concentrations (both fasting and postload) (Table 3). In addition, in MCDS age was higher in hypertension converters but not in diabetes converters (in FOS age was higher in diabetes converters too), whilst familial diabetes, fasting and 2-hour plasma glucose and serum proinsulin concentrations were higher in diabetes converters but not in hypertension converters. All these anthropometric and metabolic differences from the control group were accentuated in the double converters (Table S1). In multivariate analysis, age, BMI, fasting plasma glucose, mean BP and 2-hour plasma insulin concentrations were independent risk factors for the development of either hypertension or type 2 diabetes (Figure 4).
Figure 3.
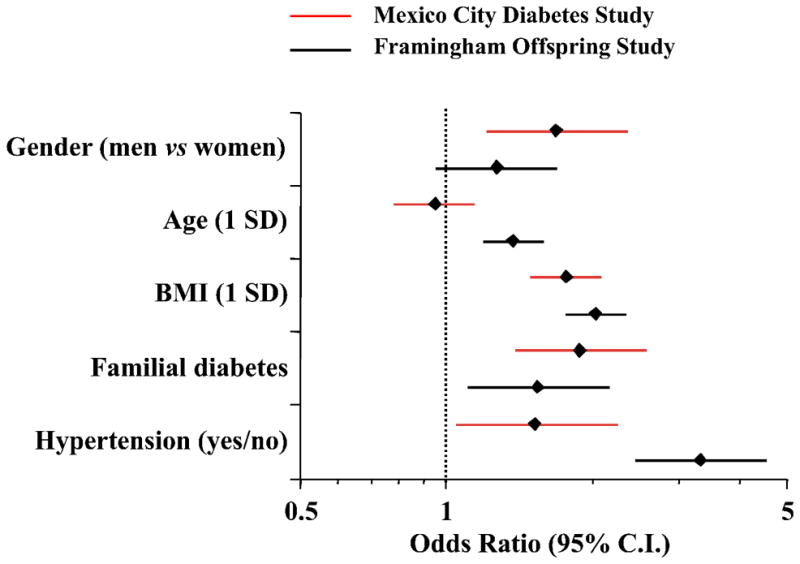
Multivariate logistic analysis of incident diabetes in nondiabetic individuals in the Mexico City Diabetes Study (MCDS) and Framingham Offspring Study (FOS). Plots are odds ratios and 95% confidence intervals (calculated for 1 SD of continuous predictor variable; data are adjusted for smoking categorized as ever or not).
Figure 4.
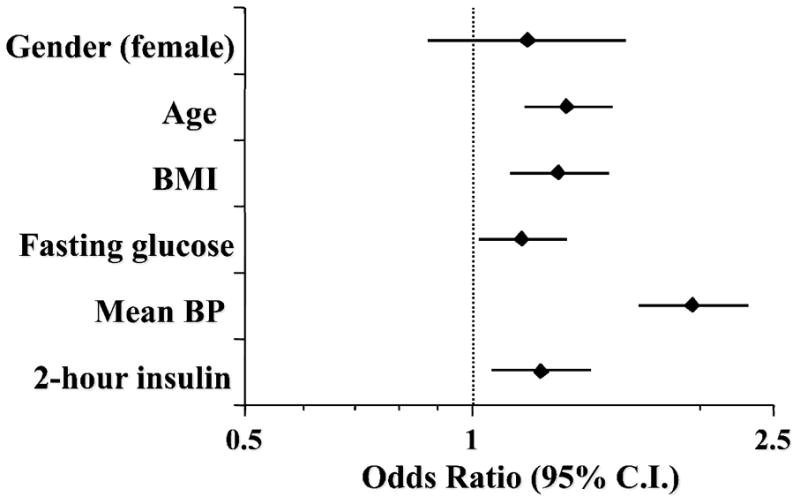
Multivariate logistic analysis of incident hypertension or diabetes in the Mexico City Diabetes Study. Plots are odds ratios and 95% confidence intervals (calculated for 1 SD of continuous predictor variable).
Discussion
The first main finding of the present study is that not only does the presence of hypertension predict future diabetes, in agreement with earlier epidemiological observations 2, 3, 8, 9, but also that the incidence of hypertension increases significantly in the presence of diabetes. Over the 7 years of follow up, BP behaved as a tracking variable as individuals who converted to hypertension (at the first or second follow-up visit) had increased baseline BP values compared to non-converters, though still within the normal range 10. Indeed, baseline BP was the strongest predictor of incident hypertension, and its inclusion in the statistical model significantly attenuated the predictive value of diabetes. More strikingly, hypertension and diabetes tracked each other consistently (Figures 1&3), and people at high risk for the development of either hypertension or diabetes share common metabolic abnormalities, i.e., abdominal obesity, hyperinsulinemia, hypertriglyceridemia (even more prominent in those destined to develop both abnormalities). Thus, the general population contains a pool of individuals with the phenotype of the metabolic (or insulin resistance) syndrome from which new hypertension or diabetes (or both) emerge over time. Importantly, weight gain may be one factor that contributes to the development of both hypertension and diabetes. Parenthetically, the increased incidence of hypertension in patients with diabetes may also reflect the closer surveillance of these individuals (i.e., a small detection bias). The second, and possibly the most important, finding of this study is that the progression from normotension to hypertension in individuals destined to become hypertensive is marked by a steep increase in BP values averaging 20 mmHg for systolic BP within 3.5 years. In more than 60% of the converters the increase in BP values during the period that preceded conversion was greater than the 90th percentile of the changes in systolic BP observed in non-converters. This biphasic BP pattern is similar to that previously described for blood glucose values in MCDS individuals developing diabetes 7. Finally, both the co-prediction of hypertension and diabetes and this biphasic pattern of progression are not unique to Hispanic individuals since essentially the same findings were observed in the non-Hispanic white population of FOS.
One potential factor responsible for the covariance of diabetes and hypertension is insulin resistance 1. Of note, in a subcohort of FOS with a shorter follow up an inverse association between incident hypertension (or BP progression) and a proxy of insulin resistance was seen principally in younger people 10. Here, however, both fasting plasma insulin (a typical proxy for insulin resistance in epidemiological studies) and plasma insulin concentrations 2 hours after glucose ingestion were consistently higher at baseline in both hypertension and diabetes converters. Furthermore, baseline insulin levels co-predicted both hypertension and diabetes after controlling for age and BMI and also for baseline BP and plasma glucose values (Figure 4). This pattern of results lends support to the notion that insulin resistance is one common feature of both prediabetes and prehypertension, and one antecedent of progression to the two respective disease states.
Apart from the detrimental effects that disturbed insulin signaling exerts on carbohydrate metabolism, the hyperinsulinemia that characterizes insulin resistance states leads to vascular smooth muscle cells proliferation and increased vascular stiffness, which predispose to the development of hypertension 11. Additionally, insulin may directly or indirectly impair vasodilation and increase oxidative stress and the inflammatory process in the vascular wall 12, 13. The sum of these effects is the impaired autoregulation of vascular tone, increased vascular resistance, and BP elevation. Finally, the antinatriuretic properties of insulin increase renal retention of sodium and water leading to volume overload, thereby predisposing to the development of hypertension 14.
A novel finding from both study cohorts is that, in individuals that ultimately develop T2D, hypertension or both, the time trajectory of plasma glucose 7 and BP values is not a progressive slow increase but – in the majority of cases – a steep elevation several-fold larger compared to changes observed in non-converters (or, in the case of patients converting at the 2nd follow up, compared to the changes observed in the same patients between baseline and the 1st follow-up visit). Although the pathophysiological basis of this relatively acute decompensation remains indeterminate, it could be hypothesized that it may be related to sympathetic excitation. The sequence of events that lead to activation of the sympathetic nervous system is unknown. However, in healthy volunteers, insulin dose-dependently stimulates norepinephrine release, particularly in skeletal muscle, and enhances sympathetic neuronal discharge 15. In subjects with uncomplicated obesity monitored for 24 hours, there is episodic sympathetic dominance in phase with postprandial hyperinsulinemia, which abates following weight loss16. The autonomic contribution to BP is greater in obesity, and ganglionic blockade of the autonomic nervous system results in BP decrease that is more pronounced in obese individuals 17. Obese subjects with hypertension display increased sympathetic nerve activity, an abnormality that is partially corrected after diet-induced weight loss 18. Leptin, an adipokine that has been found to circulate in increased concentrations in obese and insulin resistant subjects, can act centrally to activate the sympathetic nervous system 19; not all studies have confirmed this hypothesis 20. In addition, experimental models suggest that leptin may also contribute to the pathogenesis of hypertension via aldosterone-dependent mechanisms 21. In line with these suggestions, in our population, BMI values at baseline and weight gain during the observation period were significant predictors of both incident hypertension and diabetes whereas heart rate and pulse pressure, both raw indices of sympathetic nervous system activity, were found to be elevated in patients that converted to hypertension. Finally, obese individuals with or without diabetes have been shown to have reduced concentrations of circulating natriuretic peptides. Since these molecules favorably affect intravascular volume status and vascular tone, this mechanism may be involved in the pathogenesis of hypertension in patients with diabetes 22.
Our findings may have implications in the every-day care of patients with diabetes. Thus, diabetic patients with BP values near the upper limit of normal should be monitored for the development of hypertension, especially if they have a positive family history of hypertension and the phenotypic features of the metabolic syndrome. Since development of hypertension in patients with diabetes is marked by a significant increase in macrovascular and microvascular risk 2, 23, efforts should be made to delay or ideally prevent the increase in BP. Obviously, the follow-up scheme of both MCDS and FOS does not reflect everyday clinical practice, as is generally true of observational population-based studies. Under ideal conditions, patients with diabetes or hypertension are seen two or three times per year. However, the time pattern of BP progression we describe here may still emerge from more frequent follow-up visits. On the other hand, in an era of continuously increasing pressures on health care systems, understanding the factors that predispose to, or precipitate, the development of an outcome should increase clinicians’ awareness and may facilitate the timely diagnosis of conditions that might otherwise go unnoticed.
Apart from life style modification several classes of antidiabetic drugs such as SGLT2 inhibitors and GLP-1 receptor agonists have been shown to lower BP 24, 25 (although the data for liraglutide is less convincing 26) and reduce cardiovascular events in secondary prevention 25, 27. Thus, use of these drugs might be prioritized in diabetic patients at high risk for the development of hypertension although the clinical value of this strategy in terms of hard endpoint reduction has been unequivocally proven only in individuals with established cardiovascular disease.
Perspectives
The development of hypertension and diabetes predict each other over time. The transition from normotension to hypertension is characterized by a sharp increase in BP values. Insulin resistance is one common feature of both prediabetes and prehypertension, and an antecedent of progression to two respective disease states, especially in individuals who gain weight over time. Since development of hypertension in patients with diabetes is marked by a significant increase in macrovascular and microvascular risk, efforts should be made to delay or ideally prevent the increase in BP. In this context, the prioritization of antidiabetic drugs that reduce blood pressure (such as SGLT2 inhibitors or GLP-1 receptor agonists) in patients with diabetes at high risk for the development of hypertension may be of clinical value.
Supplementary Material
Novelty and Significance.
What Is New
diabetes and hypertension co-predict each other
the progression to hypertension is marked by a steep increase in blood pressure values
What Is Relevant
diabetic patients with blood pressure values near the upper limit of normal should be monitored for the development of hypertension
antidiabetic drugs that reduce blood pressure should be prioritized in diabetic patients at high risk for the development of hypertension
Summary.
The development of hypertension and diabetes predict each other over time. The transition from normotension to hypertension is characterized by a sharp increase in BP values. Insulin resistance is one common feature of both prediabetes and prehypertension, and an antecedent of progression to two respective disease states.
Acknowledgments
Sources of Funding
J Meigs is supported in part by NIH NIDDK K24 DK080140; partial support was provided by funds from an EMIF grant (IMI JU GA 115372-2). The Framingham Offspring Study is supported by NIH NHLBI Framingham Heart Study contracts N01-HC-25195 and HHSN268201500001I.
The MCDS has been supported by the following grants: RO1HL 24799 from the National Heart, Lung, and Blood Institute; Consejo Nacional de Ciencia y Tecnología 2092, M9303, F677-M9407, 251M, 2005-C01-14502, and SALUD 2010-2151165; and Consejo Nacional de Ciencia y Tecnología (CONACyT) [Fondo de Cooperación Internacional en Ciencia y Tecnología (FONCICYT)] C0012-2014-01-247974.
Footnotes
Disclosures
None of the authors has any conflict of interest to report.
References
- 1.Ferrannini E, Cushman WC. Diabetes and hypertension: The bad companions. Lancet. 2012;380:601–610. doi: 10.1016/S0140-6736(12)60987-8. [DOI] [PubMed] [Google Scholar]
- 2.Perreault L, Pan Q, Aroda VR, Barrett-Connor E, Dabelea D, Dagogo-Jack S, Hamman RF, Kahn SE, Mather KJ, Knowler WC Diabetes Prevention Program Research Group. Exploring residual risk for diabetes and microvascular disease in the Diabetes Prevention Program Outcomes Study (DPPOS) Diabet Med. 2017;34:1747–1755. doi: 10.1111/dme.13453. [DOI] [PMC free article] [PubMed] [Google Scholar]
- 3.Wei GS, Coady SA, Goff DC, Jr, Brancati FL, Levy D, Selvin E, Vasan RS, Fox CS. Blood pressure and the risk of developing diabetes in african americans and whites: ARIC, CARDIA, and the Framingham Heart Study. Diabetes Care. 2011;34:873–879. doi: 10.2337/dc10-1786. [DOI] [PMC free article] [PubMed] [Google Scholar]
- 4.Aroda VR, Knowler WC, Crandall JP, Perreault L, Edelstein SL, Jeffries SL, Molitch ME, Pi-Sunyer X, Darwin C, Heckman-Stoddard BM, Temprosa M, Kahn SE, Nathan DM Diabetes Prevention Program Research Group. Metformin for diabetes prevention: Insights gained from the diabetes prevention program/diabetes prevention program outcomes study. Diabetologia. 2017;60:1601–1611. doi: 10.1007/s00125-017-4361-9. [DOI] [PMC free article] [PubMed] [Google Scholar]
- 5.Hansson L, Zanchetti A, Carruthers SG, Dahlof B, Elmfeldt D, Julius S, Menard J, Rahn KH, Wedel H, Westerling S. Effects of intensive blood-pressure lowering and low-dose aspirin in patients with hypertension: Principal results of the Hypertension Optimal Treatment (HOT) randomised trial. HOT study group. Lancet. 1998;351:1755–1762. doi: 10.1016/s0140-6736(98)04311-6. [DOI] [PubMed] [Google Scholar]
- 6.Zoungas S, de Galan BE, Ninomiya T, et al. Combined effects of routine blood pressure lowering and intensive glucose control on macrovascular and microvascular outcomes in patients with type 2 diabetes: New results from the advance trial. Diabetes Care. 2009;32:2068–2074. doi: 10.2337/dc09-0959. [DOI] [PMC free article] [PubMed] [Google Scholar]
- 7.Ferrannini E, Nannipieri M, Williams K, Gonzales C, Haffner SM, Stern MP. Mode of onset of type 2 diabetes from normal or impaired glucose tolerance. Diabetes. 2004;53:160–165. doi: 10.2337/diabetes.53.1.160. [DOI] [PubMed] [Google Scholar]
- 8.Stamler J, Stamler R, Rhomberg P, Dyer A, Berkson DM, Reedus W, Wannamaker J. Multivariate analysis of the relationship of six variables to blood pressure: Findings from Chicago Community Surveys, 1965–1971. J Chronic Dis. 1975;28:499–525. doi: 10.1016/0021-9681(75)90059-4. [DOI] [PubMed] [Google Scholar]
- 9.Emdin CA, Anderson SG, Woodward M, Rahimi K. Usual blood pressure and risk of new-onset diabetes: Evidence from 4.1 million adults and a meta-analysis of prospective studies. J Am Coll Cardiol. 2015;66:1552–1562. doi: 10.1016/j.jacc.2015.07.059. [DOI] [PMC free article] [PubMed] [Google Scholar]
- 10.Arnlov J, Pencina MJ, Nam BH, Meigs JB, Fox CS, Levy D, D’Agostino RB, Vasan RS. Relations of insulin sensitivity to longitudinal blood pressure tracking: Variations with baseline age, body mass index, and blood pressure. Circulation. 2005;112:1719–1727. doi: 10.1161/CIRCULATIONAHA.105.535039. [DOI] [PubMed] [Google Scholar]
- 11.McEniery CM, Wilkinson IB, Johansen NB, Witte DR, Singh-Manoux A, Kivimaki M, Tabak AG, Brunner EJ, Shipley MJ. Nondiabetic glucometabolic status and progression of aortic stiffness: The Whitehall II study. Diabetes Care. 2017;40:599–606. doi: 10.2337/dc16-1773. [DOI] [PMC free article] [PubMed] [Google Scholar]
- 12.Potenza MA, Addabbo F, Montagnani M. Vascular actions of insulin with implications for endothelial dysfunction. Am J Physiol Endocrinol Metab. 2009;297:E568–577. doi: 10.1152/ajpendo.00297.2009. [DOI] [PubMed] [Google Scholar]
- 13.Anfossi G, Russo I, Doronzo G, Trovati M. Contribution of insulin resistance to vascular dysfunction. Arch Physiol Biochem. 2009;115:199–217. doi: 10.1080/13813450903136791. [DOI] [PubMed] [Google Scholar]
- 14.Nakamura M, Satoh N, Suzuki M, Kume H, Homma Y, Seki G, Horita S. Stimulatory effect of insulin on renal proximal tubule sodium transport is preserved in type 2 diabetes with nephropathy. Biochem Biophys Res Commun. 2015;461:154–158. doi: 10.1016/j.bbrc.2015.04.005. [DOI] [PubMed] [Google Scholar]
- 15.Lembo G, Napoli R, Capaldo B, Rendina V, Iaccarino G, Volpe M, Trimarco B, Sacca L. Abnormal sympathetic overactivity evoked by insulin in the skeletal muscle of patients with essential hypertension. J Clin Invest. 1992;90:24–29. doi: 10.1172/JCI115842. [DOI] [PMC free article] [PubMed] [Google Scholar]
- 16.Emdin M, Gastaldelli A, Muscelli E, Macerata A, Natali A, Camastra S, Ferrannini E. Hyperinsulinemia and autonomic nervous system dysfunction in obesity: Effects of weight loss. Circulation. 2001;103:513–519. doi: 10.1161/01.cir.103.4.513. [DOI] [PubMed] [Google Scholar]
- 17.Shibao C, Gamboa A, Diedrich A, Ertl AC, Chen KY, Byrne DW, Farley G, Paranjape SY, Davis SN, Biaggioni I. Autonomic contribution to blood pressure and metabolism in obesity. Hypertension. 2007;49:27–33. doi: 10.1161/01.HYP.0000251679.87348.05. [DOI] [PubMed] [Google Scholar]
- 18.Lambert E, Straznicky N, Eikelis N, Esler M, Dawood T, Masuo K, Schlaich M, Lambert G. Gender differences in sympathetic nervous activity: Influence of body mass and blood pressure. J Hypertens. 2007;25:1411–1419. doi: 10.1097/HJH.0b013e3281053af4. [DOI] [PubMed] [Google Scholar]
- 19.Han C, Wu W, Ale A, Kim MS, Cai D. Central leptin and tumor necrosis factor-alpha (TNFalpha) in diurnal control of blood pressure and hypertension. J Biol Chem. 2016;291:15131–15142. doi: 10.1074/jbc.M116.730408. [DOI] [PMC free article] [PubMed] [Google Scholar]
- 20.Brown RJ, Meehan CA, Gorden P. Leptin does not mediate hypertension associated with human obesity. Cell. 2015;162:465–466. doi: 10.1016/j.cell.2015.07.007. [DOI] [PMC free article] [PubMed] [Google Scholar]
- 21.Huby AC, Otvos L, Jr, Belin de Chantemele EJ. Leptin induces hypertension and endothelial dysfunction via aldosterone-dependent mechanisms in obese female mice. Hypertension. 2016;67:1020–1028. doi: 10.1161/HYPERTENSIONAHA.115.06642. [DOI] [PMC free article] [PubMed] [Google Scholar]
- 22.Zois NE, Bartels ED, Hunter I, Kousholt BS, Olsen LH, Goetze JP. Natriuretic peptides in cardiometabolic regulation and disease. Nat Rev Cardiol. 2014;11:403–412. doi: 10.1038/nrcardio.2014.64. [DOI] [PubMed] [Google Scholar]
- 23.Navar AM, Gallup DS, Lokhnygina Y, Green JB, McGuire DK, Armstrong PW, Buse JB, Engel SS, Lachin JM, Standl E, Van de Werf F, Holman RR, Peterson ED TECOS Study Group. Hypertension control in adults with diabetes mellitus and recurrent cardiovascular events: Global results from the Trial Evaluating Cardiovascular Outcomes with Sitagliptin. Hypertension. 2017;70:907–914. doi: 10.1161/HYPERTENSIONAHA.117.09482. [DOI] [PMC free article] [PubMed] [Google Scholar]
- 24.Chilton R, Tikkanen I, Hehnke U, Woerle HJ, Johansen OE. Impact of empagliflozin on blood pressure in dipper and non-dipper patients with type 2 diabetes mellitus and hypertension. Diabetes Obes Metab. 2017;19:1620–1624. doi: 10.1111/dom.12962. [DOI] [PubMed] [Google Scholar]
- 25.Marso SP, Daniels GH, Brown-Frandsen K, et al. Liraglutide and cardiovascular outcomes in type 2 diabetes. N Engl J Med. 2016;375:311–322. doi: 10.1056/NEJMoa1603827. [DOI] [PMC free article] [PubMed] [Google Scholar]
- 26.Kumarathurai P, Anholm C, Fabricius-Bjerre A, Nielsen OW, Kristiansen O, Madsbad S, Haugaard SB, Sajadieh A. Effects of the glucagon-like peptide-1 receptor agonist liraglutide on 24-h ambulatory blood pressure in patients with type 2 diabetes and stable coronary artery disease: A randomized, double-blind, placebo-controlled, crossover study. J Hypertens. 2017;35:1070–1078. doi: 10.1097/HJH.0000000000001275. [DOI] [PubMed] [Google Scholar]
- 27.Zinman B, Wanner C, Lachin JM, Fitchett D, Bluhmki E, Hantel S, Mattheus M, Devins T, Johansen OE, Woerle HJ, Broedl UC, Inzucchi SE EMPA-REG OUTCOME Investigators. Empagliflozin, cardiovascular outcomes, and mortality in type 2 diabetes. N Engl J Med. 2015;373:2117–2128. doi: 10.1056/NEJMoa1504720. [DOI] [PubMed] [Google Scholar]
Associated Data
This section collects any data citations, data availability statements, or supplementary materials included in this article.