

Abstract
Background
Preserved skeletal muscle is essential for the maintenance of healthy bone. Loss of bone mineral density (BMD) and muscle strength, considered a predictor of BMD, have been demonstrated in patients with cirrhosis, but they are poorly studied in chronic hepatitis C (CHC) without cirrhosis. Thus, we aimed to evaluate the prevalence of low BMD and its association with body composition, muscle strength, and nutritional status in CHC.
Methods
One hundred and four subjects [mean age, 50.5 ± 11.3 years; 75.0% males; 67.3% non‐cirrhotic; and 32.7% with compensated cirrhosis] with CHC, prospectively, underwent scanning of the lean tissue, appendicular skeletal muscle mass (ASM), fat mass, lumbar spine, hip, femoral neck, and whole‐body BMD by dual‐energy X‐ray absorptiometry. Muscle strength was assessed by dynamometry. Sarcopenia was defined by the presence of both low, ASM/height2 (ASMI) and low muscle strength according to the European Working Group on Sarcopenia in Older People criteria. The cut‐off points for low ASMI and low muscle strength, for women and men, were < 5.45 and < 7.26 kg/m2 and < 20 and < 30 kg, respectively. According to the adopted World Health Organization criteria in men aged > 50 years, the T‐score of osteopenia is between −1.0 and −2.49 standard deviation (SD) below the young average value and of osteoporosis is ≥−2.5 SD below the young normal mean for men, and the Z‐score of low bone mass is ≤−2.0 SD below the expected range in men aged < 50 years and women in the menacme. Nutritional status evaluation was based on the Controlling Nutritional Status score.
Results
Low BMD, low muscle strength, pre‐sarcopenia, sarcopenia, and sarcopenic obesity were observed in 34.6% (36/104), 27.9% (29/104), 14.4% (15/104), 8.7% (9/104), and 3.8% (4/104) of the patients, respectively. ASMI was an independent predictor of BMD (P < 0.001). Sarcopenia was independently associated with bone mineral content (P = 0.02) and malnutrition (P = 0.01). In 88.9% of the sarcopenic patients and in all with sarcopenic obesity, BMI was normal. The mid‐arm muscle circumference was positively correlated with ASMI (r = 0.88; P < 0.001).
Conclusions
This is the first study to demonstrate that ASM is an independent predictor of BMD in CHC. Mid‐arm muscle circumference coupled with handgrip strength testing should be incorporated into routine clinical practice to detect low muscle mass, which may be underdiagnosed when only BMI is used. These findings may influence clinical decision‐making and contribute to the development of effective strategies to screen the musculoskeletal abnormalities in CHC patients, independently of the stage of the liver disease.
Keywords: Chronic hepatitis C, Bone mineral density, Appendicular skeletal muscle mass, Sarcopenia
Introduction
An estimated 170 to 200 million people worldwide are infected with hepatitis C virus (HCV) that causes both acute and chronic infection.1 Approximately 55.0% to 85.0% of infected individuals will develop chronic hepatitis C (CHC).1 Of those chronically infected with HCV, the risk of hepatic cirrhosis ranges from 15.0% to 30.0% within 20 years.1 Although rapid changes in the management of those patients are expected with direct‐acting antivirals, these innovations have a high cost and represent an obstacle for many health systems around the world.2 Thus, viral hepatitis remains a global health problem that affects millions of people.3
Hepatitis C virus is associated with several extrahepatic manifestations and should be considered as a systemic disease, which may increase the non‐hepatic‐related morbidity and mortality.4 Extrahepatic manifestations include mixed cryoglobulinemia, lymphoproliferative disorders, renal disease, insulin resistance, type 2 diabetes, sicca syndrome, rheumatoid arthritis‐like polyarthritis, and autoantibody production.4 In addition, HCV has been implicated in metabolic bone impairment; osteopenia was observed in over 50.0% of subjects with CHC.5
Bone loss has been observed in patients with liver cirrhosis, which may be because of hypogonadism,6 vitamin D deficiency,7 and low levels of insulin‐like growth factor.8 However, the pathogenesis of bone disease in patients with CHC, especially prior to the onset of cirrhosis, is still unclear.5 Chronic inflammation, inadequate diet and nutrition, and weight and muscle loss might be potential factors involved in low bone mineral density in subjects chronically infected by HCV. Among the putative factors, it should be highlighted the role of muscle mass and muscle strength in preserving adequate bone strength and density.9 Altogether, muscle mass and muscle strength stimulate the osteogenesis by bone–muscle interactions.10 Furthermore, muscle mass is considered an independent predictor of bone mineral density in both healthy11, 12 and diseased populations.13, 14
Muscle depletion has been found in over 40.0% of the patients with advanced chronic liver disease15 and markedly impact on survival of cirrhotic subjects.16 A recent study evaluating individuals chronically infected by HCV or hepatitis B virus, sarcopenia, defined by a combination of low muscle mass and reduced muscle strength or impaired physical performance,17 was identified in 7.1%, 11.8%, and 21.9% of non‐cirrhotic, compensated cirrhotic (Child–Turcotte–Pugh A), and decompensated cirrhotic (Child–Turcotte–Pugh B/C) patients, respectively.18
Despite the risks and consequences associated with low muscle mass and low BMD in subjects chronically infected with HCV, there is a paucity of data evaluating the body composition, particularly, the cross‐talk between muscle and bone before the development of cirrhosis. Thus, the aim of this study was to evaluate the association between bone density and the components of body composition, lean and fat masses, and muscle strength in non‐cirrhotic and compensated cirrhotic CHC outpatients. Furthermore, we investigated the association between demographic, clinical, lifestyle, nutritional, biochemical, and virological variables and bone mineral density and sarcopenia. We hypothesized that, as in healthy populations and in subjects with chronic inflammatory diseases, the skeletal muscle might also be a predictor of bone mineral density in patients with CHC, even before the onset of liver cirrhosis.
Patients and methods
Study population and design
This is a cross‐sectional study conducted at the Viral Hepatitis Outpatient Clinics, University Hospital, Belo Horizonte, Brazil, from August 2013 to July 2016. One hundred and ten consecutive adults outpatients who agreed to participate signed the informed consent form and were prospectively selected to participate in the study. The diagnosis of hepatitis C was performed by the presence of serum antibodies to HCV and confirmed by the HCV–RNA test.
All patients with CHC were screened for other hepatic diseases. The exclusion criteria were the refusal to participate in the study (n = 6), pregnancy, breastfeeding, women in post‐menopausal period, hepatic encephalopathy, hepatitis B virus/HCV or HCV/HIV co‐infection, current anti‐viral treatment, use of corticosteroids, use of exogenous hormones including growth hormone and hormonal contraceptives in the past 12 months, use of medication to treat osteoporosis, and the presence of advanced disease such as chronic kidney disease, heart failure, chronic pulmonary disease, and neoplasia. Patients with decompensated liver cirrhosis or hepatocellular carcinoma were also excluded.
The diagnosis of cirrhosis was based on standard clinical, biochemical, radiological, and histological parameters.19 Compensated cirrhosis was defined by the absence of variceal bleeding, ascites, and oedema on physical examination, jaundice, or symptomatic encephalopathy and decompensated cirrhosis by the presence of any of these complications.20 The Child–Turcotte–Pugh21 and aspartate amino transferase to platelet ratio index scores22 were calculated for each participant based on medical data. The clinical and biochemical data were collected from medical records.
All the included patients were from a similar socioeconomic level, as assessed by a previously validated questionnaire,23 which included income and educational level, with similar cultural habits, and all were natives of Minas Gerais state with the same ethnic background: 33% of Portuguese ancestry, 33% of Amerindian ancestry, and 33% of African ancestry homogeneously present in each patient, irrespective of their phenotype.24
Laboratory parameters
Blood samples were obtained from each patient after 12–14 h overnight fast for HCV diagnosis, biochemical, and haematological evaluation. Alanine aminotransferase, aspartate aminotransferase, gamma‐glutamyltranspeptidase, alkaline phosphatase, albumin, total bilirubin, prothrombin activity, total cholesterol, creatinine, glycaemia, vitamin D, and parathyroid hormone were evaluated by routine laboratory methods. The insulin resistance index was calculated according to homeostasis model assessment‐insulin resistance (HOMA‐IR) using the following formula: HOMA − IR = fasting blood insulin × fasting blood glucose ∕ 405. HOMA‐IR values ≥2.7 were used to define insulin resistance.25
Lifestyle assessment
The lifestyle assessment evaluated the current and previous history of smoking and/or alcohol use. Alcohol use was dichotomised into ≤20 vs. >20 g/day on the basis of current alcohol consumption guidelines.26 Participants' habitual physical activity was assessed using the International Physical Activity Questionnaire (IPAQ) short version validated for the Brazilian population.27 The physical activity was dichotomised into normal [moderate‐to‐high categorical scale of IPAQ ≥600 metabolic equivalent of task (MET)‐min/week] or low (<600 MET‐min/week). A trained person administered the questionnaires.
Clinical comorbidities
Hypertension was diagnosed according to the 2013 European Society of Hypertension and of the European Society of Cardiology Guidelines,28 and diabetes mellitus was defined using the 2014, American Diabetes Association Guidelines for diagnosis and classification of diabetes mellitus.29
Anthropometry assessment
A trained nutritionist carried out all nutritional evaluations. Weight and height were measured with a mechanical platform scale (FILIZOLA®). Body mass index (BMI) was calculated using the formula, BMI = weight ∕ height2, and the nutritional status of the patients were determined according to the World Health Organization criteria.30 Elderly individuals were classified according to the Lipschitz classification.31
Mid‐upper arm circumference was measured at the midpoint between the olecranon and the acromial process using a non‐extensible measuring tape. Triceps skin fold was measured directly over the triceps muscle on the posterior midline of the upper arm, at the midpoint between the acromial process of the scapula and the olecranon of the ulna using LANGE® Adipometer (Cambridge Scientific Industries Inc., Cambridge, MD). Mid‐arm muscle circumference (MAMC) was calculated by the following formula: MAMC = mid‐upper arm circumference (cm) − π × [TSF ∕ 10]. Low MAMC was classified according to a previous study.32
Evaluation of nutritional status
Malnutrition was classified by using the Controlling Nutritional Status index (Controlling Nutritional Status index score; measured between 0 and 12)33 as follows: 0–1, normal; 2–4, light; 5–8, moderate; and 9–12, severe malnutrition. The Controlling Nutritional Status index score uses serum albumin, cholesterol, and total lymphocyte count.
Evaluation of body composition
The whole body dual‐energy X‐ray absorptiometry (DXA) exams were performed according to the procedures recommended by the manufacturer on a Discovery W densitometer (Hologic, Inc., Bedford, MA), software version 3.3.0. All procedures were blindly carried out and interpreted by the same operator (A. M. K). The analysis included the whole body DXA measurements as fat mass (kg), lean mass, and appendicular skeletal mass index, which is the sum of the lean mass of the arms and legs (kg) being considered the functional lean mass.34 FM/height2 and ASM/height2 (appendicular skeletal mass index) were also calculated.
Bone mass evaluation
All the subjects with CHC prospectively underwent scanning of the total lumbar spine (L1–L4), total hip, femoral neck, whole‐body bone mineral density, and bone mineral content by DXA. The results were compared with age‐matched, sex‐matched, and ethnicity‐matched reference population provided by the manufacturer to generate T‐score and Z‐score conforming to The International Osteoporosis Foundation Guidelines.35, 36 According to the World Health Organization's criteria,37 in men older than 50 years of age, osteoporosis is defined by a T‐score less than or equal to −2.5 standard deviation (SD) below the young normal mean for men, and osteopenia is defined by a T‐score between −1.0 and −2.5 SD below the young average value. In women, in the menacme, and men younger than 50 years of age, low bone mass is defined by a Z‐score less than or equal to −2.0 SD below the expected range for their age.35, 36, 37
Pre‐sarcopenia assessment
Pre‐sarcopenia is characterized by low muscle mass without impact on muscle strength.17 The cut‐off points adopted for low muscle mass were those recommended by the European Working Group on Sarcopenia in Older People (EWGSOP) criteria.17 Low muscle mass was defined as an appendicular skeletal mass index >2 SD below the reference population.38 This criterion was previously employed in studies evaluating low muscle mass in Brazilian subjects.39, 40 The cut‐off points adopted for low appendicular skeletal mass index were 5.45 and 7.26 kg/m2 for women and men, respectively.38
Muscle strength evaluation
Muscle strength was evaluated by handgrip strength that was performed with the patient in a standardized position. Muscle strength was measured with the hand‐held dynamometer JAMAR® (Asimow Engineering Co., Los Angeles, CA). Subjects were seated, with their elbows flexed at 90°, and supported at the time of the measurement.39 We collected three measurements from each hand and used the mean value in all analyses.41 During handgrip strength measurement, we asked the patient to grip the dynamometer with maximum strength and hold the grip for 3 s. The cut‐off points adopted for low muscle strength were those recommended by EWGSOP.17 Low muscle strength was defined as handgrip strength below 20 and 30 kg for women and men, respectively, based on the reference population.42
Sarcopenia assessment
Sarcopenia was defined as the presence of both low appendicular skeletal index (ASM/height2) and low muscle strength as recommended by EWGSOP.17
Sarcopenic obesity assessment
Sarcopenic obesity was defined as the presence of both sarcopenia and body fat percentage > 27% and > 38% for men and women, respectively.17, 43
Glomerular filtration rate evaluation
Glomerular filtration rate (eGFR) was estimated by Modification of Diet in Renal Disease equation.44
Ethical statement
The study was designed and conducted in accordance with the Declaration of Helsinki and was approved by the Ethics Committee of our Institution (CAAE: 20390513.2.0000.5149).
Statistical analysis
Data were analysed with SPSS (SPSS Inc., Chicago, IL) statistical software package version 17.0. Descriptive statistics were used to provide information regarding the demographic, clinical, lifestyle, nutritional, and biochemical data. The Shapiro–Wilk test was used to evaluate whether the data were normally distributed. For the comparison of the percentage, the asymptotic Pearson's χ2 test was used. For comparisons of medians, the Mann–Whitney U or Kruskal–Wallis and, for means, the Student's t‐test or ANOVA were used.
The associations between the following coupled variables: appendicular skeletal index and mid‐arm muscle circumference; bone mineral content and mid‐arm muscle circumference; bone mineral content and appendicular skeletal index; bone mineral content and muscle strength; appendicular skeletal index and muscle strength; mid‐arm muscle circumference and muscle strength; and the direction of the relationship were analysed by Pearson's or Spearman's correlation.
Kappa test was used to analyse the concordance between mid‐arm muscle circumference and DXA, the latter considered the gold standard for evaluation of pre‐sarcopenia/sarcopenia.
Associations between bone mineral density or bone mineral content and the following variables: appendicular skeletal index, fat mass index, compensated cirrhosis, malnutrition, sedentary life style [low vs. normal physical activity (normal: ≥600 MET‐min/week)], alcohol use (≤20 vs. >20 g/day), muscle strength, controlling for sex, age, body mass index, and eGFR, were evaluated by univariate analysis. Variables with a P‐value <0.20 in the univariate analysis were selected for the linear multivariate analysis. The R2 (adjusted coefficient of determination) and the ANOVA were used to assess the adequacy of the models.
Associations between sarcopenia and the following variables: HOMA‐IR, hypertension, compensated cirrhosis, malnutrition, and sedentary life style [low vs. normal physical activity (normal: ≥600 MET‐min/week)], alcohol use (≤20 vs. >20 g/day), and total body bone mineral content, controlling for sex, age and body mass index were evaluated by univariate analysis. All variables with P‐values <0.20 were included in the full models of logistic regression. Odds ratio and 95% confidence interval were used as an estimate of the risk. The Hosmer–Lemeshow test was used to assess the adequacy of the models.
The level of significance was set at P‐values ≤0.05.
Results
Characteristics of the patients
The characteristics of CHC patients are summarized in Table 1. The mean age of the patients was 50.5 ± 11.3 years (range, 22 to 71 years), and 78/104 (75.0%) were males. Thirty‐four (32.7%) patients had compensated liver cirrhosis [Child–Turcotte–Pugh score, (A5): 19 (55.9%) and (A6): 15 (44.1%); aspartate amino transferase to platelet ratio index score (mean ± SD): 1.5 ± 1.6].
Table 1.
Demographic, clinical, life style, biochemical, and virological data of patients with chronic hepatitis C (n = 104)
| Variables | Stage of liver disease | ||
|---|---|---|---|
| Without cirrhosis | With compensated cirrhosis | P‐value | |
| Demographics | |||
| Patients | 70 (67.3) | 34 (32.7) | |
| Male n (%) | 47 (67.1) | 31 (91.2) | 0.008* |
| Female n (%) | 23 (32.9) | 3 (8.8) | |
| Age (years)a | 49.4 ± 12.0 | 52.7 ± 9.4 | 0.13 |
| Clinical comorbidities n (%) | |||
| DM | 12 (17.1) | 10 (29.4) | 0.15 |
| HTN | 23 (32.9) | 22 (64.7) | 0.002* |
| Life style data n (%) | |||
| Alcohol use (>20 g/day) | 42 (60.0) | 28 (82.4) | 0.02* |
| IPAQ (<600 MET‐min/week) | 26 (37.1) | 13 (38.2) | 0.91 |
| Biochemical and haematological data | |||
| Albumin (g/dl)b | 4.3 (4.2–4.6) | 4.0 (3.8–4.3) | <0.0001* |
| ALT (U/l)b | 45.0 (33.5–78.5) | 111.5 (83.5–145.5) | <0.0001* |
| ALP (U/l)b | 71.0 (58.5–88.5) | 113.0 (78.0–153.0) | 0.001* |
| AST (U/l)b | 44.0 (34.5–65.0) | 109.0 (78.2–146.7) | <0.0001* |
| eGFR (ml/min)b | 103.2 (85.5–128.1) | 104.7 (88.8–115.4) | 0.63 |
| γ‐GT (U/l)b | 72.0 (42.5–108.0) | 150.0 (76.8–262.4) | <0.0001* |
| Glycaemia (mg/dl)b | 94.0 (86.0–98.0) | 96.0 (87.0–117.0) | 0.15 |
| HOMA‐IRc | 20/69 (29.0) | 22/32 (68.8) | <0.0001* |
| Lymphocytesa | 2218.6 ± 801.4 | 2126.6 ± 912.1 | 0.61 |
| PA (%)b | 95.5 (87.7–100.8) | 78.2 (67.0–91.9) | 0.06 |
| Total bilirubin (mg/dl)b | 0.8 (0.7–1.1) | 1.1 (0.9–1.5) | <0.0001* |
| Total cholesterol (mg/dl)a | 168.1 ± 42.3 | 162.3 ± 28.9 | 0.47 |
| 25 (OH) Vitamin Da | 32.0 ± 13.3 | 32.3 ± 12.7 | 0.90 |
| PTHb | 35.8 (26.0–48.4) | 31.9 (23.2–52.8) | 0.47 |
| Virological parameters | |||
| HCV‐RNA log10 (IU/ml)b | 6.0 (5.5–6.5) | 5.8 (5.4–6.3) | 0.24 |
| Genotype 1 n (%) | 65 (92.9) | 28 (82.4) | 0.10 |
ALP, alkaline phosphatase; ALT, alanine aminotransferase; AST, aspartate aminotransferase; DM, diabetes mellitus; eGFR, estimated glomerular filtration rate by utilizing the Modification of Diet in Renal Disease Study equation; γ‐GT gamma‐glutamyltranspeptidase; HCV, hepatitis C virus; HOMA‐IR, homeostasis model assessment‐insulin resistance (HOMA‐IR value ≥2.7 was used to detect insulin resistance); HTN, hypertension; IPAQ, International Physical Activity Questionnaire (short): low vs. normal (normal: ≥600 MET‐min/week); PA, prothrombin activity; PTH, parathyroid hormone; RNA, ribonucleic acid.
Mean ± standard deviation (SD).
Median and interquartile range, 25–75th percentile.
101/104 (97.0%) patients.
P‐values ≤0.05 were considered significant (The asymptotic Pearson's Χ2 test was used to compare categorical variables. The test T and Mann Whitney U test were used for comparison of means and medians, respectively).
The prevalence of cirrhosis was higher in males than in females (Table 1). Hypertension and alcohol use were also more frequently observed in cirrhotic than in non‐cirrhotic patients. The abnormalities of the liver function tests and HOMA‐IR ≥2.7 values were most frequently found in compensated cirrhotic patients (Table 1). The majority of patients was infected with HCV genotype 1 (Table 1).
Bone mass, body composition, and nutritional characteristics of the patients with chronic hepatitis C
Among the CHC patients, 20 (19.2%) had osteopenia, and 11 (10.6%) had osteoporosis. Low muscle strength, pre‐sarcopenia, sarcopenia, and sarcopenic obesity were observed in 27.9% (29/104), 14.4% (15/104), 8.7% (9/104) and 3.8% (4/104) of the patients, respectively.
Body composition, bone mineral density/content, and nutritional characteristics of CHC patients with compensated cirrhosis and without cirrhosis were compared (Table 2). In the univariate analysis, only fat mass index was significantly lower in compensated cirrhotic subjects than in those without cirrhosis.
Table 2.
Body composition bone mineral density/content assessment and nutritional characteristics of patients with chronic hepatitis C (n = 104)
| Variables | Stage of liver disease | ||
|---|---|---|---|
| Without cirrhosis (n = 70) | With compensated cirrhosis (n = 34) | P | |
| DXA data | |||
| Soft tissue body composition | |||
| Appendicular skeletal muscle mass (kg) | |||
| ASMI (kg/m2)a | 8.0 (7.0–8.9) | 7.7 (7.1–8.5) | 0.36 |
| Pre‐sarcopenia (low ASMI)b | 9 (12.9) | 6 (17.6) | 0.51 |
| Fat mass | |||
| FMI (kg/m2)a | 8.5 (6.2–9.8) | 6.9 (5.3–8.8) | 0.05* |
| Bone mass density/contentc | |||
| Total body BMD (g/cm2) | 1.1 ± 0.1 | 1.0 ± 0.2 | 0.50 |
| Total body BMD T‐score | −0.6 ± 1.3 | −0.8 ± 1.3 | 0.56 |
| Total body BMC (g)a | 2354.2 (1972.6–2709.9) | 2276.4 (2003.5–2741.0) | 0.92 |
| Lumbar spine BMD (g/cm2) | 1.0 ± 0.1 | 0.9 ± 0.1 | 0.07 |
| Lumbar spine BMD T‐score | −0.8 ± 1.5 | −1.3 ± 1.4 | 0.16 |
| Femoral neck | 0.8 ± 0.2 | 0.8 ± 0.2 | 0.49 |
| Lumbar spine BMD T‐score | −0.9 ± 0.2 | −0.9 ± 0.2 | 0.89 |
| Total hip BMD (g/cm2) | 1.0 ± 0.1 | 0.9 ± 0.1 | 0.40 |
| Total hip BMD T‐score | −0.4 ± 1.0 | −0.5 ± 0.8 | 0.68 |
| Low bone mass n (%)d | 21 (30.0) | 15 (44.0) | 0.16 |
| Low bone mass to age n (%) | 2 (2.9) | 3 (8.8) | 0.39 |
| Osteopenia n (%) | 14 (20.0) | 6 (17.6) | 0.98 |
| Osteoporosis n (%) | 5 (7.1) | 6 (17.6) | 0.20 |
| Anthropometric data | |||
| BMI (kg/m2)a | 26.1 (23.8–30.1) | 25.1 (23.8–28.9) | 0.22 |
| MAMCc | 26.2 ± 3.7 | 26.0 ± 3.0 | 0.83 |
| Low MAMC n (%)e | 12 (17.1) | 8 (23.5) | 0.44 |
| Assessment of malnutrition n (%)f | |||
| Normal | 41 (58.6) | 19 (55.9) | 0.86 |
| Light | 28 (4.0) | 14 (41.2) | |
| Moderate | 1 (1.4) | 1 (2.9) | |
| Severe | 0 | 0 | |
| Grip strength data | |||
| Low muscle strengthg | 18 (25.7) | 11 (32.4) | 0.48 |
| Sarcopeniah | |||
| Low ASMIb and muscle strengthg | 5 (7.1) | 4 (11.8) | 0.43 |
| Sarcopenic obesityi | 2 (2.9) | 2 (5.9) | 1.00 |
ASMI, Appendicular skeletal muscle mass index (appendicular skeletal muscle mass/height2); BMC, bone mineral content; BMD, bone mineral density; BMI, body mass index; DXA, dual‐energy X‐ray absorptiometry; FMI, fat mass/height2; MAMC, mid‐arm muscle circumference. The asymptotic Pearson's χ2 test was used to compare categorical variables. The test t and Mann Whitney U test were used for comparison of means and medians, respectively.
Median and interquartile range, 25–75th percentile.
Pre‐sarcopenia, the cut‐off points adopted for low muscle mass were those recommended by the European Working Group on Sarcopenia in Older People (EWGSOP) criteria17: 5.45 kg/m2 and 7.26 kg/m2 for women and men, respectively.38
Mean ± standard deviation (SD).
According to the adopted WHO criteria in men aged > 50 years, the T‐score of osteopenia is between − 1.0 and − 2.49 SD below the young average value and of osteoporosis is ≥ −2.5SD below the young normal mean for men and the Z‐score of low bone mass is ≤ −2.0 SD below the expected range in men aged < 50 years and women in the menacme.35, 36, 37
According to Frisancho (1990).32
Assessment of malnutrition: Absent = 0–1, Light = 2–4, Moderate = 5–8 and Severe = 9–12 according to COntrolling NUTritional Status index scores.33
The cut‐off points adopted for low muscle strength were those recommended by EWGSOP criteria.17
Sarcopenia was defined by the presence of both low ASMI (ASM/height2) and low MS as recommended by EWGSOP.17
Sarcopenic obesity was defined by the presence of both low appendicular skeletal index (ASM/height2), low muscle strength and body fat percentage greater than 27% in men and 38%in women.17, 43
P‐values ≤ 0.05 were considered significant.
When stratified by BMI status, eight (88.9%) and one (11.1%) sarcopenic individuals were classified as eutrophic and underweight, respectively. All patients with sarcopenic obesity had normal BMI. Regarding low bone mineral density, 23 (63.9%), 10 (27.8%), and 1 (2.8%) patients were classified as eutrophic, overweight, and obese, respectively.
Bone mineral content was positively correlated with mid‐arm muscle circumference, appendicular skeletal mass index, and muscle strength (Figure. 1).
Figure 1.

Correlation between total bone mineral content and mid‐upper arm muscle (1A), total bone mineral content and appendicular muscle mass (1B), and total bone mineral content and muscle strength (1C) in patients with chronic hepatitis C with and without sarcopenia.
Regarding the nutrition status, malnutrition, varying from light to moderate degree, was observed in 42.3% (44/104) of the patients. Malnutrition was positively correlated with pre‐sarcopenia (r = 0.25, P = 0.009) and sarcopenia (r = 0.39, P < 0.0001). When all patients with CHC were included in the analysis, no correlation was observed between malnutrition and low bone mineral density (P = 0.18). Otherwise, a positive correlation between malnutrition and bone mineral density was found (r = 0.55, P = 0.03) in CHC patients with low muscle mass (n = 15).
Factors associated with low bone mineral density/bone mineral content in patients with chronic hepatitis C
Eleven subjects had osteoporosis with low bone mineral density detected in the following skeletal sites: lumbar spine [8/11 (72.7%)] and lumbar spine and femoral neck [3/11 (27.3%)]. Among the 20 individuals with osteopenia, low bone mineral density was identified in the following skeletal sites: lumbar spine, femoral neck, and total hip [8/20 (40.0%)], lumbar spine and femoral neck [6/20 (30.0%)], lumbar spine [5/20 (25.0%)], femoral neck and total hip [1/20 (5.0%)].
A linear regression analysis demonstrated that appendicular skeletal mass index was independently associated with lumbar spine bone mineral density, femoral neck bone mineral density, total hip bone mineral density, and total body mineral composition (Table 3). Regarding lumbar spine bone mineral density, in the univariate analysis, appendicular skeletal mass index, BMI, and eGFR were selected. Appendicular skeletal mass index and eGFR remained independently associated with lumbar spine bone mineral density in the linear regression analysis (Table 3).
Table 3.
Variables associated with bone mineral density/content in non‐cirrhotic and compensated cirrhotic patients with chronic hepatitis C (n = 104)
| BMD/BMC topographic distribution variables | Beta regression coefficient | t | P | Adjusted R2 | F value |
|---|---|---|---|---|---|
| Lumbar spine BMD | 0.19 | 12.92 | |||
| ASMI | 0.27 | 2.89 | 0.05 | ||
| eGFR (ml/min) | 0.30 | 3.25 | 0.02 | ||
| Femoral neck | 0.42 | 25.57 | |||
| Male sex | −0.263 | −2.98 | 0.004 | ||
| Age | −0.189 | −2.34 | 0.021 | ||
| ASMI | 0.70 | 8.45 | <0.0001 | ||
| Total hip BMD | 0.42 | 37.06 | |||
| ASMI | 0.72 | 8.53 | <0.0001 | ||
| Male sex | −0.22 | −2.61 | 0.01 | ||
| Total body BMC | 0.52 | 35.83 | |||
| ASMI | 0.52 | 5.84 | <0.0001 | ||
| Male sex | −0.25 | −2.77 | 0.007 | ||
| eGFR (ml/min) | 0.24 | 2.84 | 0.006 |
BMC, bone mineral content; BMD, bone mineral density; CI, Confidence interval; eGFR, glomerular filtration rate; t, computed by dividing the estimated value of the β coefficient by its standard error. The linear regression models were appropriately adjusted according to the F‐test of the ANOVA (P < 0.05). Appendicular skeletal muscle mass index [ASMI (appendicular skeletal muscle mass/height2)]; alcohol use (≤20 vs. >20 g/day); compensated cirrhosis; fat mass index [FMI (fat mass/height2)]; International Physical Activity Questionnaire (short): low vs. normal (normal: ≥600 MET‐min/week), and muscle strength were variables included on the linear regression models, adjusted by age, sex, body index mass (BMI), and eGFR estimate by Modification of Diet in Renal Disease.
In the univariate analysis age, male gender and appendicular skeletal mass index were selected, and they remained independently associated with femoral neck bone mineral density in the linear regression analysis (Table 3). Concerning total hip bone mineral density, male gender, appendicular skeletal mass index, and IPAQ (<600 MET‐min/week) were selected in the univariate analysis. Male gender and bone mineral density remained independently associated with total hip bone mineral density in the linear regression analysis (Table 3).
In the univariate analysis, male gender, appendicular skeletal muscle index, and eGFR were selected and remained independently associated with total body bone mineral content in the linear regression analysis (Table 3).
Bone mineral content and bone mineral density did not associate with HOMA‐IR ≥2.7 (p = 0.79 and p = 0.88) and serum parathormone levels (p = 0.38 and p = 0.40), respectively.
Demographic, nutritional, body composition, clinical and life style characteristics of the patients with chronic hepatitis C, and sarcopenia
The characteristics of the patients with CHC and sarcopenia are summarized in Table 4. The mean age (52.7 vs. 50.3 yrs.; P = 0.55), gender (77.8% vs. 74.7% males; P = 0.84), and liver disease severity (44.4% vs. 31.6%; p = 0.47) did not differ between patients with and without sarcopenia, respectively. Although 8/9 (88.9%) of the patients with sarcopenia were classified as eutrophic by BMI, 77.8% and 44.5% had malnutrition and sarcopenic obesity, respectively.
Table 4.
Demographic, nutritional, body composition, clinical, and life style characteristics of sarcopenic patients with chronic hepatitis C (n = 9)
| Patient | Sex | Age | Malnutritiona | BMI (kg/m2) | BMIb classification | MAMC | Low MAMCc | % Body Fat | Sarcopenic obesityd | Cirrhosise | Low IPAQf |
|---|---|---|---|---|---|---|---|---|---|---|---|
| 1 | M | 58 | Moderate | 23.6 | Eutrophic | 20.9 | + | 25.0 | − | − | + |
| 2 | M | 44 | Light | 20.3 | Eutrophic | 23.5 | + | 25.0 | − | + | + |
| 3 | M | 67 | Light | 24.0 | Eutrophic | 22.9 | − | 28.1 | + | + | + |
| 4 | M | 64 | Light | 20.0 | Underweight | 22.4 | + | 19.9 | − | − | − |
| 5 | M | 54 | Absent | 21.7 | Eutrophic | 23.5 | + | 24.6 | − | + | + |
| 6 | M | 52 | Moderate | 18.8 | Eutrophic | 22.3 | + | 20.0 | − | + | + |
| 7 | F | 33 | Absent | 21.8 | Eutrophic | 20.3 | − | 42.5 | + | − | − |
| 8 | F | 40 | Light | 19.9 | Eutrophic | 18.5 | + | 39.3 | + | − | − |
| 9 | M | 62 | Light | 20.1 | Eutrophic | 20.4 | + | 30.9 | + | − | + |
M = male; F = female; MAMC, Mid‐arm muscle circumference; +, presence; −, absence.
Absent = 0–1, Light = 2–4, Moderate = 5–8 and Severe = 9–12 according to COntrolling NUTritional Status index scores.33
BMI (body mass index) classification according to the World Health Organization criteria30 and to the Lipschitz classification in elderly individuals.31
According to Frisancho (1990).32
Defined by concurrent presence of low appendicular skeletal index (ASM/height2), low muscle strength, and body fat percentage greater than 27% in men and 38%in women, respectively.43
Compensated cirrhosis in all positive cases [Child–Turcotte–Pugh score (A5)].
International Physical Activity Questionnaire low < 600 MET‐min/week.
Factors associated with sarcopenia in patients with chronic hepatitis C
In the univariate analysis, BMI, bone mineral content, malnutrition, and alcohol use (≤20 vs. >20 g/day) were selected. Bone mineral content and malnutrition remained independently associated with sarcopenia in the multivariate analysis (Table 5). Bone mineral content was lower in patients with than in those without sarcopenia (Figure 2A). In order to evaluate whether the difference was because of aging, next we stratified the patients by age range. No difference (P = 0.82) was observed in the bone mineral content between the age groups (Figure 2B).
Table 5.
Variables associated with sarcopenia in non‐cirrhotic and compensated cirrhotic patients with chronic hepatitis C (n = 104)
| Variables | Sarcopeniaa | |||
| Univariate analysis | Multivariate analysis | |||
| P | OR | 95% CI | P | |
| Sex | 0.83 | — | — | — |
| Age | 0.49 | — | — | — |
| Body mass index | 0.001 | 0.06 | 0.003–1.12 | 0.06 |
| Bone mineral content | 0.003 | 0.996 | 0.993–0.999 | 0.02 |
| Hypertension | 0.89 | — | — | — |
| HOMA‐IR | 0.05 | 0.10 | 0.01–1.56 | 0.10 |
| Compensated cirrhosis | 0.37 | — | — | — |
| Malnutrition | <0.0001 | 2.79 | 1.28–6.09 | 0.01 |
| Low physical activityb | 0.35 | — | — | — |
| Alcohol use (>20 g/day)c | 0.15 | 0.98 | 0.05–21.30 | 0.99 |
CI, confidential interval; HOMA‐IR, homeostasis model assessment‐insulin resistance (HOMA‐IR value ≥2.7 was used to detect insulin resistance); OR, odds ratio.
Sarcopenia was defined as both low ASMI (ASM/height2) and low MS as recommended by European Working Group on Sarcopenia in Older People.17
The physical activity was dichotomised into normal (moderate‐to‐high categorical scale of International Physical Activity Questionnaire ≥600 MET‐min/week or low <600 MET‐min per week).
Alcohol use was stratified as ≤20 vs. >20 g/day.
Figure 2.

Box plots representing body mineral content. The upper and lower limits of the boxes represent 75th and 25th percentiles, respectively; the horizontal bar across the box indicates the median and the end of the vertical lines indicate the minimum and maximum data values; *, P = 0.006 (2A). No difference was observed in the bone mineral content between the age groups (P = 0.82) (2B).
Correlation between mid‐arm muscle circumference, appendicular skeletal mass, and muscle strength in patients with chronic hepatitis C
A positive correlation was found between mid‐arm muscle circumference and appendicular skeletal mass index (Figure 3A). Mid‐arm muscle circumference and appendicular skeletal mass index were also significantly correlated with muscle strength (Figure 3B and 3C).
Figure 3.
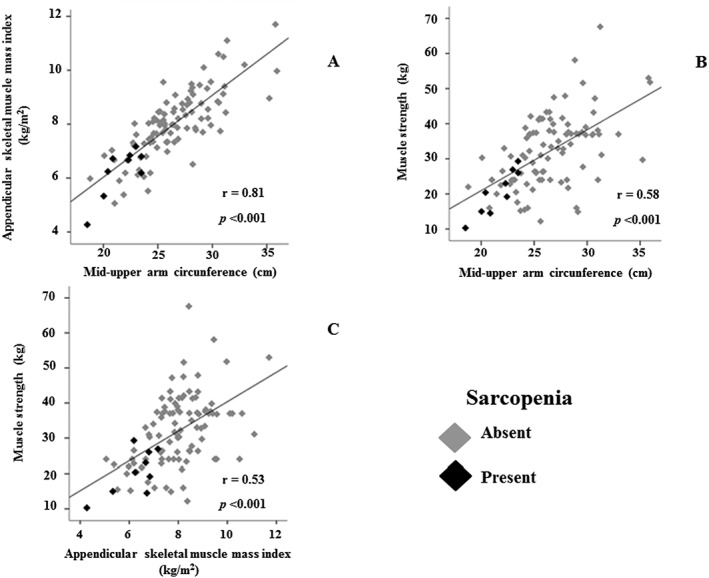
Correlation between appendicular muscle mass and mid‐upper arm muscle (3A), muscle strength and mid‐upper arm (3B), and muscle strength and appendicular muscle mass (3C) in patients with chronic hepatitis C with and without sarcopenia.
Agreement between mid‐arm muscle circumference, appendicular skeletal mass, and muscle strength in the evaluation of pre‐sarcopenia and sarcopenia in patients with CHC.
Because mid‐arm muscle circumference was positively correlated with appendicular skeletal mass index, we analysed the agreement between these nutritional methods in the assessment of pre‐sarcopenia and sarcopenia. When the appendicular skeletal mass index was replaced by mid‐arm muscle circumference in the evaluation of muscle mass, low mid‐arm muscle circumference and low mid‐arm muscle circumference plus low handgrip strength were observed in 20 (19.2%) and 11 (10.6%) subjects, respectively. Moderate and substantial agreement was found between mid‐arm muscle circumference and appendicular skeletal mass index in the evaluation of pre‐sarcopenia (Kappa = 0.49; P < 0.0001) and sarcopenia (Kappa = 0.67; P < 0.0001), respectively.
Discussion
To the best of our knowledge, this is the first study to demonstrate that appendicular skeletal mass is an independent predictor of bone mineral density in non‐cirrhotic and compensated cirrhotic patients with CHC. Similarly, previous studies addressing the role of skeletal muscle in the maintenance of bone health, muscle mass/strength was also identified as a protector factor against low bone mineral density in both healthy11, 12 and diseased populations.13, 14 However, in the setting of metabolic bone disease, the role of each specific body component in preventing bone loss has not yet been completely clarified.
In the current study, neither fat mass nor BMI was associated with low bone mineral density. Differently, Sharma et al., using DXA and bioimpedance analyses to evaluate lean mass, fat mass, and bone mineral density of 318 HIV‐infected and 122 HIV‐uninfected females, observed that both lean mass and fat mass were strong and independent predictors of low bone mineral density.45 However, the authors observed that HIV‐infected females were older, post‐menopausal, and had higher prevalence of HCV/HIV‐coinfection than HIV‐uninfected females. It should be emphasized that the females (n = 26) enrolled in the present study were younger and pre‐menopausal. These findings are in agreement with a previous study demonstrating that in males and pre‐menopausal women, the effect of lean mass on bone mineral density was greater than that of fat mass.46 Conversely, in post‐menopausal women, lean mass and fat mass influence the bone mineral density.46
In this study, low bone mineral density was observed in 36 (34.6%) of the patients, and both osteopenia and osteoporosis were more frequently detected in the lumbar spine and femoral neck than in the hip. Bone wasting has been known to be common in cirrhosis, regardless of its aetiology.47 Recently, a meta‐analysis of six case–control studies (372 cirrhotic patients and 1579 controls) found a higher prevalence of osteoporosis in cirrhotic patients than in controls (34.7% vs. 12.8%), with a significant reduction in lumbar spine bone mineral density.48 Regarding the association between bone mineral density and viral hepatitis, most studies focused on patients in late stages of cirrhosis47, 48; therefore, little is known about bone status in non‐cirrhotic patients with CHC. In the current study, in which only non‐cirrhotic and compensated cirrhotic patients (Child–Turcotte–Pugh A) chronically infected by HCV were included, a marked prevalence of low bone mineral density was observed even in the absence of cirrhosis. Similarly, Schiefke et al. (2005) observed a high prevalence of osteopenia and osteoporosis in non‐cirrhotic patients with CHC. Moreover, the authors showed that the serum levels of bone‐specific alkaline phosphatase and intact parathormone were significantly elevated in more advanced stages of liver fibrosis.5 Differently, our results did not show substantial alterations in serum parathormone levels and vitamin D status between patients with and without low bone mineral content or bone mineral density, independently of hepatic fibrosis stage (Data not shown). These findings are in line with a previous study that did not find clinically important changes in bone markers and calciotropic hormones among non‐cirrhotic individuals with hepatitis C.5 Apart from this, in consonance with findings of a previous study,49 our results demonstrated no significant association between bone mineral density/bone mineral content measurements and the presence of compensated cirrhosis, viral load, and HCV genotype. Although patients with alcoholism were not excluded from our investigation, low bone mineral density and low bone mineral content did not associate with alcohol use.
In the current study, appendicular skeletal mass was a strong positive independent predictor of lumbar spine, femoral neck, hip, and total body bone mineral content. It is well‐known that appendicular skeletal mass, the lean soft tissue found in the arms and legs, represents a large proportion of total body skeletal muscle mass.50 Furthermore, the tight interaction between skeletal muscle and bone is crucial for the bone modelling and remodelling, which is considered a process that improves both bone mass and bone strength.51 Of note, in our study, low bone mineral composition was a strong determinant of sarcopenia. This finding points to a complex bi‐directional crosstalk between bone and muscle involving not only the mechanical interaction but also a putative paracrine function that might be related to the secretion of biological mediators by both of these components of the musculoskeletal system.52 In fact, recently, it was experimentally demonstrated in an animal model that conditioned media from osteocytes enhance myogenic differentiation of myoblasts pointing to bone‐derived mediators as potential candidates in the skeletal muscle proliferate signalling.53, 54 It should to be highlighted among them, the prostaglandin E2, which via prostaglandin E2 receptor 4 promotes primary myoblast proliferation by accelerating G1‐S phase transition in the cell cycle.53 Prostaglandin E2 signalling may also have an important modulation of the oxidative stress in skeletal muscle with significant implications in a number of muscle disorders, such as muscle atrophy, muscular dystrophies, and aging sarcopenia.53
Taking into account the lack of a specific consensus criterion for diagnosing sarcopenia in patients with hepatic diseases and the paucity of wasting muscle data from subjects chronically infected with HCV, in this study, we used the reference values recommended by EWGSOP. We observed the presence of sarcopenia in 7.1% and 11.8% of the non‐cirrhotic and compensated cirrhotic patients (Child–Turcotte–Pugh A), respectively. In a recent investigation, Hiraoka et al. (2016), also based on EWGSOP criteria, using computed tomography and handgrip strength, found sarcopenia in 7.1%, 11.8% and 21.9% non‐cirrhotic, compensated cirrhotic (Child–Turcotte–Pugh A), and decompensated cirrhotic (Child–Turcotte–Pugh B/C) Japanese patients with chronic B and/or C viral hepatitis, respectively.18 In those individuals, the prevalence of sarcopenia increased in parallel with the progression of hepatic fibrosis. Of particular concern, in the current study, was the finding that 7.0% of CHC subjects had sarcopenia prior the onset of cirrhosis.
Conceptually, sarcopenia is defined as a combination of low muscle mass and reduced muscle strength or impaired physical performance.17 Sarcopenia can be considered primary when it is associated with aging itself; however, it can also be present as a consequence of chronic diseases.17 Skeletal muscle loss, considered a component of malnutrition, has been found in approximately 40.0% of patients with cirrhosis.55 Despite the negative impact of sarcopenia on survival,16 quality of life,56 severe advanced liver disease‐related complications such as hepatic encephalopathy, and infections, the role of muscle usually remains unseen in chronic liver diseases.57
Several researchers also using the EWGSOP criteria have demonstrated higher prevalence of sarcopenia than that observed in this study. However, it has to be emphasized that the differences in the sarcopenia prevalence here observed may be explained by the high number of patients with cirrhosis evaluated in other studies. Of note, we included a few number of HCV with cirrhosis, all of them with compensated cirrhosis. In a recent investigation,58 including 678 patients with cirrhosis because of different aetiologies, sarcopenia was found in 43.0%, but when only patients with compensated cirrhosis (Child–Turcotte–Pugh scores A5 and A6) were analysed, the prevalence of sarcopenia (12.6%) was very similar to that observed in the patients with compensated cirrhosis of the present study (11.8%).
Differences may also be because of the older age of individuals included in other studies. In an investigation conducted in a Southern Brazilian city including 1291 elderly aged 60 years or over, the overall sarcopenia prevalence was 13.9%.59 In another study enrolling 18 363 people aged ≥ 65 years from different countries, the prevalence of sarcopenia ranged from 12.6% to 17.5%.60 Of note, among the factors linked to muscle loss, high percentage of body fat was associated with lower skeletal muscle mass in all countries and with sarcopenia in five countries.60
In the present study, a concurrent presence of skeletal muscle loss and adipose tissue gain—sarcopenic obesity—was observed in four (3.8%) patients. When only compensated cirrhosis was evaluated, sarcopenic obesity was observed in 5.9% of the patients. In the earlier cited study of Montano‐Loza et al.,58 the percentage of sarcopenic obesity in the compensated cirrhotic patients was of 8.0% compared with 20.0% identified when both compensated and decompensated patients were evaluated.
It has also to be emphasized that sarcopenia is associated with a high long‐term mortality in cirrhosis.58, 61
Taking all data together, our results point to the relevance of investigating the presence of sarcopenia and sarcopenic obesity in early stages of hepatic diseases before the development of cirrhosis.
Regarding the muscularity assessment in patients with chronic liver disease, DXA accuracy might be limited in the presence of fluid retention. However, only patients with compensated cirrhosis or without cirrhosis were enrolled in this study; therefore, none of the patients had signals of fluid overload.
Of note, our results showed a positive correlation between appendicular skeletal mass, mid‐upper arm circumference, and muscle strength. Furthermore, moderate and substantial agreement was found between mid‐upper arm circumference and appendicular skeletal mass index in the evaluation of pre‐sarcopenia and sarcopenia, respectively. It is well‐known that the accurate assessment of muscle mass is an essential step for classifying sarcopenic subjects. Although computed tomography, magnetic resonance imaging, and DXA are considered to be the most accurate techniques in estimating muscle wasting,62 the exposition of patients to high levels of ionizing radiation and the high cost limit the method use in routine practice.
It should be emphasized that in 89.0%, 64.0%, and 100.0% of the patients with sarcopenia, low bone mineral density, and sarcopenic obesity, respectively, were classified as eutrophic according to BMI. It is well‐known that sarcopenia, loss of muscle mass and function, which affects the elderly and patients with chronic diseases, is not accurately diagnosed by using the BMI.63 In fact, the BMI predictive value to evaluate the percentage of body fat at individual level is very limited.63 Moreover, our data demonstrated a strong association between sarcopenia and malnutrition. Therefore, our results point to the relevance of incorporating routine mid‐upper arm circumference coupled with handgrip strength, considered simple non‐invasive and inexpensive nutritional methods, alongside BMI, into routine clinical evaluation of patients chronically infected by HCV, to screen for earlier skeletal muscle loss. Corroborating with this, a recent cross‐sectional study from National Health Examination and Nutrition demonstrated that low muscle mass, as assessed by mid‐upper arm circumference measurements <10th percentile, precedes the development of cirrhosis in patients with CHC.64 Apart from this, in the hepatic disease context, the ESPEN guidelines recommend that the evaluation of malnutrition should be performed using anthropometric methods, which are not affected by the presence of ascites and peripheral oedema as mid‐upper arm circumference and triceps skin fold.65
The limitations of our study should be considered. The included subjects were recruited from a referral centre and consequently may not be representative of all patients with CHC. In addition, the cross‐sectional nature of this investigation precluded the possibility to recognize any cause–effect relationship between low BMD/sarcopenia and clinical, lifestyle, and nutritional cofactors. Despite the meticulous clinical interview, self‐reporting of alcohol consumption is subjective, and exact quantity of alcohol intake might be underestimated. Further weaknesses include the lack of a control group for muscularity and bone mass assessment in the statistical analysis.
The data presented here should be taken into account in the understanding of the sarcopenia and lowered bone mineral density in patients with CHC and in the translation of the results into daily clinical practice. Altogether, these findings may influence clinical decision‐making and contribute to the development of effective strategies to screen the musculoskeletal system abnormalities in all patients with CHC, independently of the stage of the liver disease. Maintenance of healthy bone and preserved skeletal muscle is essential to reduce the negative effects of sarcopenia and low bone mineral density on the quality of life, morbidity, and mortality of patients with CHC. The challenge remains for further research to identify potential molecular and biochemical mediators involved in the crosstalk between bone, skeletal muscle, and liver. Furthermore, better comprehension of these processes will positively influence in the management strategies for decreasing the wasting of muscle and bone in subjects with CHC.
Conflicts of interest
All authors have no conflicts of interest to declare.
Acknowledgements
The authors certify that they comply with the ethical guidelines for authorship and publishing of the Journal of Cachexia, Sarcopenia, and Muscle update 2015.66
This work was supported by Conselho Nacional de Desenvolvimento Científico e Tecnológico, Brazil (CNPq; grant number: 307407/2014‐4), Coordenação de Aperfeiçoamento de Pessoal de Nível Superior, Brazil (CAPES), Fundação de Amparo à Pesquisa do Estado de Minas Gerais (FAPEMIG), and Pró‐Reitoria de Pesquisa da Universidade Federal de Minas Gerais, Brazil.
Bering, T. , Diniz, K. G. D. , Coelho, M. P. P. , Vieira, D. A. , Soares, M. M. S. , Kakehasi, A. M. , Correia, M. I. T. D. , Teixeira, R. , Queiroz, D. M. M. , Rocha, G. A. , and Silva, L. D. (2018) Association between pre‐sarcopenia, sarcopenia, and bone mineral density in patients with chronic hepatitis C. Journal of Cachexia, Sarcopenia and Muscle, 9: 255–268. doi: 10.1002/jcsm.12269.
References
- 1. Webster DP, Klenerman P, Dusheiko GM. Hepatitis C. Lancet 2015;385:1124–1135. [DOI] [PMC free article] [PubMed] [Google Scholar]
- 2. Luhnen M, Waffenschmidt S, Gerber‐Grote A, Hanke G. Health economic evaluations of sofosbuvir for treatment of chronic hepatitis C: a systematic review. Appl Health Econ Health Policy 2016;14:527–543. [DOI] [PubMed] [Google Scholar]
- 3. Stanaway JD, Flaxman AD, Naghavi M, Fitzmaurice C, Vos T, Abubakar I, et al. The global burden of viral hepatitis from 1990 to 2013: findings from the Global Burden of Disease Study 2013. Lancet 2016;388:1081–1088. [DOI] [PMC free article] [PubMed] [Google Scholar]
- 4. Younossi Z, Park H, Henry L, Adeyemi A, Stepanova M. Extrahepatic manifestations of hepatitis C: a meta‐analysis of prevalence, quality of life, and economic burden. Gastroenterology 2016;150:1599–1608. [DOI] [PubMed] [Google Scholar]
- 5. Schiefke I, Fach A, Wiedmann M, Aretin AV, Schenker E, Borte G, et al. Reduced bone mineral density and altered bone turnover markers in patients with non‐cirrhotic chronic hepatitis B or C infection. World J Gastroenterol 2005;11:1843–1847. [DOI] [PMC free article] [PubMed] [Google Scholar]
- 6. Chen CC, Wang SS, Jeng FS, Lee SD. Metabolic bone disease of liver cirrhosis: is it parallel to the clinical severity of cirrhosis? J Gastroenterol Hepatol 1996;11:417–421. [DOI] [PubMed] [Google Scholar]
- 7. Arteh J, Narra S, Nair S. Prevalence of vitamin D deficiency in chronic liver disease. Dig Dis Sci 2010;55:2624–2628. [DOI] [PubMed] [Google Scholar]
- 8. Gallego‐Rojo FJ, Gonzalez‐Calvin JL, Muñoz‐Torres M, Mundi JL, Fernandez‐Perez R, Rodrigo‐Moreno D. Bone mineral density, serum insulin‐like growth factor I, and bone turnover markers in viral cirrhosis. Hepatology 1998;28:695–699. [DOI] [PubMed] [Google Scholar]
- 9. Szulc P, Beck TJ, Marchand F, Delmas PD. Low skeletal muscle mass is associated with poor structural parameters of bone and impaired balance in elderly men ‐ the MINOS study. J Bone Miner Res 2005;20:721–729. [DOI] [PubMed] [Google Scholar]
- 10. Brotto M, Bonewald L. Bone and muscle: interactions beyond mechanical. Bone 2015;80:109–114. [DOI] [PMC free article] [PubMed] [Google Scholar]
- 11. Taaffe DR, Cauley JA, Danielson M, Nevitt MC, Lang TF, Bauer DC, et al. Race and sex effects on the association between muscle strength, soft tissue, and bone mineral density in healthy elders: the Health, Aging, and Body Composition Study. J Bone Miner Res 2001;16:1343–1352. [DOI] [PubMed] [Google Scholar]
- 12. Snow‐Harter C, Bouxsein M, Lewis B, Charette S, Weinstein P, Marcus R. Muscle strength as a predictor of bone mineral density in young women. J Bone Miner Res 1990;5:589–595. [DOI] [PubMed] [Google Scholar]
- 13. Lee N, Radford‐Smith GL, Forwood M, Wong J, Taaffe DR. Body composition and muscle strength as predictors of bone mineral density in Crohn's disease. J Bone Miner Metab 2009;27:456–463. [DOI] [PubMed] [Google Scholar]
- 14. Bolton CE, Ionescu AA, Shiels KM, Pettit RJ, Edwards PH, Stone MD, et al. Associated loss of fat‐free mass and bone mineral density in chronic obstructive pulmonary disease. Am J Respir Crit Care Med 2004;170:1286–1293. [DOI] [PubMed] [Google Scholar]
- 15. Kalafateli M, Konstantakis C, Thomopoulos K, Triantos C. Impact of muscle wasting on survival in patients with liver cirrhosis. World J Gastroenterol 2015;21:7357–7361. [DOI] [PMC free article] [PubMed] [Google Scholar]
- 16. Montano‐Loza AJ, Duarte‐Rojo A, Meza‐Junco J, Baracos VE, Sawyer MB, Pang JX, et al. Inclusion of sarcopenia within MELD (MELD‐Sarcopenia) and the prediction of mortality in patients with cirrhosis. Clin Transl Gastroenterol 2015;6:e102. [DOI] [PMC free article] [PubMed] [Google Scholar]
- 17. Cruz‐Jentoft AJ, Baeyens JP, Bauer JM, Boirie Y, Cederholm T, Landi F, et al. Sarcopenia: European consensus on definition and diagnosis: report of the European Working Group on Sarcopenia in Older People. Age Ageing 2010;39:412–423. [DOI] [PMC free article] [PubMed] [Google Scholar]
- 18. Hiraoka A, Michitaka K, Ueki H, Kaneto M, Aibiki T, Okudaira T, et al. Sarcopenia and two types of presarcopenia in Japanese patients with chronic liver disease. Eur J Gastroenterol Hepatol 2016;28:940–947. [DOI] [PubMed] [Google Scholar]
- 19. Tsochatzis EA, Bosch J, Burroughs AK. Liver cirrhosis. Lancet 2014;383:1749–1761. [DOI] [PubMed] [Google Scholar]
- 20. D'Amico G, Pasta L, Morabito A, D'Amico M, Caltagirone M, Malizia G, et al. Competing risks and prognostic stages of cirrhosis: a 25‐year inception cohort study of 494 patients. Aliment Pharmacol Ther 2014;39:1180–1193. [DOI] [PubMed] [Google Scholar]
- 21. Child CG, Turcotte JG. Surgery and portal hypertension. Major Probl Clin Surg 1964;1:1–85. [PubMed] [Google Scholar]
- 22. Shaheen AA, Myers RP. Diagnostic accuracy of the aspartate aminotransferase‐to‐platelet ratio index for the prediction of hepatitis C‐related fibrosis: a systematic review. Hepatology 2007;46:912–921. [DOI] [PubMed] [Google Scholar]
- 23. Silva LD, Cunha CC, Cunha LR, Araújo RF, Barcelos VM, Menta PL, et al. Depression rather than liver impairment reduces quality of life in patients with hepatitis C. Rev Bras Psiquiatr 2015;37:21–30. [DOI] [PubMed] [Google Scholar]
- 24. Parra FC, Amado RC, Lambertucci JR, Rocha J, Antunes CM, Pena SD. Color and genomic ancestry in Brazilians. Proc Natl Acad Sci U S A 2003;100:177–182. [DOI] [PMC free article] [PubMed] [Google Scholar]
- 25. Petta S, Cammà C, DI Marco V, Calvaruso V, Enea M, Bronte F, et al. Insulin resistance is a major determinant of liver stiffness in nondiabetic patients with HCV genotype 1 chronic hepatitis. Aliment Pharmacol Ther 2009;30:603–613. [DOI] [PubMed] [Google Scholar]
- 26. Services UDoHaH (2016) Dietary guidelines for Americans 2015‐2020. https://health.gov/dietaryguidelines/2015/. Accessed 8 Nov 2017.
- 27. Hallal PC, Cordeira K, Knuth AG, Mielke GI, Victora CG. Ten‐year trends in total physical activity practice in Brazilian adults: 2002‐2012. J Phys Act Health 2014;11:1525–1530. [DOI] [PubMed] [Google Scholar]
- 28. Mancia G, Fagard R, Narkiewicz K, Redon J, Zanchetti A, Böhm M, et al. 2013 ESH/ESC practice guidelines for the management of arterial hypertension. Blood Press 2014;23:3–16. [DOI] [PubMed] [Google Scholar]
- 29. American Diabetes Association . Diagnosis and classification of diabetes mellitus. Diabetes Care 2014;37:S81–S90. [DOI] [PubMed] [Google Scholar]
- 30. World Health Organization . Physical status: the use and interpretation of anthropometry. Report of a WHO Expert Committee. World Health Organ Tech Rep Ser 2015. http://www.who.int/childgrowth/publications/physical_status/en/. Accessed 8 Nov 2017 [PubMed] [Google Scholar]
- 31. Lipschitz DA. Screening for nutritional status in the elderly. Prim Care 1994;21:55–67. [PubMed] [Google Scholar]
- 32. Frisancho AR. Anthropometric standards for the assessment of growth and nutritional status. University of Michigan Press: Ann Arbor; 1990. [Google Scholar]
- 33. Ignacio de Ulíbarri J, González‐Madroño A, de Villar NG, González P, González B, Mancha A, et al. CONUT: a tool for controlling nutritional status. First validation in a hospital population. Nutr Hosp 2005;20:38–45. [PubMed] [Google Scholar]
- 34. Kim J, Wang Z, Heymsfield SB, Baumgartner RN, Gallagher D. Total‐body skeletal muscle mass: estimation by a new dual‐energy X‐ray absorptiometry method. Am J Clin Nutr 2002;76:378–383. [DOI] [PubMed] [Google Scholar]
- 35. Schousboe JT, Shepherd JA, Bilezikian JP, Baim S. Executive summary of the 2013 International Society for Clinical Densitometry Position Development Conference on bone densitometry. J Clin Densitom 2013;16:455–466. [DOI] [PubMed] [Google Scholar]
- 36. Brandão CM, Camargos BM, Zerbini CA, Plapler PG, Mendonça LM, Albergaria BH, et al. 2008 official positions of the Brazilian Society for Clinical Densitometry ‐ SBDens. Arq Bras Endocrinol Metabol 2009;53:107–112. [DOI] [PubMed] [Google Scholar]
- 37. WHO . Assessment of fracture risk and its application to screening for postmenopausal osteoporosis: report of a WHO study group [meeting held in Rome from 22 to 25 June 1992], 1994. [PubMed]
- 38. Baumgartner RN, Koehler KM, Gallagher D, Romero L, Heymsfield SB, Ross RR, et al. Epidemiology of sarcopenia among the elderly in New Mexico. Am J Epidemiol 1998;147:755–763. [DOI] [PubMed] [Google Scholar]
- 39. da Silva Alexandre T, de Oliveira Duarte YA, Ferreira Santos JL, Wong R, Lebrão ML. Sarcopenia according to the European Working Group on Sarcopenia in Older People (EWGSOP) versus Dynapenia as a risk factor for disability in the elderly. J Nutr Health Aging 2014;18:547–553. [DOI] [PubMed] [Google Scholar]
- 40. Lourenço RA, Pérez‐Zepeda M, Gutiérrez‐Robledo L, García‐García FJ, Rodríguez ML. Performance of the European Working Group on Sarcopenia in Older People algorithm in screening older adults for muscle mass assessment. Age Ageing 2015;44:334–338. [DOI] [PubMed] [Google Scholar]
- 41. Luna‐Heredia E, Martín‐Peña G, Ruiz‐Galiana J. Handgrip dynamometry in healthy adults. Clin Nutr 2015;24:250–258. [DOI] [PubMed] [Google Scholar]
- 42. Lauretani F, Russo CR, Bandinelli S, Bartali B, Cavazzini C, Di Iorio A et al Age‐associated changes in skeletal muscles and their effect on mobility: an operational diagnosis of sarcopenia. J Appl Physiol (1985) 2003;95:1851–1860. [DOI] [PubMed] [Google Scholar]
- 43. Baumgartner RN. Body composition in healthy aging. Ann N Y Acad Sci 2000;904:437–448. [DOI] [PubMed] [Google Scholar]
- 44. Hafez T. Modification of Diet in Renal Disease (MDRD) estimated glomerular filtration rate (eGFR) formula. Am J Cardiol 2007;99:584. [DOI] [PubMed] [Google Scholar]
- 45. Sharma A, Tian F, Yin MT, Keller MJ, Cohen M, Tien PC. Association of regional body composition with bone mineral density in HIV‐infected and HIV‐uninfected women: women's interagency HIV study. J Acquir Immune Defic Syndr 2012;61:469–476. [DOI] [PMC free article] [PubMed] [Google Scholar]
- 46. Ho‐Pham LT, Nguyen UD, Nguyen TV. Association between lean mass, fat mass, and bone mineral density: a meta‐analysis. J Clin Endocrinol Metab 2014;99:30–38. [DOI] [PubMed] [Google Scholar]
- 47. Nakchbandi IA. Osteoporosis and fractures in liver disease: relevance, pathogenesis and therapeutic implications. World J Gastroenterol 2014;20:9427–9438. [DOI] [PMC free article] [PubMed] [Google Scholar]
- 48. Lupoli R, Di Minno A, Spadarella G, Ambrosino P, Panico A, Tarantino L, et al. The risk of osteoporosis in patients with liver cirrhosis: a meta‐analysis of literature studies. Clin Endocrinol (Oxf) 2016;84:30–38. [DOI] [PubMed] [Google Scholar]
- 49. Orsini LG, Pinheiro MM, Castro CH, Silva AE, Szejnfeld VL. Bone mineral density measurements, bone markers and serum vitamin D concentrations in men with chronic non‐cirrhotic untreated hepatitis C. PLoS One 2013;8:e81652. [DOI] [PMC free article] [PubMed] [Google Scholar]
- 50. Heymsfield SB, Smith R, Aulet M, Bensen B, Lichtman S, Wang J, et al. Appendicular skeletal muscle mass: measurement by dual‐photon absorptiometry. Am J Clin Nutr 1990;52:214–218. [DOI] [PubMed] [Google Scholar]
- 51. Frost HM. On our age‐related bone loss: insights from a new paradigm. J Bone Miner Res 1997;12:1539–1546. [DOI] [PubMed] [Google Scholar]
- 52. DiGirolamo DJ, Kiel DP, Esser KA. Bone and skeletal muscle: neighbors with close ties. J Bone Miner Res 2013;28:1509–1518. [DOI] [PMC free article] [PubMed] [Google Scholar]
- 53. Mo C, Zhao R, Vallejo J, Igwe O, Bonewald L, Wetmore L, Brotto M. Prostaglandin E2 promotes proliferation of skeletal muscle myoblasts via EP4 receptor activation. Cell Cycle 2015;14:1507–1516. [DOI] [PMC free article] [PubMed] [Google Scholar]
- 54. Mo C, Romero‐Suarez S, Bonewald L, Johnson M, Brotto M. Prostaglandin E2: from clinical applications to its potential role in bone‐ muscle crosstalk and myogenic differentiation. Recent Pat Biotechnol 2012;6:223–229. [DOI] [PMC free article] [PubMed] [Google Scholar]
- 55. Dasarathy S, Merli M. Sarcopenia from mechanism to diagnosis and treatment in liver disease. J Hepatol 2016;65:1232–1244. [DOI] [PMC free article] [PubMed] [Google Scholar]
- 56. Silva LD, Bering T, Rocha GA. The impact of nutrition on quality of life of patients with hepatitis C. Curr Opin Clin Nutr Metab Care 2017;20:420–425. [DOI] [PubMed] [Google Scholar]
- 57. Montano‐Loza AJ. Clinical relevance of sarcopenia in patients with cirrhosis. World J Gastroenterol 2014;20:8061–8071. [DOI] [PMC free article] [PubMed] [Google Scholar]
- 58. Montano‐Loza AJ, Angulo P, Meza‐Junco J, Prado CM, Sawyer MB, Beaumont C, Esfandiari N, Ma M, Baracos VE. Sarcopenic obesity and myosteatosis are associated with higher mortality in patients with cirrhosis. J Cachexia Sarcopenia Muscle 2016;7:126–135. [DOI] [PMC free article] [PubMed] [Google Scholar]
- 59. Barbosa‐Silva TG, Bielemann RM, Gonzalez MC, Menezes AM. Prevalence of sarcopenia among community‐dwelling elderly of a medium‐sized South American city: results of the COMO VAI? study. J Cachexia Sarcopenia Muscle 2016;7:136–143. [DOI] [PMC free article] [PubMed] [Google Scholar]
- 60. Tyrovolas S, Koyanagi A, Olaya B, Ayuso‐Mateos JL, Miret M, Chatterji S, Tobiasz‐Adamczyk B, Koskinen S, Leonardi M, Haro JM. Factors associated with skeletal muscle mass, sarcopenia, and sarcopenic obesity in older adults: a multi‐continent study. J Cachexia Sarcopenia Muscle 2016;7:312–321. [DOI] [PMC free article] [PubMed] [Google Scholar]
- 61. Kazemi‐Bajestani SM, Becher H, Ghosh S, Montano‐Loza AJ, Baracos VE. Concurrent depletion of skeletal muscle, fat, and left ventricular mass in patients with cirrhosis of the liver. J Cachexia Sarcopenia Muscle 2016;7:97–99. [DOI] [PMC free article] [PubMed] [Google Scholar]
- 62. Heymsfield SB, Gonzalez MC, Lu J, Jia G, Zheng J. Skeletal muscle mass and quality: evolution of modern measurement concepts in the context of sarcopenia. Proc Nutr Soc 2015;74:355–366. [DOI] [PubMed] [Google Scholar]
- 63. Gonzalez MC, Correia MITD, Heymsfield SB. A requiem for BMI in the clinical setting. Curr Opin Clin Nutr Metab Care 2017;20:314–321. [DOI] [PubMed] [Google Scholar]
- 64. Gowda C, Compher C, Amorosa VK, Lo Re V 3rd. Association between chronic hepatitis C virus infection and low muscle mass in US adults. J Viral Hepat 2014;21:938–943. [DOI] [PMC free article] [PubMed] [Google Scholar]
- 65. Plauth M, Cabré E, Riggio O, Assis‐Camilo M, Pirlich M, Kondrup J, et al. ESPEN guidelines on enteral nutrition: liver disease. Clin Nutr 2006;25:285–294. [DOI] [PubMed] [Google Scholar]
- 66. von Haehling S, Morley JE, Coats AJS, Anker SD. Ethical guidelines for publishing in the Journal of Cachexia, Sarcopenia and Muscle: update 2015. J Cachexia Sarcopenia Muscle 2015;6:315–316. [DOI] [PMC free article] [PubMed] [Google Scholar]