

Abstract
Background
Diagnosing the extremes of superficial burns and of full-thickness burns is straightforward. It is in the middle ground of partial thickness burns where the diagnostic difficulties emerge; it can take up to 3–5 days for signs of healing to appear. We hypothesize that cooling partial thickness burns and tracking the rate of rewarming will immediately reflect the condition of the burn: shallow partial-thickness burns that retain cell health and blood flow will rewarm rapidly, whereas deeper burns with damaged microvessels will rewarm slowly.
Study Design
We enrolled 16 patients with isolated, partial-thickness burns on their extremities who were diagnosed as indeterminate by our burn surgeon. Within 24 hours after presentation, room–temperature saline was poured over the burn as a cooling challenge. An Infrared camera that was sensitive to body temperature produced false-color images showing pixel-by-pixel temperatures. A time-lapse recording from the IR camera images taken as the burn rewarmed produced a time-temperature curve that reflected the kinetics of rewarming. The outcome variable was whether or not the patient received a skin graft which was determined 72 hours after presentation.
Results
The method correctly predicted whether or not the patient required a skin graft.
Conclusions
Here we report a new technique that permits determination of wound viability far earlier than clinical examination. Due to the simplicity of the method, non-experts can successfully perform the technique on the first day of the burn and make the correct diagnosis: to graft or not to graft.
INTRODUCTION
The CDC estimated that over a million patients with burns required medical treatment in 2016 (1). Despite this burden of injury, there are only 60 burn centers that are verified by the American College of Surgeons and the American Burn Association (2, 3). These centers only care for 25% of burn patients, with the remaining 75% receiving medical care restricted to local emergency rooms and providers not specifically trained in burn management (4). Not every state has a burn center: for example the Burn Center in Denver services 6 western states, a catchment area of ~500,000 square miles. With an increasing number of hospitals closing their burn centers (5) and the looming shortage of fellowship-trained burn surgeons (2), there will be an increasing number of burn patients treated at facilities that not prepared to administer adequate burn care.
During the initial bedside presentation of partial-thickness burns even trained burn surgeons are only 50–60% correct (random) in their diagnosis (6, 7, 8). An accurate diagnosis for these surgeons requires 3–5 days post burn to determine whether the wound shows signs of healing. This problem of misdiagnoses leads to unnecessary skin grafts, increased hospital stays, and injuries that progress to full thickness burns. Without a graft, full thickness burns form contracture scars that can impede function and lead to disfigurement. The development of a practical method for determining whether partial thickness burns will heal or require skin grafting would revolutionize burn care not only in burn centers but also substantially benefit the 75% of burn patients who are not seen by burn specialists. Such a technique would transform health care givers by providing them with the expertise to make correct diagnoses.
The urgent need to invent a successful technique has driven scientists to explore multiple pathways to develop a practical diagnostic technique for burns (5, 9, 10, 11). Unfortunately, all of the currently available methods lack the qualities to make them universally adopted. One of the most thoroughly investigated techniques is based on infrared (IR) thermography (8, 11, 12, 13, 14, 15). This method measures the temperature of the burned area which accounts for both cell viability and perfusion. Previous IR methods used individual thermographic measurements to compare the burn temperature to adjacent non-burned skin to determine incremental changes in temperature over 24–48. These measurements have detected a difference as much as 2°C. These instruments, however, are exquisitely sensitive not only to the temperature of the burn but also to small temperature changes in the environment, such as another person walking into the room. These kinds of disturbances, impractical to control in a clinical environment, add significant noise to the IR signal. Recognizing the impossibility of controlling this kind of noise, we increased the signal by pouring room-temperature saline over the burn and measuring the rewarming rate with an IR detector over the next two minutes. This practical method increased the signal-to-noise ratio by half an order of magnitude. Due to the simplicity of the method, and the dramatic difference in rewarming rate of deep versus superficial burns (Fig. 1, 2), non-experts can successfully perform the technique on the first day of the burn and make the correct diagnosis (Fig. 3).
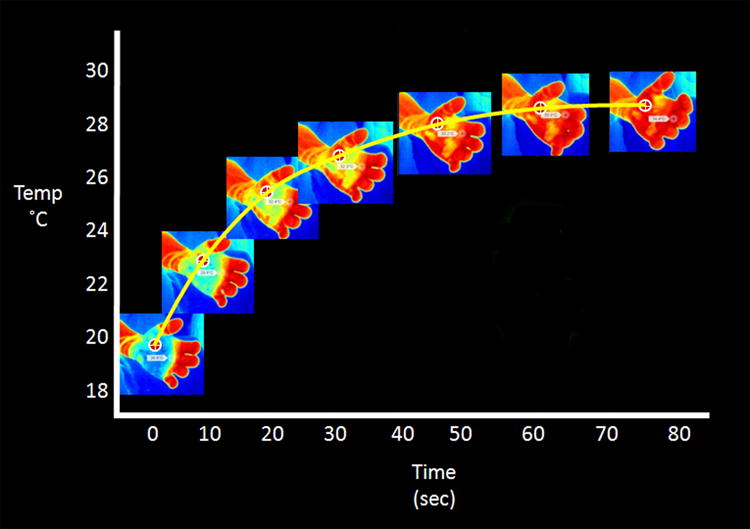
Figure 1.
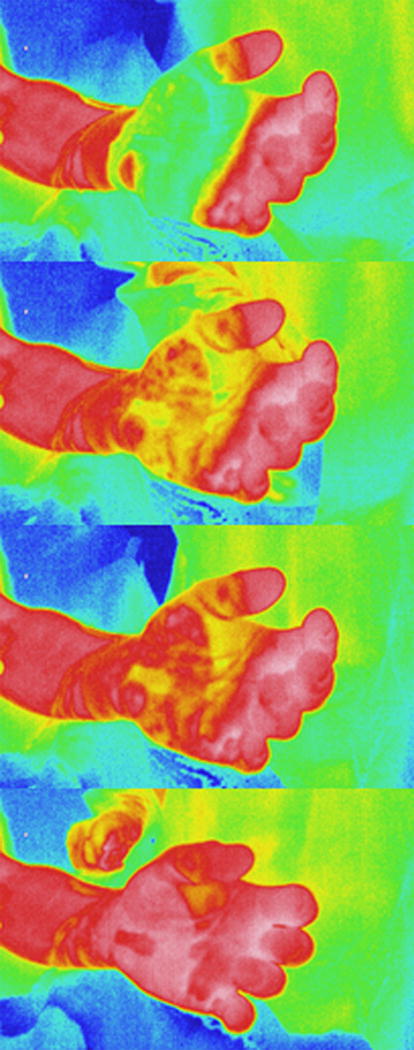
Selected images during the rewarming period representing real-time changes in color as the wound rewarms.
Figure 2.
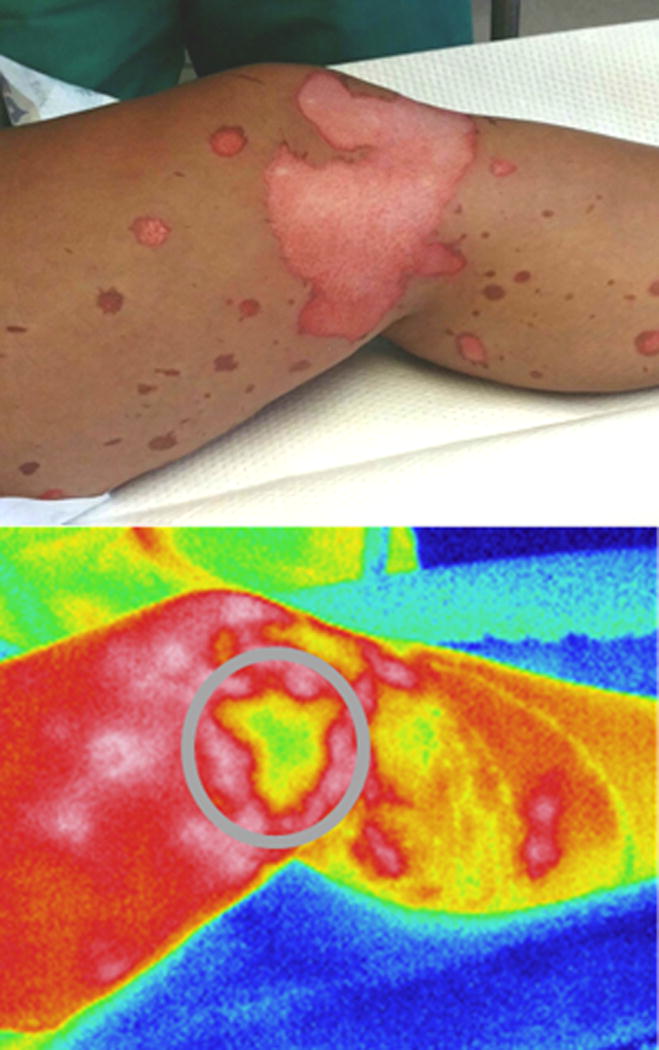
An indeterminate grease burn predicted to receive skin grafting based on the lack of rewarming in the central portion of the burn (highlighted with grey circle).
Figure 3.
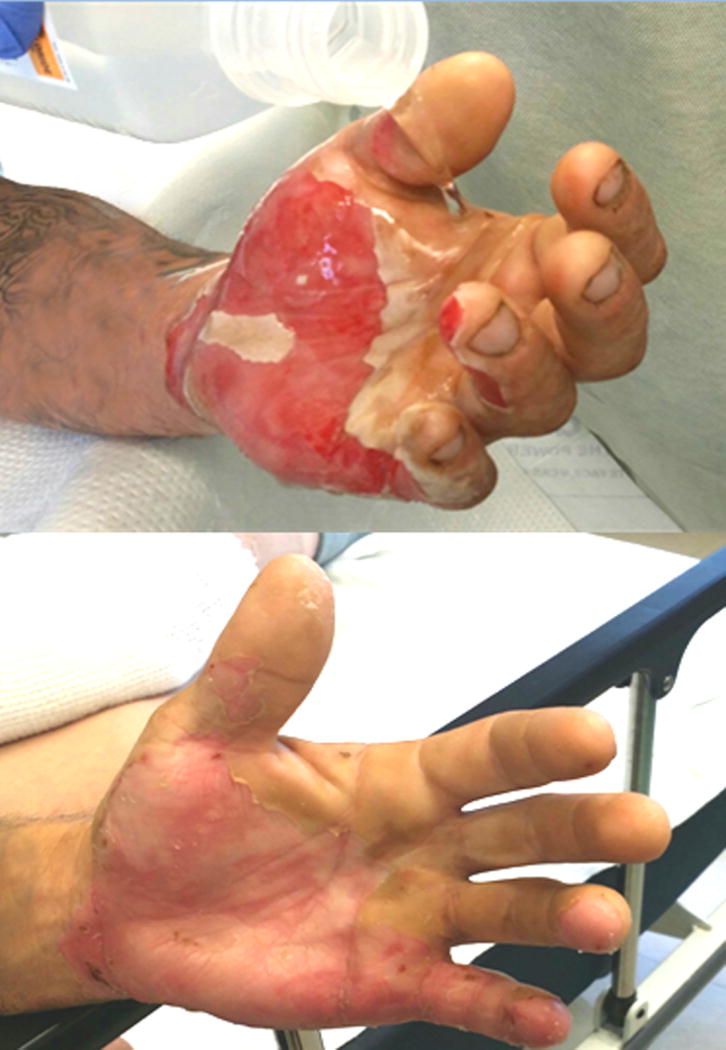
Indeterminate burn receiving saline pour (top) on the day of injury. This injury was predicted to heal based on our method of IR thermography (Figures 1, 3, and 7 are the same patient).
METHODS
Cohort Characteristics
These studies were approved by the University of South Alabama Institutional Review Board. We enrolled 16 patients between 3/2017-5/2017. Nine of these indeterminate burns healed and seven received a skin graft. The groups were similar in terms of gender, age, and comorbidity (Table 1).
TABLE 1.
Characteristics of the Cohort
| Characteristic | No graft | Graft |
|---|---|---|
| N | 9 | 7 |
| Male, % | 77.7 | 58 |
| Mean age, y ± SEM | 45.2±4.4 | 27.5±4.93 |
| Diabetes, % | 29 | 0 |
| Smoker, % | 67 | 29 |
| Mechanism, % | ||
| Flame | 44 | 43 |
| Grease | 44 | 57 |
| Water | 12 | 0 |
| Location of burn, % | ||
| Leg | 0 | 57 |
| Arm | 67 | 29 |
| Hand | 33 | 14 |
Specifications of IR device
A thermal imaging camera (Model TH, Therm-App® Opgal Optronic Industries Ltd., Karmiel, Israel) was powered by an Android™ smartphone with an operating Specifications of IR device: A thermal imaging camera (Model TH, Therm-App® Opgal Optronic Industries Ltd., Karmiel, Israel) was powered by an Android™ smartphone with an operating system of 4.1 or above (Fig. 4). The camera produced high resolution images (>110,000 pixels) in the far infrared (7–14 μm) making the camera sensitive to the temperature of the human body (37°C radiates at ~9 μm). The camera software automatically assigned false-colors to all parts of the image according to the temperature of each pixel.
Figure 4.
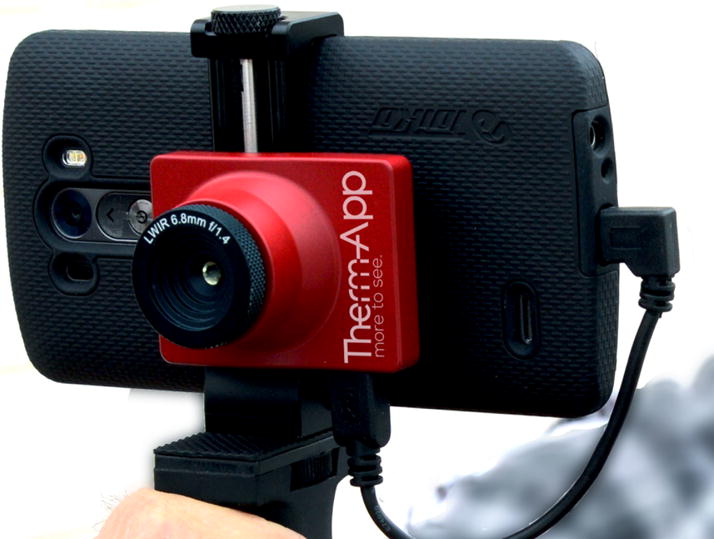
Infrared camera (Therm-App, model TH, Opgal, Karmiel, Israel) that is powered by and displayed by any Android cell phone (4.1 and above).
Preliminary Testing of Therm-App® IR camera
Before using the Therm-App® camera in patients, we systematically tested the device for a number of parameters. The testing laboratory was a small, isolated room with a single door, which provided stable temperatures. To develop a gold standard for accuracy, a calibrated thermocouple (Raytek, Thermalert, Montreal) was physically paired with a calibrated thermistor (Physitemp, Clifton, NJ). When measuring a range of temperatures, the average temperature of the thermistor was 32.27°C and the thermocouple was 32.46°C (n =27). The gold standard was accepted as the average of the measurements from the probes. The probes were sensitive as shown by small changes in the ambient temperature. For example if an investigator entered the laboratory, the ambient temperature was altered (Fig. 5). The relationship between the probes was linear over a range of 20°C as shown by Pearson correlation coefficient (r) of 0.995. We conclude that the probes were linear, reproducible, precise, and accurate. Drift over a one hour period was small (<0.05°C). For stabilization, the thermocouple and thermistor were placed in the middle of a 3-liter, doubly insulated container filled with water. A heat exchanger in the water was attached to a heating circulator (Julabo ME-4, Seelbach, Germany) that provided temperature uniformity better than ±0.01 °C. Based on the stability of the probe measurements the water was stable over 1 – 3 hours. As the probe measurements were made over time, the lens of the Therm-App® camera was focused 1 cm from the probes. Using the average of the probes as the gold standard for each of the 27 measurements, the IR camera correlated closely with the gold standard demonstrating linearity (Fig. 6, Pearson’s r = 0.968). The average of the IR camera temperature over time was 32.28±0.13 compared to the gold standard 32.79±0.05, a difference of 0.3°C. Drift over a one hour period for the IR camera was <0.3°C (Fig. 6). We conclude the temperature measurements from the Therm-App® camera were sensitive, linear, precise, stable, reproducible, and accurate.
Figure 5.
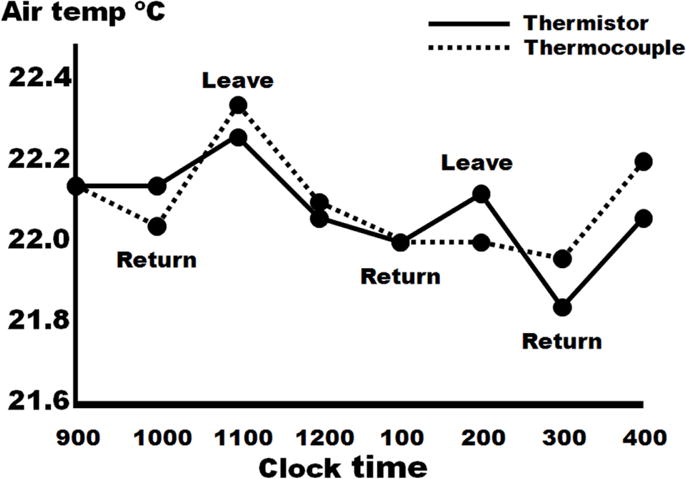
Changes in ambient temperature due to someone entering or leaving the laboratory. By using gold standard techniques of temperature measurement, a thermistor and thermocouple, this experiment demonstrates the sensitivity to small changes in ambient temperature.
Figure 6.
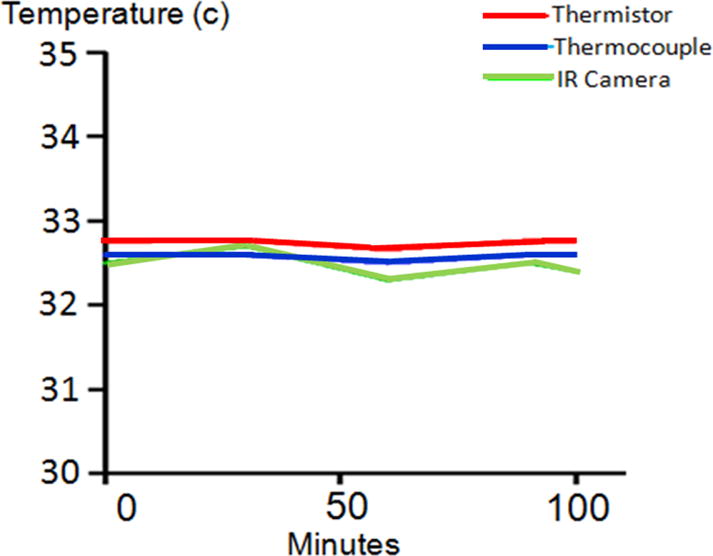
The Therm-App device demonstrates accuracy and no significant drift (accuracy over time is <0.3°C over 100 minutes).
Study design
We enrolled consecutive patients with isolated extremity deep-partial thickness burns that were initially diagnosed as indeterminate depth by the burn surgeon (SAK or SBP). The planned observation period was 3–5 days for signs of healing. Within 24 hours after the burn, room-temperature saline was poured to cool the burn (30 sec, 500–1,000 mL according to burn size). The Therm-App® camera was programmed to take single IR images every 5 sec for 2 min producing a time-lapse motion picture consisting of 24 images. The images were then analyzed by IRT Cronista® analysis software (GRAYESS® Bradenton, FL). The software allowed point-by-point recording of temperatures anywhere on the burn. This permitted placement of a region of interest (ROI) where the minimum, mean, and maximum temperature was measured. Using the last image taken after two minutes of rewarming, a 2×2 cm ROI was placed on the area of least heat reacquisition within the wound. The ROI was then applied to the exact area on every image taken after the cooling challenge to produce a time-temperature graph (Fig. 7). A static temperature from non-burned skin, which did not receive the saline, was also measured. The primary outcome variable was whether the patient received a skin graft. For the collection of these data, the thermography technician and the burn surgeons were blinded to prevent bias.
Figure 7.
The region of interest can be applied to the exact area on every image taken after the cooling challenge to produce a time-temperature graph.
Data Analysis
Data was analyzed using Graphpad Prism software. Fisher’s exact test, two-tailed t-test, and two-tailed Mann-Whitney-Wilcoxon test were used for contingency, parametric, and non-parametric variables, respectively. Statistical significance was defined as p<0.05. Receiver operating curve analysis, Area Under Receiver Operating Curve (AUROC), was performed based on temperature change over time as well as temperature difference to surrounding skin.
RESULTS
Kinetics of heat reacquisition
To determine if heat reacquisition predicted the need for a skin graft, the average temperature in each 2×2 cm ROI was plotted according to time. Burns that healed spontaneously rewarmed more rapidly than those ultimately requiring skin graft (Fig. 8). The slope of the temperature curve was defined as the temperature change per second over 120 seconds after cooling with saline. The overall slope of the temperature curve was significantly greater in those that did not require a skin graft compared to the ones grafted (0.12 ± 0.02°F vs. 0.04 ± 0.02°F, respectively; p <0.01), with an optimal sensitivity and specificity of 86% and 78% (AUROC=0.86). As shown in Figure 9, the majority of wounds in both groups reached their steady state temperature within 60 sec. However, as rewarming was not linear, and a subset of both groups continued to re-warm throughout the measurement period, the absolute temperature change was analyzed over the rewarming period (healed vs grafted 14.0 ± 2.0°F vs. 5.1 ± 1.8°F, p <0.05).
Figure 8.
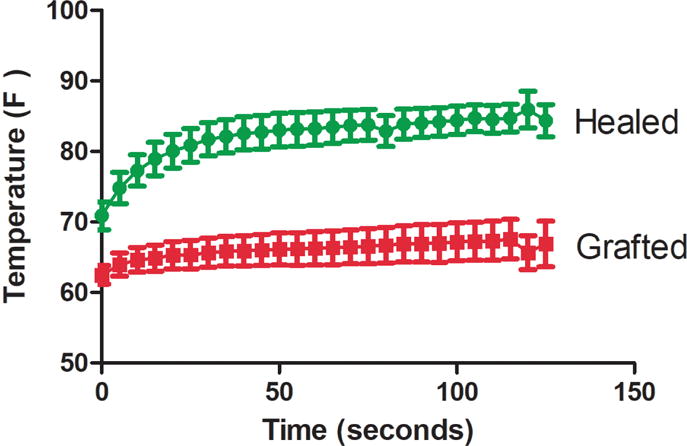
Temperature curves during the 120 second rewarming period are significantly different between groups (AUROC = 0.86). Each time point represents the mean temperature (±SEM) for the respective groups.
Figure 9.
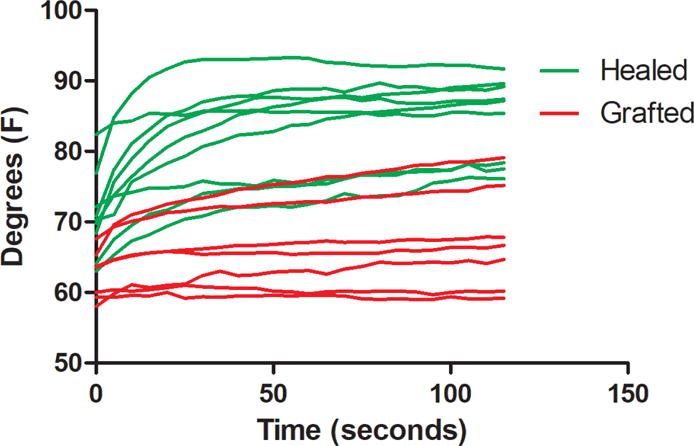
Time-temperature curves are shown for each patient during the 120 second reheating phase. The kinetics of heat reacquisition appear in three groups: (green curves) steep temperature slopes and plateaus predicting no graft was performed, (red curves) shallow slopes and low plateaus predicting skin grafting was performed, and a small overlapping group in the middle.
Active Delta Temperature (ΔT)
Previous studies have determined that static measurements of ΔT (temperature of burn minus non-burned skin) have shown statistical differences between depths of injury (8, 13, 14, 16). We measured the difference in temperature between non-burned skin to the temperature of the burn at 120 seconds after the cooling challenge as a surrogate for perfusion—and thus potential regenerative capacity. The temperature difference at 120 seconds was significantly different between groups (healed vs grafted: 1.76 ± 0.97°F vs. −10.5 ± 1.0°F, p <0.001. AUROC = 1.0, Fig. 10). Spontaneously healing burns were of similar temperature if not warmer than adjacent healthy skin, while burns requiring grafts were significantly cooler. The measured difference in temperature at 120 seconds was a half order of magnitude greater than previously reported (8, 13, 14, 16). Temperature differences at 60 seconds had similar predictive value (healed vs grafted: 0.08 ± 1.5 vs. −11.59 ± 0.9. p<0.001. AUROC=1.0).
Figure 10.
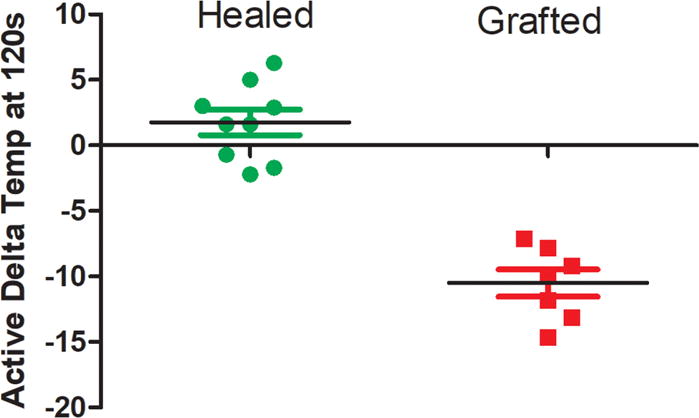
The active delta temperature at 120 seconds during the rewarming phase successfully predicted outcome (AUROC 1.0). The temperature of the burn 120 seconds after the cooling challenge subtracted from the temperature of adjacent non-burned skin. Burns that did not require a skin graft were often of higher temperature after 120 seconds of reheating than surrounding non-burned skin which did not receive the cooling saline.
DISCUSSION
Performing a skin graft over a deep partial thickness or a full thickness burn permits a more functional scar to form, speeds time to healing, and prevents additional problems such as infection. Although deeper burns lack the essential elements for healing, it is not possible to visually determine whether partial thickness burns have adequate microcirculatory perfusion and cellular viability to heal without severe scar formation. Because this is such a complex dynamic process, accurately diagnosing whether partial thickness burns will heal at initial presentation is essentially random (6, 7, 8).
In our cohort of patients with indeterminate partial thickness burns, our technique of measuring the reheating kinetics using IR thermography within 24 hours of injury was able to accurately determine whether the partial thickness burn would heal spontaneously or require a skin grafting. This practical technique involves cooling the burn by pouring room-temperature saline onto the wound and tracking the temperature of the wound as it rewarms. These results show the difference in temperature between non-burned skin (that did not receive the saline pour) and the burn after 120 seconds of rewarming delineates whether patients require a skin graft compared to those that did not (AUROC 1.0). The temperature change over the reheating phase was also predictive of receiving a skin graft (AUROC 0.86).
Several issues related to the current method need to be considered. There was a small overlapping group shown in Figure 9. Careful subgroup analysis was performed on the overlapping group, by observing the color images during the reheating phase. These burns appear to be heterogeneous in depth, suggesting that much of the burn would heal but small areas may have deeper injury and form thicker scars. Although a burn surgeon may not graft a wound that only has a small area of full thickness injury, the overlap suggests that our method of creating one 2×2 cm area as ROI will not account for burns with large heterogeneous areas. Using a larger ROI in combination with measuring outcomes of scar thickness and biopsies will be necessary in future studies. Although active ΔT differentiated the outcomes in this study, a larger cohort will be necessary to determine the individual importance of slope, plateau, and active ΔT. A power analysis based on our data suggests approximately 200 measurements will be necessary in future studies to resolve these questions. Also, the effect of comorbidities that may alter wound healing are completely unexplored.
Using infrared thermography to assess burn depth is not new (8, 11, 12, 13, 14, 15). Most studies using IR thermography have examined “static” measurements by measuring temperature changes during intervals over 24–48 hours or by comparing the burn to adjacent non-burned skin. These static measurements have shown a difference as much as 2°C. However, IR thermography is highly sensitive to small changes in the environment, such as another person walking into the room (Fig. 5) causing measurable temperature changes in the IR signal from the burn. While testing the Therm-App® device for accuracy and drift, we think that it is unlikely any experimental protocol using static IR thermographic imaging will be able to control for all the variables in the clinical setting that may contribute to a temperature change as small as 2°C.
In 2006, Renkielska et al. reported using heat excitation using halogen lamps to warm the burned skin of swine and measured the rate of heat transfer using infrared imaging (16). The same group later changed the thermal stimulus by cooling the burned skin with a carbon dioxide and air mixture directed under pressure at the wound (8). They measured heat reacquisition which produced results similar to the current study. Regardless of the ability of this and many other methods to measuring burn thickness, these approaches remain research instruments because they are often limited by more practical clinical concerns such as cost, portability, or invasiveness.
CONCLUSION
We report the development of new infrared technique that is simple and permits accurate determination of burn viability much earlier than clinical examination. The technique is a rapid, practical, and objective method for determining which partial thickness burns will heal spontaneously and which will require skin grafting to minimize debilitating scar formation.
Acknowledgments
Support: Dr Simmons is supported by the American College of Surgeons (Clowes Award 2014– 2019) and the National Institutes of Health (K08 GM109113).
Footnotes
Publisher's Disclaimer: This is a PDF file of an unedited manuscript that has been accepted for publication. As a service to our customers we are providing this early version of the manuscript. The manuscript will undergo copyediting, typesetting, and review of the resulting proof before it is published in its final citable form. Please note that during the production process errors may be discovered which could affect the content, and all legal disclaimers that apply to the journal pertain.
Disclosure Information: Nothing to disclose.
Presented at the Southern Surgical Association 129th Annual Meeting, Hot Springs, VA, December 2017.
References
- 1.American Burn Association. Burn Incidence and Treatment in the United States: 2011 Fact Sheet. http://www.ameriburn.org/resources_factsheet.php.
- 2.Ortiz-Pujols SM, Thompson K, Sheldon GF, et al. Burn care: Are there sufficient providers and facilities? Bull Am Coll Surg. 2011;96:33–37. [PubMed] [Google Scholar]
- 3.Zonies D, Mack C, Kramer B, et al. Verified centers, nonverified centers, or other facilities: A national analysis of burn patient treatment facility. J Am Coll Surg. 2010;210:299–305. doi: 10.1016/j.jamcollsurg.2009.11.008. [DOI] [PMC free article] [PubMed] [Google Scholar]
- 4.American Burn Association. List of verified burn centers. Available at: www.ameriburn.org/verification_verifiedcenters.php. Accessed: July 27, 2011.
- 5.Poovey B. Hospitals are shutting down burn centers. Washington Post. 2007 Aug 8; Available at: http://www.washingtonpost.com/wp-dyn/content/article/2007/08/08/AR2007080800272.html. Accessed September 22, 2011.
- 6.Johnson R, Richard R. Partial-thickness burns: identification and management. Adv Skin Wound Care. 2003;4:178. doi: 10.1097/00129334-200307000-00010. [DOI] [PubMed] [Google Scholar]
- 7.Monstrey S, Hoeksema H, Verbelen J, et al. Assessment of burn depth and burn wound healing potential. Burns. 2008;6:761–769. doi: 10.1016/j.burns.2008.01.009. [DOI] [PubMed] [Google Scholar]
- 8.Renkielska A, Kaczmarek M, Nowakowski A, et al. Active dynamic infrared thermal imaging in burn depth evaluation. J Burn Care Res. 2014;35:e294–303. doi: 10.1097/BCR.0000000000000059. [DOI] [PubMed] [Google Scholar]
- 9.Park DH, Hwang JW, Jang KS, et al. Use of laser Doppler flowmetry for estimation of the depth of burns. Plast Reconstr Surg. 1998;101:1516–1523. doi: 10.1097/00006534-199805000-00014. [DOI] [PubMed] [Google Scholar]
- 10.Niazi ZB, Essex TJ, Papini R, et al. New laser Doppler scanner, a valuable adjunct in burn depth assessment. Burns. 1993;6:485–489. doi: 10.1016/0305-4179(93)90004-r. [DOI] [PubMed] [Google Scholar]
- 11.Burke-Smith A, Collier J, Isabel Jones I. A comparison of non-invasive imaging modalities: Infrared thermography, spectrophotometric intracutaneous analysis and laser Doppler imaging for the assessment of adult burns. Burns. 2015;41:1695–1707. doi: 10.1016/j.burns.2015.06.023. [DOI] [PubMed] [Google Scholar]
- 12.Mladick R, Georgiade N, Thorne F. A clinical evaluation of the use of thermography in determining degree of burn injury. Plast Reconstr Surg. 1966;38:512–518. doi: 10.1097/00006534-196638060-00003. [DOI] [PubMed] [Google Scholar]
- 13.Singer A, Relan P, Leonelle B, et al. Infrared thermal imaging has the potential to reduce unnecessary surgery and delays to necessary surgery in burn patients. J Burn Care Res. 2015;37:294–303. doi: 10.1097/BCR.0000000000000330. [DOI] [PubMed] [Google Scholar]
- 14.Burmeister DM, Cerna C, Becerra SC, et al. Noninvasive techniques for the determination of burn severity in real time. J Burn Care Res. 2017;38:e180–e191. doi: 10.1097/BCR.0000000000000338. [DOI] [PubMed] [Google Scholar]
- 15.Miccio J, Parikh S, Marinaro X, et al. Forward-looking infrared imaging predicts ultimate burn depth in a porcine vertical injury progression model. Burns. 2016;42:397–404. doi: 10.1016/j.burns.2015.07.006. [DOI] [PubMed] [Google Scholar]
- 16.Renkielska A, Nowakowski A, Kaczmarek M, Ruminski J. Burn depths evaluation based on active dynamic IR thermal imaging–a preliminary study. Burns. 2006;32:867–875. doi: 10.1016/j.burns.2006.01.024. Epub 2006 Sep 25. [DOI] [PubMed] [Google Scholar]