

Abstract
Background
Circulating branched-chain amino acids (BCAAs; isoleucine, leucine, valine) are strong predictors of type 2 diabetes (T2D), but their association with cardiovascular disease (CVD) is uncertain. We hypothesized that plasma BCAAs are positively associated with CVD risk, and evaluated whether this was dependent on an intermediate diagnosis of T2D.
Methods
Participants enrolled in the Women’s Health Study prospective cohort were eligible if free of CVD at baseline blood collection (N=27,041, mean baseline age=54.7 years). Plasma BCAA metabolites were measured via NMR spectroscopy, ln-transformed, and standardized for analysis. Multivariable Cox regression models estimated hazard ratios (HRs) and 95% CIs for total and individual BCAAs with incident CVD (myocardial infarction [MI], stroke, coronary revascularization).
Results
We confirmed 2,207 CVD events over a mean 18.6 years of follow-up. Adjusting for age, BMI, smoking, diet, physical activity, and other established CVD risk factors, total BCAAs were positively associated with CVD (per SD HR=1.13, CI=1.08 to 1.18), comparable in magnitude to modeling the association of LDL cholesterol with CVD (per SD HR=1.12, CI=1.07 to 1.17). In particular, BCAAs were associated with coronary events (MI: per SD HR=1.16, CI=1.06 to 1.26; revascularization: per SD HR=1.17, CI=1.11 to 1.25), but not with stroke (per SD HR=1.07, CI=0.99 to 1.15). Isoleucine, leucine, and valine were each separately associated with CVD (p<0.05). The BCAA-CVD association was greater (p-interaction=0.036) among women who developed T2D prior to CVD (HR=1.20, CI=1.08 to 1.32), vs. women without T2D (HR=1.08, CI=1.03 to 1.14). Adjusting for LDL-C, an established CVD risk factor, did not attenuate these findings; however, adjusting for HbA1c and insulin resistance, cardiometabolic biomarkers that may be downstream mediators of risk, eliminated the associations of BCAAs with CVD.
Conclusions
Circulating plasma BCAAs were positively associated with incident CVD in a prospective cohort of US women. Impaired BCAA metabolism may represent a shared pathway of metabolic dysfunction that links T2D and CVD, and plasma BCAAs may capture the long-term cardiometabolic risks of this common etiology, in particular among women who develop T2D prior to a CVD event.
Keywords: Diabetes, Type 2, Cardiovascular Disease, metabolomics, amino acids, epidemiology
Journal Subject Terms: Women, Biomarkers
Introduction
Accumulating evidence implicates alterations in branched-chain amino acid (BCAA) metabolism as a feature of poor cardiometabolic health. BCAAs (isoleucine, leucine, and valine) have been associated with a number of cardiometabolic risk factors in cross-sectional studies, including anthropometric measures of excess body weight and adiposity, impaired fasting glucose, insulin resistance, elevated blood pressure, dyslipidemia, and indicators of coronary artery disease.1–5 Mechanisms underlying the role of BCAAs and disease risk have long been appreciated, and may include their interruption in insulin signaling and chronic mammalian target of rapamycin (mTOR) activation.6–8 Alternatively, elevated circulating BCAA levels may be a result of impaired catabolism or clearance, i.e. a consequence of a disease process rather than an upstream cause.9–11 Only a prospective study design can address the limitations of previous cross-sectional evidence.
While BCAAs have been consistently associated with an elevated risk of type 2 diabetes (T2D) in epidemiologic studies,12–14 few prior studies have conducted targeted prospective analyses of BCAAs in relation to incident CVD events. Since elevations in BCAAs may represent a biochemical phenotype of cardiometabolic risk common to T2D and CVD (the “common soil” hypothesis),15–17 and given the compelling evidence for BCAAs as predictors of T2D and intermediate CVD phenotypes and risk factors, we hypothesized that higher baseline levels of plasma BCAAs would be associated with an elevated risk of incident CVD events. We postulated that the BCAA-CVD relationship would be related to shared cardiometabolic risk pathways and evaluated whether this relationship was dependent on an intermediate diagnosis of T2D. Therefore, we conducted a prospective targeted analysis of BCAAs in relation to incident CVD in 27,041 apparently healthy US women with >18 years of follow-up for incident CVD and T2D, and examined whether BCAAs were associated with CVD independent of their association with incident T2D.
Methods
The data that support the findings of this study are available from the corresponding author upon reasonable request. Use of the data via this mechanism is overseen by standard Women’s Health Study policies and procedures, which assure that participant consents are honored.
Study Population
The Women’s Health Study (WHS) is an on-going long-term prospective observational cohort of US women that started as a randomized placebo-controlled factorial trial of low-dose aspirin, β-carotene, and vitamin E for the primary prevention of cardiovascular disease and cancer (NCT00000479). The trial randomized 39,876 female US health professionals aged 45 years or older without a history of cancer (except non-melanoma skin cancer) or CVD, and ran from 1993 to 2004.18, 19 The WHS continues to follow participants annually on an observational basis. At baseline, participants were also asked if they would be willing (but not required) to provide a baseline blood sample; 28,345 women did so, and blood samples were collected and shipped on ice via overnight courier to the central laboratory where they were processed and stored at -170 degrees C in vapor liquid nitrogen until biomarker measurements were performed. Baseline characteristics of those contributing blood samples did not differ from those who did not, with the exception of current smoking status (11.7% vs. 16.8%, respectively) and total physical activity energy expenditure (median 599 kcal/week vs. 526 kcal/week).20 Questionnaires captured information on demographics, health status, reproductive history, and lifestyle characteristics. Written informed consent was obtained from all participants and the study protocol was approved by the Institutional Review Board of the Brigham and Women’s Hospital (Boston, MA).
BCAA Laboratory Methods
Targeted metabolites were previously quantified in the WHS baseline blood samples. Briefly, aliquots of the baseline blood samples were shipped on dry ice blinded to case status. Isoleucine, leucine, and valine were measured by proton nuclear magnetic resonance (1H NMR) spectroscopy at LipoScience, Inc, now LabCorp®, on EDTA plasma samples using a NMR Profiler, a 400MHz NMR platform, as described for the NMR LipoProfile® test.21, 22 To quantify BCAAs, the NMR spectra were deconvoluted using proprietary software with models containing reference spectra from serum proteins, BCAAs, and lipoproteins. The derived amino acid signal amplitudes were converted to μmol/L using a factor that was empirically determined using dialyzed serum samples spiked with known amounts of each amino acid. The intra- and inter-assay coefficients of variation for the amino acid assays are: isoleucine 5.9-6.1%, leucine 4.5-4.9%, and valine 1.5-2.1%.
Ascertainment of Incident Cardiovascular Disease
We evaluated a composite endpoint of CVD defined as first confirmed nonfatal or fatal myocardial infarction (MI), stroke, or revascularization (coronary artery bypass surgery or percutaneous coronary intervention), and secondarily investigated these endpoint categories individually. Follow-up included the ascertainment of health outcomes every 6 months in the first year, and annually thereafter (through the end of 2016). Through written consent, medical records were obtained and reviewed by a committee of physicians blinded to treatment assignment. MI was confirmed if symptoms met the World Health Organization criteria in addition to elevated levels of cardiac enzymes or diagnostic electrocardiograms. The committee confirmed stroke events if there was documentation of a sudden onset of a new neurologic deficit persisting for >24 hours or until death <24 hours.23 Deaths due to cardiovascular causes were confirmed by autopsy reports, death certificates, medical records, and next of kin or family members. As previously described, we confirmed incident T2D cases identified through self-report on annual questionnaires via a physician-administered telephone interviews or supplemental questionnaire,24 using the American Diabetes Association diagnostic criteria.25, 26
Assessment of Covariates
Participants self-reported a number of health-related characteristics, lifestyle, family history of premature (<60 years old) MI in either parent, and other risk factors via questionnaires at baseline. Diet was assessed via a validated 131-item semi-quantitative food frequency questionnaire (FFQ).27, 28 The baseline validated 29 physical activity questionnaire 30 asked participants their average time per week spent engaged in recreational activity domains (e.g., walking, running, bicycling), flights of stairs climbed daily, and their usual walking pace. Participants reported whether they had any history of type 2 diabetes, high cholesterol, or hypertension among the list of physician-diagnosed illnesses on each questionnaire. Self-reported type 2 diabetes was previously validated in the WHS with >91% positive predictive value.31 The baseline questionnaire also collected self-reported information on use of antihypertensive treatment, cholesterol-lowering medication, systolic and diastolic blood pressure, and cholesterol levels. In this study, hypertension is defined as self-report of a physician diagnosis, past or current antihypertensive treatment, systolic blood pressure ≥140 mmHg, or diastolic blood pressure ≥90 mmHg. Self-reported history of a hypertension diagnosis was previously validated among a similar cohort of US health professionals with excellent confirmation (100%) against medical records using these blood pressure cut-points.32 Finally, high cholesterol is defined as self-report of a physician diagnosis or use of cholesterol-lowering medication. In addition, we also had measured baseline levels of standard lipids, inflammatory, and glucose metabolism biomarkers, including hemoglobin A1c (Hba1c),33 lipoprotein insulin resistance score (LPIR),34, 35 GlycA (glycosylated acute phase proteins),36 triglyceride (TG) levels, low density lipoprotein (LDL) cholesterol concentration, high density lipoprotein (HDL) cholesterol concentration, and high sensitivity C-reactive protein (hsCRP).
Statistical Analysis
The metabolite concentrations were natural log (ln) transformed and standardized values to a mean of 0 and a standard deviation (SD) of 1. Total BCAAs were the sum of isoleucine, leucine, and valine metabolite levels. We compared the characteristics of participants at baseline across quintiles of total BCAA levels calculating tests for trend. The Alternative Health Eating Index 2010 (aHEI-2010) dietary pattern score was calculated from individual food and nutrient components as previously described in detail, 37 ranging from 10-100 with a higher score indicating adherence to a higher quality diet.
We used Cox proportional hazards regression models to estimate the hazard ratios (HR) and 95% confidence intervals (CI) of baseline BCAA metabolite levels with incident CVD. We analyzed the relationship between total and individual BCAAs with CVD categorically (in quintiles) and continuously per SD of the continuous ln-transformed metabolite. In addition to the age- and randomized treatment group-adjusted model, we adjusted for CVD risk factors at baseline including menopausal status (pre, post, uncertain, missing), current hormone therapy use, family history of premature MI, Caucasian race/ethnicity, smoking status (never, past, current <15 cigarettes/day, current 15+ cigarettes/day), AHEI diet quality score (quintiles), fasting status, alcohol beverage intake (never/rarely, 1-3/month, 1-6/week, ≥1/day), total physical activity MET-hrs/wk (quintiles), history of high cholesterol, history of hypertension, and body mass index (BMI kg/m2; <18.5, 18.5-19.9, 20.0-22.4, 22.5-24.9, 25.0-27.4, 27.5-29.9, 30.0-32.4, 32.5-34.9, 35.0-39.9, 40.0+). T2D was not included as it is a potential intermediate of CVD risk. Missing indicator categories were used for missing covariate data. The Cox proportional hazard assumptions were tested through the inclusion of a cross product term for BCAA and time in the risk model for overall composite incident CVD; this assumption was met, with no indication for an interaction by time.
In additional analyses, we further adjusted for CVD risk biomarkers previously measured from baseline blood samples to assess whether BCAAs were associated with CVD risk independent of pathways of insulin resistance or dyslipidemia. For these, we adjusted individually and altogether for the following, as ln-transformed continuous variables: Hba1c – a marker of long-term hyperglycemia33; LPIR – a lipid-based metabolomic score derived to reflect lipoprotein derangements of insulin resistance,34 previously associated with T2D in our cohort 35; GlycA - a measure of glycosylated acute phase proteins36; TG level; LDL, HDL, and hsCRP.
We stratified by whether participants had a prevalent (reported at baseline) or confirmed incident diagnosis of T2D. For CVD cases, we considered only T2D diagnoses prior to the first CVD event. We also stratified by CVD risk factors at the time of blood draw, including BMI category (normal <25.0 vs. overweight/obese ≥25.0 kg/m2), menopausal status (pre vs. post), current postmenopausal hormone use (yes vs. no), the presence of the metabolic syndrome (MetS), HbA1c <5.7% vs. ≥5.7%, fasting status <8 hours since last meal (yes vs. no), and follow-up time (<10 vs. ≥10 years). MetS was previously defined in WHS as having at least 3 of the following traits: (i) BMI >25.0; (ii) hypertension; (iii) elevated triglycerides ≥150 mg/dL (1.69 mmol/L); (iv) low HDLc <50 mg/dL (1.29 mmol/L); (v) Hba1c ≥5.7% or T2D.38 Statistical tests for interactions were performed with -2 likelihood ratio tests comparing the multivariable models with and without inclusion of the multiplicative interaction term.
Results
Baseline characteristics of the 27,041 eligible participants with baseline measurements of BCAA metabolites are presented in Table 1, according to quintiles of total BCAAs. Nearly all CVD risk factors differed across the BCAA quintiles, indicating worse cardiometabolic profiles with higher BCAA levels. For example, the prevalence of overweight/obesity (BMI ≥25 kg/m2) in the highest quintile 5 was more than double that of the lowest quintile 1, with 68.8% and 30.2%, respectively. Never smokers, however, were more prevalent among the higher BCAA quintiles. The randomized treatment assignments were balanced across BCAA quintiles.
Table 1.
Baseline characteristics according to quintiles of plasma total branched-chain amino acid metabolite levels
| Participants, N | Total plasma branched-chain amino acid quintiles | p-trend* | ||||
|---|---|---|---|---|---|---|
| Q1 (bottom) | Q2 | Q3 | Q4 | Q5 (top) | ||
| 5,443 | 5,409 | 5,648 | 5,429 | 5,472 | ||
| Values are means (standard deviations) or %, unless otherwise specified | ||||||
| Age, years | 54.4 (7.2) | 54.8 (7.3) | 54.9 (7.1) | 54.9 (7.1) | 54.6 (6.9) | 0.12 |
| Body mass index, kg/m2 | 24.0 (3.9) | 24.7 (4.1) | 25.6 (4.6) | 26.7 (5.0) | 28.3 (5.7) | <0.0001 |
| Normal weight (<25) | 69.8 | 62.7 | 53.5 | 43.4 | 31.3 | <0.0001 |
| Overweight/obese (≥25) | 30.2 | 37.3 | 46.5 | 56.6 | 68.8 | |
| Menopausal status | ||||||
| Premenopausal | 31.7 | 27.8 | 26.2 | 26.4 | 26.2 | <0.0001 |
| Postmenopausal | 51.5 | 54.6 | 56.3 | 56.0 | 53.1 | 0.04 |
| Uncertain | 12.7 | 13.8 | 13.5 | 14.0 | 16.3 | <0.0001 |
| Postmenopausal hormone use | 43.4 | 44.8 | 45.5 | 43.7 | 40.7 | 0.001 |
| Family history of premature MI | 11.1 | 10.9 | 10.9 | 11.8 | 12.7 | 0.003 |
| Caucasian race/ethnicity | 95.2 | 95.4 | 94.9 | 94.1 | 93.0 | <0.0001 |
| Smoking status | ||||||
| Never | 48.6 | 51.6 | 52.1 | 53.3 | 52.8 | <0.0001 |
| Past | 38.3 | 37.2 | 37.0 | 35.6 | 35.7 | 0.0009 |
| Current, <15 cig/day | 4.7 | 4.5 | 4.1 | 3.8 | 4.4 | 0.1 |
| Current, ≥15 cig/day | 8.3 | 6.5 | 6.6 | 7.2 | 7.0 | 0.07 |
| Alcohol | ||||||
| Rarely/never | 38.6 | 40.7 | 42.7 | 45.5 | 51.9 | <0.0001 |
| 1–3 drinks/month | 12.5 | 14.0 | 13.3 | 13.1 | 13.4 | 0.6 |
| 1–6 drinks/week | 35.2 | 33.2 | 33.6 | 32.4 | 27.7 | <0.0001 |
| ≥1 drink/day | 13.7 | 12.0 | 10.4 | 9.1 | 7.1 | <0.0001 |
| AHEI diet quality score (10-100) | 54.5 (10.3) | 53.9 (10.2) | 53.7 (10.1) | 53.1 (10.1) | 52.4 (10.1) | <0.0001 |
| Total physical activity, MET-hrs/wk (median, interquartile range) | 10.3 (19.5) | 10.0 (18.2) | 9.2 (17.5) | 8.0 (17.4) | 7.0 (15.1) | <0.0001 |
| History of high cholesterol | 23.5 | 26.9 | 29.8 | 32.3 | 34.1 | <0.0001 |
| History of hypertension | 18.2 | 21.0 | 22.9 | 27.6 | 34.2 | <0.0001 |
| History of type 2 diabetes | 0.6 | 0.9 | 1.2 | 2.1 | 7.9 | <0.0001 |
| Randomized treatment assignment | ||||||
| Aspirin | 49.7 | 50.0 | 49.8 | 49.6 | 51.2 | 0.2 |
| Beta carotene | 49.6 | 50.6 | 49.7 | 49.7 | 49.4 | 0.6 |
| Vitamin E | 50.3 | 49.8 | 49.8 | 50.8 | 49.8 | 0.9 |
| Fasting at blood draw | 72.9 | 76.1 | 75.4 | 74.0 | 62.1 | <0.0001 |
| Plasma metabolite levels, umol/L (median, interquartile range) | ||||||
| Total BCAAs | 308 (41) | 360 (22) | 104 (20) | 447 (27) | 528 (78) | <0.0001 |
| Isoleucine | 35 (15) | 43 (16) | 50 (17) | 58 (18) | 76 (26) | <0.0001 |
| Leucine | 96 (25) | 117 (22) | 132 (22) | 148 (23) | 177 (34) | <0.0001 |
| Valine | 172 (27) | 199 (21) | 219 (23) | 242 (24) | 284 (43) | <0.0001 |
| Other biomarkers | ||||||
| Hba1c, % | 5.0 (0.3) | 5.0 (0.4) | 5.0 (0.4) | 5.1 (0.5) | 5.3 (1.0) | <0.0001 |
| LPIR score | 30.8 (20.5) | 35.4 (21.7) | 39.7 (22.8) | 46.2 (23.2) | 55.5 (23.5) | <0.0001 |
| Triglycerides, mg/dL | 115.6 (69.2) | 123.5 (69.5) | 133.1 (71.5) | 145.9 (77.7) | 172.9 (89.5) | <0.0001 |
| LDL-C, mg/dL | 117.5 (32.7) | 122.3 (33.1) | 125.1 (34.1) | 127.6 (33.9) | 128.7 (34.9) | <0.0001 |
| GlycA, umol/L | 357.8 (63.4) | 374.7 (64.0) | 385.4 (64.6) | 399.4 (66.1) | 416.2 (69.3) | <0.0001 |
Q=quintile, MI=myocardial infarction, AHEI=Alternative Healthy Eating Index, MET=metabolic equivalent of tasks, Hba1c=glycated haemoglobin, LPIR score=lipoprotein insulin resistance score that reflects lipoprotein derangements of insulin resistance, LDL-C=low density lipoprotein cholesterol, GlycA=glycoprotein N-acetyl methyl groups
We performed tests for trend across BCAA quintiles.
We confirmed 2,207 incident CVD cases over a mean 18.6 years of follow-up, including 551 first cases of MI, 799 first cases of stroke, and 1,178 revascularization events. We give the results of the age- and multivariable-adjusted models for the association between continuous total and individual BCAA metabolites at baseline with incident CVD events in Table 2. Total BCAAs were associated with a 23% greater risk of total CVD (per SD: HR=1.23, 95% CI=1.18 to 1.29; p <0.0001) in age- and treatment adjusted models. This was moderately attenuated in the multivariable model 2 after adjusting for a number of traditional CVD risk factors (per SD: HR=1.16, 95% CI=1.11 to 1.21; p<0.0001), and slightly more so with additional adjustment for BMI in multivariable model 3 (per SD: HR=1.13, 95% CI=1.08 to 1.18; p<0.0001). These associations were comparable when evaluating LDL-C as the exposure of interest with risk of CVD events in multivariable model 3 (per SD of LDL-C: HR=1.12, 95% CI=1.07 to 1.17; p<0.0001). Addition of BCAAs to the multivariable model increased the receiver-operator curve from area under the curve (AUC)=0.718 to AUC=0.721 (p<0.0001), while the addition of LDL increased to AUC=0.719 (p<0.0001). Similar trends were observed for individual BCAA metabolites.
Table 2.
Prospective association between baseline circulating BCAA metabolites in relation to incident total cardiovascular disease, MI, stroke, and revascularization risk in 27,401 US women.
| Total CVD | MI | Stroke | Revascularization | |
|---|---|---|---|---|
| HR per SD (95% CI) |
HR per SD (95% CI) |
HR per SD (95% CI) |
HR per SD (95% CI) |
|
| N Events | 2,207 | 551 | 799 | 1,178 |
| Total BCAAs* | ||||
| Model 1: Age, treatment | 1.23 (1.18, 1.29) | 1.30 (1.19, 1.41) | 1.11 (1.03, 1.19) | 1.33 (1.26, 1.41) |
| Model 2: Multivariable | 1.16 (1.11, 1.21) | 1.19 (1.09, 1.29) | 1.06 (0.99, 1.14) | 1.23 (1.16, 1.30) |
| Model 3: + BMI | 1.13 (1.08, 1.18) | 1.16 (1.06, 1.26) | 1.07 (0.99, 1.15) | 1.17 (1.11, 1.25) |
| Isolecuine | ||||
| Model 1: Age, treatment | 1.24 (1.19, 1.30) | 1.34 (1.22, 1.47) | 1.09 (1.02, 1.18) | 1.39 (1.30, 1.48) |
| Model 2: Multivariable | 1.17 (1.12, 1.22) | 1.22 (1.12, 1.34) | 1.05 (0.97, 1.13) | 1.28 (1.20, 1.37) |
| Model 3: + BMI | 1.14 (1.09, 1.19) | 1.19 (1.09, 1.31) | 1.05 (0.97, 1.13) | 1.24 (1.16, 1.32) |
| Leucine | ||||
| Model 1: Age, treatment | 1.14 (1.09, 1.19) | 1.16 (1.06, 1.26) | 1.07 (1.00, 1.15) | 1.20 (1.13, 1.28) |
| Model 2: Multivariable | 1.08 (1.04, 1.13) | 1.08 (0.99, 1.18) | 1.04 (0.97, 1.12) | 1.12 (1.05, 1.19) |
| Model 3: + BMI | 1.06 (1.02, 1.11) | 1.05 (0.97, 1.15) | 1.04 (0.97, 1.12) | 1.08 (1.02, 1.14) |
| Valine | ||||
| Model 1: Age, treatment | 1.23 (1.18, 1.28) | 1.29 (1.19, 1.40) | 1.10 (1.03, 1.18) | 1.31 (1.24, 1.39) |
| Model 2: Multivariable | 1.17 (1.12, 1.22) | 1.20 (1.10, 1.30) | 1.06 (0.99, 1.14) | 1.22 (1.15, 1.30) |
| Model 3: + BMI | 1.13 (1.08, 1.18) | 1.16 (1.06, 1.27) | 1.06 (0.99, 1.15) | 1.16 (1.09, 1.24) |
BCAAs=branched chain amino acids, BMI=body mass index, HR=hazard ratio, CI=confidence interval, SD=standard deviation
Metabolites were ln-transformed and standardized; SDs are the following: total BCAAs 0.22; isoleucine 0.42; leucine 0.28; valine 0.20.
Model 2 includes the following: age (continuous), randomized treatment assignments, fasting status at blood draw, menopausal status (pre, post, uncertain, missing), current hormone therapy use, family history of MI, Caucasian race/ethnicity, smoking status (never, past, current <15 c/d, current 15+ c/d), AHEI diet quality score (quintiles), alcohol intake (4 categories), total physical activity MET-hrs/wk (quintiles), history of high cholesterol, history of hypertension; Model 3 includes the covariates adjusted for in Model 2 plus BMI (adjusted for in 10 categories).
Total BCAA levels were associated with individual CVD endpoints (Table 2), indicating higher risks per SD greater BCAA level for MI (multivariable model 3, per SD: HR=1.16, 95% CI=1.06 to 1.26) and coronary revascularization (multivariable model 3, per SD: HR=1.17, 95% CI=1.11 to 1.25). A borderline association with stroke did not reach statistical significance (multivariable model 3, per SD: HR=1.07, 95% CI=0.99 to 1.15). Isoleucine and valine were of similar magnitude to total BCAAs for individual endpoints, while leucine was generally weaker.
When we additionally adjusted individually for correlated CVD baseline biomarkers (Supplement Table 1) from cardiometabolic pathways (Hba1c, LPIR score, triglycerides, GlycA, LDL-C, HDL-C, hsCRP), the associations between BCAAs with total CVD and the individual CVD endpoints were variably attenuated (Supplemental Table 2). LDL-C, HDL-C or hsCRP did not appreciably impact the results. Adjusting for biomarkers related to impaired glucose metabolism simultaneously, Hba1c, LPIR score, triglycerides, and GlycA, completely attenuated the relationship between total plasma BCAAs and risk of CVD and the individual components (multivariable model 3, per SD: HR=1.02, 95% CI=0.98 to 1.07).
We also give the results of the age- and multivariable-adjusted models between quintiles of BCAA metabolites and incident CVD events (Supplement Table 3). In the multivariable model 3 adjusting for CVD risk factors, including BMI, comparing quintile 5 to quintile 1, total BCAAs, isoleucine, leucine, and valine were associated with 31%, 37%, 18%, and 29% greater CVD risks, respectively. All p-values for linear trend were statistically significant except for leucine (p-trend=0.07).
There was significant effect modification for BCAAs with CVD risk according to T2D status (p-interaction=0.036, Figure 1). P-values for interaction were significant for revascularization endpoints (p-interaction=0.019), and of borderline statistical significance for MI (p-interaction=0.059) and stroke (p-interaction=0.066). The relationship between total BCAAs with CVD risk was significantly greater when T2D preceded the CVD event (multivariable model 3, per SD: HR=1.20, 95% CI=1.08 to 1.32). The association between BCAAs and CVD was weaker among women without T2D, although still statistically significant (multivariable model 3, per SD: HR=1.08, 95% CI=1.03 to 1.14). We observed the same trends of effect modification by T2D status for MI, stroke, and revascularization (Figure 1). Stratification by baseline CVD risk factors, including by baseline BMI, postmenopausal status, postmenopausal hormone use, or metabolic syndrome, did not significantly modify the association between total BCAAs and CVD risk (Supplemental Table 4). Further, we did not observe a difference in the association with longer follow-up time (p-interaction=0.24), indicating that baseline BCAA levels are a significant predictor of CVD risk for both short-term (<10 years: HR=1.18, 95% CI=1.10 to 1.26) and longer-term follow-up (≥10 years: HR=1.11, 95% CI=1.04, 1.18).
Figure 1.
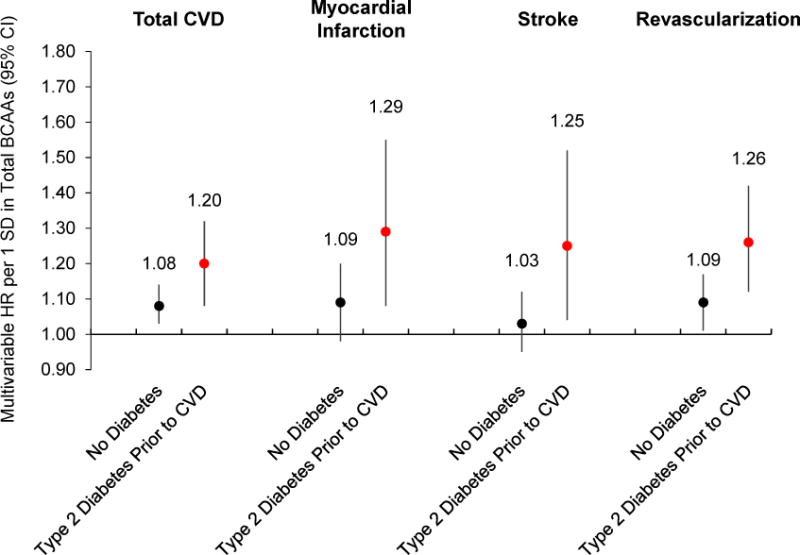
Prospective association between baseline circulating total BCAAs in relation to incident total cardiovascular disease, MI, stroke, and revascularization risk in 27,401 US women, according to type 2 diabetes diagnosis prior to CVD endpoint. Multivariable adjusted model includes the following: age (continuous), randomized treatment assignments (ASA, BC, VE), fasting status at blood draw, menopausal status (pre, post, uncertain, missing), current hormone therapy use, family history of MI, Caucasian race/ethnicity, smoking status (never, past, current <15 c/d, current 15+ c/d), AHEI diet quality score (quintiles), alcohol intake (4 categories), total physical activity MET-hrs/wk (quintiles), history of high cholesterol, history of hypertension, and BMI (10 categories). P-values for interaction: total CVD p=0.036, MI p=0.059, stroke p=0.066, revascularization p=0.019. BCAAs=branched-chain amino acids, HR=hazard ratio, CI=confidence interval, SD=standard deviation
Discussion
In this longitudinal cohort of US women with >18 years of follow-up, we observed a significant positive association between baseline plasma levels of BCAAs with incident CVD events, after adjusting for numerous traditional CVD risk factors, including BMI. The BCAA-CVD association was much more pronounced for the women who developed T2D prior a CVD event, in particular for coronary events. Further adjustment for biomarkers of cardiometabolic risk suggested that the relationship between BCAAs and CVD could be mostly explained by more downstream biomarkers of T2D metabolism. Hence, impaired BCAA metabolism may represent a shared pathway of the metabolic pathophysiology that links the risks of T2D and CVD.
Prior prospective analyses of BCAA metabolites and incident CVD risk are sparse. In a case-cohort analysis within the PREvención con DIeta MEDiterránea (PREDIMED) Mediterranean diet trial population, 970 men and women at high CVD risk had BCAA measures available from baseline blood samples. After a median 4.6 years of follow-up, there were 226 CVD events (nonfatal MI or stroke, CV death).13 Isoleucine, leucine, and valine were associated with 2.9, 2.2, and 1.9-fold greater risks of CVD in BMI-adjusted models comparing the 4th and 1st quartiles, respectively. In contrast to the present study, however, the PREDIMED findings did not appreciably differ according to baseline T2D status. Further, PREDIMED investigators reported a positive association between BCAA metabolites with stroke risk, which was not statistically significant in our WHS cohort after additional adjustment for baseline diet quality score, alcohol intake, menopausal status, and other risk factors, despite our many stroke events.
Studies of broader metabolomic profiling in relation to incident CVD have been mixed in identifying BCAAs among metabolites significantly associated with elevated risk.39–41 Baseline concentrations of isoleucine and leucine, but not valine, were among 33 other metabolites significantly associated with CVD risk (stroke, MI, revascularizations, and angina) after correction for multiple comparisons in a discovery cohort.39 These associations were not replicated in separate cohorts, however, and were attenuated after adjusting for traditional lipid markers. This result differs from our analyses whereby adjusting for measured LDL, HDL cholesterol, or for history of high cholesterol did not impact the positive associations between BCAAs with CVD risk. Isoleucine and leucine were identified from a panel of metabolites measured in stored plasma samples of patients undergoing cardiac catheterization, and were significantly related to incident MI in multivariable models, including adjusting for prevalent T2D.41 An agnostic BCAA-related metabolite factor was also significantly associated with MI risk, and this finding was replicated in an external case-control sample. A pattern of metabolites strongly predictive of T2D, including isoleucine, was positively related to incident CVD as well as prevalent moderate-to-severe atherosclerosis.5
The relationship between BCAAs with incident T2D is striking and consistent across study populations, duration of follow-up, and methods of metabolomic profiling.12 It is possible that elevated BCAA metabolites, reflecting an impaired catabolism and accumulation in circulation,42 may increase CVD risk through the promotion of insulin resistance-mediated atherosclerosis.2 There is accumulating evidence in support of a BCAA catabolism impairment being upstream of insulin resistance, although we acknowledge the reverse may be true. A Mendelian randomization study observed that circulating BCAA metabolite-related polymorphisms were significantly associated with an elevated risk of T2D.42 Further, a randomized trial of metformin did not lead to reductions in BCAAs, despite significant improvements in insulin sensitivity and changes to other circulating metabolites.43 In the present manuscript, the relationship between BCAAs with incident CVD was stronger for those participants who also developed T2D prior to CVD. Cross-sectional analyses of CVD predictors and intermediate phenotypes are consistent with our findings and the hypothesis that circulating BCAA metabolites are associated with CVD predominantly through T2D-related pathways related to impaired metabolic and inflammatory disarray. For example, plasma BCAAs were positively correlated with carotid intima-media thickness (cIMT) after multivariable adjustment among adult subjects with HbA1c values ≥5.6%, while no correlation between BCAAs and cIMT persisted among the subgroup of individuals with Hba1c<5.6%.4 Thus, elevated BCAAs may be a marker proximal to excess adiposity, and an upstream predictor of insulin resistance, T2D, and CVD.
Strengths of this analysis include the large sample size and prospective design with consideration for antecedent T2D. The US study population is limited by its relative homogeneity, limiting our ability to generalize these results to men and non-Caucasian racial/ethnic groups. We carefully adjusted for numerous potential CVD risk factors, although it is possible residual or unmeasured confounding remains. Despite the potential limitations of using a single baseline measurement of the metabolites, we observed a relationship between BCAAs with elevated CVD risk over the duration of follow-up (>18 years). Rigorous large-scale metabolomics studies are still needed to quantify the expected variability for most metabolites over time. A longer-term reproducibility study reported ICCs≥0.40 for BCAA metabolites in repeated plasma samples 1-2 years apart.44 Similarly, in a subset (n=27) of the European Prospective Investigation into Cancer and Nutrition (EPIC) study, BCAA ICCs ranged 0.3 to 0.4 for serum collected 2 years apart.45 This same cohort reported ICCs of 0.5 for triglycerides.46 Collectively, these pilot data suggest acceptable reproducibility for BCAAs with variation similar to other biomarkers.
The current study is the largest prospective analysis of BCAA metabolites with incident CVD risk to date. We observed significant positive associations between BCAA metabolites with long-term CVD risk, comparable in magnitude to (and independent of) LDL-C, an established CVD biomarker. Notably, this relationship was prominent among women developing T2D prior to CVD. Despite being the main cause of death in the US, the mechanisms linking behavioral and environmental risk factors with CVD and T2D risk remain incompletely understood. Identifying novel biomarkers downstream of risk factors such as excess adiposity may allow for intervention with preventive strategies years prior to CVD symptom onset, for example at the time of T2D diagnosis or even earlier. BCAAs may represent an early excess adiposity-related perturbation in the etiologic pathway linking T2D with excess CVD risk. Future research investigating the modifiability of BCAA metabolism with reduction of subsequent disease risk is warranted to understand the role these metabolites may play in clinical practice.
Supplementary Material
Clinical Perspective.
Rapidly evolving metabolomics technologies have identified several novel metabolites and metabolomic pathways associated with type 2 diabetes (T2D). Circulating branched-chain amino acids (BCAAs; isoleucine, leucine, valine) in particular have been consistently observed as strongly associated with T2D, and compelling evidence supports a causal role of dysfunctional BCAA metabolism in the development of insulin resistance and T2D. But few studies have evaluated the association of BCAAs with cardiovascular disease (CVD). We hypothesized that higher baseline levels of plasma BCAAs would be associated with an elevated risk of CVD events, and postulated that the BCAA-CVD relationship would be related to cardiometabolic risk pathways. Plasma BCAA metabolites were measured via NMR spectroscopy in 27,041 women, and examined in relation to 2,207 incident CVD events over a mean 18.6 years of follow-up. We found that a single random plasma measurement of baseline circulating plasma BCAAs was positively associated with incident CVD to a comparable degree as the association of LDL cholesterol with CVD, and was independent of multiple established risk factors. The association was stronger among women who developed T2D prior to CVD. Further adjustment for biomarkers of cardiometabolic risk suggested that the relationship between BCAAs and CVD could be mostly explained by more downstream biomarkers of T2D metabolism. Hence, impaired BCAA metabolism may represent a shared pathway of metabolic dysfunction that links T2D and CVD, and a one-time level of plasma BCAAs may capture the long-term cardiometabolic risks of this common etiology.
Acknowledgments
Sources of Funding: The WHS is supported by NIH grants (CA-047988, HL-043851, HL-080467, HL-099355, and UM1 CA182913). Dr. Tobias is supported by a grant from the NIH National Institute of Diabetes and Digestive and Kidney Diseases (K01DK103720). Dr. Lawler has received funding from the NIH T32 (HL007575), the Peter Munk Cardiac Centre, the Ted Rogers Foundation for Heart Research, and the Heart and Stroke/Richard Lewar Centre of Excellence in Cardiovascular Research at the University of Toronto. Dr. Demler is supported by a grant from the NIH (1K01HL135342). Dr. Cheng receives grant support from the NIH (R01HL131532 and R01HL134168). Dr. Mora has received institutional research grant support from the National Heart, Lung, and Blood Institute (R01HL134811 and K24 HL136852), and the National Institute of Diabetes and Digestive and Kidney Diseases (DK112940). The research for this article was also supported by the Molino Family Trust. The BCAA NMR measurements were provided at no additional charge by LabCorp, Inc.
Role of Sponsor: The funding organizations played no role in the design of study, choice of enrolled patients, review and interpretation of data, and final approval of manuscript.
Footnotes
Disclosures: P.M Ridker, listed as a coinventor on patents held by the Brigham and Women’s Hospital related to the use of inflammatory biomarkers in CVD (licensed to AstraZeneca and Siemens); S. Mora has a patent application regarding the use of GlycA in relation to colorectal cancer risk.
References
- 1.Newgard CB, An J, Bain JR, Muehlbauer MJ, Stevens RD, Lien LF, et al. A branched-chain amino acid-related metabolic signature that differentiates obese and lean humans and contributes to insulin resistance. Cell metabolism. 2009;9:311–326. doi: 10.1016/j.cmet.2009.02.002. [DOI] [PMC free article] [PubMed] [Google Scholar]
- 2.Yang R, Dong J, Zhao H, Li H, Guo H, Wang S, et al. Association of branched-chain amino acids with carotid intima-media thickness and coronary artery disease risk factors. PloS one. 2014;9:e99598. doi: 10.1371/journal.pone.0099598. [DOI] [PMC free article] [PubMed] [Google Scholar]
- 3.Yang P, Hu W, Fu Z, Sun L, Zhou Y, Gong Y, Yang T, Zhou H. The positive association of branched-chain amino acids and metabolic dyslipidemia in chinese han population. Lipids in health and disease. 2016;15:120. doi: 10.1186/s12944-016-0291-7. [DOI] [PMC free article] [PubMed] [Google Scholar]
- 4.Mels CM, Schutte AE, Schutte R, Huisman HW, Smith W, Fourie CM, et al. The link between vascular deterioration and branched chain amino acids in a population with high glycated haemoglobin: The sabpa study. Amino acids. 2013;45:1405–1413. doi: 10.1007/s00726-013-1611-0. [DOI] [PubMed] [Google Scholar]
- 5.Magnusson M, Lewis GD, Ericson U, Orho-Melander M, Hedblad B, Engstrom G, et al. A diabetes-predictive amino acid score and future cardiovascular disease. European heart journal. 2013;34:1982–1989. doi: 10.1093/eurheartj/ehs424. [DOI] [PMC free article] [PubMed] [Google Scholar]
- 6.Neishabouri SH, Hutson SM, Davoodi J. Chronic activation of mtor complex 1 by branched chain amino acids and organ hypertrophy. Amino acids. 2015;47:1167–1182. doi: 10.1007/s00726-015-1944-y. [DOI] [PubMed] [Google Scholar]
- 7.Mangge H, Zelzer S, Pruller F, Schnedl WJ, Weghuber D, Enko D, et al. Branched-chain amino acids are associated with cardiometabolic risk profiles found already in lean, overweight and obese young. The Journal of nutritional biochemistry. 2016;32:123–127. doi: 10.1016/j.jnutbio.2016.02.007. [DOI] [PubMed] [Google Scholar]
- 8.Lee CC, Watkins SM, Lorenzo C, Wagenknecht LE, Il’yasova D, Chen YD, et al. Branched-chain amino acids and insulin metabolism: The insulin resistance atherosclerosis study (iras) Diabetes care. 2016;39:582–588. doi: 10.2337/dc15-2284. [DOI] [PMC free article] [PubMed] [Google Scholar]
- 9.Newgard CB. Interplay between lipids and branched-chain amino acids in development of insulin resistance. Cell metabolism. 2012;15:606–614. doi: 10.1016/j.cmet.2012.01.024. [DOI] [PMC free article] [PubMed] [Google Scholar]
- 10.Ferguson JF, Wang TJ. Branched-chain amino acids and cardiovascular disease: Does diet matter? Clinical chemistry. 2016;62:545–547. doi: 10.1373/clinchem.2016.254318. [DOI] [PubMed] [Google Scholar]
- 11.Sun H, Wang Y. Branched chain amino acid metabolic reprogramming in heart failure. Biochimica et biophysica acta. 2016;1862:2270–2275. doi: 10.1016/j.bbadis.2016.09.009. [DOI] [PubMed] [Google Scholar]
- 12.Guasch-Ferre M, Hruby A, Toledo E, Clish CB, Martinez-Gonzalez MA, Salas-Salvado J, Hu FB. Metabolomics in prediabetes and diabetes: A systematic review and meta-analysis. Diabetes care. 2016;39:833–846. doi: 10.2337/dc15-2251. [DOI] [PMC free article] [PubMed] [Google Scholar]
- 13.Ruiz-Canela M, Toledo E, Clish CB, Hruby A, Liang L, Salas-Salvado J, et al. Plasma branched-chain amino acids and incident cardiovascular disease in the predimed trial. Clinical chemistry. 2016;62:582–592. doi: 10.1373/clinchem.2015.251710. [DOI] [PMC free article] [PubMed] [Google Scholar]
- 14.Wang TJ, Larson MG, Vasan RS, Cheng S, Rhee EP, McCabe E, et al. Metabolite profiles and the risk of developing diabetes. Nature medicine. 2011;17:448–453. doi: 10.1038/nm.2307. [DOI] [PMC free article] [PubMed] [Google Scholar]
- 15.Stern MP. Diabetes and cardiovascular disease. The “common soil” hypothesis. Diabetes. 1995;44:369–374. doi: 10.2337/diab.44.4.369. [DOI] [PubMed] [Google Scholar]
- 16.Jarrett RJ. Type 2 (non-insulin-dependent) diabetes mellitus and coronary heart disease-chicken, egg or neither? Diabetologia. 1984;26:99–102. doi: 10.1007/BF00281114. [DOI] [PubMed] [Google Scholar]
- 17.Reaven GM. Banting lecture 1988. Role of insulin resistance in human disease. Diabetes. 1988;37:1595–1607. doi: 10.2337/diab.37.12.1595. [DOI] [PubMed] [Google Scholar]
- 18.Buring JE, Hennekens CH, Group ftWsHSR The women’s health study: Summary of the study design. J Myocardial Ischemia. 1992;4:27–29. [Google Scholar]
- 19.Ridker PM, Cook NR, Lee IM, Gordon D, Gaziano JM, Manson JE, et al. A randomized trial of low-dose aspirin in the primary prevention of cardiovascular disease in women. The New England journal of medicine. 2005;352:1293–1304. doi: 10.1056/NEJMoa050613. [DOI] [PubMed] [Google Scholar]
- 20.Zhang SM, Buring JE, Lee IM, Cook NR, Ridker PM. C-reactive protein levels are not associated with increased risk for colorectal cancer in women. Annals of internal medicine. 2005;142:425–432. doi: 10.7326/0003-4819-142-6-200503150-00008. [DOI] [PubMed] [Google Scholar]
- 21.Wolak-Dinsmore J, Gruppen EG, Shalaurova I, Matyus SP, Grant RP, Gegen R, et al. A novel nmr-based assay to measure circulating concentrations of branched-chain amino acids: Elevation in subjects with type 2 diabetes mellitus and association with carotid intima media thickness. Clinical biochemistry. 2018 doi: 10.1016/j.clinbiochem.2018.02.001. [DOI] [PubMed] [Google Scholar]
- 22.Jeyarajah EJ, Cromwell WC, Otvos JD. Lipoprotein particle analysis by nuclear magnetic resonance spectroscopy. Clinics in laboratory medicine. 2006;26:847–870. doi: 10.1016/j.cll.2006.07.006. [DOI] [PubMed] [Google Scholar]
- 23.Atiya M, Kurth T, Berger K, Buring JE, Kase CS, Women’s Health S Interobserver agreement in the classification of stroke in the women’s health study. Stroke. 2003;34:565–567. doi: 10.1161/01.str.0000054159.21017.7c. [DOI] [PubMed] [Google Scholar]
- 24.Ding EL, Song Y, Manson JE, Pradhan AD, Buring JE, Liu S. Accuracy of administrative coding for type 2 diabetes in children, adolescents, and young adults. Diabetes care. 2007;30:e98. doi: 10.2337/dc07-0903. author reply e99. [DOI] [PubMed] [Google Scholar]
- 25.Report of the expert committee on the diagnosis and classification of diabetes mellitus. Diabetes care. 1997;20:1183–1197. doi: 10.2337/diacare.20.7.1183. [DOI] [PubMed] [Google Scholar]
- 26.Expert Committee on the D, Classification of Diabetes M. Report of the expert committee on the diagnosis and classification of diabetes mellitus. Diabetes care. 2000;23(Suppl 1):S4–19. [PubMed] [Google Scholar]
- 27.Willett WC, Sampson L, Stampfer MJ, Rosner B, Bain C, Witschi J, et al. Reproducibility and validity of a semiquantitative food frequency questionnaire. American journal of epidemiology. 1985;122:51–65. doi: 10.1093/oxfordjournals.aje.a114086. [DOI] [PubMed] [Google Scholar]
- 28.Freedman LS, Commins JM, Moler JE, Arab L, Baer DJ, Kipnis V, et al. Pooled results from 5 validation studies of dietary self-report instruments using recovery biomarkers for energy and protein intake. American journal of epidemiology. 2014;180:172–188. doi: 10.1093/aje/kwu116. [DOI] [PMC free article] [PubMed] [Google Scholar]
- 29.Wolf AM, Hunter DJ, Colditz GA, Manson JE, Stampfer MJ, Corsano KA, et al. Reproducibility and validity of a self-administered physical activity questionnaire. International journal of epidemiology. 1994;23:991–999. doi: 10.1093/ije/23.5.991. [DOI] [PubMed] [Google Scholar]
- 30.Mora S, Lee IM, Buring JE, Ridker PM. Association of physical activity and body mass index with novel and traditional cardiovascular biomarkers in women. Jama. 2006;295:1412–1419. doi: 10.1001/jama.295.12.1412. [DOI] [PubMed] [Google Scholar]
- 31.Liu S, Lee IM, Song Y, Van Denburgh M, Cook NR, Manson JE, Buring JE. Vitamin e and risk of type 2 diabetes in the women’s health study randomized controlled trial. Diabetes. 2006;55:2856–2862. doi: 10.2337/db06-0456. [DOI] [PubMed] [Google Scholar]
- 32.Colditz GA, Martin P, Stampfer MJ, Willett WC, Sampson L, Rosner B, et al. Validation of questionnaire information on risk factors and disease outcomes in a prospective cohort study of women. American journal of epidemiology. 1986;123:894–900. doi: 10.1093/oxfordjournals.aje.a114319. [DOI] [PubMed] [Google Scholar]
- 33.Lin J, Ridker PM, Rifai N, Lee IM, Manson JE, Buring JE, Zhang SM. A prospective study of hemoglobin a1c concentrations and risk of breast cancer in women. Cancer research. 2006;66:2869–2875. doi: 10.1158/0008-5472.CAN-05-3922. [DOI] [PubMed] [Google Scholar]
- 34.Dugani SB, Akinkuolie AO, Paynter N, Glynn RJ, Ridker PM, Mora S. Association of lipoproteins, insulin resistance, and rosuvastatin with incident type 2 diabetes mellitus : Secondary analysis of a randomized clinical trial. JAMA cardiology. 2016;1:136–145. doi: 10.1001/jamacardio.2016.0096. [DOI] [PMC free article] [PubMed] [Google Scholar]
- 35.Harada PHN, Demler OV, Dugani SB, Akinkuolie AO, Moorthy MV, Ridker PM, et al. Lipoprotein insulin resistance score and risk of incident diabetes during extended follow-up of 20 years: The women’s health study. Journal of clinical lipidology. 2017;11:1257–1267 e1252. doi: 10.1016/j.jacl.2017.06.008. [DOI] [PMC free article] [PubMed] [Google Scholar]
- 36.Lawler PR, Akinkuolie AO, Chandler PD, Moorthy MV, Vandenburgh MJ, Schaumberg DA, et al. Circulating n-linked glycoprotein acetyls and longitudinal mortality risk. Circulation research. 2016;118:1106–1115. doi: 10.1161/CIRCRESAHA.115.308078. [DOI] [PMC free article] [PubMed] [Google Scholar]
- 37.Chiuve SE, Fung TT, Rimm EB, Hu FB, McCullough ML, Wang M, et al. Alternative dietary indices both strongly predict risk of chronic disease. The Journal of nutrition. 2012;142:1009–1018. doi: 10.3945/jn.111.157222. [DOI] [PMC free article] [PubMed] [Google Scholar]
- 38.Lawler PR, Akinkuolie AO, Ridker PM, Sniderman AD, Buring JE, Glynn RJ, et al. Discordance between circulating atherogenic cholesterol mass and lipoprotein particle concentration in relation to future coronary events in women. Clinical chemistry. 2017;63:870–879. doi: 10.1373/clinchem.2016.264515. [DOI] [PMC free article] [PubMed] [Google Scholar]
- 39.Wurtz P, Havulinna AS, Soininen P, Tynkkynen T, Prieto-Merino D, Tillin T, et al. Metabolite profiling and cardiovascular event risk: A prospective study of 3 population-based cohorts. Circulation. 2015;131:774–785. doi: 10.1161/CIRCULATIONAHA.114.013116. [DOI] [PMC free article] [PubMed] [Google Scholar]
- 40.Shah SH, Sun JL, Stevens RD, Bain JR, Muehlbauer MJ, Pieper KS, et al. Baseline metabolomic profiles predict cardiovascular events in patients at risk for coronary artery disease. Am Heart J. 2012;163:844–850 e841. doi: 10.1016/j.ahj.2012.02.005. [DOI] [PubMed] [Google Scholar]
- 41.Shah SH, Bain JR, Muehlbauer MJ, Stevens RD, Crosslin DR, Haynes C, et al. Association of a peripheral blood metabolic profile with coronary artery disease and risk of subsequent cardiovascular events. Circ Cardiovasc Genet. 2010;3:207–214. doi: 10.1161/CIRCGENETICS.109.852814. [DOI] [PubMed] [Google Scholar]
- 42.Lotta LA, Scott RA, Sharp SJ, Burgess S, Luan J, Tillin T, et al. Genetic predisposition to an impaired metabolism of the branched-chain amino acids and risk of type 2 diabetes: A mendelian randomisation analysis. PLoS Med. 2016;13:e1002179. doi: 10.1371/journal.pmed.1002179. [DOI] [PMC free article] [PubMed] [Google Scholar]
- 43.Preiss D, Rankin N, Welsh P, Holman RR, Kangas AJ, Soininen P, et al. Effect of metformin therapy on circulating amino acids in a randomized trial: The camera study. Diabet Med. 2016;33:1569–1574. doi: 10.1111/dme.13097. [DOI] [PubMed] [Google Scholar]
- 44.Townsend MK, Clish CB, Kraft P, Wu C, Souza AL, Deik AA, et al. Reproducibility of metabolomic profiles among men and women in 2 large cohort studies. Clinical chemistry. 2013;59:1657–1667. doi: 10.1373/clinchem.2012.199133. [DOI] [PMC free article] [PubMed] [Google Scholar]
- 45.Carayol M, Licaj I, Achaintre D, Sacerdote C, Vineis P, Key TJ, et al. Reliability of serum metabolites over a two-year period: A targeted metabolomic approach in fasting and non-fasting samples from epic. PloS one. 2015;10:e0135437. doi: 10.1371/journal.pone.0135437. [DOI] [PMC free article] [PubMed] [Google Scholar]
- 46.Block G, Dietrich M, Norkus E, Jensen C, Benowitz NL, Morrow JD, et al. Intraindividual variability of plasma antioxidants, markers of oxidative stress, c-reactive protein, cotinine, and other biomarkers. Epidemiology. 2006;17:404–412. doi: 10.1097/01.ede.0000220655.53323.e9. [DOI] [PubMed] [Google Scholar]
Associated Data
This section collects any data citations, data availability statements, or supplementary materials included in this article.