

Abstract
The painful vaso-occlusive crises (VOC) that characterize sickle cell disease (SCD) progress over hours from the asymptomatic steady-state. SCD patients report that VOC can be triggered by stress, cold exposure and pain itself. We anticipated that pain could cause neural-mediated vasoconstriction, decreasing regional blood flow and promoting entrapment of sickle cells in the microvasculature. Therefore, we measured microvascular blood flow in the fingers of both hands using plethysmography and laser-Doppler flowmetry while applying a series of painful thermal stimuli on the right forearm in 23 SCD patients and 25 controls. Heat pain applied to one arm caused bilateral decrease in microvascular perfusion. The vasoconstriction response started before administration of the thermal pain stimulus in all subjects, suggesting that pain anticipation also causes significant vasoconstriction. The time delay between thermal pain application and global vasoconstriction ranged from 5 to 15.5 seconds and increased with age (p < 0.01). Although subjective measures, pain threshold and pain tolerance were not different between SCD subjects and controls, but the vaso-reactivity index characterizing the microvascular blood flow response to painful stimuli was significantly higher in SCD patients (p = .0028). This global vasoconstriction increases microvascular transit time, and may promote entrapment of sickle cells in the microvasculature, making vaso-occlusion more likely. The rapidity of the global vasoconstriction response indicates a neural origin that may play a part in the transition from steady-state to VOC, and may also contribute to the variability in VOC frequency observed in SCD patients.
Keywords: Thermal pain, pain anticipation, vasoconstriction, sickle cell disease (SCD), autonomic nervous system (ANS)
Introduction
Sickle cell disease (SCD) is an inherited blood disorder resulting from the substitution of the amino acid valine at the sixth position of the β-globin chain to a glutamine, forming sickle hemoglobin (HbS)2, 3. HbS, unlike normal hemoglobin, polymerizes in the deoxy-state causing red blood cells (RBC) to become rigid and obstruct microvascular blood flow4. Chronic, intermittent microvascular occlusion produces episodes of excruciating pain, progressive organ damage and premature death5, 6. There is tremendous variability in the frequency of vaso-occlusive crises (VOC) among SCD patients who have the same hemoglobin genotype. Neither the cause of this variability, nor the triggers for transformation from steady state to VOC are fully understood.
SCD patients report that pain usually starts in a local region of the body, and then either intensifies and spreads, or resolves on its own. This transition from steady state to VOC evolves over minutes to hours. Much of the SCD literature regarding the causes of VOC has focused on the role of inflammation7–10, cellular adhesion11–16 and nitric oxide depletion that all affect blood flow in the post-capillary venules and increase the probability of VOC17–20. However, the time course of symptom development and the regional nature of the onset do not seem consistent with these processes being the immediate triggers of VOC.
Decreased regional blood flow causing RBC retention in the microvasculature was proposed in the 70s by Eaton and Hofrichter21–26 as the fundamental mechanism of VOC. Normal RBC are flexible and can deform as they pass through a capillary network and deliver oxygen (O2) to tissues. However, HbS polymerizes some time after releasing O2, causing the flexible HbS-RBC to transform into the rigid, non-deformable sickle RBC. If the time it takes for HbS-RBC to travel out of the microvasculature into a larger diameter vessel is longer than the time for HbS polymerization, the deoxygenated rigid HbS-RBC become lodged in the microvasculature, causing vaso-occlusion22–27. Thus, the likelihood of local vaso-occlusion depends on two factors: 1) the flow rate through the microvascular segment; and 2) the time between onset of the deoxy-S state and polymerization. Presumably, cascade of this process to multiple microvascular beds results in clinically noticeable VOC.
Flow rate at pre-capillary arteriole affects microvascular transit time and is regionally regulated by the autonomic nervous system (ANS), which can be substantially affected by stress, emotions, change in temperature, and pain itself, all factors that SCD patients report as triggers of the onset of VOC. We have previously shown that a marked parasympathetic nervous system withdrawal in response to transient hypoxia as well as a sympathetically-mediated drop in peripheral perfusion induced by a sigh occur in SCD subjects, but not in controls28, 29. Others have shown that SCD patients with clinically severe disease have more parasympathetic withdrawal and greater sympatho-vagal imbalance during psychological challenge30. These data suggest that SCD patients have autonomic hyper-responsiveness31–33, and that autonomic imbalance may play a role in the genesis of VOC.
We hypothesized that pain may cause neural-mediated vasoconstriction, increasing HbS-RBC transit time in the microvasculature, culminating in the development of clinically apparent VOC, which in turn results in more pain. Moreover, we anticipated that there would be a substantial individual variability in the neural-mediated vasoconstriction response to pain, and that this might contribute to some of the well-known variability in VOC frequency among SCD patients with the same hemoglobin genotype.
To address this hypothesis, we developed a novel methodology to objectively quantify regional microvascular blood flow as a physiological biomarker for neural response to thermal pain in SCD patients and controls. Because of the enhanced vasoconstriction response to sigh28, and cardiovascular autonomic dysfunction described in SCD patients34 as well as the possible role of parasympathetic withdrawal in propensity to VOC31, we also assessed cardiac autonomic balance in response to thermal pain.
Materials and methods
Patient Recruitment
The study was carried out under the auspices of a research protocol approved by the Committee on Human Investigation at Children’s Hospital Los Angeles (CHLA). SCD patients who were either stable on chronic transfusion, or not on chronic transfusion were recruited from the population of patients in the hemoglobinopathy center at CHLA. Non-SCD individuals were recruited from patient’s families and friends as race-matched controls. The characteristics of the subjects are summarized in Table 1 (online supplement). Sixteen SCD patients were chronically transfused, and 4 of the 7 non-transfused patients were treated with hydroxyurea. Twenty-two SCD patients were homozygous (HbSS). One patient S-β0 thalassemia patient was included with the SS subjects in the analysis. Among the controls, 14 participants had sickle trait (HbAS) and 11 had normal hemoglobin (HbAA). Participants were eligible if they were 13 years of age or older, and competent to understand the consent and follow instructions.
Pre-study procedure
All studies were performed in the morning. To minimize any external effects of the participants’ autonomic responses, participants were asked to refrain from caffeine intake and avoid heavy physical exercise on the day of the testing.
Participants were asked to fill out Pain Anxiety Symptoms Scale Questionnaire or Children-Pain Anxiety Symptoms Scale Questionnaire to determine their anxiety level to pain specifically35–37. This was done on the study day, prior to the pain and autonomic testing. Medical history and a blood sample were obtained prior to testing.
Standardized instructions and a short demonstration were given to participants to familiarize them with the instrumentation and sensory testing procedures.
Experimental protocol
Measurements were carried out in a quiet, dimmed light, temperature-controlled room where the participant rested comfortably at an approximately 45-degree angle on a cushioned chair with arm and leg supports. After the monitoring devices were connected, the participant was instructed to rest quietly for 15 minutes to allow all signals to stabilize before any recordings were made. The thermal pain was introduced using Medoc Thermal Neurosensory Analyzer (TSA-II,38) through a thermode attached along the ventral side of the participant’s right forearm. Outputs from the thermal neurosensory analyzer and the physiological sensors were connected to a multichannel analog to digital converter (BIOPAC system-AcqKnowledge data acquisition software) to measure the change in temperature during pain administration and the change in response signals with millisecond time accuracy.
When the signals were stabilized, a 5-minute baseline recording was made followed by administration of the pain task during which the participant received 6 thermal pain pulses that were separated by 30 seconds. Figure 1 shows the raw data recording from a typical experiment and the key times of data analysis. Only the responses measured in the hand opposite to the pain stimulus are shown. The temperature was automatically increased gradually by 1°C/second from the baseline thermode temperature (32°C), and the participant was instructed to say “pain” when the heat was perceived as painful, halting the stimulus and rapidly resetting the thermode temperature to 32°C with a return rate of 10°C/second. This was repeated two more times, and the average temperature of first three thermal pain pulses was considered as the “pain threshold”. This was repeated except the participant was instructed to say “stop” when the pain was perceived as intolerable. The average temperature of the last three thermal pain pulses was considered as “pain tolerance”.
Figure 1. Typical peripheral vasoconstriction response to thermal pain and pain anticipation.
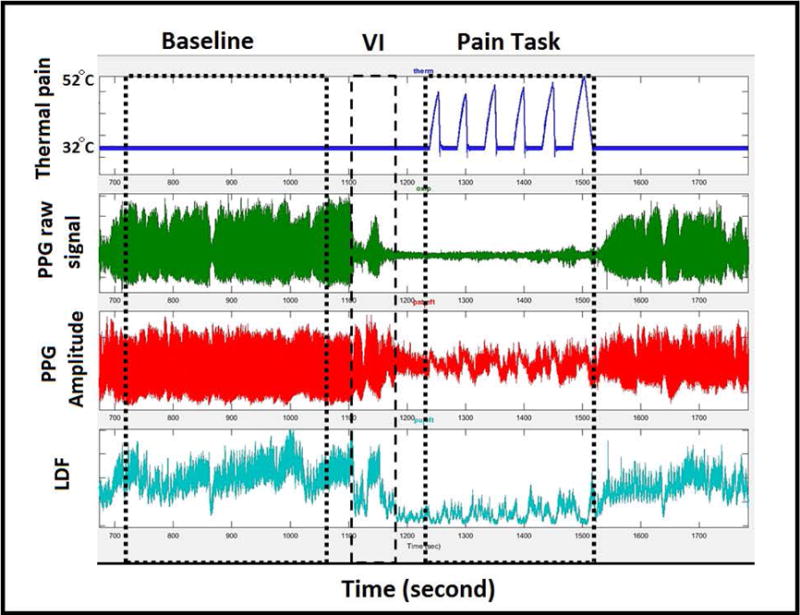
First tracing is temperature pulse in the thermode attached on the right forearm. Second and third tracing are the raw and amplitude of the plethysmography sensor (PPG) placed on the left thumb. The forth tracing is the microvascular perfusion measured by laser-Doppler flow (LDF) placed on the dorsum of the distal phalanges of left index finger. Clear decrease in the signal amplitude occurs during the verbal instruction (VI) with further decrease in flow coincident with the pain pulses.
One minute before the pain task, the study operator verbally notified the participant that the painful stimulus would start in the next minute. This time period is referred as pain anticipation provoked by verbal instruction (VI) in Figure 1.
There were no crises or adverse events caused by these procedures.
Signal processing and Analysis parameters
Recorded data from all devices were exported for processing and analysis using a locally developed data browser programmed in MATLAB. The following regions of the signal were identified in all experimental sessions: a) baseline for 5 minutes; b) verbal instruction for 40 seconds; c) pain task for 3 minutes, from the beginning of the first thermal pain pulses to the end of the last one.
Changes in peripheral microvascular blood flow were measured by an infrared plethysmograph (PPG; NONIN Medical, USA) sensor that was placed on the ipsilateral and contralateral thumb. The raw waveform (Figure 1; 2nd signal) and wave amplitude derived from the signal (Figure 1; 3rd signal) reflect the change in cross-sectional area of the small arterioles, capillaries, and venules at the fingertip, which indirectly reports regional microvascular blood flow. Decrease in this parameter reflects vasoconstriction.
Vasoconstriction events detected by plethysmography were validated using laser-Doppler, which measures microvascular perfusion by different detection principle39. Temperature-controlled laser-Doppler flow sensors (Perimed, Jarfalla, Sweden) were placed on the dorsum of the distal phalanges of index fingers of both hands, 3 mm proximal to the nail bed. The laser-Doppler detects RBC velocity in a 1 mm3 volume of the dermal microvasculature under the sensor using the Doppler effect and light scattering, reflecting tissue perfusion39 (Figure 1; 4th signal).
Changes in the perfusion signals seen in rows 3 and 4 of Figure 1 seem to occur in response to the temperature pulses in row 1 of Figure1, but the association is not clear because of noise and changes in blood flow not related to the painful stimulus. Thus, we used cross-correlation40 between the thermal pain signal and the microvascular blood flow (both plethysmography and laser-Doppler) to determine if the pattern of pain stimuli was present in the perfusion response. We determined the maximum cross-correlation from 30 seconds before to 30 seconds after the sequence of pain pulses, deriving the following parameters: 1) the maximum Spearman correlation coefficient; 2) per-individual permutation p-values indicating the statistical significance of the match; 3) time shift in seconds between stimulus and maximum correlation (vasoconstriction delay time); and 4) slope of the linear regression of the blood flow signal on the stimulus signal at the corresponding shift time, representing [Δ microvascular blood flow]/[Δ temperature] (vaso-reactivity index). The permutation p-value was determined by comparing the maximum correlation coefficient of the pain pulses with blood flow at the same time as the pain task to the maximum correlation coefficient of the pain pulses during the baseline when no stimulus was being applied. Random blood flow changes not synchronized with the pattern of heat pain pulses will not result in a statistically significant correlation. Other parameters derived from the plethysmography signal include: 1) mean blood flow during baseline; 2) mean blood flow during verbal instruction; and 3) mean blood flow during pain task.
Cardiac autonomic balance in response to thermal pain was assessed by analysis of heart rate variability evaluated by stationary spectral analysis of beat-to-beat variability (R-to-R interval), as we previously described28, 29, and by the mean and standard deviation of the R-to-R interval during baseline, verbal instruction, and pain task. Low frequency power of heart rate variability (LFP; 0.04-0.15 Hz) reflects a combination of cardiac sympathetic and parasympathetic activity41 while high frequency power of heart rate variability (HFP;0.15-0.4 Hz) reflects parasympathetic activity41–43. Mean R-to-R interval represents change in heart rate and the standard deviation of the R-to-R interval represents total heart rate variability.
Statistical analysis
All continuous variables output from the signal processing algorithms in the data browser were expressed as mean and standard deviation, whereas all categorical variables were expressed as number (n), and percentage (%). Repeated measures analysis of variance was used to compare the differences in mean microvascular blood flow during baseline, verbal instruction and pain task. Tukey’s test was used for multiple pairwise comparisons.
Multivariate normal regression analysis was used to investigate the joint significance of disease group (SCD or control) and participant’s demographics on the microvascular blood flow parameters. Initially, vaso-reactivity index, vasoconstriction delay time, mean blood flow during baseline and mean blood flow during pain task were included in the multivariable model. Neither of the latter two parameters was associated with the other covariates; thus, both were dropped from the model. Vaso-reactivity index and vasoconstriction delay time were modeled with linear predictors comprising covariates of demographics and disease features under a multi-dimensional normal assumption. The significance of individual covariates as predictors of these joint outcome measures was assessed and those with nominal significance of p<0.50 were included in an initial multivariable model. Individual covariates were removed from this model in order of least significance until all remaining variables were significant at a nominal p<0.20 level, resulting in a final multivariable model.
Repeated measures analysis of variance and Tukey’s test were performed for stationary spectral indices-low and high frequency power to assess the difference between periods of baseline, verbal instruction and pain task. Spectral indices, mean and standard deviation of the R-to-R interval were log-transformed to satisfy the assumption of normality. Variables were assessed for interaction and confounding effect. All p-values are two-sided with significance of p ≤ 0.05. All statistical analyses were performed using the statistical software STATA/IC 14.1 (StataCorp LP, Texas).
Results
Patient demographics are summarized in Table 1 (online supplement). The two groups of participants were reasonably well balanced for gender, but not for age. HbS concentrations were measured for each participant; however, it was not included in the analysis because it served only as a surrogate for diagnosis. Analyses within the controls (SCT versus healthy) and the SCD group (transfused versus non-transfused) were performed and no differences were found. Based on these analyses, sickle trait subjects were grouped with non-trait controls, and transfused and non-transfused SCD subjects were grouped together.
Vasoconstriction in response to thermal pain is greater in SCD subjects
Figure 1 shows a characteristic microvascular blood flow response from a single participant subjected to a sequence of pain pulses. The Spearman correlation coefficient between rising pain temperatures and decreasing microvascular flow by plethysmography during pain task was highly significant (p<0.001) in 47 of the 48 participants, indicating that both SCD and control subjects experienced thermal pain-induced vasoconstriction on the contralateral side to the pain stimulus. Similar responses were observed when the microvascular flow was assessed simultaneously by laser-Doppler, where 77% (n=37) had vasoconstriction on the contralateral hand and 73% (n=35) on the ipsilateral hand. The cross-correlation function was able to detect bilateral pain-induced vasoconstriction in both SCD patients and controls.
The magnitude of the vasoconstriction response to pain was clearly different between SCD patients and controls (overall p=0.0077, vaso-reactivity index p=0.0028) after controlling for age and gender in the multivariate analysis (Table 3). Vaso-reactivity was significantly higher in SCD patients, indicating that those patients had a greater blood flow change in response to thermal pain than controls (Figure 2A). However, the apparent shorter time between stimulus and vasoconstriction seen in univariate analysis (Table 2; online supplement) was due to the older age of controls. The vasoconstriction response to pain was delayed by a mean of 9.9 seconds, and showed significant variability among participants (vasoconstriction delay ranged 5 to 15.5, Figure 2B). Similarly, the vaso-reactivity index displayed variability among participants with a mean vasoconstriction response index of 0.99 arbitrary units (range −0.06 to 1.8, Figure 2C).
Table 3.
Parameter estimates, standard errors and p-values for final multivariable model of vasoconstriction delay time and Vaso-reactivity index on Diagnosis, gender, and age (N=48).
| Variable | Category/Units | Vasoconstriction Delay Time Estimate (S.E.) | Vasoconstriction Delay Time (p-value) | Vaso-reactivity index Estimate (S.E.) | Vaso-reactivity index (p-value) | Overall p-value |
|---|---|---|---|---|---|---|
| Diagnosis | Control | – | 0.4408 | – | 0.0028* | 0.0077 |
| SCD | −0.7123 (0.9157) | 0.3997 (0.1232) | ||||
| Gender | Male | – | 0.847 | – | 0.0247* | 0.0779 |
| Female | −0.1659 (0.8555) | −0.2676 (0.1150) | ||||
| Age | (per year) | 0.1143 (0.0454) | 0.0156* | −0.0015 (0.0061) | 0.8046 | 0.0488 |
| Intercept | – | 7.402 (1.4415) | <0.001 | 0.99998 (0.194) | <0.001 | – |
statistically significant in multivariable model
Figure 2. Vasoconstriction delay time and Vaso-reactivity index in SCD and control.


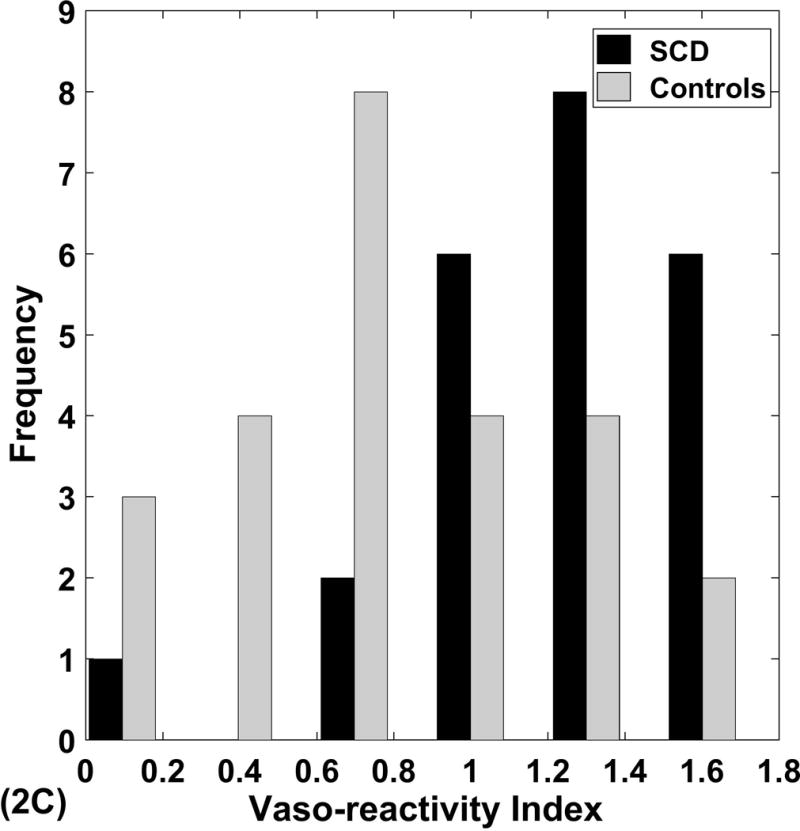
Panel A shows the joint mean ± SE of vaso-reactivity index (VDI) and vasoconstriction delay time (VDT) with associated p values from the multivariable model. Panels B, C show the significant individual variability in these parameters.
Gender did affect vaso-reactivity, but had no effect in the overall model (Table 3). Of note, there was no difference in the pain threshold and pain tolerance temperatures between SCD patients and controls.
Pain anticipation significantly decreases microvascular blood flow in SCD and control subjects
Interestingly, there was a significant drop in blood flow during verbal instruction before administration of the first painful stimulus in most participants, which can be clearly seen in the plethysmography and laser-Dopper signals in Figure 1. Highly significant differences (p<0.001) in the mean microvascular blood flow between the baseline, verbal instruction, and pain task regions were observed (Figure 3), indicating that fear of pain provoked by the verbal instruction caused vasoconstriction, and thermal pain caused further vasoconstriction. These changes in microvascular flow due to fear of pain were the same in SCD and controls and were not dependent on age or gender.
Figure 3. Mean ± SE of microvascular blood flow in response to fear of pain (verbal instruction) and thermal pain in all participants.

Analysis of variance; overall p-value: p<.0001. The response in SCD did not differ from control.
We expected that anxiety might modulate the responses to the pain stimuli, and assessed the participant’s anxiety with standard anxiety questionnaires on the day of each study. The mean pain anxiety score was significantly higher in SCD patients than in controls (p=0.009) (Table 1; online suppliment). However, there was no association between the pain anxiety scores and vaso-reactivity or vasoconstriction delay, or any effect of age or gender.
Thermal pain and pain anticipation alter cardiac autonomic balance
The results of the heart rate variability analysis reflecting cardiac autonomic function during baseline, verbal instruction, and pain task are presented in Figure 4 (online supplement). Mean R-to-R interval, standard deviation and low frequency power dropped significantly during verbal instruction, indicating that fear of pain increased the heart rate and decreased total heart rate variability (p<0.001). However, high frequency power did not change significantly. The combination of increase in heart rate and decrease in low frequency power suggest parasympathetic withdrawal that resulted in loss of heart rate variability during the pain fear period with partial recovery during the pain administration. While fear of pain during verbal instruction and pain itself had a substantial effect on autonomic balance, the response in SCD patients was not different from that in controls.
Discussion
Sickle cell disease is characterized by the rapid onset of acute, painful vaso-occlusive episodes that, as patients often state, are triggered by emotional stress, cold temperature, or pain itself. These acute VOC, which start in a local region of the body, occur on a background of progressive, chronic vascular disease that is related to inflammation7–10, vascular shear stress14, 15, and toxic endothelial damage44. Substantial variability in the frequency of VOC exists among patients having the same genotype. Factors like HbF concentration and basal oxygen saturation affect VOC frequency in the SCD population45, 46, but likely do not change quickly within a local region of the body, nor do they change sufficiently over the relatively short time period that characterizes the transition to crisis. Eaton and Hofrichter proposed that a decrease in regional blood flow would result in RBC sickling before they could escape into larger diameter vessels, leading to entrapment of the sickled cells in the microvasculature22–27. Certainly, the mechanism that triggers the transition from steady state to acute VOC is multifactorial; therefore, anything that reduces regional perfusion would promote RBC entrapment. Factors like nitric oxide depletion and cellular adhesion in the post-capillary venules evolve at slower rate and likely contribute more to the chronic microvascular tone that reinforces rather than triggers the transition from steady state to VOC. The data presented here show rapid and dramatic global neurally-mediated decrease in regional perfusion caused by pre-capillary arteriolar constriction in response to autonomic triggers like pain and fear. This previously unexplored neural-mediated vasoconstriction response could be linked to the initiation of VOC and the variability of VOC frequency within genotype.
Heat pain has been studied in many settings, including SCD, but the participants’ subjective perception of pain was used as a measurement of pain sensitivity47, 48. Those studies showed that the perception of pain differed in SCD from controls. In contrast, we found that pain threshold and tolerance temperatures were not different between SCD and control, but the magnitude of the vasoconstriction response to pain was significantly greater in SCD. This suggests that SCD patients and controls might have similar pain perception, but different perfusion reactivity to the same calibrated heat exposure.
Abrupt vasoconstriction events are obvious from inspection of the blood flow tracings (Figure 1), and seem to occur randomly as well as in response to sighs28, complicating the detection of vasoconstriction responses to experimental pain stimuli in humans. The use of a pattern of pain stimuli and cross-correlation analysis allows statistical differentiation of pain-induced vasoconstriction from spontaneous blood flow changes. These experiments showed that both SCD and controls had vasoconstriction in response to thermal pain. The vasoconstriction response occurred 5 to 15.5 seconds after the stimulus, and the delay was highly variable between participants (Figure 2B, C). We expected to see a shorter delay time between stimulus and onset of response in SCD patients because of the autonomic hypersensitivity suggested by sigh-induced vasoconstriction in SCD patients28, and hypersensitivity to pain in sickle mice in direct neuron recordings49. However, while this was apparent in the univariable analysis (Table 2; online supplement), the difference in delay between pain and vasoconstriction in our data was related to participant’s age (p= .01) in the multivariable model, which is consistent with the known slowing of nerve conduction velocity with increasing age50, 51.
The vasoconstriction response to pain happened in both contralateral and ipsilateral hands, indicating that this effect is neurally-mediated and global, and it is not due to a local effect of the heat. This response is due in part to an autonomic response, but could also be influenced by end-organ sensitivity to neural stimulation. Certainly, nitric oxide depletion can impair arteriolar dilation, and endothelin-1, which is elevated in SCD, can promote vasoconstriction52–54. This may explain the increased responsiveness seen in SCD. However, the timing of the response in our experiments and the fact that it occurred within a few seconds contralateral to the stimulus supports a neural trigger. The calculated change in blood flow with respect to change in temperature or vasoconstriction responsiveness was also quite variable among participants, but was significantly higher in SCD patients (Figure 2A, p=.0028), indicating that SCD patients might have autonomic hyper-responsiveness and/or end-organ hypersensitivity to neural stimulation28, 55.
A dramatic decrease in perfusion was observed in response to verbal instruction-induced stress when participants were told they would soon feel pain. It was evident from inspection of the raw data that there were dramatic differences among participants with respect to the duration of “fear”-induced vasoconstriction, but no difference could be detected between SCD and controls. Although SCD patients had much higher pain anxiety scores, the pre-study questionnaire scores did not correlate with perfusion changes. Nonetheless, the profound vasoconstriction observed with anxiety/stress is consistent with clinical observation that social and physical stress can trigger VOC, potentially through neurally-mediated vasoconstriction.
Interestingly, patterns of microvascular flow in SCD were noted to differ from control in early studies using laser-Doppler, though the mechanism was not understood56–58. This was postulated as a target for treatment59 and in fact, the vasoactive agent buflomedil was shown to improve microvascular flow60. The connection of these flow oscillations to autonomic regulation and the autonomic hypersensitivity of SCD subjects didn’t become clear until the observation that SCD subjects vasoconstrict in response to sigh at a much greater rate than normal controls28. While the precise timing of the respiratory response to a minimal respiratory stimulus like a sigh was reported recently, the fact that blood flow decreased with deep respiration was reported in the later 1800’s61.
Based on this autonomic vascular sensitivity, we expected to see differences in cardiac autonomic balance in response to pain and there were clear changes between baseline, verbal instruction, and pain task in all subjects. However, there were no measureable differences between SCD patients and controls. Unlike with sigh-induced vasoconstriction where the stimulus was less than maximal28, we suspect that the pain stimuli used here were too intense to detect subtle differences that might be due to altered autonomic responsiveness.
Our data strongly show that thermal pain and fear of pain induce significant rapid global decrease in microvascular blood flow. This response is mediated through the autonomic nervous system and occurs in SCD subjects and controls although the change in blood flow per unit change in thermal stimulus is greater in SCD. Furthermore, the fact that both SCD and control subjects vaso-constrict in response to pain does not diminish the importance of these findings with respect to the physiology of SCD. Increasing microvascular transit time will make microvascular occlusion more likely with Hb-S21, 23. These same vascular reactivity parameters may also have significance in disorders like angina. While all vascular beds are not interchangeable, change in flow measured by plethysmography in the fingertip in response to mental stress correlations strongly with cardiac perfusion measured at the same time in subjects with coronary artery disease62. The methodology presented here offers a way to objectively quantify these physiological responses to pain using microvascular perfusion as a biomarker rather than the subjective report of a pain scale reading. Importantly, this biophysical biomarker affects the RBC transit time and is thus directly related to the mechanism of microvascular occlusion in SCD21, 23. The cross-correlation and the linear regression methods numerically characterize the time from stimulus onset to vasoconstriction and the vaso-reactivity to pain in individual participants. These data also show that there is substantial variability in vasoconstriction delay time, vasoconstriction response to pain, and fear of pain. These significant individual differences in vascular responsiveness may explain some of the variation in clinical severity in SCD patients who are otherwise genetically similar. The validation of this concept awaits results of ongoing studies correlating these physiological biomarkers with daily frequency of pain in SCD patients. Pain and anxiety cause significant global vasoconstriction, decreasing the perfusion in many segments of the microvasculature, and may escalate the progression from vaso-occlusion to crisis. Regional microvascular perfusion is an important biomarker that will likely help us to understand the SCD physiology and may serve as a measurable therapeutic target.
Supplementary Material
Figure 4 Cardiac autonomic balance in response to fear of pain and thermal pain. Panel A shows mean ± SE of the R-R interval on a log scale at baseline, fear (verbal instruction) and during pain. Panel B shows the low frequency power (LFP) on a log scale, reflecting sympathetic and parasympathetic response. (supplemental online)
Key points.
Thermal pain and pain anticipation cause bilateral vasoconstriction in sickle cell patients and healthy controls.
Greater vascular responsiveness to pain in sickle cell patients suggests enhanced autonomic control of microvascular perfusion.
Acknowledgments
The authors thank Brandon Lung for his contribution in data collection, Dr. Marsha Treadwell for her contribution in study design and Dr. Martine Torres for editing the manuscript. This work was supported by grants from the National Institutes of Health National Heart, Lung, and Blood Institute (U56 HL117718) (TDC, MCKK, LZ, JW, HM).
Footnotes
Presented in abstract form at the 57th annual meeting of the American Society of Hematology, Orlando, FL, December 5, 20151
Contributors: M.K. designed and performed the experiments, data acquisition and analysis and wrote the paper; M.P. designed and carried out the experiment; J.S. performed the experiments, data acquisition and analysis; P.S. data analysis and statistical analysis, wrote the paper; R.M.K. designed and supervised the experiments; P.C. designed the experiment, data analysis; W.T., J.D., J.C.W. data analysis; J.T., L.Z. designed the experiment; R.S. statistical analysis and wrote the paper; M.C.K.K. designed the experiment, data analysis; T.D.C. concieved and designed the experiment, data analysis and wrote the paper ; and all authors reviewed and revised the manuscript.
Conflict-of-interest disclosure: The authors declare no competing financial interests.
Uncategorized References
- 1.Khaleel M. Thermal pain and pain anticipation induce a decrease in microvascular perfusion in sickle cell and normal subjects. Blood. 2015;126:67–67. [Google Scholar]
- 2.Itano HA, Pauling L. A rapid diagnostic test for sickle cell anemia. Blood. 1949;4:66–68. [PubMed] [Google Scholar]
- 3.Pauling L, Itano HA, et al. Sickle cell anemia a molecular disease. Science (New York, NY) 1949;110:543–548. doi: 10.1126/science.110.2865.543. [DOI] [PubMed] [Google Scholar]
- 4.Platt OS. The sickle syndromes. In: Handin RI, Lux SE, Stossel TP, editors. Blood, Principles and Practice of Hematology. Philadelphia: JP Lippencott; 1995. pp. 1346–1397. [Google Scholar]
- 5.Platt OS, Thorington BD, Brambilla DJ, et al. Pain in sickle cell disease. Rates and risk factors. N Engl J Med. 1991;325:11–16. doi: 10.1056/NEJM199107043250103. [DOI] [PubMed] [Google Scholar]
- 6.Ballas SK. Pain management of sickle cell disease. Hematology/oncology clinics of North America. 2005;19:785–802. doi: 10.1016/j.hoc.2005.07.008. v. [DOI] [PubMed] [Google Scholar]
- 7.Hofstra TC, Kalra VK, Meiselman HJ, et al. Sickle erythrocytes adhere to polymorphonuclear neutrophils and activate the neutrophil respiratory burst. Blood. 1996;87:4440–4447. [PubMed] [Google Scholar]
- 8.Turhan A, Weiss LA, Mohandas N, et al. Primary role for adherent leukocytes in sickle cell vascular occlusion: A new paradigm. Proceedings of the National Academy of Sciences. 2002;99:3047–3051. doi: 10.1073/pnas.052522799. [DOI] [PMC free article] [PubMed] [Google Scholar]
- 9.Hidalgo A, Chang J, Jang J-E, et al. Heterotypic interactions enabled by polarized neutrophil microdomains mediate thromboinflammatory injury. Nat Med. 2009;15:384–391. doi: 10.1038/nm.1939. [DOI] [PMC free article] [PubMed] [Google Scholar]
- 10.Krishnan S, Setty Y, Betal SG, et al. Increased levels of the inflammatory biomarker C-reactive protein at baseline are associated with childhood sickle cell vasocclusive crises. British Journal of Haematology. 2010;148:797–804. doi: 10.1111/j.1365-2141.2009.08013.x. [DOI] [PMC free article] [PubMed] [Google Scholar]
- 11.Hoover R, Rubin R, Wise G, et al. Adhesion of normal and sickle erythrocytes to endothelial monolayer cultures. Blood. 1979;54:872–876. [PubMed] [Google Scholar]
- 12.Hebbel RP, Boogaerts MA, Eaton JW, et al. Erythrocyte adherence to endothelium in sickle-cell anemia. A possible determinant of disease severity. The New England journal of medicine. 1980;302:992–995. doi: 10.1056/NEJM198005013021803. [DOI] [PubMed] [Google Scholar]
- 13.Hebbel RP, Eaton JW, Steinberg MH, et al. Erythrocyte/endothelial interactions in the pathogenesis of sickle-cell disease: a “real logical” assessment. Blood Cells. 1982;8:163–173. [PubMed] [Google Scholar]
- 14.Kaul DK, Fabry ME, Nagel RL. Microvascular sites and characteristics of sickle cell adhesion to vascular endothelium in shear flow conditions: pathophysiological implications. Proceedings of the National Academy of Sciences of the United States of America. 1989;86:3356–3360. doi: 10.1073/pnas.86.9.3356. [DOI] [PMC free article] [PubMed] [Google Scholar]
- 15.Belhassen L, Pelle G, Sediame S, et al. Endothelial dysfunction in patients with sickle cell disease is related to selective impairment of shear stress-mediated vasodilation. Blood. 2001;97:1584–1589. doi: 10.1182/blood.v97.6.1584. [DOI] [PubMed] [Google Scholar]
- 16.Solovey AA, Solovey AN, Harkness J, et al. Modulation of endothelial cell activation in sickle cell disease: a pilot study. Blood. 2001;97:1937–1941. doi: 10.1182/blood.v97.7.1937. [DOI] [PubMed] [Google Scholar]
- 17.Reiter CD, Wang X, Tanus-Santos JE, et al. Cell-free hemoglobin limits nitric oxide bioavailability in sickle-cell disease. Nat Med. 2002;8:1383–1389. doi: 10.1038/nm1202-799. [DOI] [PubMed] [Google Scholar]
- 18.Mack AK, Kato GJ. Sickle cell disease and nitric oxide: A paradigm shift? The international journal of biochemistry & cell biology. 2006;38:1237–1243. doi: 10.1016/j.biocel.2006.01.010. [DOI] [PMC free article] [PubMed] [Google Scholar]
- 19.Kato GJ, Gladwin MT, Steinberg MH. Deconstructing sickle cell disease: reappraisal of the role of hemolysis in the development of clinical subphenotypes. Blood Rev. 2007;21:37–47. doi: 10.1016/j.blre.2006.07.001. [DOI] [PMC free article] [PubMed] [Google Scholar]
- 20.Kato GJ, Hebbel RP, Steinberg MH, et al. Vasculopathy in sickle cell disease: Biology, pathophysiology, genetics, translational medicine, and new research directions. Am J Hematol. 2009;84:618–625. doi: 10.1002/ajh.21475. [DOI] [PMC free article] [PubMed] [Google Scholar]
- 21.Eaton W, Hofrichter J, Ross P. Editorial: Delay time of gelation: a possible determinant of clinical severity in sickle cell disease. Blood. 1976;47:621–627. [PubMed] [Google Scholar]
- 22.Hofrichter J, Ross PD, Eaton WA. Kinetics and Mechanism of Deoxyhemoglobin S Gelation: A New Approach to Understanding Sickle Cell Disease. Proceedings of the National Academy of Sciences of the United States of America. 1974;71:4864–4868. doi: 10.1073/pnas.71.12.4864. [DOI] [PMC free article] [PubMed] [Google Scholar]
- 23.Christoph GW, Hofrichter J, Eaton WA. Understanding the Shape of Sickled Red Cells. Biophysical Journal. 2005;88:1371–1376. doi: 10.1529/biophysj.104.051250. [DOI] [PMC free article] [PubMed] [Google Scholar]
- 24.Ferrone FA, Hofrichter J, Eaton WA. Kinetics of sickle hemoglobin polymerization. I. Studies using temperature-jump and laser photolysis techniques. J Mol Biol. 1985;183:591–610. doi: 10.1016/0022-2836(85)90174-3. [DOI] [PubMed] [Google Scholar]
- 25.Ferrone FA, Hofrichter J, Eaton WA. Kinetics of sickle hemoglobin polymerization. II. A double nucleation mechanism. J Mol Biol. 1985;183:611–631. doi: 10.1016/0022-2836(85)90175-5. [DOI] [PubMed] [Google Scholar]
- 26.Hofrichter J. Kinetics of sickle hemoglobin polymerization. III. Nucleation rates determined from stochastic fluctuations in polymerization progress curves. J Mol Biol. 1986;189:553–571. doi: 10.1016/0022-2836(86)90324-4. [DOI] [PubMed] [Google Scholar]
- 27.Coates TD. So what if blood is thicker than water? Blood. 2011;117:745–746. doi: 10.1182/blood-2010-11-314484. [DOI] [PubMed] [Google Scholar]
- 28.Sangkatumvong S, Khoo MC, Kato R, et al. Peripheral vasoconstriction and abnormal parasympathetic response to sighs and transient hypoxia in sickle cell disease. Am J Respir Crit Care Med. 2011;184:474–481. doi: 10.1164/rccm.201103-0537OC. [DOI] [PMC free article] [PubMed] [Google Scholar]
- 29.Sangkatumvong S, Khoo MC, Coates TD. Abnormal cardiac autonomic control in sickle cell disease following transient hypoxia. Conf Proc IEEE Eng Med Biol Soc. 2008;2008:1996–1999. doi: 10.1109/IEMBS.2008.4649581. [DOI] [PubMed] [Google Scholar]
- 30.Pearson SR, Alkon A, Treadwell M, et al. Autonomic reactivity and clinical severity in children with sickle cell disease. Clin Auton Res. 2005;15:400–407. doi: 10.1007/s10286-005-0300-9. [DOI] [PubMed] [Google Scholar]
- 31.Nebor D, Bowers A, Hardy-Dessources MD, et al. Frequency of pain crises in sickle cell anemia and its relationship with the sympatho-vagal balance, blood viscosity and inflammation. Haematologica. 2011;96:1589–1594. doi: 10.3324/haematol.2011.047365. [DOI] [PMC free article] [PubMed] [Google Scholar]
- 32.Connes P, Coates TD. Autonomic nervous system dysfunction: Implication in sickle cell disease. C R Biol. 2013;336:142–147. doi: 10.1016/j.crvi.2012.09.003. [DOI] [PubMed] [Google Scholar]
- 33.Connes P. Altered autonomic nervous system function in sickle cell disease. Am J Respir Crit Care Med. 2011;184:398–400. doi: 10.1164/rccm.201105-0941ED. [DOI] [PubMed] [Google Scholar]
- 34.Romero Mestre JC, Hernandez A, Agramonte O, et al. Cardiovascular autonomic dysfunction in sickle cell anemia: a possible risk factor for sudden death? Clin Auton Res. 1997;7:121–125. doi: 10.1007/BF02308838. [DOI] [PubMed] [Google Scholar]
- 35.McCracken LM, Dhingra L. A short version of the Pain Anxiety Symptoms Scale (PASS-20): preliminary development and validity. Pain research & management. 2002;7:45–50. doi: 10.1155/2002/517163. [DOI] [PubMed] [Google Scholar]
- 36.Roelofs J, McCracken L, Peters ML, et al. Psychometric evaluation of the Pain Anxiety Symptoms Scale (PASS) in chronic pain patients. Journal of behavioral medicine. 2004;27:167–183. doi: 10.1023/b:jobm.0000019850.51400.a6. [DOI] [PubMed] [Google Scholar]
- 37.Page MG, Campbell F, Isaac L, et al. Reliability and validity of the Child Pain Anxiety Symptoms Scale (CPASS) in a clinical sample of children and adolescents with acute postsurgical pain. Pain. 2011;152:1958–1965. doi: 10.1016/j.pain.2011.02.053. [DOI] [PubMed] [Google Scholar]
- 38.Angst MS, Tingle M, Phillips NG, et al. Determining heat and mechanical pain threshold in inflamed skin of human subjects. J Vis Exp. 2009 doi: 10.3791/1092. [DOI] [PMC free article] [PubMed] [Google Scholar]
- 39.Fredriksson I FCaJJ. Laser Doppler Flowmetry - a Theoretical Framework. Department of Biomedical Engineering, Linköping University; 2007. [Google Scholar]
- 40.Proakis JG, Manolakis DG. Digital signal processing (3rd ed): principles, algorithms, and applications. Prentice-Hall, Inc; 1996. p. 968. [Google Scholar]
- 41.Eckberg DL. Sympathovagal Balance. A Critical Appraisal. 1997;96:3224–3232. doi: 10.1161/01.cir.96.9.3224. [DOI] [PubMed] [Google Scholar]
- 42.Cerutti S, Bianchi AM, Mainardi LT. Advanced spectral methods for detecting dynamic behaviour. Auton Neurosci. 2001;90:3–12. doi: 10.1016/S1566-0702(01)00261-2. [DOI] [PubMed] [Google Scholar]
- 43.Heart rate variability: standards of measurement, physiological interpretation and clinical use. Task Force of the European Society of Cardiology and the North American Society of Pacing and Electrophysiology. Circulation. 1996;93:1043–1065. [PubMed] [Google Scholar]
- 44.Klings ES, Farber HW. Role of free radicals in the pathogenesis of acute chest syndrome in sickle cell disease. Respiratory Research. 2001;2:280–285. doi: 10.1186/rr70. [DOI] [PMC free article] [PubMed] [Google Scholar]
- 45.Green NS, Barral S. Emerging Science of Hydroxyurea Therapy for Pediatric Sickle Cell Disease. Pediatric research. 2014;75:196–204. doi: 10.1038/pr.2013.227. [DOI] [PMC free article] [PubMed] [Google Scholar]
- 46.Maier-Redelsperger M, Noguchi CT, de Montalembert M, et al. Variation in fetal hemoglobin parameters and predicted hemoglobin S polymerization in sickle cell children in the first two years of life: Parisian Prospective Study on Sickle Cell Disease. Blood. 1994;84:3182–3188. [PubMed] [Google Scholar]
- 47.O’Leary JD, Crawford MW, Odame I, et al. Thermal pain and sensory processing in children with sickle cell disease. The Clinical journal of pain. 2014;30:244–250. doi: 10.1097/AJP.0b013e318292a38e. [DOI] [PubMed] [Google Scholar]
- 48.Brandow AM, Stucky CL, Hillery CA, et al. Patients with sickle cell disease have increased sensitivity to cold and heat. Am J Hematol. 2013;88:37–43. doi: 10.1002/ajh.23341. [DOI] [PMC free article] [PubMed] [Google Scholar]
- 49.Cataldo G, Rajput S, Gupta K, et al. Sensitization of nociceptive spinal neurons contributes to pain in a transgenic model of sickle cell disease. Pain. 2015;156:722–730. doi: 10.1097/j.pain.0000000000000104. [DOI] [PMC free article] [PubMed] [Google Scholar]
- 50.Thakur D, Paudel BH, Jha CB. Nerve conduction study in healthy individuals: a preliminary age based study. Kathmandu Univ Med J (KUMJ) 2010;8:311–316. doi: 10.3126/kumj.v8i3.6218. [DOI] [PubMed] [Google Scholar]
- 51.Jagga M, Lehri A, Verma S. Effect of aging and anthropometric measurements on nerve conduction properties-A review. Journal of exercise science and physiotherapy. 2011;7:1. [Google Scholar]
- 52.Graido-Gonzalez E, Doherty JC, Bergreen EW, et al. Plasma endothelin-1, cytokine, and prostaglandin E2 levels in sickle cell disease and acute vaso-occlusive sickle crisis. Blood. 1998;92:2551–2555. [PubMed] [Google Scholar]
- 53.Hammerman SI, Kourembanas S, Conca TJ, et al. Endothelin-1 Production during the Acute Chest Syndrome in Sickle Cell Disease. American Journal of Respiratory and Critical Care Medicine. 1997;156:280–285. doi: 10.1164/ajrccm.156.1.9611085. [DOI] [PubMed] [Google Scholar]
- 54.Ergul S, Brunson CY, Hutchinson J, et al. Vasoactive factors in sickle cell disease: in vitro evidence for endothelin-1-mediated vasoconstriction. Am J Hematol. 2004;76:245–251. doi: 10.1002/ajh.20107. [DOI] [PubMed] [Google Scholar]
- 55.L’Esperance VS, Cox SE, Simpson D, et al. Peripheral vascular response to inspiratory breath hold in paediatric homozygous sickle cell disease. Exp Physiol. 2013;98:49–56. doi: 10.1113/expphysiol.2011.064055. [DOI] [PMC free article] [PubMed] [Google Scholar]
- 56.Kennedy AP, Williams B, Meydrech EF, et al. Regional and temporal variation in oscillatory blood flow in sickle cell disease. Am J Hematol. 1988;28:92–94. doi: 10.1002/ajh.2830280205. [DOI] [PubMed] [Google Scholar]
- 57.Rodgers GP, Schechter AN, Noguchi CT, et al. Periodic microcirculatory flow in patients with sickle-cell disease. N Engl J Med. 1984;311:1534–1538. doi: 10.1056/NEJM198412133112403. [DOI] [PubMed] [Google Scholar]
- 58.Rodgers GP, Schechter AN, Noguchi CT, et al. Microcirculatory adaptations in sickle cell anemia: reactive hyperemia response. Am J Physiol. 1990;258:H113–H120. doi: 10.1152/ajpheart.1990.258.1.H113. [DOI] [PubMed] [Google Scholar]
- 59.Rodgers GP, Roy MS, Noguchi CT, et al. Use of selective vasodilation in treatment of sickle cell disease. Am J PediatrHematolOncol. 1988;10:351–356. doi: 10.1097/00043426-198824000-00018. [DOI] [PubMed] [Google Scholar]
- 60.Bachir D, Maurel A, Beuzard Y, et al. Improvement of Microcirculation Abnormalities in Sickle-Cell Patients Upon Buflomedil Treatment. Microvascular Research. 1993;46:359–373. doi: 10.1006/mvre.1993.1059. [DOI] [PubMed] [Google Scholar]
- 61.Binet A, Sollier P. Reserches sur le pouls cerebral dans ses rappets avec les attitudes du corps, la respirations et les actes psychiques. L’annee psychologique. 1895;2:590–594. [Google Scholar]
- 62.Goor DA, Sheffy J, Schnall RP, et al. Peripheral arterial tonometry: a diagnostic method for detection of myocardial ischemia induced during mental stress tests: a pilot study. Clinical cardiology. 2004;27:137–141. doi: 10.1002/clc.4960270307. [DOI] [PMC free article] [PubMed] [Google Scholar]
Associated Data
This section collects any data citations, data availability statements, or supplementary materials included in this article.
Supplementary Materials
Figure 4 Cardiac autonomic balance in response to fear of pain and thermal pain. Panel A shows mean ± SE of the R-R interval on a log scale at baseline, fear (verbal instruction) and during pain. Panel B shows the low frequency power (LFP) on a log scale, reflecting sympathetic and parasympathetic response. (supplemental online)