Abstract
The complex dynamic properties of biological timing in organisms remain a central enigma in biology despite the increasingly precise genetic characterization of oscillating units and their components. Although attempts to obtain the time constants from oscillations of gene activity and biochemical units have led to substantial progress, we are still far from a full molecular understanding of endogenous rhythmicity and the physiological manifestations of biological clocks. Applications of nonlinear dynamics have revolutionized thinking in physics and in biomedical and life sciences research, and spatiotemporal considerations are now advancing our understanding of development and rhythmicity. Here we show that the well known circadian rhythm of a metabolic cycle in a higher plant, namely the crassulacean acid metabolism mode of photosynthesis, is expressed as dynamic patterns of independently initiated variations in photosynthetic efficiency (φPSII) over a single leaf. Noninvasive highly sensitive chlorophyll fluorescence imaging reveals randomly initiated patches of varying φPSII that are propagated within minutes to hours in wave fronts, forming dynamically expanding and contracting clusters and clearly dephased regions of φPSII. Thus, this biological clock is a spatiotemporal product of many weakly coupled individual oscillators, defined by the metabolic constraints of crassulacean acid metabolism. The oscillators operate independently in space and time as a consequence of the dynamics of metabolic pools and limitations of CO2 diffusion between tightly packed cells.
A current trend in physics and life sciences is the investigation of spatiotemporal patterns that appear in phenomena that were formerly thought to be solely time dependent. Rhythmic phenomena are common in nature and are excellent models for investigation of spatial dynamics because of their regular structure. However, the complex dynamic properties of timing in organisms and biological systems remain a central enigma in biology despite the increasingly precise genetic characterization of oscillating units and their components (1, 2). For example, phase synchronization of predator–prey dynamics in spatially extended ecological systems emerges only when the building blocks are spatially arranged and interrelated by flows of signaling compounds (3). The challenge is to understand how the spatial organization of the components of a system can influence overall temporal development.
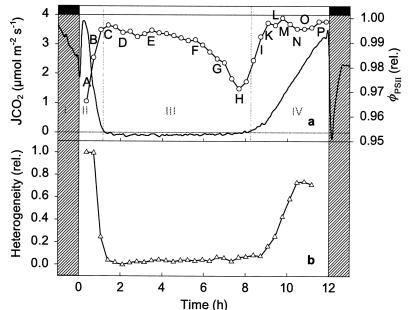
The circadian rhythm of net CO2 exchange (JCO2) in crassulacean acid metabolism (CAM) plants in continuous light is regarded as a time-dependent generic model system for exploration of endogenous rhythmicity in a well understood metabolic pathway (4–6). During the normal day/night cycle, CAM can be divided in four phases (7). In phase I, nocturnal CO2 fixation by phosphoenolpyruvate-carboxylase (PEPCase) leads to the formation of malic acid that is removed from the site of its formation in the cytoplasm by active accumulation to the central cell vacuole. Malic acid exerts negative feedback on its own formation via action on the enzyme PEPCase, modulated by phosphorylation/dephosphorylation via a PEPCase kinase and a phosphatase (8). After a transition phase in the early light period (phase II), malic acid is remobilized from the vacuole and decarboxylated. This decarboxylation generates high internal CO2 concentration, which closes stomata in the leaf epidermis. The CO2 released is refixed by ribulose-1,5-bisphosphate-carboxylase-oxygenase (RUBISCO) and assimilated via the Calvin cycle of photosynthesis (phase III). Finally, in the later light period, when malic acid stores are exhausted, stomata may open, and CO2 may be taken up and assimilated directly via RUBISCO (phase IV). The day/night cycle of CAM phases is seen in the curve of JCO2 in Fig. 1a.
Figure 1.
Light period of the day/night CAM cycle with JCO2 (——) and φPSII (—○—) of an attached leaf of K. daigremontiana measured simultaneously in a climate-regulated cuvette. The average of φPSII (a) is obtained by integrating over the leaf area imaged and shown in Fig. 2. A–P: Quantitative estimation of spatial heterogeneity (b) of φPSII is calculated according to ref. 24. The four phases of net CO2 exchange in CAM (JCO2) are: (I) nocturnal CO2 fixation via PEPCase leading to vacuolar malate accumulation; (II) transition between PEPCase and RUBISCO dominated CO2 fixation; (III) malic acid decarboxylation leading to high internal CO2 concentration and CO2 fixation by RUBISCO behind closed stomata; (IV) stomatal opening and CO2 fixation via RUBISCO. Experimental conditions were 28°C and 257 μmol photons m−2·s−1 (λ = 400–660 nm). Black and white bars indicate dark and light periods, respectively. Gas exchange was measured as in ref. 13.
Persistent endogenous circadian oscillation of JCO2 can be observed under constant external conditions, either in continuous darkness with initially CO2-free air (9) or in continuous light and normal air (4, 10). Stable oscillations in continuous light persist only at intermediate conditions of the external control parameters light intensity and temperature. Above and below thresholds of these parameters, rhythmic behavior changes reversibly to nonstochastic arrhythmic behavior (11, 12). Spectral analysis of the arrhythmic gas-exchange pattern shows a complex intrinsic structure (13). The change between rhythmic and arrhythmic domains occurs in response to very small changes of the level of the control parameters (e.g., within changes of leaf temperature of less than 1°C) (11). Transport processes over the tonoplast (the membrane of the cell vacuole) have been identified as key elements for endogenous rhythmicity of CAM (6).
From a theoretical point of view, the endogenous rhythm can be reproduced by a minimal model that reduces CAM to three metabolic pools, namely internal CO2 concentration and cytoplasmic and vacuolar malic acid levels, connected by several feedback loops that regulate malate influx and efflux of the vacuole (14, 15). The order state of the tonoplast operates as a beat oscillator or hysteresis switch in the model (16) that allows malic acid transport to and from the cell vacuole to override circadian control of the properties of PEPCase by a regulatory cascade that extends to the level of transcription (8, 17, 18). This model led to the hypothesis that spatial decoupling of metabolism dynamics in patches of leaf tissue could underlie the endogenous rhythm. Observations on the thermal abolition and restoration of the rhythm (13) and model simulations with spatially arranged individual oscillators (19) support this hypothesis.
Consequently, a challenging new question arises: can one actually distinguish spatiotemporal variations in photosynthetic activity of the uniform mesophyll cells in leaves of CAM plants, the synchronization of which is essential for rhythmicity? Patchiness has been observed in anatomically complex leaves (20) and after disturbance of steady-state photosynthesis (21). Anatomically related patchiness was not expected in leaves of Kalanchoë daigremontiana with the tightly packed uniform mesophyll cells. We explored this question using the noninvasive technique of chlorophyll fluorescence imaging (22) to map relative quantum efficiency of photosystem II (φPSII) over the leaf surface.
Materials and Methods
Plants.
Plants of K. daigremontiana Hamet et Perrier de la Bâthie were raised from adventitious plantlets obtained from leaves of the plant collection of the Botanical Garden, Darmstadt University of Technology. They were grown in soil culture in a greenhouse until they had produced six to seven pairs of fully developed leaves and were about 0.4–0.5 m tall. During winter, additional light (HQI-T, 400 W, Philips, Eindhoven, The Netherlands) was provided to extend the daylight period up to 12 h. Before the experiments, the plants were adapted for at least 3 days to 12 h dark and 12 h light. During adaptation, temperature was set to 21 and 28°C, respectively.
Gas Exchange Measurements.
The measurements of net CO2 exchange were performed in a climate-regulated chamber of the phytotron at Darmstadt, as previously described (11, 13). Net CO2 exchange was recorded by using the minicuvette system of H. Walz (Mess- und Regeltechnik, Effeltrich, Germany). A mature leaf of a plant was enclosed in the gas exchange cuvette while it remained attached to the plant. The thermistor used for measuring the temperature inside the cuvette was carefully attached to the lower side of the leaf. Thus, leaf temperature rather than air temperature was exactly regulated. Gas exchange data were recorded every 5 min by using a personal computer and a datalog program. The relative humidity of the air inside the cuvette was set at 60 ± 5% and was held constant. Photon flux activity (PFD) was measured in the range of 400–700 nm by using a Li-Cor (Lincoln, NE) quantum sensor. The conditions inside the phytochamber were adapted to the conditions inside the gas exchange cuvette.
Chlorophyll Fluorescence Imaging.
Fluorescence of chlorophyll a from the leaf inside the climate-regulated cuvette was measured by using a peltier-cooled digital camera (AP1/14, Apogee Instruments, Tucson, AZ) with computer-controlled exposure. Light was provided from eight 250-W computer-controlled halogen lamps. φPSII was imaged by noninvasive chlorophyll fluorescence measurements at 20-min intervals after the saturating flash method similar to that described by refs. 22 and 23. Values were normalized to the maximum obtained during the experiment (for quantification, see color codes provided with the pictures).
Mathematical Quantification of Heterogeneity.
The extent of heterogeneity was quantified by using methods from cellular automata theory (24), where heterogeneity is defined as average difference between states of nearest neighbors:
 |
1 |
where AI denotes the leaf area taken into account, and Σ is the state space, i.e., the set of possible values of each point in the image I. The quantity Nij denotes the neighborhood of the (i,j)th element and, as usual, |X| is the number of elements in the set X.
One pixel of the fluorescence imaging system accounts for a square leaf disk with a diameter of 200 μm, which is slightly less than the mean diameter of one mesophyll cell. As the elementary units of the dynamics are expected to be larger than one such pixel, we applied the heterogeneity operator from Eq. 1 after an 8 × 8 binning of the fluorescence image (heterogeneity was insensitive to binning over the range between 5 × 5 and 16 × 16). Similar results were obtained when a spatial correlation function was computed. For further details of this quantification method, see ref. 24.
Results and Discussion
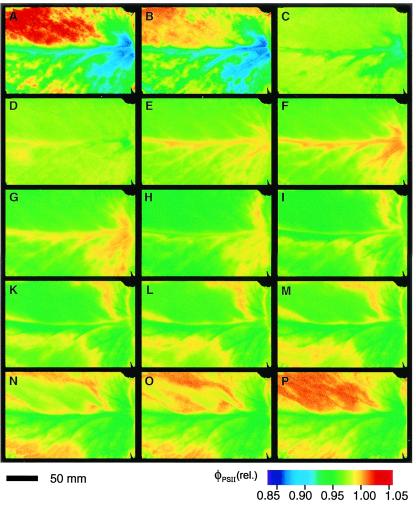
We mapped the spatiotemporal distribution of φPSII during the three distinct phases of CO2 fixation (JCO2; Fig. 1a) in the light period of normal CAM that were formerly thought to be uniformly time-dependent (7). Although φPSII averaged over the whole leaf varied little during the day, maps of φPSII show strongly heterogeneous isolated patches during phase II (Fig. 2 A and B), homogeneity during phase III (Fig. 2 C–H), and wave fronts initiated at the leaf base that extend over the entire leaf during the transition between phases III and IV (Fig. 2 H–N: wave front in the lower half of the leaf; K–P: wave front in the upper half of the leaf). These wave fronts persist until the end of phase IV, are initiated at different regions, and propagate with a velocity of about 4⋅10−6 m⋅s−1 (for further examples, see Movies 1 and 2, which are published as supporting information on the PNAS web site, www.pnas.org).
Figure 2.
Spatiotemporal heterogeneity of photosynthetic efficiency in a leaf of K. daigremontiana during the light period of the normal day/night CAM cycle. Maps of φPSII, captured at the times denoted by capital letters in Fig. 1a. φPSII was imaged by noninvasive chlorophyll fluorescence measurements at 20-min intervals following the saturating flash method similar to that described by refs. 22 and 23. Values were normalized to the maximum obtained during the experiment (see color code, Lower Right).
Heterogeneity of φPSII (Fig. 1b) is greatest when the rate of net CO2 fixation is high (low internal CO2 concentration) and when both competing carboxylases, RUBISCO and PEPCase, are active. Homogeneous φPSII emerges with the high internal CO2 concentrations that accompany malic acid decarboxylation and stomatal closure in phase III when PEPCase is inhibited. Sometimes these dynamic patterns of spatial and temporal heterogeneity are initiated over vascular tissue but in general cannot be correlated with anatomical structures in the relatively undifferentiated photosynthetic tissue with its tightly packed uniform cells. Rather, they behave as individual weakly coupled oscillators that emerge during periods of transition between stable pathways of carbon metabolism that differ in energy costs (25).
The identity of these individual oscillators can be deduced from the physiology and biochemistry of CAM. Individual patches of tissue display low φPSII during photosynthesis in air when internal CO2 concentrations may be as low as about 100 ppm (26) and high φPSII during malic acid remobilization when CO2 concentration may reach 10,000 ppm (27). Thus, individual oscillators can arise from differences in the storage capacity for malic acid and the timing of malic acid decarboxylation. Their individuality is presumably preserved by the high resistance to CO2 diffusion in the very small gas space in K. daigremontiana leaf tissue (4–10%; refs. 26 and 28). The coefficient for CO2 diffusion in wet cell walls is about 105 times lower than that for the gas phase (29).
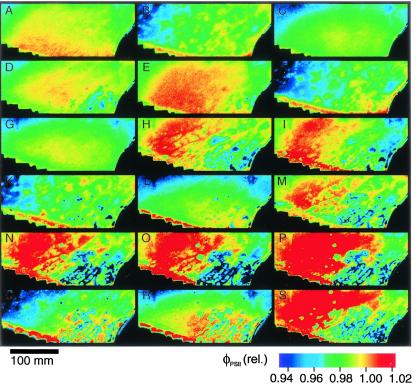
Even more pronounced heterogeneity of φPSII was observed during the free running endogenous rhythm in continuous light, showing, to our knowledge for the first time, that endogenous rhythmicity of CO2 exchange in CAM (JCO2; Fig. 3a) is associated with spatially and temporally separated variations in photosynthetic metabolism (Fig. 4). Imaging of φPSII indeed reveals patches of tissue that behave as individual oscillators, as already suggested by analyses of temperature disturbed, free-running endogenous rhythms (13), and corresponding model simulations (19).
Figure 3.
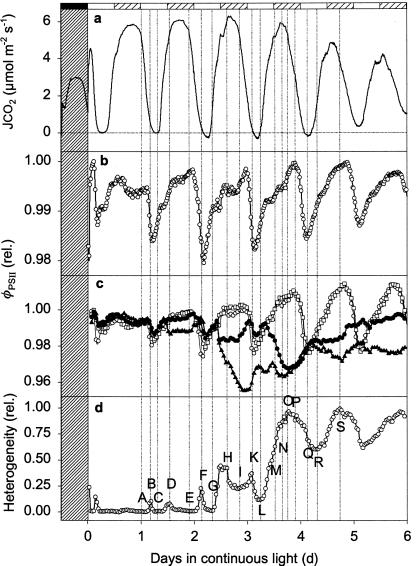
Endogenous rhythm of net CO2 exchange (a) and φPSII averaged over the entire leaf (b) in continuous light. In c, four separate patches (3 × 3 mm square) were monitored over time. The open symbols correspond to two patches in the center of the leaf, and the closed symbols correspond to two patches at the leaf base. In d, heterogeneity is quantified as described in Fig. 1. Experimental conditions were the same as in Fig. 1, but leaf temperature was 21°C and light-intensity 194 μmol photons m−2⋅s−1. Hatched bars indicate where a dark period would occur in normal day/night cycle.
Figure 4.
Spatiotemporal heterogeneity of φPSII in K. daigremontiana during the endogenous rhythm in continuous light. (A–S) The color maps of φPSII during the endogenous rhythm of CAM were taken at the times denoted by letters in Fig. 3d.
Two forms of heterogeneity emerging from leaves with relatively homogeneous φPSII can be distinguished during the endogenous rhythm. The first type appears as diffuse “cloud-like” patches of increasing φPSII during the transition from maxima to minima of CO2 uptake (Fig. 4 A to B, E to F). These patches correspond to peaks of heterogeneity (Fig. 3d after 1.2 and 2.2 days in continuous light) and become more heterogeneous during the time series. They resemble the patchiness observed during the passage from phase II to phase III in normal CAM (Fig. 2 A and B), corresponding to the transition to locally high internal CO2 concentrations. A second form of patches in φPSII with sharp pronounced boundaries starting clearly 2.5 days after the onset of light becomes dominant with time (Fig. 4 H, I, and M–S, blue patches of low φPSII; Lower Right). These patches are reflected in the stepwise increase of heterogeneity (Fig. 3d).
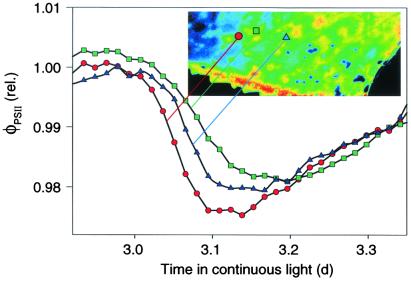
Oscillation of φPSII integrated over the whole leaf (Fig. 3b) corresponds to the time structure of JCO2 (Fig. 3a). This typical limit-cycle behavior has short and long time constants (15) that are reflected in periods of fast and slow change in φPSII (Fig. 3b). The periods of rapid decline in φPSII correspond to isolated peaks of heterogeneity (Fig. 3d), which are clear signatures of spatial desynchronization of weakly coupled oscillators. This desynchronization of φPSII, i.e., a phase difference between different patches of the leaf previously in phase, occurs during the transition from maximum to minimum and is followed by resynchronization (i.e., the phase differences vanish) some hours later (Fig. 5). Thus, our experimental approach provides an ideal biological system for testing the central role of phase synchronization in oscillating systems (3, 30).
Figure 5.
Asynchronous transition of φPSII from maximum to minimum in three different spots near the center of the leaf shown in Fig. 4. Magnification of a time window on day 3 in Fig. 3 showing φPSII of three spots (3 × 3 mm). The individuality of the oscillators is most obvious during the transition from maximum to minimum, which is governed by a short time constant. The patches resynchronize during the slow transition to the next maximum. The green and red symbols correspond to data shown in Fig. 3c (open symbols). The inserted picture is the same as Fig. 4K.
Another feature of the spatial patterns shown in Figs. 3 and 4 has even more important consequences for the long time scale behavior of the clock. With increasing time from the last zeitgeber (onset of continuous light), φPSII in some regions on the leaf ceases to oscillate strongly and enters a quasi-steady state, whereas in others the oscillations grow in amplitude (Fig. 3c). Moreover, even antiphase oscillations of different patches are observed (Fig. 3c, time 3.5 h). The resulting increase in heterogeneity (Fig. 3d) is reflected in a decline in the amplitude of φPSII integrated over the leaf. In general, heterogeneity is least at the minimum of the rhythmic CO2 exchange, showing that resynchronization occurs when internal CO2 concentration is highest. Quantitative analysis of heterogeneity (Fig. 3d) thus becomes an indispensable tool for the interpretation of the patchiness that underlies the endogenous rhythm.
The dynamic patterns imaged here may resemble the well known shifting between exitable, excited, and resting states with different time intervals in excitable media (31, 32). These and other general models explain, for example, the spatial structure of heart tissue dynamics (33), underlying signaling processes in colonies of the slime mold Dictyostelium (34, 35) or in hepatocytes (36). Genetically controlled cytosolic Ca2+ concentration, often identified as an intercellular signaling component in transduction pathways (34, 36, 37), is not known to serve this function in CAM. By analogy, differences in leaf-internal CO2 concentration and resistance to CO2 diffusion in the tightly packed leaf tissue of K. daigremontiana may isolate leaf areas and determine the time scale of wave propagation.
Indeed, the patchiness mapped here contains much more information than anticipated in earlier models. Thus, although we suggested the quasi-steady-state trapping of some oscillators as observed here (Fig. 3c), our model could not predict the persistent collective behavior of neighboring regions, because it did not contain coupling of individual oscillators (19). The combination of pattern analyses and models anchored in the metabolic building blocks of CAM should provide insights into information transfer processes determining the spatiotemporal behavior of the individual oscillators underlying the endogenous rhythm. Thus, several, especially long-term, aspects of this biological clock are strongly related to the self-organization of the interacting oscillators in space. We propose that the resynchronization of these oscillators is essential for the functioning of the biological clock.
Supplementary Material
Acknowledgments
We thank R. Schümann and K. Schuller for technical assistance and B. Blasius, A. Bohn, F. Kaiser, and R. Neff for valuable discussions. This work was supported by the Deutsche Forschungsgemeinschaft within the framework of Sonderforschungsbereich 199 and Graduiertenkolleg 340.
Abbreviations
- JCO2
net CO2 exchange
- CAM
crassulacean acid metabolism
- PEPCase
phosphoenolpyruvate-carboxylase
- PFD
photosynthetically active photon flux density
- RUBISCO
ribulose-1,5-bisphosphate-carboxylase-oxigenase
- φPSII
relative quantum efficiency of photosystem II
Footnotes
This paper was submitted directly (Track II) to the PNAS office.
References
- 1.Golden S S, Ishiura M, Johnson C H, Kondo T. Annu Rev Plant Physiol Plant Mol Biol. 1997;48:327–354. doi: 10.1146/annurev.arplant.48.1.327. [DOI] [PubMed] [Google Scholar]
- 2.Young M W. Annu Rev Biochem. 1998;67:135–152. doi: 10.1146/annurev.biochem.67.1.135. [DOI] [PubMed] [Google Scholar]
- 3.Blasius B, Huppert A, Stone L. Nature (London) 1999;399:354–359. doi: 10.1038/20676. [DOI] [PubMed] [Google Scholar]
- 4.Lüttge U, Ball E. Z Pflanzenphysiol. 1978;90:69–77. [Google Scholar]
- 5.Anderson C M, Wilkins M B. Planta. 1989;177:456–469. doi: 10.1007/BF00392613. [DOI] [PubMed] [Google Scholar]
- 6.Lüttge U. Planta. 2000;211:761–769. doi: 10.1007/s004250000408. [DOI] [PubMed] [Google Scholar]
- 7.Osmond C B. Annu Rev Plant Physiol. 1978;29:379–414. [Google Scholar]
- 8.Nimmo H. Trends Plant Sci. 2000;5:75–80. doi: 10.1016/s1360-1385(99)01543-5. [DOI] [PubMed] [Google Scholar]
- 9.Warren D M, Wilkins M B. Nature (London) 1961;191:686–688. [Google Scholar]
- 10.Buchanan-Bollig I C, Fischer A, Kluge M. Planta. 1984;161:71–80. doi: 10.1007/BF00951462. [DOI] [PubMed] [Google Scholar]
- 11.Lüttge U, Beck F. Planta. 1992;188:28–38. doi: 10.1007/BF00198936. [DOI] [PubMed] [Google Scholar]
- 12.Grams T E E, Borland A M, Roberts A, Griffiths H, Beck F, Lüttge U. Plant Physiol. 1997;113:1309–1317. doi: 10.1104/pp.113.4.1309. [DOI] [PMC free article] [PubMed] [Google Scholar]
- 13.Rascher U, Blasius B, Beck F, Lüttge U. Planta. 1998;207:76–82. [Google Scholar]
- 14.Blasius B, Beck F, Lüttge U. Plant Cell Environ. 1998;21:775–784. [Google Scholar]
- 15.Blasius B, Neff R, Beck F, Lüttge U. Proc R Soc London Ser B Biol Sci. 1999;266:93–101. [Google Scholar]
- 16.Neff R, Blasius B, Beck F, Lüttge U. J Membr Biol. 1998;165:37–43. doi: 10.1007/s002329900418. [DOI] [PubMed] [Google Scholar]
- 17.Carter P J, Nimmo H G, Fewson C A, Wilkins M B. EMBO J. 1991;10:2063–2068. doi: 10.1002/j.1460-2075.1991.tb07737.x. [DOI] [PMC free article] [PubMed] [Google Scholar]
- 18.Borland A, Hartwell J, Jenkins G I, Wilkins M B, Nimmo H. Plant Physiol. 1999;121:889–896. doi: 10.1104/pp.121.3.889. [DOI] [PMC free article] [PubMed] [Google Scholar]
- 19.Beck F, Blasius B, Neff R, Lüttge U, Rascher U. Proc R Soc London Ser B Biol Sci. 2001;268:1307–1313. doi: 10.1098/rspb.2001.1655. [DOI] [PMC free article] [PubMed] [Google Scholar]
- 20.Terashima I, Wong S-C, Osmond C B, Farquhar G D. Plant Cell Physiol. 1988;29:385–394. [Google Scholar]
- 21.Siebke K, Weis E. Photosynth Res. 1995;45:225–237. doi: 10.1007/BF00015563. [DOI] [PubMed] [Google Scholar]
- 22.Siebke K, Weis E. Planta. 1995;196:155–165. [Google Scholar]
- 23.Genty B, Briantais J-M, Baker N R. Biochim Biophys Acta. 1989;990:87–92. [Google Scholar]
- 24.Hütt M-Th, Neff R. Physica A. 2000;289:498–516. [Google Scholar]
- 25.Winter K, Smith J A C. In: Crassulacean Acid Metabolism. Ecological Studies. Winter K, Smith JAC, editors. Vol. 114. Berlin: Springer; 1996. pp. 389–426. [Google Scholar]
- 26.Maxwell K, von Caemmerer S, Evans J R. Aust J Plant Physiol. 1997;24:777–786. [Google Scholar]
- 27.Spalding M H, Stumpf D K, Ku M S B, Burris R H, Edwards GE. Aust J Plant Physiol. 1979;6:557–567. [Google Scholar]
- 28.Smith J A C, Heuer S. Ann Bot. 1981;48:915–917. [Google Scholar]
- 29.Nobel P S, editor. Physicochemical and Environmental Plant Physiology. San Diego: Academic; 1991. p. 433. [Google Scholar]
- 30.Rosenblum M G, Pikovski A S, Kurths J. Phys Rev Lett. 1996;76:1804–1807. doi: 10.1103/PhysRevLett.76.1804. [DOI] [PubMed] [Google Scholar]
- 31.Fitzhugh R. In: Biological Engineering. Schwan H P, editor. New York: McGraw-Hill; 1969. [Google Scholar]
- 32.Winfree T A, editor. When Time Breaks Down: The Three-Dimensional Dynamics of Electrochemical Waves and Cardiac Arrhythmias. Princeton, CA: Princton Univ. Press; 1987. [Google Scholar]
- 33.Gray R A, Pertsov A M, Jalife J. Nature (London) 1998;392:75–78. doi: 10.1038/32164. [DOI] [PubMed] [Google Scholar]
- 34.Goldbeter A, editor. Biochemical Oscillations and Cellular Rhythms: The Molecular Bases of Periodic and Chaotic Behaviour. Cambridge, U.K.: Cambridge Univ. Press; 1996. [Google Scholar]
- 35.Lauzeral J, Halloy J, Goldbeter A. Proc Natl Acad Sci USA. 1997;94:9153–9158. doi: 10.1073/pnas.94.17.9153. [DOI] [PMC free article] [PubMed] [Google Scholar]
- 36.Dupont G, Swillens S, Clair C, Tordjmann T, Combettes L. Biochim Biophys Acta. 2000;1498:134–152. doi: 10.1016/s0167-4889(00)00090-2. [DOI] [PubMed] [Google Scholar]
- 37.Sai J, Johnson C H. Proc Natl Acad Sci USA. 1999;96:11659–11663. doi: 10.1073/pnas.96.20.11659. [DOI] [PMC free article] [PubMed] [Google Scholar]
Associated Data
This section collects any data citations, data availability statements, or supplementary materials included in this article.


