Abstract
It is commonly accepted that brain phospholipids are highly enriched with long chain polyunsaturated fatty acids (PUFAs). However, the evidence for this remains unclear. We used HPLC-MS to analyze the content and composition of phospholipids in rat brain and compared it to the heart, kidney, and liver. Phospholipids typically contain one PUFA, such as 18:2, 20:4, or 22:6, and one saturated fatty acid, such as 16:0 or 18:0. However, we found that brain phospholipids containing monounsaturated fatty acids in the place of PUFAs are highly elevated compared to phospholipids in the heart, kidney, and liver. The relative content of phospholipid containing PUFAs is ∼60% in the brain whereas it is over 90% in other tissues. The most abundant species of phosphatidylcholine (PC) is PC(16:0/18:1) in the brain, whereas PC(18:0/20:4) and PC(16:0/20:4) are predominated in other tissues. Moreover, several major species of plasmanyl and plasmenyl phosphatidylethanolamine are found to contain monounsaturated fatty acid in the brain only. Overall, our data clearly show that brain phospholipids are the least enriched with PUFAs of the four major organs, challenging the common belief that the brain is highly enriched with PUFAs.
Keywords: HPLC-MS, brain lipids, monounsaturated fatty acid, cardiolipin
Introduction
It is commonly stated that the brain is highly enriched with polyunsaturated fatty acids (PUFAs) [1-3], implying that the brain contains higher amounts of PUFAs than other tissues [4, 5]. Furthermore, the high content of PUFAs has been proposed to be responsible for the high vulnerability of the brain to ischemia/reperfusion injury [6-8]. However, little evidence has been provided to support the high enrichment of PUFAs in the brain.
A majority of cellular fatty acids are esterified to phospholipids [9, 10]. Phospholipids are composed of a diacylglycerol moiety attached to a phosphate group, which in turn is connected to various head groups. Two acyl chains derived from fatty acids are attached to the first and the second carbons of the glycerol moiety, denoted as the sn-1 and sn-2 positions, respectively. Typically, saturated fatty acids or monounsaturated fatty acids (MUFAs) are present at the sn-1 position and PUFAs, such as 20:4, and 22:6, at the sn-2 position of phospholipids [11-13]. Phospholipids containing MUFAs at the sn-2 position are also found. The relative content of species containing PUFAs and species containing MUFAs at the sn-2 position determine the abundance of PUFAs in a tissue. However, different combinations of the head groups and the acyl chains give rise to numerous isobaric and isomeric species, which make analysis of phospholipids highly challenging.
Due to this challenge, analyses of phospholipids are often focused on specific classes or species of phospholipids [14-16]. Moreover, the acyl chain composition is often examined following trans-esterification [17-20]. These analyses discovered an abundance of 18:1 and a lack of 18:2 in brain phospholipids [21, 22]. However, the limitations of the trans-esterification method, the low recovery of fatty acids from plasmalogens [14] and the loss of information on the original molecular structure, prevented capturing many key aspects of phospholipids.
Previously, we developed a normal-phase HPLC-MS method for comprehensive analysis of phospholipids [21]. The method includes extraction of lipid mixtures and separation of the phospholipid fraction using solid-phase extraction. Class separation by normal-phase HPLC prior to MS analysis allows the generation of full spectra of each class of phospholipid. The full spectra are particularly useful for comparing the molecular composition of each class of phospholipids between different samples.
Using this established HPLC-MS method, we analyzed the content and composition of phosphatidylethanolamine (PE), phosphatidylcholine (PC), phosphatidylserine (PS), phosphatidylglycerol (PG), phosphatidylinositol (PI), and cardiolipin (CL) from the brain, heart, kidney, and liver. We also analyzed the content of lysophospholipids and free fatty acids to validate our sampling procedure and to support our conclusion. This thorough analysis revealed that the brain is least enriched with PUFAs of the four organs examined in this study.
Materials and Methods
Chemicals and materials
“Reagent-grade chemicals and HPLC-grade solvents were purchased from major commercial suppliers (Fisher Scientific and Sigma Aldrich). Standard phospholipids, PC(16:0/16:0), PE(16:0/16:0), PG(16:0/16:0), PI(16:0/18:1), PS(16:0/16:0), CL(18:2)4, were purchased from Avanti Polar Lipids (Alabaster, AL, USA). 1,2-Dipalmitoyl-sn-glycero-3-phospho-N-methylethanolamine (PME), the internal standard, was purchased from Santa Cruz Biotech (Santa Cruz, CA). Pre-packed silica gel SPE columns were purchased from Biotage (Charlotte, NC).
Animals
The experimental protocol was approved by the Institutional Animal Care and Use Committee. Adult male Sprague–Dawley rats (weight 465–530 g, Charles River Production, Wilmington, MA) were anesthetized with 4% isoflurane and sacrificed by decapitation to harvest the brain, heart, kidney, and liver. Rats were maintained under a 12-h light/dark cycle with free access to food and water and used without starvation. The tissues were immediately pulverized in liquid nitrogen and stored at -80 °C until analyzed.
Extraction of Phospholipids
Extraction and separation of phospholipids was performed as previously reported [23, 24]. Briefly, ∼ 1 mg of homogenized tissue was treated with 950 μL of chloroform:methanol (2:1, v:v) solution containing butylated hydroxytoluene (2 mM) and 50 μL of potassium phosphate buffer (100 mM, pH 7.4). The organic solution was added first to inactivate any enzymatic reaction that may facilitate the hydrolysis of phospholipids. Phospholipid mixtures were separated using solid-phase extraction [23] and reconstituted in 200 μL of isopropanol:t-butyl methyl ether:ammonium formate (34:17:5, v:v:v) solution. For HPLC-MS analysis, 20 μL phospholipid mixture was injected into the HPLC.
Normal-phase HPLC-MS and MS/MS
The HPLC conditions for separating each class of phospholipids were reported previously [23]. A nucleosil diol column (5 μm, 3×250 mm) (Macherey-Nagel, Duren, Germany) was used. Eluent A contained isopropanol:t-butyl methyl ether:ammonium formate (34:17:5, v:v:v) and eluent B contained methanol. Aqueous ammonium formate was prepared by dissolving 295 mg of ammonium formate and 1.9 mL of formic acid in 50 mL of water. The gradients used for the 40 min chromatogram were as follows: 100 % A for 20 min, 100% A to 20% A over 6 min, 20% A for 8 min, 20% A to 100% A over 1 min, and hold 100% A for 5 min. The flow rate was 0.3 mL/min and the column temperature was 30°C. MS and MS/MS data were collected using a Thermo LTQ XL spectrometer (Thermo Scientifics, San Jose, CA) operated in the negative ion mode.
Analysis of molecular species in each class of phospholipids
The content of each class of phospholipids was expressed as a mole fraction of the total phospholipids. Concentrations of individual classes were determined using standard curves and an internal standard as previously reported [23]. Standard curves were generated using the standard phospholipids with PME as an internal standard. The concentration of PE includes both diacyl PE and PE plasmalogens (PEP), which contain an ether linkage at the sn-1 position. Species between diacyl PE and PEP were distinguished based on their molecular weights and fragmentation patterns by MS/MS [25]. The concentrations of PE and PS in brain tissue were extrapolated from the standard curve.The abbreviations previously described for ether alkyl chains of PEP were used [25].
The content of individual species within a class was calculated from the area of M0 and M1 peaks using the Quan Browser in Xcalibur Version 2.2 software [26]. The content of each species of phospholipid was expressed as a percentage of total content of the class of phospholipid. We only included species, whose relative content is greater than 1% of the total phospholipid content in each class. Assignment of individual species in each class of phospholipids was made based on retention time and MS and MS/MS analyses [23]. If a peak contains more than one major isomeric species (over 10% of the total peak intensity), the area was corrected based on the relative abundance determined by MS/MS. The relative intensity of CL and PS species was calculated based on the relative intensity of each peak compared to total CL and PS peaks identified. The isotope abundance and the peak ratio of sodium adduct of individual species were calculated from authentic standards purchased from Avanti Polar Lipids. All data are presented as mean ± standard deviation.
Measurement of free fatty acids
To measure free fatty acids, 20 mg homogenized tissue were extracted in 500 μL of methylene chloride: methanol: isopropanol 25:65:10 (v/v/v), with 50 μg/mL butylated hydroxytoluene. UPLC (Ultra-performance LC) was performed using a 1.8 μm particle 100 × 2.1 mm id HSS T3 column (Waters, Milford, MA) coupled to a quadrupole time-of-flight (TOF) mass spectrometer (AB SCIEX, TripleTOF 5600) operated in information-dependent MS/MS acquisition mode. The LC and MS conditions were as previously described [27]. The quantification of free fatty acids was performed using MutliQuant Software version 3.0.2 (SCIEX), based on the accurate masses and retention times of each fatty acid.
Results
Concentration of phospholipids
Ion chromatograms of individual classes of phospholipids from heart tissue separated by normal-phase HPLC are shown in Fig. S1. The retention time of each class of phospholipids is similar to the previous reports [23, 26]. The concentrations of individual classes of phospholipids are shown in Table 1. PE, including diacyl PE and PEP, is the most abundant class of phospholipids in the brain, heart, and kidney, accounting for 55% of the total phospholipid content in the brain, 49% in the heart, and 48% in the kidney. PC is the second most abundant, making up 31%, 38%, and 35% of total phospholipids in the brain, heart and kidney, respectively. In the liver, PC is the most abundant species, contributing 48% of the total membrane phospholipids, while PE contributes 35%. The lower content of PE in the liver compared to other tissues is due to the minimal amount of PEP found in the liver. PS is another major class in the brain, accounting for ∼8%. In the kidney and liver, PI is the third abundant class accounting for ∼ 10% and 13% of total phospholipids, respectively.
Table 1. Concentration of each class of phospholipids in whole tissues (nmol/mg tissue, n= 4).
| PE | PC | PS | PI | PG | CL | total | |
|---|---|---|---|---|---|---|---|
| brain | 53.9 ± 5.3 | 30.5 ± 4.5 | 7.78 ± 0.93 | 5.13 ± 0.76 | 0.02 ± 0.01 | 0.27 ± 0.15 | 97.6 ± 21.6 |
| heart | 22.0 ± 6.0 | 17.0 ± 5.0 | 0.48 ± 0.14 | 2.74 ± 0.86 | 0.17 ± 0.06 | 2.31 ± 0.66 | 44.7 ± 12.6 |
| kidney | 24.7 ± 5.5 | 18.0 ± 4.2 | 2.31 ± 0.45 | 5.31 ± 1.3 | 0.02 ± 0.01 | 1.38 ± 0.35 | 51.7 ± 11.3 |
| liver | 22.8 ± 3.3 | 31.2 ± 3.8 | 1.21 ± 0.32 | 8.52 ± 1.1 | 0.01 ± 0.00 | 1.08 ± 0.21 | 64.9 ± 8.6 |
Molecular composition of PE
The mass spectra of PE including diacyl PE and PEP from the brain, heart, kidney, and liver are shown in Fig. 1, and the molecular structures of the major species determined by MS/MS are listed in Table 2. Most MS peaks are composed of one dominant species with more than 90% of the peak intensity. If the relative content of minor isomeric species is more than 20% of the major isomers, these minor species are also noted in Table 2. Fig. 2 shows the calculated mole percentages of the major species of PE as described in the material and methods section. We provide the relative contents of individual species for an easy comparison of phospholipid profiles between tissues. However, the relative contents can be readily converted to absolute concentrations using the values provided in Table 1.
Fig. 1.
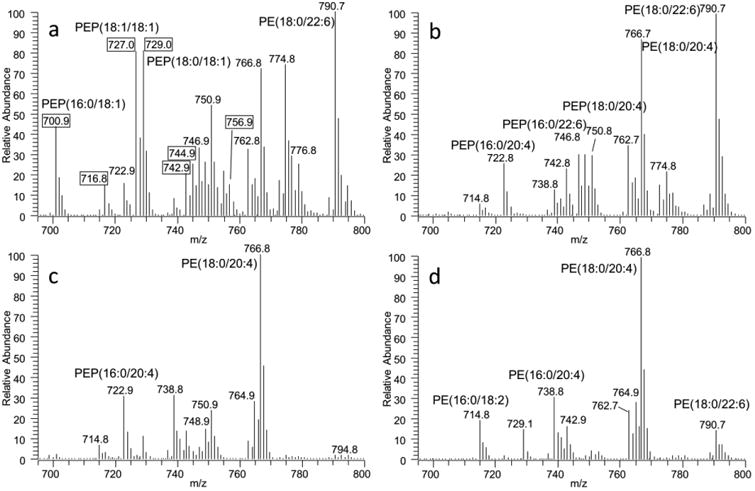
MS spectra of PE from brain (A), heart (B), kidney (C), and liver (D) tissues. Major species of diacyl and plasmenyl PE in heart, kidney, and liver tissues contains PUFA at the sn-2 position (A) whereas PE species containing MUFA (labeled in boxes) are highly enriched in brain tissues.
Table 2. Molecular composition of major phospholipids characterized by MS/MS.
| brain | heart | kidney | liver | |
|---|---|---|---|---|
| PE | ||||
| 715 | 16:1/18:1 | 16:0/18:2 | 16:0/18:2 | 16:0/18:2 |
| 717 | 16:0/18:1 | 16:0/18:1 | 16:0/18:1 | |
| 739 | 16:0/20:4 | 16:0/20:4 18:2/18:2 |
16:0/20:4 | 16:0/20:4 |
| 743 | 18:1/18:1 | 18:0/18:2 | 18:0/18:2 | 18:0/18:2 |
| 745 | 18:0/18:1 | 18:0/18:1 | ||
| 763 | 16:0/22:6 | 16:0/22:6 | 18:2/20:4 16:0/22:6 |
16:0/22:6 18:2/20:4 |
| 765 | 18:1/20:4 16:0/22:5 |
18:1/20:4 16:0/22:5 |
18:1/20:4 | 18:1/20:4 16:0/22:5 |
| 767 | 18:0/20:4 | 18:0/20:4 | 18:1/20:4 | 18:1/20:4 |
| 773 | 18:0/ 20:1 | |||
| 789 | 18:1/22:6 | 18:1/22:6 | ||
| 791 | 18:0/22:6 | 18:0/22:6 | 18:0/22:6 | 18:0/22:6 |
| 795 | 18:0/22:4 | |||
| PEP | ||||
| 701 | 16:0/18:1 | 16:0/18:1 m16:0/18:21 |
||
| 723 | 16:0/20:4 | 16:0/20:4 | 16:0/20:4 | |
| 727 | 18:1/18:1 | 18:0/18:2 | 18:0/18:2 | |
| 729 | 18:0/18:1 16:0/20:1 |
m18:0/18:2 18:0:18:1 |
m18:0/18:2 | |
| 737 | 16:1/20:4 16:0/20:5 |
16:1/20:4 16:0/20:5 |
||
| 747 | 16:0/22:6 | 16:0/22:6 | 16:0/22:6 | |
| 749 | 18:1/20:4 | 18:1/20:4 16:0/22:5 |
18:1/20:4 | |
| 751 | 18:0/20:4 16:0/22:4 |
18:0/20:4 | 18:0/20:4 | 18:0/20:4 |
| 753 | m18:0/20:4 | |||
| 757 | 18:0/20:1 | |||
| 773 | 18:1/22:6 | 18:1/22:6 | ||
| 775 | 18:0/22:6 | 18:0/22:6 | 18:0/22:6 | 18:0/22:6 |
| 779 | 18:0/22:4 | |||
| PC | ||||
| 779 | 16:0/16:0 | 16:0/16:0 | 16:0/16:0 | |
| 803 | 16:0/18:2 | 16:0/18:2 | ||
| 805 | 16:0/18:1 | 16:0/18:1 | 16:0/18:1 | 16:0/18:1 |
| 827 | 16:0/20:4 | 16:0/20:4 | 16:0/20:4 | 16:0/20:4 |
| 831 | 18:1/18:1 | 18:0/18:2 | 18:0/18:2 | 18:0/18:2 |
| 833 | 18:0/18:1 | |||
| 851 | 16:0/22:6 | 16:0/22:6 | 16:0/22:6 | 16:0/22:6 18:2/20:4 |
| 853 | 18:1/20:4 16:0/22:5 |
|||
| 855 | 18:0/20:4 | 18:0/20:4 | 18:0/20:4 16:0/22:4 |
18:0/20:4 |
| 879 | 18:0/22:6 | 18:0/22:6 | 18:0/22:6 | 18:0/22:6 18:1/22:5 |
| PS | ||||
| 783 | 16:0/20:4 | |||
| 787 | 18:1/18:1 | 18:0/18:2 | 18:0/18:2 | |
| 789 | 18:0/18:1 | 18:0/18:1 | 18:0/18:1 | |
| 809 | 18:0/20:5 18:1/20:4 |
18:0/20:5 | ||
| 811 | 18:0/20:4 | 18:0/20:4 | 18:0/20:4 | 18:0/20:4 |
| 817 | 18:0/20:1 | |||
| 835 | 18:0/22:6 | 18:0/22:6 | 18:0/22:6 | |
| 839 | 18:0/22:4 | |||
| PI | ||||
| 834 | 16:0/18:2 | |||
| 836 | 16:0/18:1 | |||
| 858 | 16:0/20:4 | 16:0/20:4 | 16:0/20:4 | 16:0/20:4 |
| 862 | 18:0/18:2 | |||
| 882 | 16:0/22:6 | 16:0/22:6 | ||
| 884 | 18:1/20:4 | 18:1/20:4 | 18:1/20:4 16:0/22:5 |
|
| 886 | 18:0/20:4 | 18:0/20:4 | 18:0/20:4 | 18:0/20:4 |
| 910 | 18:0/22:6 | 18:0/22:6 | 18:0/22:6 | |
| 912 | 18:0/22:5 | |||
| PG | ||||
| 722 | 16:0/16:0 | 16:0/16:0 | 16:0/16:0 | |
| 746 | 16:0/18:2 | 16:0/18:2 | 16:0/18:2 | |
| 748 | 16:0/18:1 | 16:0/18:1 | 16:0/18:1 | 16:0/18:1 |
| 770 | 16:0/20:4 | 16:0/20:4 | ||
| 774 | 18:0/18:2 | 16:0/20:2 18:0/18:2 |
m, plasmanyl PE
Fig. 2.
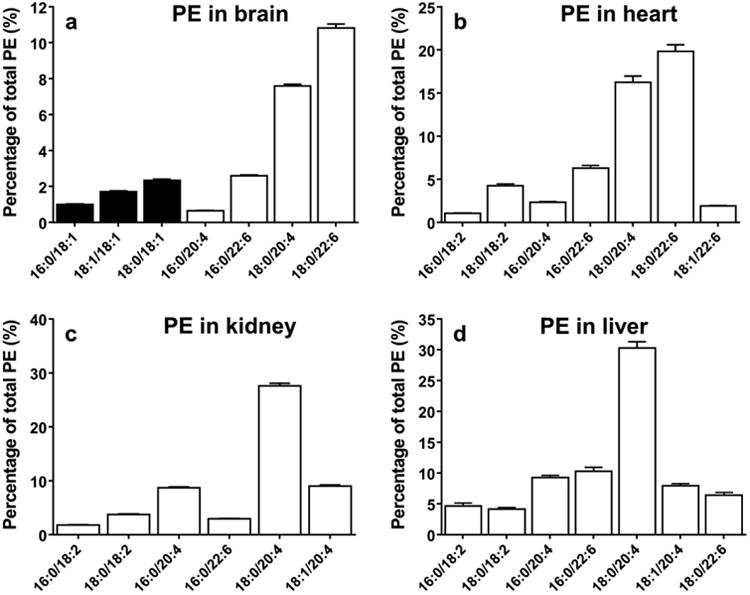
Relative contents of major species of phosphatidylethanolamine in the brain (A), heart (B), kidney (C), and liver (D). (data are presented as mean ± standard deviation, n=6). Closed bar =MUFA, open bar =PUFA.
In brain and heart tissue, PE(18:0/22:6) and PE(18:0/20:4) are the most abundant species, accounting for 11% and 8% in the brain (Fig. 2a), respectively and 20% and 16% in the heart (Fig. 2b), respectively. In the kidney, arachidonic acid containing species, PE(18:0/20:4) and PE(16:0/20:4), account for 28% and 9% respectively (Fig. 2c). In the liver, one dominant species, PE(18:0/20:4), accounts for 30% of total PE. Other major species, PE(18:0/22:6), PE(16:0/20:4), and PE(18:0/22:6), also make up a substantial portion of PE in the liver (Fig. 2d). Interestingly, brain PE is also comprised of species containing MUFAs, such as PE(18:0/18:1) and PE(18:1/18:1), whereas these species are negligible in other tissues. Since PE(18:1/18:1) found in the brain has the same molecular weight (m/z 743) as PE(18:0/18:2) found in other tissues, we provide MS/MS spectra of the nominal peak at 743 as an example to compare the structure of the PE species between brain and other tissues (Fig. 3). In the brain, the peak at 281 corresponding to 18:1 and the peak at 478 corresponding to octadecenoyl glycerol confirm the structure as PE(18:1/18:1) (Fig. 3a). In the heart, the peaks at 279 and 283 corresponding to free fatty acids 18:2 and 18:0, respectively, and the peak at 480 corresponding to octadecanoyl glycerol confirm the structure as PE(18:0/18:2) (Fig. 3b). The MS/MS spectra of the MS peak at 743 in the kidney and liver are the same as the heart. Overall, most major PE species contain PUFAs, such as 22:6 and 20:4, and the relative content of these species are not higher in the brain.
Fig. 3.
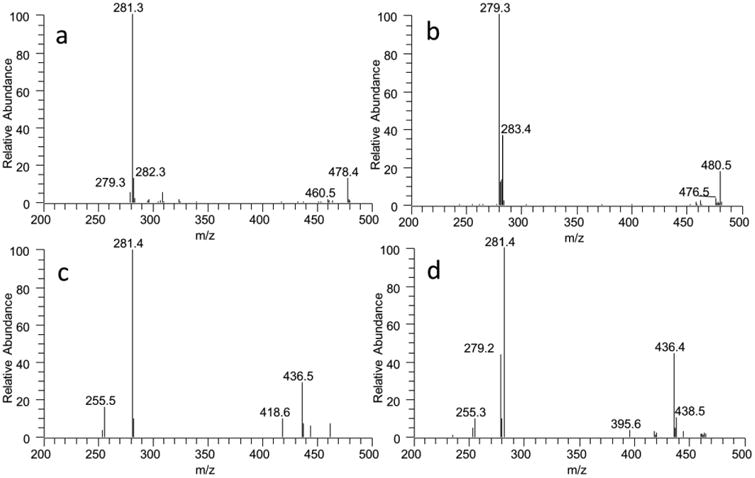
MS/MS spectra of PE species with m/z 742.8 from the brain (A) and the heart (B), and PEP species with m/z 701.9 from the brain (C) and the kidney (D). The peak at 478 corresponding to octadecenoyl glycerol and the peaks at 281 corresponding to 18:1 confirm the structure as PE(18:1/18:1) (A). The peak at 480 corresponding to octadecanoyl glycerol and the peaks at 279 and 283 corresponding to 18:0 and 18:2 confirms the structure as PC(18:0/18:2) (B). The peak at 436 corresponding to hexadecenyl glycerol and the peak at 281 corresponding to 18:1 confirm the structure as PEP(16:0/18:1). The peak at 418 is dehydrated form of 436 and the peak at 255 is from 281-CO2. (C). The peaks at 436 and 281 confirms the structure of the major species as PEP(16:0/18:1), and the peak at 438 corresponding to hexadecanyl glycerol and the peak 279 corresponding to18:2 confirms the structure of the minor species as plasmanyl PE(16:0/18:2) (D).
Molecular composition of PEP
PE contains a substantial amount of plasmalogens (Fig. 4), which are known to be enriched with PUFAs. The overall concentration of PEP is the highest in the brain. The major species of PEP contain PEP(16:0/20:4), PEP(18:0/20:4), PEP(16:0/22:6), and PEP(18:0/22:6). In addition to these PUFA containing species, significant levels of PEP species containing 18:1 at the sn-2 position are present in brain tissue as well (Fig. 4a). Interestingly, PEP(16:0/18:1), PEP(18:1/18:1), and PEP(18:0/18:1) account for 20% of the total PE content, which is similar to the relative abundance of the five major PEP species containing PUFAs (26%) (Fig. 4a).
Fig. 4.
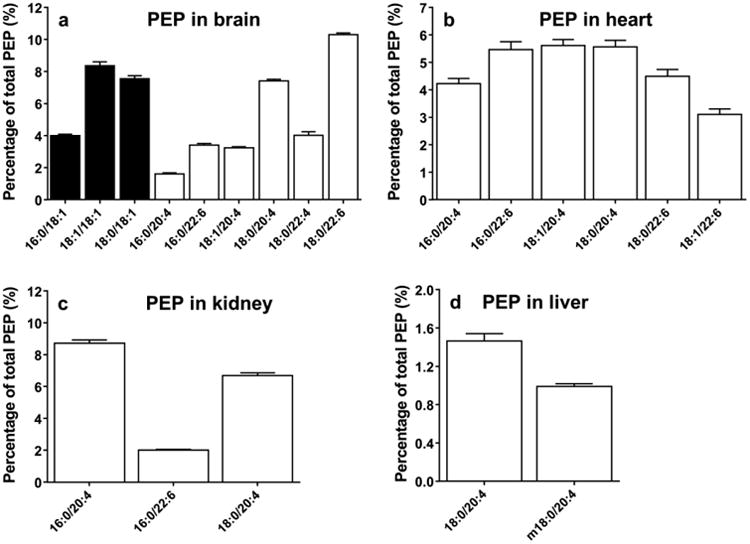
Relative contents of plasmenyl phosphatidylethanolamine in the brain (A), heart (B), kidney (C), and liver (D) (data are presented as mean ± standard deviation, n=6). Closed bar =MUFA, open bar =PUFA.
In the heart, the major species of PEP, such as PEP(16:0/20:4), PEP(16:0/22:6), PEP(18:0/20:4), and PEP(18:0/22:6), all contain long chain PUFAs (Fig. 4b). These species account for ∼26% of the total PE in heart tissue. A similar pattern is observed in the kidney, but with less overall PEP content (Fig. 4c). The relative content of PEP of total PE is 19% in kidney tissue. The kidney also contains a detectable amount of species containing MUFAs, such as PEP(16:0/18:1). Liver contains a dramatically lower content of PEP, accounting for 2% of total PE in liver tissue (Fig. 4d). As was seen in the profile of PE, only brain PEP is comprised of significant amounts of species containing MUFAs.
We also show an example of MS/MS spectra a PEP species with molecular weight of 701 from the brain and kidney (Fig. 3c and d). In the brain, the peak at 436 corresponding to hexadecenyl glycerol and the peak at 281 corresponding to 18:1 confirm the structure as PEP(16:0/18:1) (Fig. 3c). The peak at 418 is the dehydrated form of the peak at 436 and the peak at 255 is from 281-CO2. The same peaks at 436 and 281 in the kidney show that the PEP(16:0/18:1) in the major species is under the MS peak at 701 (Fig. 3d). In addition, the peak at 438 corresponding to hexadecanyl glycerol and the peak at 279 corresponding to 18:2 confirm the coexistent of plasmanyl PE (16:0/18:2) as a minor species of the same MS peak in the kidney (Fig. 3d).
Molecular composition of PC
The mass spectra of PC from heart and brain tissues are shown in Fig. 5 and the concentrations of major species of PC determined by MS/MS are shown in Fig. 6. Interestingly in the brain, the most abundant species is PC(16:0/18:1) (Fig. 6a). In addition, species containing saturated fatty acids or MUFAs, such as PC(16:0/16:0), PC(18:1/18:1) and PC(18:0/18:1), are also abundant. These four species together account for ∼ 54% of the total PC content in brain tissue, which is significantly higher than ∼15% of the content of major PUFA-containing species combined. Again, PC species containing 18:2 are also negligible in brain tissue (Fig. 6a).
Fig. 5.
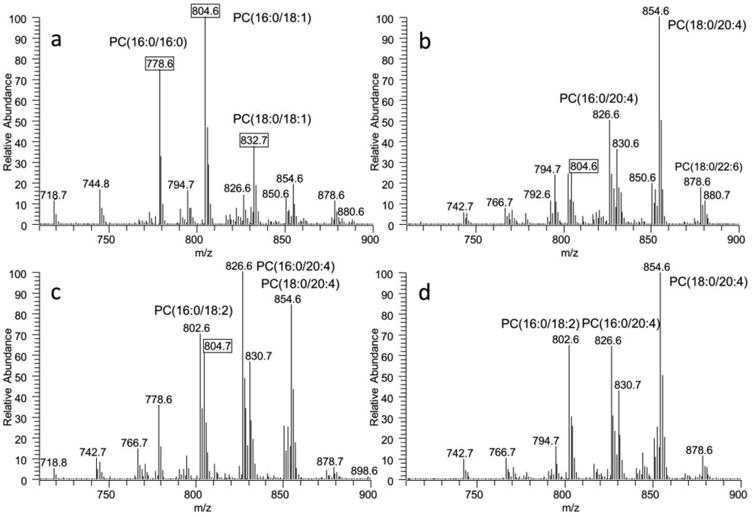
MS spectra of PC from brain (A), heart (B), kidney (C), and liver (D) tissues. Three most abundant PC species in brain tissue contain saturated fatty acid or mono unsaturated fatty acids (labeled in boxes, 779, PC(16:0/16:0); 805, PC(16:0/18:1); and 833, PC(18:0/18:1) (A). Major PC species in liver tissue contain PUFA (D).
Fig. 6.
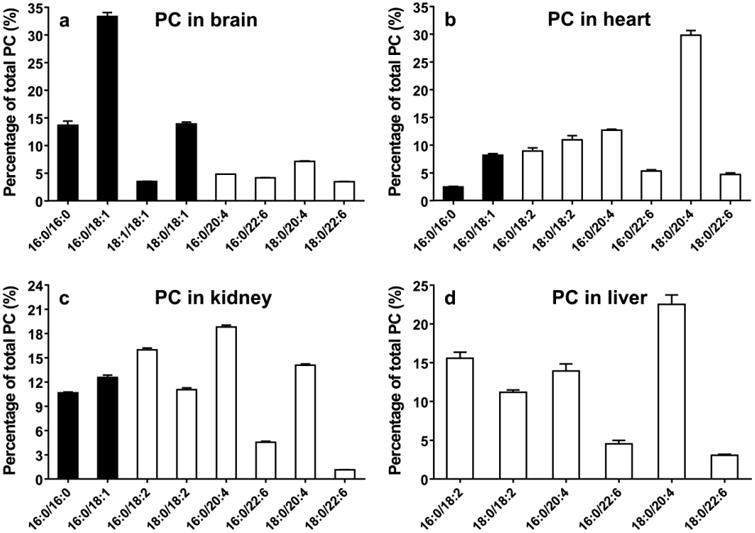
Relative contents of major species of PC from the brain (A), heart (B), kidney (C), and liver (D) (data are presented as mean ± standard deviation, n=6). Closed bar =Saturated or MUFA, open bar =PUFA.
In the heart, PC species containing 20:4, PC(16:0;20:4) and PC(18:0;20:4), are the two major species, while species containing 22:6 are also abundant (Fig. 6b). Kidney tissue includes multiple major species, such as PC(16:0/18:2), PC(16:0/20:4) and PC(18:0/20:4) as well as MUFA containing species (Fig. 6 c). Liver tissue also contains PC(16:0/18:2), PC(16:0/20:4) and PC(18:0/20:4) as a major PC species. It is notable that no considerable amounts of PC containing MUFAs are observed in the liver. Overall, Fig. 5 and 6 show that PC in the brain contains much higher amounts of MUFAs than other organs and liver PC is most dominated with PUFAs.
Molecular composition of PS
Mass spectra of PS are shown in Fig. 7 and the concentrations of major species of PS are shown in Fig. 8. In the brain, two major species of PS are the PS(18:0/22:6) and PS(18:0/18:1), which account for 51% and 26% of the total PS content, respectively. In the brain, a total of 65% PS contains PUFAs whereas over 90% of PS contains PUFAs in other tissues. The most abundant species of PS is PS(18:0/22:6 in the brain and heart and PS(18:0/20:4) in the kidney and liver. PS species containing 18:2 is not detectable in the brain, but readily detectable in other organs.
Fig. 7.
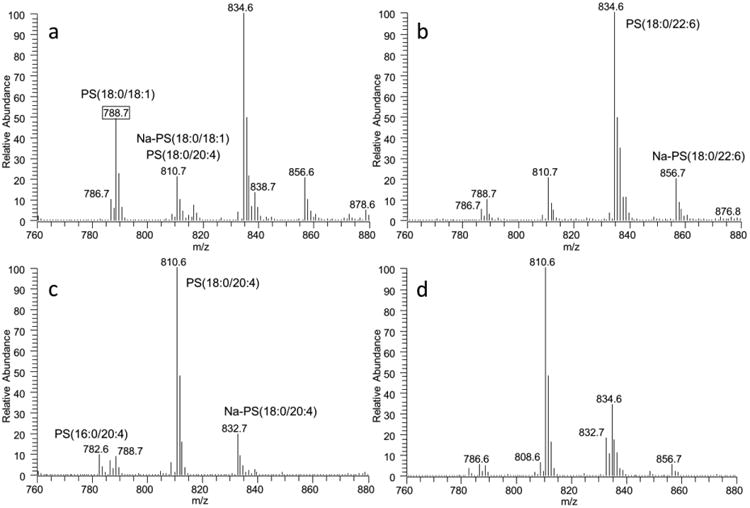
MS spectra of PS from brain (A), heart (B), kidney (C), and liver (D) tissues. PS species containing MUFA (788.7, PS(18:0/18:1) is significantly higher in the brain than other tissues.
Fig. 8.
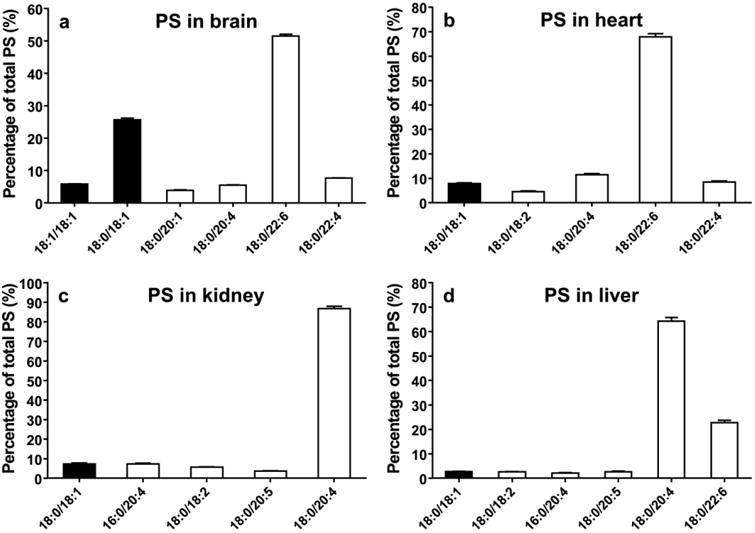
Relative contents of major species of PS from the brain (A), heart (B), kidney (C), and liver (D) (data are presented as mean ± standard deviation, n=6). Closed bar =MUFA, open bar =PUFA.
Molecular composition of PI and PG
The MS spectra of PG and PI are shown in Fig. S2 and S3 and the concentrations of individual species of PI and PG are shown in Fig. 9. The molecular compositions of PI and PG are similar between tissues that PI and PG each has one dominant species, PI(18:0/20:4), and PG(18:0/18:1), respectively. Major species of PI only contains PUFAs, whereas PG is predominated with MUFAs. As was seen in other classes of phospholipid, PI and PG species containing 18:2 are negligible in the brain.
Fig. 9.

Relative contents of major species of PI and PG from the brain, heart, kidney, and liver (data are presented as mean ± standard deviation, n=6).
Composition of CL
MS spectra of CL are shown in Fig. 10. Fig. 10a shows the MS spectrum of CL from brain tissue. The CL composition in the brain is highly diverse and markedly differs from its composition in the heart, kidney, and liver (Fig. 10 b-d). The peak at 1448 corresponding to tetra-linoleoyl CL, noted as CL(18:2)4 is the major species in the heart, kidney, and liver as commonly observed [28] In the kidney and liver, the enhanced peaks at 1450 and 1472 show that CL(18:2)3(18:1) and CL(18:2)3(20:4) are also abundant. CL(18:2)4 accounts for 83% of the total CL content in the heart, 48% in the kidney, and 45% in the liver. However, the peak at 1448 in brain is an only minor peak (Fig. 10a). Moreover, the MS/MS spectra revealed that the peak 1448 is comprised of several isomeric species (Fig. S4). Considering the relative peak intensity of 1448 by MS and the number of isomers by MS/MS, we conclude that CL(18:2)4 is less than 1% of the total CL content in the brain. MS/MS analysis also shows that most CL MS peaks are comprised of multiple isomers. Therefore, the total number of CL species in the brain should be several times more than the number of the peaks shown in the MS spectrum (Fig. 10a). Due to this enormous number of species, characterization of CL in the brain is difficult to achieve.
Fig. 10.
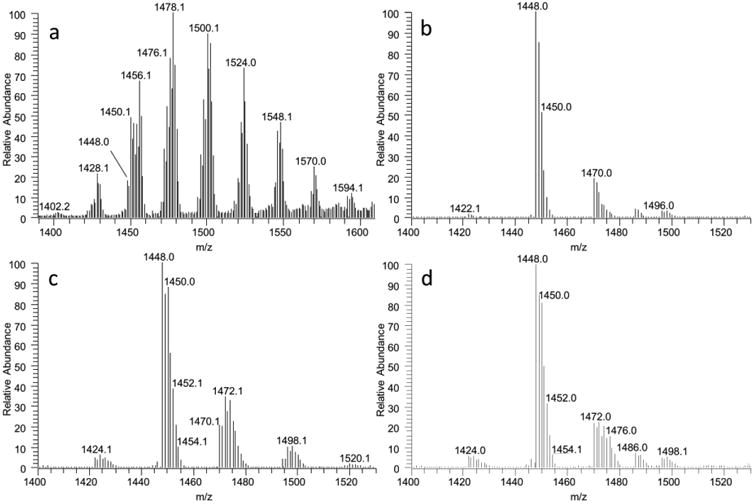
Mass spectra of CL from brain (A), heart (B), kidney (C), and liver (D) tissues. CL(18:2)4 is the major species in the heart, kidney, and liver but only a minor species in the brain.
Content of lysophospholipids and free fatty acids
Several species of lysoPC, lysoPE, and lysoPI are detected from whole tissue. Fig. S5 shows the relative peak area of individual species of lysophospholipids compared to the peak area of the corresponding class of phospholipids. The common species contain 16:0 or 18:0 as these are the common fatty acid at the sn-1 position of PE and PC. Consistent with the high abundance of 18:1 in brain tissue, lysoPE and lysoPI species containing 18:1 are readily detectable in brain tissue.
Fig. S6 shows the relative content of free fatty acids from 20 mg of each tissue. Since the contents of free fatty acids are estimated based on their peak areas, the data may not be appropriate to compare the levels between fatty acids, however, can be used to compare each fatty acid level between tissues. The data clearly show that the levels of free fatty acids in the brain are not higher than in other tissues. The amount of 16:0 is the most abundant in liver tissue compared to in other tissues. The level of 18:0 is similar in all tissues. Compared to the liver, similar levels of 20:4 and 22:4 are detected in the brain, but all other PUFAs, including 22:6, are higher in the liver. It is also notable that the brain contains a much lower content of 18:2 compared to other tissues, consistently with the lack of phospholipid species containing 18:2 in this tissue. Overall, the results from lysophospholipids and free fatty acids confirm that there is no significant decomposition of phospholipids from the tissues during sampling procedures that may interfere with phospholipid analysis.
Discussion
Brain phospholipids are least enriched with PUFAs
Although it is commonly cited that the brain phospholipids are highly enriched with PUFAs [29], the evidence for this is limited. Here, we show that the brain has the lowest mole fraction of PUFA-containing phospholipid species (Fig. 11). The content of overall PUFA containing species is ∼60% of total phospholipid in the brain, whereas it is over 90% in the heart and kidney and ∼ 95% in the liver. Consequently, the concentrations of PUFA-containing phospholipids per mg tissue are also lower in the brain than in the liver. One may argue that PUFAs are enriched in a special area of brain. In fact, fatty acid composition differs depending on the areas of the brain [30, 31], but the difference is not sufficient to make an area of the brain more enriched with PUFA than the heart, kidney, or liver. Overall, our results are not consistent with the common belief that the brain is highly enriched with PUFA.
Fig. 11.
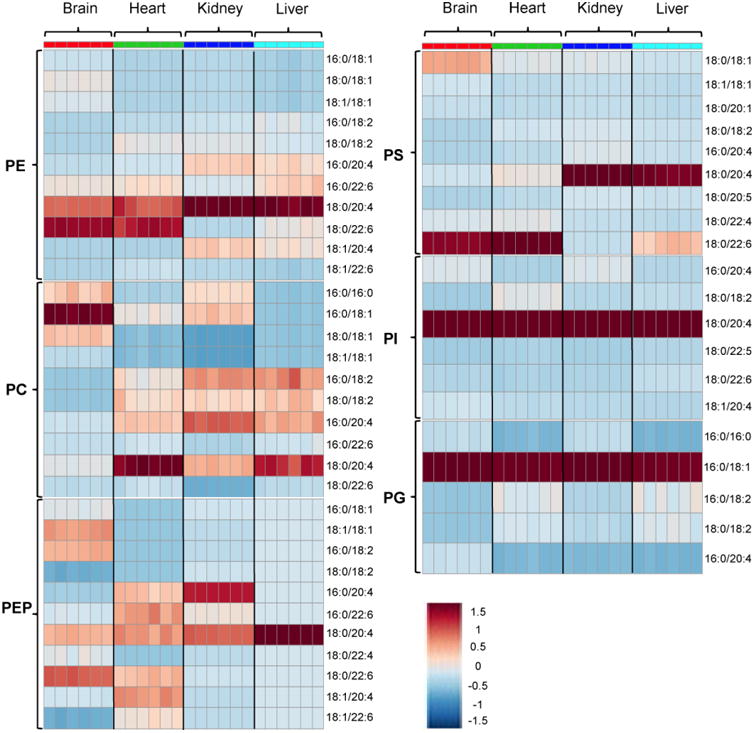
Heatmap representation of phospholipid profiles in the brain, heart, kidney, and liver generated by Metaboanalyst software v.3.0. Sample intensities were scaled using Pareto scaling (high [red] and low [blue]). Heatmap trends show that the contents of phospholipid containing MUFA are higher in the brain than in other tissues.
Typical phospholipids in mammalian tissues contain PUFAs at the sn-2 position and saturated fatty acids at the sn-1 position. Phospholipids containing MUFAs at the sn-2 position are also found, but to a much lesser extent. Therefore, almost every tissue is enriched with PUFAs, but the abundance of PUFAs has been emphasized only in the brain. Consequently, it is believed that the PUFA content in brain phospholipids is higher than in other tissues [4, 5]. Furthermore, the high content of PUFAs, such as 20:4 and 22:6, is hypothesized to be a major factor responsible for the vulnerability of the brain to ischemia/reperfusion injury [6-8, 10, 32].
Our result that brain phospholipids are least enriched with PUFAs of the four organs does not support this hypothesis. However, the finding does not rule out potential roles that PUFAs play in ischemic brain damage. Along with other alterations, such as glutamatergic dysregulation [33], PUFAs may be an important mediator in brain damage. It may be not the amount of PUFAs but the cellular conditions of the brain that facilitate PUFA-mediated pathways that may be a contributing factor to the vulnerability of the brain. In this light, lowering the PUFA content in membrane phospholipids may be the self-regulation of the brain to protect itself from ischemia. Consistent with this, the brain phospholipid is less responsive to the PUFA content in diets than other tissues [34, 35].
HPLC-MS analysis of phospholipid
Due to the existence of numerous isobaric and isomeric species, quantitation of phospholipids is challenging. Various methods have been applied to quantify phospholipids, however, the results differ depending on the methods used [20, 36-39]. Since the development of electrospray ionization, mass spectrometry is the most common method used to analyze phospholipids [40-42]. Differential ion mobility spectrometry has also become available and is a promising technique for the differentiation of isomers with or without silver ion adduction; however, it is limited to only a few number of MS methods [43].
We used normal-phase HPLC-MS for this study. Normal phase-HPLC separates phospholipids by class based on their retention times [23].This class separation provides a full mass spectrum for each class of phospholipid (Fig. 1, 5, 7, and 10). Identification of a species by MS and MS/MS compared with the mass of the species in these full spectra reduces chances for false assignments and omission of significant species. In addition, the concentration of each phospholipid species calculated using automated methods can be cross-validated by comparing the calculated values with the intensities of the corresponding peaks in this full spectrum. For example, the concentrations of PE(16:0/20:4) and PE(16:0/20:4) presented in Fig. 2d can be matched with the peaks at 766.8 and 738.8 in Fig. 1d, respectively. With fully validated sampling and quantitation procedures [23], the normal phase HPLC-MS method is shown to be advantageous for comparing phospholipid profiles between multiple tissues.
The lack of 18:2 in brain phospholipids including CL
The absence of species containing 18:2 in brain phospholipids has been reported previously [22]. It is interesting, however, that the brain limits the usage of 18:2 even for the synthesis of CL. In mitochondria, the final structure of CL is determined by the remodeling step, which preferentially incorporates 18:2 into CL [44, 45]. Consequently, CL(18:2)4 is often found to be the dominant species in most mammalian tissues [46]. It seems that the relative abundance of fatty acids is also an important factor in the selection of fatty acids for CL remodeling. Limiting the usage of 18:2 for the synthesis of CL may have caused the incorporation of more freely available fatty acids into CL, resulting in the highly diverse CL composition observed in the brain. This argument is supported by the fact that CL composition is readily affected by the fat contents in the diet [47-49]. This unique CL composition suggests that at least for brain mitochondria, neither the symmetry of CL nor preserving CL(18:2)4 is important. This explains why brain function is not affected in Barth syndrome patients, who have a defective metabolism for the use of 18:2 for CL.
In conclusion, unlike the common belief that brain is highly enriched with PUFAs, we have demonstrated that brain phospholipids contain lower contents of PUFAs than phospholipids in the heart, kidney and liver. The mole fraction of phospholipids containing PUFAs in the brain is ∼60%, which is significantly lower than over 90% found in other organs. This low PUFA content is due to high content of 18:1, particularly in PC, PEP, and PS. Overall, it is a unique feature that brain phospholipids contain significant amounts of MUFAs, making brain phospholipid least enriched with PUFAs of the four major organs.
Supplementary Material
Supplementary Fig. 1. Ion chromatograms of individual classes of phospholipids extracted from whole heart tissue. Ion chromatograms are generated using the most abundant species of each class.
Supplementary Fig. 2. Mass spectra of PI in the brain (top left), heart (top right), kidney (bottom left), and liver (bottom right).
Supplementary Fig. 3. Mass spectra of PG in the brain (top left), heart (top right), kidney (bottom left), and liver (bottom right).
Supplementary Fig. 4. MS/MS spectra of the MS peak at m/z 1448 from the heart (A) and brain (B). The MS/MS spectra from heart tissue shows typical fragmentation pattern of CL(18:2)4; the peak at 695 corresponds to a diacylglycerol moiety containing two 18:2 (A). In brain tissue, addition sets of peaks corresponding to diacylglycerol moiety, 671 and 719, 673 and 717, and 693 and 697, show the existence of at least 4 major isomers with molecular weight of 1448 (B)
Supplementary Fig. 5. The relative content of lysophospholipids compared to phospholipids in the brain (A), heart (B), kidney (C), and liver (D). LPC(16:0) and LPC(18:0) are significantly higher in kidney and liver tissues (data are presented as mean ± standard deviation, n=6).
Supplementary Fig. 6. The contents of free fatty acids in the brain, heart, kidney, and liver. Data are presented as mean ± standard deviation, n=4, * against brain, p<0.05).
Acknowledgments
We would like to acknowledge Dr. Edmund Miller for his comments and helpful advice in writing the manuscript. This work was supported by the National Institutes of Health [RO1HL067630 and S10RR027878].
Footnotes
Conflicts of interest: The authors declare that they have no conflict of interest.
Ethical approval: All procedures performed in studies involving animals were in accordance with the ethical standards of the institution or practice at which the studies were conducted.
References
- 1.Farooqui AA, Horrocks LA, Farooqui T. Modulation of inflammation in brain: a matter of fat. J Neurochem. 2007;101:577–99. doi: 10.1111/j.1471-4159.2006.04371.x. [DOI] [PubMed] [Google Scholar]
- 2.Miller LR, Jorgensen MJ, Kaplan JR, Seeds MC, Rahbar E, Morgan TM, Welborn A, Chilton SM, Gillis J, Hester A, Rukstalis M, Sergeant S, Chilton FH. Alterations in levels and ratios of n-3 and n-6 polyunsaturated fatty acids in the temporal cortex and liver of vervet monkeys from birth to early adulthood. Physiol Behav. 2016;156:71–8. doi: 10.1016/j.physbeh.2015.12.009. [DOI] [PMC free article] [PubMed] [Google Scholar]
- 3.Shepro D. Microvascular Research: Biology and Pathology. Elsevier Science & Technology Books; 2005. [Google Scholar]
- 4.Moore SA. Polyunsaturated fatty acid synthesis and release by brain-derived cells in vitro. J Mol Neurosci. 2001;16:195–200. doi: 10.1385/JMN:16:2-3:195. discussion 215-21. [DOI] [PubMed] [Google Scholar]
- 5.Srinivasan V, Pandi-Perumal SR, Cardinali DP, Poeggeler B, Hardeland R. Melatonin in Alzheimer's disease and other neurodegenerative disorders. Behav Brain Funct. 2006;2:15. doi: 10.1186/1744-9081-2-15. [DOI] [PMC free article] [PubMed] [Google Scholar]
- 6.Noseworthy MD, Bray TM. Effect of oxidative stress on brain damage detected by MRI and in vivo 31P-NMR. Free Radic Biol Med. 1998;24:942–51. doi: 10.1016/s0891-5849(97)00383-3. [DOI] [PubMed] [Google Scholar]
- 7.Friedman J. Why Is the Nervous System Vulnerable to Oxidative Stress? In: Gadoth N, Göbel HH, editors. Oxidative Stress and Free Radical Damage in Neurology. Humana Press; Totowa, NJ: 2011. pp. 19–27. [Google Scholar]
- 8.Rink C, Khanna S. Significance of brain tissue oxygenation and the arachidonic acid cascade in stroke. Antioxid Redox Signal. 2011;14:1889–903. doi: 10.1089/ars.2010.3474. [DOI] [PMC free article] [PubMed] [Google Scholar]
- 9.van der Vusse GJ, Roemen TH, Prinzen FW, Coumans WA, Reneman RS. Uptake and tissue content of fatty acids in dog myocardium under normoxic and ischemic conditions. Circ Res. 1982;50:538–46. doi: 10.1161/01.res.50.4.538. [DOI] [PubMed] [Google Scholar]
- 10.Bazinet RP, Laye S. Polyunsaturated fatty acids and their metabolites in brain function and disease. Nat Rev Neurosci. 2014;15:771–785. doi: 10.1038/nrn3820. [DOI] [PubMed] [Google Scholar]
- 11.Angelini R, Vitale R, Patil VA, Cocco T, Ludwig B, Greenberg ML, Corcelli A. Lipidomics of intact mitochondria by MALDI-TOF/MS. Journal of Lipid Research. 2012;53:1417–25. doi: 10.1194/jlr.D026203. doi:jlr.D026203[pii]10.1194/jlr.D026203. [DOI] [PMC free article] [PubMed] [Google Scholar]
- 12.Ivanova PT, Cerda BA, Horn DM, Cohen JS, McLafferty FW, Brown HA. Electrospray ionization mass spectrometry analysis of changes in phospholipids in RBL-2H3 mastocytoma cells during degranulation. Proc Natl Acad Sci U S A. 2001;98:7152–7. doi: 10.1073/pnas.13119509898/13/7152[pii]. [DOI] [PMC free article] [PubMed] [Google Scholar]
- 13.Milne S, Ivanova P, Forrester J, Alex Brown H. Lipidomics: an analysis of cellular lipids by ESI-MS. Methods. 2006;39:92–103. doi: 10.1016/j.ymeth.2006.05.014. doi:S1046-2023(06)00073-9[pii]10.1016/j.ymeth.2006.05.014. [DOI] [PubMed] [Google Scholar]
- 14.Mitchell TW, Buffenstein R, Hulbert AJ. Membrane phospholipid composition may contribute to exceptional longevity of the naked mole-rat (Heterocephalus glaber): a comparative study using shotgun lipidomics. Exp Gerontol. 2007;42:1053–62. doi: 10.1016/j.exger.2007.09.004. [DOI] [PubMed] [Google Scholar]
- 15.Abdullah L, Evans JE, Ferguson S, Mouzon B, Montague H, Reed J, Crynen G, Emmerich T, Crocker M, Pelot R, Mullan M, Crawford F. Lipidomic analyses identify injury-specific phospholipid changes 3 mo after traumatic brain injury. FASEB J. 2014 doi: 10.1096/fj.14-258228. [DOI] [PubMed] [Google Scholar]
- 16.Wang HY, Liu CB, Wu HW, Kuo JS. Direct profiling of phospholipids and lysophospholipids in rat brain sections after ischemic stroke. Rapid Commun Mass Spectrom. 2010;24:2057–64. doi: 10.1002/rcm.4620. [DOI] [PubMed] [Google Scholar]
- 17.Cifkova E, Holcapek M, Lisa M. Nontargeted lipidomic characterization of porcine organs using hydrophilic interaction liquid chromatography and off-line two-dimensional liquid chromatography-electrospray ionization mass spectrometry. Lipids. 2013;48:915–28. doi: 10.1007/s11745-013-3820-4. [DOI] [PubMed] [Google Scholar]
- 18.Chen CT, Domenichiello AF, Trepanier MO, Liu Z, Masoodi M, Bazinet RP. The low levels of eicosapentaenoic acid in rat brain phospholipids are maintained via multiple redundant mechanisms. J Lipid Res. 2013;54:2410–22. doi: 10.1194/jlr.M038505. [DOI] [PMC free article] [PubMed] [Google Scholar]
- 19.Taha AY, Basselin M, Ramadan E, Modi HR, Rapoport SI, Cheon Y. Altered lipid concentrations of liver, heart and plasma but not brain in HIV-1 transgenic rats. Prostaglandins Leukot Essent Fatty Acids. 2012;87:91–101. doi: 10.1016/j.plefa.2012.07.006. [DOI] [PMC free article] [PubMed] [Google Scholar]
- 20.Ulmann L, Mimouni V, Roux S, Porsolt R, Poisson JP. Brain and hippocampus fatty acid composition in phospholipid classes of aged-relative cognitive deficit rats. Prostaglandins Leukot Essent Fatty Acids. 2001;64:189–95. doi: 10.1054/plef.2001.0260. [DOI] [PubMed] [Google Scholar]
- 21.Szabo A, Mezes M, Romvari R, Febel H. Allometric scaling of fatty acyl chains in fowl liver, lung and kidney, but not in brain phospholipids. Comp Biochem Physiol B Biochem Mol Biol. 2010;155:301–8. doi: 10.1016/j.cbpb.2009.11.018. [DOI] [PubMed] [Google Scholar]
- 22.O'Brien JS, Fillerup DL, Mead JF. Quantification and fatty acid and fatty aldehyde composition of ethanolamine, choline, and serine glycerophosphatides in human cerebral grey and white matter. J Lipid Res. 1964;5:329–38. [PubMed] [Google Scholar]
- 23.Kim J, Hoppel CL. Comprehensive approach to the quantitative analysis of mitochondrial phospholipids by HPLC-MS. J Chromatogr B Analyt Technol Biomed Life Sci. 2013;912:105–14. doi: 10.1016/j.jchromb.2012.10.036. [DOI] [PMC free article] [PubMed] [Google Scholar]
- 24.Christiansen K. Lipid extraction procedure for in vitro studies of glyceride synthesis with labeled fatty acids. Anal Biochem. 1975;66:93–9. doi: 10.1016/0003-2697(75)90728-9. [DOI] [PubMed] [Google Scholar]
- 25.Hsu FF, Turk J. Differentiation of 1-O-alk-1′-enyl-2-acyl and 1-O-alkyl-2-acyl glycerophospholipids by multiple-stage linear ion-trap mass spectrometry with electrospray ionization. J Am Soc Mass Spectrom. 2007;18:2065–73. doi: 10.1016/j.jasms.2007.08.019. [DOI] [PMC free article] [PubMed] [Google Scholar]
- 26.Kim J, Lampe JW, Yin T, Shinozaki K, Becker LB. Phospholipid alterations in the brain and heart in a rat model of asphyxia-induced cardiac arrest and cardiopulmonary bypass resuscitation. Mol Cell Biochem. 2015;408:273–81. doi: 10.1007/s11010-015-2505-0. [DOI] [PMC free article] [PubMed] [Google Scholar]
- 27.Choi J, Leonard SW, Kasper K, McDougall M, Stevens JF, Tanguay RL, Traber MG. Novel function of vitamin E in regulation of zebrafish (Danio rerio) brain lysophospholipids discovered using lipidomics. J Lipid Res. 2015;56:1182–90. doi: 10.1194/jlr.M058941. [DOI] [PMC free article] [PubMed] [Google Scholar]
- 28.Kim J, Minkler PE, Salomon RG, Anderson VE, Hoppel CL. Cardiolipin: characterization of distinct oxidized molecular species. J Lipid Res. 2011;52:125–35. doi: 10.1194/jlr.M010520. [DOI] [PMC free article] [PubMed] [Google Scholar]
- 29.Qi K, Hall M, Deckelbaum RJ. Long-chain polyunsaturated fatty acid accretion in brain. Curr Opin Clin Nutr Metab Care. 2002;5:133–8. doi: 10.1097/00075197-200203000-00003. [DOI] [PubMed] [Google Scholar]
- 30.Almeida R, Berzina Z, Arnspang EC, Baumgart J, Vogt J, Nitsch R, Ejsing CS. Quantitative spatial analysis of the mouse brain lipidome by pressurized liquid extraction surface analysis. Anal Chem. 2015;87:1749–56. doi: 10.1021/ac503627z. [DOI] [PubMed] [Google Scholar]
- 31.Bascoul-Colombo C, Guschina IA, Maskrey BH, Good M, O'Donnell VB, Harwood JL. Dietary DHA supplementation causes selective changes in phospholipids from different brain regions in both wild type mice and the Tg2576 mouse model of Alzheimer's disease. Biochim Biophys Acta. 2016;1861:524–37. doi: 10.1016/j.bbalip.2016.03.005. [DOI] [PMC free article] [PubMed] [Google Scholar]
- 32.Esfahani BASM, Mirmoghtadaei M, Anaraki SB. Oxidative Stress and Aging. In: Massoud A, Rezaei N, editors. Immunology of Aging. Springer Berlin Heidelberg; Berlin, Heidelberg: 2014. pp. 323–338. [Google Scholar]
- 33.Miladinovic T, Nashed MG, Singh G. Overview of Glutamatergic Dysregulation in Central Pathologies. Biomolecules. 2015;5:3112–41. doi: 10.3390/biom5043112. [DOI] [PMC free article] [PubMed] [Google Scholar]
- 34.Poureslami R, Raes K, Huyghebaert G, De Smet S. Effects of diet, age and gender on the polyunsaturated fatty acid composition of broiler anatomical compartments. Br Poult Sci. 2010;51:81–91. doi: 10.1080/00071660903419518. [DOI] [PubMed] [Google Scholar]
- 35.Bohm M, Schultz S, Koussoroplis AM, Kainz MJ. Tissue-specific fatty acids response to different diets in common carp (Cyprinus carpio L.) PLoS One. 2014;9:e94759. doi: 10.1371/journal.pone.0094759. [DOI] [PMC free article] [PubMed] [Google Scholar]
- 36.Martinez M, Mougan I. Fatty acid composition of human brain phospholipids during normal development. J Neurochem. 1998;71:2528–33. doi: 10.1046/j.1471-4159.1998.71062528.x. [DOI] [PubMed] [Google Scholar]
- 37.Igarashi M, Ma K, Gao F, Kim HW, Greenstein D, Rapoport SI, Rao JS. Brain lipid concentrations in bipolar disorder. J Psychiatr Res. 2010;44:177–82. doi: 10.1016/j.jpsychires.2009.08.001. [DOI] [PMC free article] [PubMed] [Google Scholar]
- 38.Petursdottir AL, Farr SA, Morley JE, Banks WA, Skuladottir GV. Lipid peroxidation in brain during aging in the senescence-accelerated mouse (SAM) Neurobiol Aging. 2007;28:1170–8. doi: 10.1016/j.neurobiolaging.2006.05.033. [DOI] [PubMed] [Google Scholar]
- 39.Zancanaro C, Bolner A, Righetti C. NMR spectroscopic analysis of rat brain development: in vitro proton and carbon studies of whole tissue and its phospholipid fraction. Dev Neurosci. 2001;23:107–12. doi: 10.1159/000048702. doi:48702. [DOI] [PubMed] [Google Scholar]
- 40.Sato Y, Nakamura T, Aoshima K, Oda Y. Quantitative and wide-ranging profiling of phospholipids in human plasma by two-dimensional liquid chromatography/mass spectrometry. Anal Chem. 2010;82:9858–64. doi: 10.1021/ac102211r. [DOI] [PubMed] [Google Scholar]
- 41.Han X, Yang J, Cheng H, Yang K, Abendschein DR, Gross RW. Shotgun lipidomics identifies cardiolipin depletion in diabetic myocardium linking altered substrate utilization with mitochondrial dysfunction. Biochemistry. 2005;44:16684–94. doi: 10.1021/bi051908a. [DOI] [PubMed] [Google Scholar]
- 42.Houjou T, Yamatani K, Imagawa M, Shimizu T, Taguchi R. A shotgun tandem mass spectrometric analysis of phospholipids with normal-phase and/or reverse-phase liquid chromatography/electrospray ionization mass spectrometry. Rapid Commun Mass Spectrom. 2005;19:654–66. doi: 10.1002/rcm.1836. [DOI] [PubMed] [Google Scholar]
- 43.Maccarone AT, Duldig J, Mitchell TW, Blanksby SJ, Duchoslav E, Campbell JL. Characterization of acyl chain position in unsaturated phosphatidylcholines using differential mobility-mass spectrometry. J Lipid Res. 2014;55:1668–77. doi: 10.1194/jlr.M046995. [DOI] [PMC free article] [PubMed] [Google Scholar]
- 44.Claypool SM, Koehler CM. The complexity of cardiolipin in health and disease. Trends Biochem Sci. 2012;37:32–41. doi: 10.1016/j.tibs.2011.09.003. [DOI] [PMC free article] [PubMed] [Google Scholar]
- 45.Schlame M, Ren M, Xu Y, Greenberg ML, Haller I. Molecular symmetry in mitochondrial cardiolipins. Chem Phys Lipids. 2005;138:38–49. doi: 10.1016/j.chemphyslip.2005.08.002. [DOI] [PubMed] [Google Scholar]
- 46.Chicco AJ, Sparagna GC. Role of cardiolipin alterations in mitochondrial dysfunction and disease. Am J Physiol Cell Physiol. 2007;292:C33–44. doi: 10.1152/ajpcell.00243.2006. [DOI] [PubMed] [Google Scholar]
- 47.McGee CD, Lieberman P, Greenwood CE. Dietary fatty acid composition induces comparable changes in cardiolipin fatty acid profile of heart and brain mitochondria. Lipids. 1996;31:611–6. doi: 10.1007/BF02523831. [DOI] [PubMed] [Google Scholar]
- 48.Khairallah RJ, Kim J, O'Shea KM, O'Connell KA, Brown BH, Galvao T, Daneault C, Des Rosiers C, Polster BM, Hoppel CL, Stanley WC. Improved mitochondrial function with diet-induced increase in either docosahexaenoic acid or arachidonic acid in membrane phospholipids. PLoS One. 2012;7:e34402. doi: 10.1371/journal.pone.0034402. [DOI] [PMC free article] [PubMed] [Google Scholar]
- 49.Aoun M, Fouret G, Michel F, Bonafos B, Ramos J, Cristol JP, Carbonneau MA, Coudray C, Feillet-Coudray C. Dietary fatty acids modulate liver mitochondrial cardiolipin content and its fatty acid composition in rats with non alcoholic fatty liver disease. J Bioenerg Biomembr. 2012;44:439–52. doi: 10.1007/s10863-012-9448-x. [DOI] [PubMed] [Google Scholar]
Associated Data
This section collects any data citations, data availability statements, or supplementary materials included in this article.
Supplementary Materials
Supplementary Fig. 1. Ion chromatograms of individual classes of phospholipids extracted from whole heart tissue. Ion chromatograms are generated using the most abundant species of each class.
Supplementary Fig. 2. Mass spectra of PI in the brain (top left), heart (top right), kidney (bottom left), and liver (bottom right).
Supplementary Fig. 3. Mass spectra of PG in the brain (top left), heart (top right), kidney (bottom left), and liver (bottom right).
Supplementary Fig. 4. MS/MS spectra of the MS peak at m/z 1448 from the heart (A) and brain (B). The MS/MS spectra from heart tissue shows typical fragmentation pattern of CL(18:2)4; the peak at 695 corresponds to a diacylglycerol moiety containing two 18:2 (A). In brain tissue, addition sets of peaks corresponding to diacylglycerol moiety, 671 and 719, 673 and 717, and 693 and 697, show the existence of at least 4 major isomers with molecular weight of 1448 (B)
Supplementary Fig. 5. The relative content of lysophospholipids compared to phospholipids in the brain (A), heart (B), kidney (C), and liver (D). LPC(16:0) and LPC(18:0) are significantly higher in kidney and liver tissues (data are presented as mean ± standard deviation, n=6).
Supplementary Fig. 6. The contents of free fatty acids in the brain, heart, kidney, and liver. Data are presented as mean ± standard deviation, n=4, * against brain, p<0.05).


