

Abstract
Purpose
Determine the localized expression pattern and clinical significance of VISTA/PD-1H in human NSCLC.
Experimental Design
Using multiplex quantitative immunofluorescence (QIF), we performed localized measurements of VISTA, PD-1 and PD-L1 protein in 758 stage I-IV NSCLCs from 3 independent cohorts represented in tissue microarray format. The targets were selectively measured in cytokeratin+ tumor epithelial cells, CD3+ T-cells, CD4+ T-helper cells, CD8+ cytotoxic T-cells, CD20+ B-lymphocytes and CD68+ tumor-associated macrophages. We determined the association between the targets, clinico-pathological/molecular variables and survival. Genomic analyses of lung cancer cases from TCGA was also performed.
Results
VISTA protein was detected in 99% of NSCLCs with a predominant membranous/cytoplasmic staining pattern. Expression in tumor and stromal cells was seen in 21% and 98% of cases, respectively. The levels of VISTA were positively associated with PD-L1, PD-1, CD8+ T-cells and CD68+ macrophages. VISTA expression was higher in T-lymphocytes than in macrophages; and in cytotoxic T-cells than in T-helper cells. Elevated VISTA was associated with absence of EGFR mutations and lower mutational burden in lung adenocarcinomas. Presence of VISTA in tumor compartment predicted longer 5-year survival.
Conclusions
VISTA is frequently expressed in human NSCLC and shows association with increased TILs, PD-1 axis markers, specific genomic alterations and outcome. These results support the immuno-modulatory role of VISTA in human NSCLC and suggests its potential as therapeutic target.
Keywords: NSCLC, VISTA/PD-1H, PD-1 pathway, TILs
Introduction
The anti-tumor immune response is essential to control tumor growth and progression. Blockade of immune co-regulatory signals in the tumor immune microenvironment such as the PD-1/PD-L1 axis has revolutionized the treatment of diverse tumor types (1-3). Notably, expression of PD-L1 protein or metrics of tumor immune infiltration in pre-treatment samples can be used to predict sensitivity/resistance to treatment (1-6). Therefore, careful evaluation of the tumor immune landscape could provide essential information to understand the role of the immune system during tumor progression and to define the optimal treatment modalities using both immune and non-immune therapies. To date, most studies characterizing multiple cell/targets in the tumor immune microenvironment have used non-human model systems and/or methods requiring tissue grinding such as flow cytometry/CyTOF and mRNA profiling. This has limited the understanding of the spatial context and evaluation of key cell/molecular interactions in human malignancies. For instance, multiple potentially actionable immune-modulatory proteins, such as CTLA-4, PD-1, PD-L1, LAG-3, TIM-3 and other can be co-expressed on immune cells and functionally interact with each other to modulate the response against tumors (7-9).
Due to its clinical relevance, the PD-L1/PD-1 pathway has been extensively studied in human malignancies. Engagement of PD-1 receptor by its ligand PD-L1 (and also PD-L2) mediates inhibitory signals in T-cells and antiapoptotic signals in tumor cells (10-13). In human neoplasms, PD-L1 is predominantly expressed in malignant tumor cells and macrophages in response to Interferon-γ (IFN-γ) stimulation or as a result of constitutive oncogenic signaling. Elevated levels of PD-L1 are found with variable frequency in human malignancies and blockade of this pathway produces prominent and lasting anti-tumor responses in a proportion of patients with cancer. This supports a fundamental role of the PD-1 pathway in the anti-tumor immune evasion (2, 3, 10-12). PD-L1 (also known as B7-H1 or CD274) belongs to the B7 family of immune-regulatory molecules. Since its initial description, additional members of this family have been reported containing variable degree of sequence homology including PD-L2/B7-DC, B7-H2/ICOS-L, B7-H3, B7-H4, B7-H5, VISTA/PD-1H and B7-H6 (13). To date, little is known about the expression, biological role and therapeutic potential of these targets in human neoplasms.
Human VISTA is a 311 amino acids long Ig domain-containing type I transmembrane protein able to suppress T-cell activation in vitro and in vivo. Notably, this protein shares sequence homology with both PD-1 and PD-L1 (14, 15) and can act as a ligand on antigen presenting cells and as receptor in T-lymphocytes (14-19).
Previous studies have shown high VISTA expression in CD11b+ myeloid cells and lower levels on CD4+ and CD8+ T cells and CD4+/Foxp3+ T-regulatory lymphocytes (Tregs) (14-15, 18-19). To date, there is no clear evidence of VISTA expression in tumor cells (16, 18-20). Chronic inflammation and spontaneous activation of T-cells have been reported in PD-1 or VISTA single knockout animals, and this phenotype is enhanced in double knockout mice (21). In addition, the magnitude of T-cell responses after a challenge with foreign antigens is synergistically increased in the double knockout mice compared with the single knockout animals, supporting non-redundant immune suppressive effects of VISTA and PD-1 pathway (21). Despite these functional associations, the expression pattern and possible link between PD-1, PD-L1 and VISTA expression in human tumors remains unexplored. Recent studies in melanoma mouse models show that blockade of VISTA using monoclonal antibodies increases the proportion of circulating tumor-specific T-cell, promotes tumor immune-infiltration and reduces tumor growth (15). Furthermore, an additive anti-tumor effect with differential contribution of VISTA, CTLA-4 and PD-1 was reported in a squamous cell carcinoma model (22).
Here, we performed quantitative and spatially resolved measurements of VISTA protein and additional immune markers in 3 large cohorts of human NSCLCs. To further support our findings, we also performed analyses of The Cancer Genome Atlas (TCGA) lung cancer dataset. Our data demonstrate frequent expression of VISTA in human lung carcinomas and differential expression in tumor and immune cell subsets. We also show association of VISTA with local anti-tumor immune responses, expression of PD-1 axis markers, specific tumor genomic alterations and survival in human lung cancer.
Materials and Methods
Patient cohorts and tissue microarrays (TMAs)
We included retrospectively collected formalin-fixed, paraffin-embedded (FFPE) tumor samples from 765 stage I-IV NSCLCs in 3 cohorts represented in tissue microarray (TMA) format. The first 2 cohorts included NSCLCs cases with detailed clinico-pathological annotation and have been previously reported (23-25). The TMAs were constructed by selecting areas containing viable tumor cells and stromal elements on Hematoxylin & Eosin stained preparations (as assessed by a pathologist) and without enriching for specific tumor regions, tissue structures or immune-related features. The first collection is from Greek hospitals between 1991 and 2001 and included 329 specimens. The second cohort was from Yale and included 297 samples collected between 1988 and 2003. The clinico-pathological characteristics of these cohorts are described in the supplementary Table S2. A third cohort from Yale (n=139, supplemental Table S3) including advanced lung adenocarcinomas clinically tested for EGFR and KRAS mutations was also studied. The final number of cases used for each analysis is different from the total number of cases in the cohorts (758 cases included) due to inevitable loss of histospots during the staining procedure or exclusion of cases after quality control. For the QIF measurements we used two different TMA blocks from the cohorts, each containing 2 independent 0.6 mm tumor cores. Serial sections from each TMA were stained twice. Therefore, the results presented included integrated data from 2-4 independent tumor cores stained at least twice. To determine the levels of VISTA in non-tumor lung tissue relative to paired NSCLC from the same cases, we also included a cohort of 46 primary resected NSCLCs (supplementary Figure S5). All tissues were used after approval from the Yale Human Investigation Committee protocols #9505008219 and #1608018220, which approved the patient consent forms or in some cases waiver of consent.
Quantitative immunofluorescence (QIF)
Using previously validated/standardized multiplexed QIF panels and serial TMA sections, we measured the levels of cytokeratin (clone AE1/AE3, eBioscience), VISTA (clone D1L2G, CST), PD-L1 (clone 405.9A11, CST), PD-1 (clone EH33, CST), CD3 (polyclonal, DAKO), CD4 (clone SP35, Spring Biosc.), CD8 (clone C8/144B, DAKO), CD20 (clone L26, DAKO) and CD68 (clone KP1, DAKO). The specific QIF panels used and experimental conditions are outlined in the supplemental Table S1 and were stained using a previously reported protocol (25-27). Briefly, freshly cut TMA serial sections were deparaffinized and antigen retrieval was carried on with 1mM EDTA pH8 (Sigma Aldrich) and boiled for 20 minutes at 97°C (PT module, Lab Vision, Thermo Sci.). Inactivation of endogenous peroxidase activity was carried on using a solution of 0.3% hydrogen peroxide in methanol for 20 minutes and then slides were incubated with a blocking solution containing 0.3% BSA in 0.05% Tween-20 and Tris-buffered solution for 30 minutes. Primary antibody dilution and incubation were carried on as described in Table S1. Isotype-specific HRP-conjugated antibodies and tyramide-based amplification systems (Perkin Elmer) were used for signal detection. Residual HRP activity between sequential detection protocol was eliminated incubating the slides twice with a solution containing 100mM benzoic hydrazide and 50mM hydrogen peroxide in phosphate-buffered solution.
Fluorescence signal quantification and cases stratification
Quantitative measurement of the fluorescence signal was performed using the AQUA® method of QIF, as previously reported (25-27). Each slide was visually examined to exclude samples with tissue/staining artifacts and those with less than 5% tumor content. Cases were considered to display detectable levels of each target when the QIF score was above the signal to noise threshold determined measuring negative control preparations and by visual examination of the sample. For VISTA, PD-1 and PD-L1 measurement, we considered the signal detected in the tumor compartment (cytokeratin-positive cells), stromal (cytokeratin-negative cells) compartment, and the total tissue area signal detected in the whole tumor sample (tumor and stroma). In addition, VISTA was selectively measured in immune cell subpopulations defined by its co-localization with the immune cell phenotype markers CD3, CD4, CD8, CD20 or CD68. For stratification purposes and statistical analysis, VISTA, PD-1 and PD-L1 detection were classified as high and low using the median score as cut-point.
Cell culture and antibody validation
The VISTA antibody validation was carried out using antibody pre-absorption with the recombinant protein and by quantitative immunodetection in FFPE cell line preparations containing parental cells and cells with siRNA-induced VISTA silencing (supplemental Figure S1). VISTA monoclonal antibody was pre-absorbed with 2.5 and 5.0 ug of human recombinant VISTA protein (R&D systems). Pre-absorption was carried on overnight at 4°C in a solution of BSA 0.3% and Tris-buffered solution (0.05% Tween-20) containing a ratio 1:2 and 1:1 of antigen and antibody. Absorbed antibody was diluted to 94 ng/ml and used to detect the target by QIF in positive and negative control preparations. HPB-all, Ramos and Karpas cell lines were cultured in RPMI-1640 culture medium containing 10% FBS, 1mM glutamine and 10 IU streptomycin/ampicillin. VISTA knockdown in these were achieved using two single siRNAs (ID:261239 and ID:258598 from Ambion®) and a mixed pool (SC-90756 from Santa Cruz Biotechnology). A scrambled siRNA was used as negative control (#12935-100, Invitrogen). Cells were transfected using Lipofectamin® and 10 nmol of each siRNA for 24 hours, and then cultured with low FBS OPTI-MEM medium for additional 24 hours. Control and knocked-down cells were used fresh for protein extraction and immunoblotting; or fixed in 10% neutral buffered formalin for 8-12 h and embedded in paraffin for VISTA quantification by QIF. The antibodies against additional targets used in this study have been previously validated by our group using comparable strategies (25-30). Cell lines used in this study were purchased in the American Type Culture Collection (ATCC) and authentication was performed every 3-6 months using the GenePrint® 10 System in the Yale University DNA Analysis Facility.
TCGA data analysis for mRNA expression and genomic alterations
We analyzed the NSCLC samples from the Cancer Genome Atlas (TCGA, http://cancergenome.nih.gov/). Briefly, we downloaded the RNA-seq and DNA whole exome sequencing data from 370 NSCLC cases including 250 adenocarcinomas and 120 squamous cell carcinomas. Then, we aligned the transcripts and performed variant calling using defaults TCGA pipelines. Then, we conducted single Scatterplot analysis between log2 transformed mRNA FPKM scores of VISTA, PD-L1, PD-1 and CD8A. The number of nonsynonymous mutations detected in the whole exome sequencing data was used as the mutational burden. Association was defined based on linear regression factor (R2) and the statistical significance using the linear correlation by GraphPad 5.0 software.
Statistical analysis
all statistical and survival studies were conducted using JMP 10.0 software for Windows. Graphs and images were prepared using GraphPad 5.0 and Photoshop 9.0 for Windows. A standard two-tailed Student’s t-test was used for all statistical analyses. All samples sizes were appropriate for assumption of normal distribution, and variance was similar between compared groups. The statistical values of P<0.05 was considered statistically significant. Adjustment for multiple comparisons was performed using the Bonferroni method and statistical significance was met with P=0.002. Values of mean determinants are presented as Mean ± SEM.
Results
Validation of an anti-VISTA assay and multiplexed immunodetection
Stringent validation and optimization of a VISTA monoclonal antibody for use in formalin-fixed paraffin-embedded (FFPE) tissue samples was performed. To determine the target specificity, we measured VISTA protein levels using quantitative immunofluorescence (QIF) in Ramos cell preparations with known (endogenous) VISTA expression using the antibody in control conditions or after pre-absorption with recombinant human VISTA protein. As shown in the supplementary Figure S1A, overnight incubation of the primary antibody with 2.5 μg of VISTA protein significantly reduced the target detection and incubation with 5 μg completely abolished VISTA signal. Pre-incubation of the antibody did not affect PD-L1 levels in Karpas cells (known to express PD-L1) ruling out a non-specific effect of the recombinant peptide and cross reactivity of the primary antibody with PD-L1 protein (supplementary Figure S1B and E). PD-L1 was not detected in Ramos cells using both control and pre-absorbed antibodies. To further assess the assay specificity, we performed VISTA measurements in Ramos cells with and without siRNA-induced VISTA silencing. As shown in the supplementary Figure S1C, lower VISTA levels were detected in cells exposed for 48 h to 2 different VISTA-specific siRNAs but no change was seen after transfection with a non-specific/scrambled siRNA. As expected, the levels of PD-L1 protein were not affected by incubation with VISTA-specific or scrambled siRNA (supplementary Figure S1D). After the specificity assessment, the VISTA assay was titrated and optimized for use in multiplexing QIF panels with previously validated antibodies for PD-1, PD-L1 and immune cell markers. A detailed description of the antibodies, experimental conditions, fluorescence channels and panels used are shown in the supplementary Table S1. Human tonsil and placenta samples were used as positive human tissue controls and for standardization of the multiplexed QIF experiments. As shown in the supplementary Figure S2A, VISTA was detected preferentially in the inter-follicular tonsil areas and in trophoblastic cells of the placenta. Prominent PD-L1 signal was seen in germinal centers (Figure S2A, upper panel) and trophoblastic cells of the chorionic villi, but not in the mesenchymal areas of the placenta (Figure S2A, lower panel). Representative captions from the 4 different multiplexing panels described in the supplementary Table S1 stained in the NSCLC cases are shown in the supplementary Figure S2B.
VISTA expression in NSCLC
To evaluate the expression of VISTA and its biological significance in human NSCLC, 636 cases represented in TMAs from two independent cohorts were studied (supplementary Table S2). As shown in Figures 1A-C, VISTA protein was detected with variable levels across NSCLCs. It was expressed predominantly in stromal cells and showed a cytoplasmic/membranous staining pattern. A fraction of cases showed a mixed pattern with simultaneous expression of VISTA in stromal cells and in cytokeratin-positive tumor epithelial cells (Figure 1D). Some cases also displayed VISTA expression in immune cells infiltrating or abutting cytokeratin-positive tumor regions (supplementary Figure S3, lower panels). In the quantitative analysis, VISTA protein levels displayed a continuous distribution and the scores were comparable in both studied cohorts (Figures 1E-F). Overall, VISTA protein was detected in 99% of NSCLC cases with 19.4% and 22.8% of cases showing a mixed tumor/stromal staining pattern in cohorts #1 and #2, respectively. Notably, there was a positive association between the levels of VISTA in tumor and stromal cells (Linear regression coefficient [R2]=0.32 in cohort #1 and 0.33 in cohort #2, P<0.001, Figures 1G-H). As shown in the supplementary Figure S4 the levels of stromal VISTA were significantly higher in the tumor than in morphologically normal lung tissue form the same cases (P=0.035). In the non-tumor lung tissue the majority of VISTA signal was located in non-epithelial cells underlying cytokeratin-positive pneumocytes with morphological features consistent with macrophages.
Figure 1. VISTA is highly expressed in NSCLC.
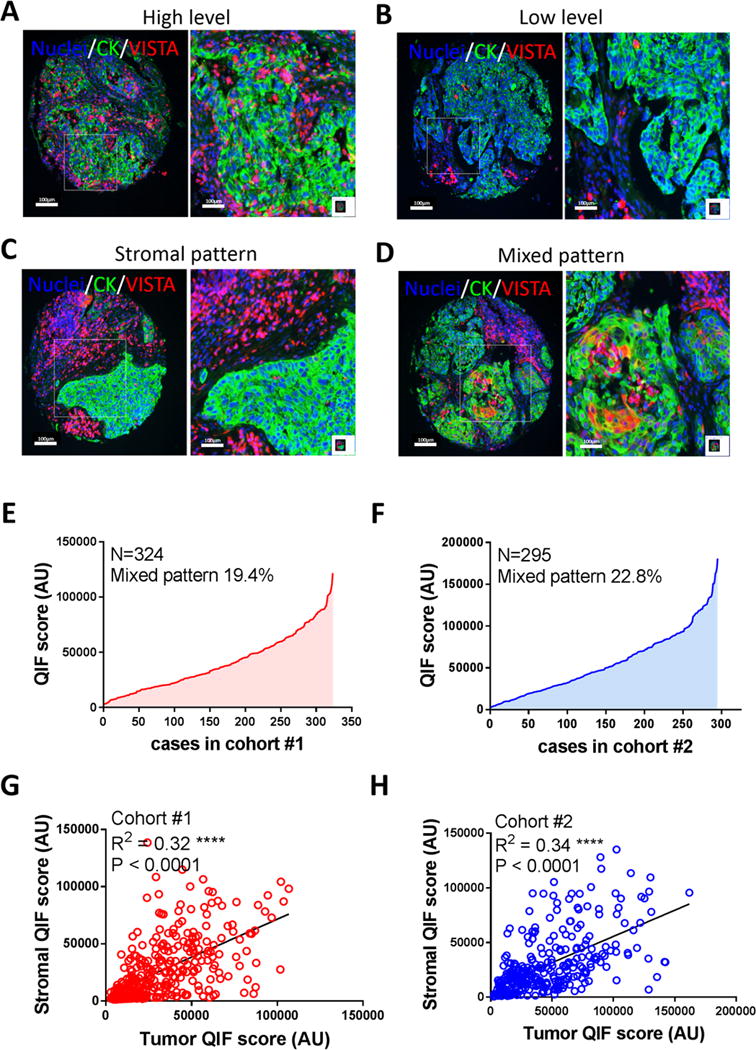
Quantitative immunofluorescence (QIF) for VISTA protein was performed. The protein expression, immunodetection pattern and QIF scores were analyzed based on distribution and correlation between different compartments in two different retrospective NSCLC cohorts (Cohort #1, N=324 and Cohort #2, N=295). In panels A-D, representative immunolocalization of VISTA in NSCLC cases with high and low stromal detection are showed (A and B, respectively). Overall 80% of total NSCLC cases showed a stromal VISTA detection (panel C) and 20% of cases expressed VISTA on cytokeratin positive cells (panel D). For both studied cohorts, total number cases were represented in a distribution curve showing the lowest and highest measured total QIF score using DAPI as mask (E and F). Correlation between stromal and tumor VISTA detection were analyzed and linear regression factor (R2) are indicated, QIF scores were measured using the respective compartment (cytokeratin negative and positive, respectively). Images are representative of 619 cases.
To explore the possible role of VISTA in the immune microenvironment of NSCLC, we measured its levels in CD3+ tumor infiltrating T-cells, CD4+ T-helper cells, CD8+ cytotoxic T-lymphocytes, CD20+ B-cells and CD68+ tumor associated macrophages. As shown in Figures 2A-C and in the supplementary Figure S5, detectable levels of VISTA were recognized in all studied immune cell subsets but were significantly higher in CD3+ T-cells than in CD68 positive macrophages or CD20+ B-lymphocytes (Figure 2A). In addition, higher levels of VISTA were found in CD8+ cytotoxic cells than in CD4+ helper T-lymphocytes (Figure 2B).
Figure 2. VISTA is selectively expressed in immune cells subset.
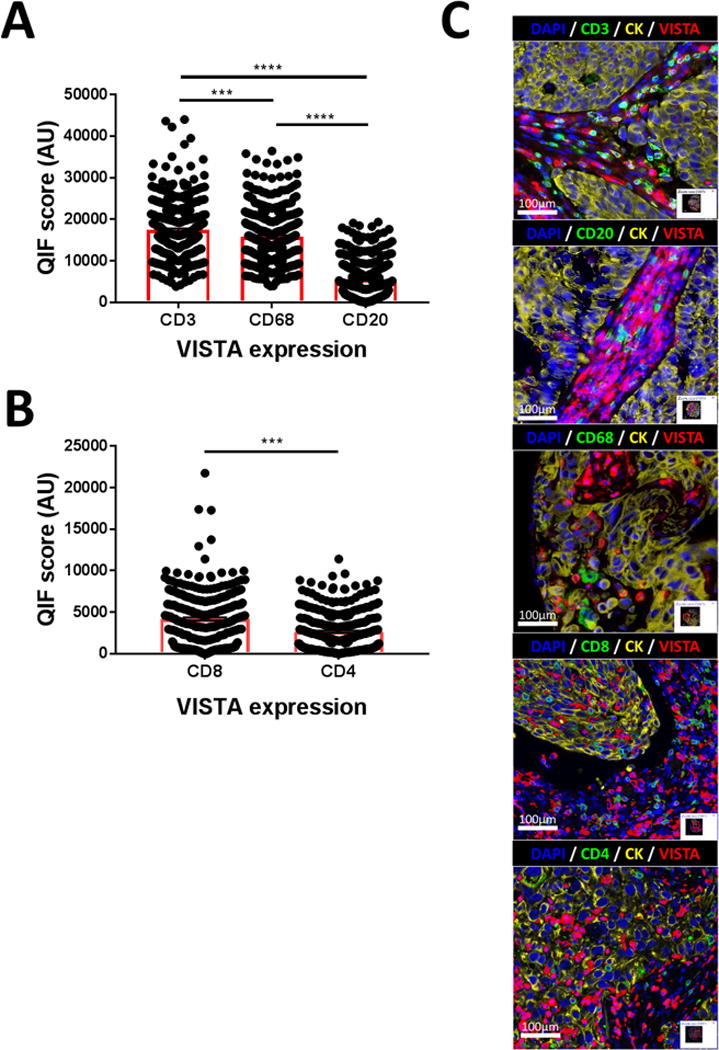
Simultaneous Quantitative immunofluorescence (QIF) for VISTA and most relevant immune cell subtype markers were performed in a single unrelated NSCLC cohort (N=340). QIF scores for VISTA expression in a cellular subset were measured using the specific immune marker as mask. In A) VISTA is detected predominantly in T lymphocytes (CD3+ cells) and Macrophages (CD68+ cells) than B lymphocytes (CD20+ cells) population. In B) CD8+ cytotoxic cells expressed more VISTA than CD4+ T regulatory lymphocytes. C) representative images of VISTA, immune marker, and tumor cells (cytokeratin, CK+ cells) co-detection are showed. ***P=0.001 and ****P<0.0001.
To understand the relationship between VISTA expression and the immune composition of NSCLCs, we studied the association between cell-specific VISTA levels and tumor infiltration by different immune cell populations. As shown in the Table 1, elevated VISTA protein measured in all cells of the sample (e.g. total score) or exclusively in CD3+ TILs was significantly associated with prominent CD3+/CD8+ TILs, CD20+ B lymphocytes and CD68+ macrophages, but with low levels of CD4+ TILs. A similar trend was seen with VISTA in CD4, CD8, CD20 and CD68+ cells but without reaching statistical significance for all cell type categories, suggesting a weaker association. Altogether, these results indicate an association between higher levels of VISTA expression and increased tumor immune infiltration in human lung cancer.
Table 1. VISTA is expressed in immune cells and correlated with TILs.
Simultaneous Quantitative immunofluorescence (QIF) was performed in a single unrelated NSCLC cohort. QIF scores for VISTA expression in a cellular subset were measured in the respective mask. Studied cohort was separated in cases with high and low expression using the median QIF score as cut point. Contingency analysis between immune cell infiltration and VISTA expression was performed. Number of cases per marker/mask (N) and P values for each category are indicated.
| CD8+ cells infiltration |
CD4+ cells infiltration |
CD3+ cells infiltration |
CD20+ cells infiltration |
CD68+ cells infiltration |
|||||||||||||||||
|---|---|---|---|---|---|---|---|---|---|---|---|---|---|---|---|---|---|---|---|---|---|
| 462 | Low | High | 462 | Low | High | 675 | Low | High | 503 | Low | High | 297 | Low | High | |||||||
| N | 231 | 231 | P | N | 232 | 230 | P | N | 326 | 349 | P | N | 252 | 251 | P | N | 149 | 148 | P | ||
| total VISTA | Low | 241 | 142/31.7% | 99/21.4% | <0.0001 | 241 | 109/23.6% | 132/28.6% | 0.025 | 339 | 229/33.9% | 97/14.4% | <0.0001 | 242 | 138/27.4% | 104/20.7% | 0.0027 | 111 | 75 25.2% | 36 12.1% | <0.0001 |
| High | 221 | 89/19.3% | 132/28.6% | 221 | 123/26.6% | 98/21.2% | 336 | 110/16.3% | 239/35.4% | 261 | 114/22.7% | 147/29.2% | 186 | 74/24.9% | 112/37.7% | ||||||
| 462 | Low | High | 462 | Low | High | 414 | Low | High | 411 | Low | High | 95 | Low | High | |||||||
| N | 231 | 231 | P | N | 232 | 230 | P | N | 212 | 202 | P | N | 207 | 204 | P | N | 52 | 43 | P | ||
| VISTA in CD8+ cells | Low | 231 | 130/28.1% | 101/21.9% | 0.0069 | 231 | 115/24.9% | 116/25.1% | 0.8524 | 208 | 122/29.5% | 86/20.8% | 0.002 | 205 | 110/26.8% | 95/23.1% | 0.1826 | 46 | 24/25.3% | 22/23.2% | 0.6267 |
| High | 231 | 101/21.9% | 130/28.1% | 231 | 117/25.3% | 114/24.7% | 206 | 90/21.7% | 116/28.0% | 206 | 97/23.6% | 109/26.5% | 49 | 28/29.5% | 21/22.1% | ||||||
| 462 | Low | High | 462 | Low | High | 414 | Low | High | 411 | Low | High | 95 | Low | High | |||||||
| N | 231 | 231 | P | N | 232 | 230 | P | N | 212 | 202 | P | N | 207 | 204 | P | N | 52 | 43 | P | ||
| VISTA in CD4+ cells | Low | 231 | 137/29.6% | 94/20.4% | <0.0001 | 231 | 99/21.4% | 132/28.6% | 0.0015 | 205 | 109/26.3% | 96/23.2% | 0.4287 | 203 | 109/26.5% | 94/22.9% | 0.1821 | 45 | 25/26.3% | 20/21.0% | 0.8791 |
| High | 231 | 94/20.4% | 137/29.6% | 231 | 133/28.8% | 98/21.2% | 209 | 103/24.9% | 106/25.6% | 208 | 98/23.8% | 110/26.8% | 50 | 27/28.4% | 23/24.2% | ||||||
| 414 | Low | High | 414 | Low | High | 675 | Low | High | 503 | Low | High | 297 | Low | High | |||||||
| N | 204 | 210 | P | N | 216 | 198 | P | N | 339 | 336 | P | N | 252 | 251 | P | N | 149 | 148 | P | ||
| VISTA in CD3+ cells | Low | 206 | 117/28.3% | 89/21.5% | 0.002 | 206 | 95/22.9% | 111/26.8% | 0.014 | 339 | 226/33.5% | 113/16.7% | <0.0001 | 255 | 147/29.2% | 108/21.5% | 0.0006 | 114 | 71/23.9% | 43/14.5% | 0.0009 |
| High | 208 | 87/21.0% | 121/29.2% | 208 | 121/29.2% | 87/21.0% | 336 | 113/16.7% | 223/33.0% | 248 | 105/20.9% | 143/28.4% | 183 | 78/26.3% | 105/35.3% | ||||||
| 411 | Low | High | 411 | Low | High | 503 | Low | High | 503 | Low | High | 125 | Low | High | |||||||
| N | 203 | 208 | P | N | 215 | 196 | P | N | 255 | 248 | P | N | 252 | 251 | P | N | 63 | 62 | P | ||
| VISTA in CD20+ cells | Low | 205 | 117/28.5% | 88/21.4% | 0.0018 | 205 | 101/24.6% | 104/25.3% | 0.2177 | 252 | 136/27.0% | 116/23.1% | 0.1412 | 252 | 143/28.4% | 109/21.7% | 0.002 | 65 | 37/29.6% | 28/22.4% | 0.1284 |
| High | 206 | 86/20.9% | 120/29.2% | 206 | 114/27.7% | 92/22.4% | 251 | 119/23.7% | 132/26.2% | 251 | 109/21.7% | 142/28.2% | 60 | 26/20.8% | 34/27.2% | ||||||
| 95 | Low | High | 95 | Low | High | 297 | Low | High | 125 | Low | High | 297 | Low | High | |||||||
| N | 50 | 45 | P | N | 46 | 49 | P | N | 110 | 187 | P | N | 70 | 55 | P | N | 149 | 148 | P | ||
| VISTA in CD68+ cells | Low | 46 | 30/31.6% | 16/16.8% | 0.0167 | 55 | 28/29.5% | 18/18.9% | 0.5692 | 149 | 62/20.9% | 87/29.3% | 0.1011 | 62 | 32/25.6% | 30/24% | 0.3267 | 149 | 83/27.9% | 66/22.2% | 0.0553 |
| High | 49 | 20/21.1% | 29/30.5% | 40 | 27/28.4% | 22/23.2% | 148 | 48/16.2% | 100/33.7% | 63 | 38/30.4% | 25/20% | 148 | 66/22.2% | 82/27.6% | ||||||
VISTA levels and PD-1 axis in NSCLC
To evaluate the association between VISTA and major PD-1 axis components, we simultaneously measured the levels of cytokeratin, VISTA, PD-1 and PD-L1 protein in the NSCLC cohorts. As expected, PD-1 was located exclusively in immune cells of the stroma and PD-L1 was predominantly recognized in tumor epithelial cells and tumor associated macrophages (Figure 3A-B). No cases showed simultaneous co-expression of all three markers in the same cell population. The most frequent phenotype seen was the co-expression of two of the targets in specific cell types. Notably, we found a proportion of cases containing stromal cells with simultaneous expression of VISTA/PD-1 and morphological features consistent with lymphocytes (Figure 3A); and cells co-expressing VISTA/PD-L1 and features consistent with tumor associated macrophages (Figure 3B). Overall and measuring the markers in the whole tumor tissue sample, the levels of VISTA protein were significantly correlated with the levels of both PD-1 and PD-L1 (R2=0.53-0.61, P<0.0001, Figures 3C-F). In additional analysis using the median marker levels as stratification cut-point, elevated expression of VISTA was significantly associated with high PD-1, PD-L1 and CD8+ TILs; and this association was consistent in both studied cohorts (Table 2).
Figure 3. PD-1 axis markers are co-expressed and correlated with VISTA expression in NSCLC.
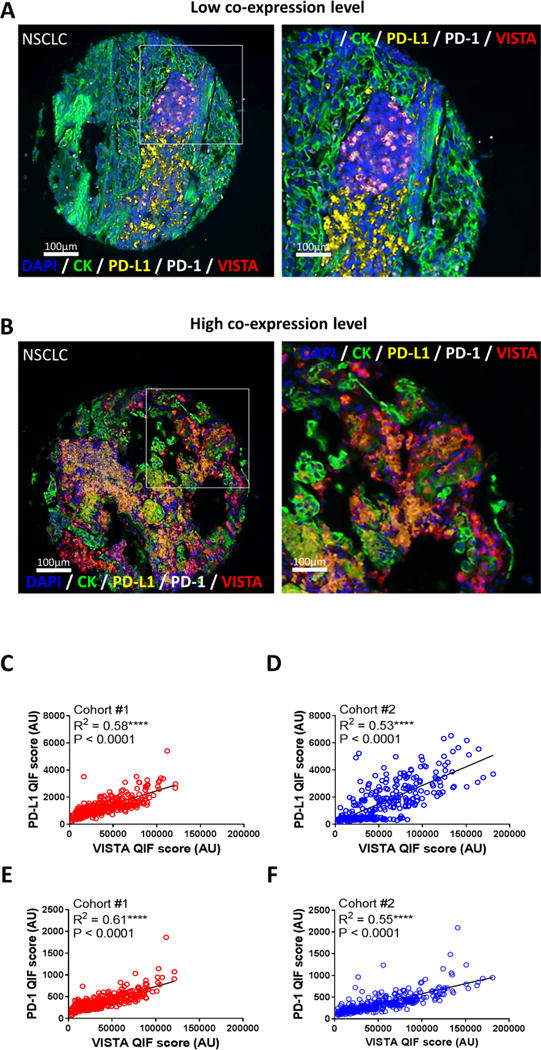
Simultaneous Quantitative immunofluorescence (QIF) for VISTA, PD-L1 and PD-1 was performed in two different unrelated retrospective NSCLC cohorts (Cohort #1, N=324 and Cohort #2, N=295). For both studied cohorts, the respective target co-expression, distribution and total QIF scores were measured. In panels A-D, representative co-immunolocalization of VISTA, PD-L1 and PD-1 proteins in NSCLC cases with high and low stromal detection are showed (A and B, respectively). Selected area shows an amplified view of the multiplex immunodetection. QIF scores for each studied target were analyzed by a scatterplot matrix, representing the correlation between PD-L1 and VISTA co-expression (C and D), and PD-1 and VISTA co-expression (E and F) in both NSCLC cohorts. Linear regression factor (R2) and P values are indicated. Images are representative of 619 cases.
Table 2. VISTA and PD-1 axis molecules are associated and correlated with tumor infiltrating CD8+ cytotoxic lymphocytes.
Simultaneous Quantitative immunofluorescence (QIF) was performed and QIF scores for the respective target were measured in two different unrelated retrospective NSCLC cohorts (Cohort #1, N=324 and Cohort #2, N=295). Studied cohorts were separated in cases with high and low expression using the median QIF score as cut point. Contingency analysis for each cohort was independently performed and the P values for each category are indicated.
| Cohort #1 | Cohort #2 | ||||||||
|---|---|---|---|---|---|---|---|---|---|
| VISTA expression
|
VISTA expression
|
||||||||
| N | High | Low | P value | N | High | Low | P value | ||
| PD-1 | 324 | 162 | 162 | 292 | 146 | 146 | |||
| High | 162 | 41.4% | 8.6% | <0.0001 | 147 | 43.0% | 6.8% | <0.0001 | |
| Low | 162 | 8.6% | 41.4% | 145 | 6.8% | 43.4% | |||
| PD-L1 | 324 | 162 | 162 | 292 | 146 | 146 | |||
| High | 162 | 41.0% | 9.0% | <0.0001 | 147 | 41.4% | 8.5% | <0.0001 | |
| Low | 162 | 8.9% | 41.1% | 145 | 8.5% | 41.6% | |||
| CD8 | 277 | 145 | 132 | 288 | 147 | 141 | |||
| High | 140 | 32.5% | 18.1% | <0.0001 | 145 | 33.6% | 15.5% | 0.001 | |
| Low | 137 | 19.9% | 29.5% | 143 | 20.0% | 30.9% | |||
To further support our findings, we studied the association between the levels of VISTA, PD-1, PD-L1 and CD8A mRNA transcripts in the NSCLC datasets from TCGA. As shown in Figures 4A-B, we found a positive association between the levels of VISTA, PD-1 and CD8 mRNA in both lung adenocarcinomas (N=250, Figure 4A) and squamous cell carcinomas (N=120, Figure 4B). However, a significant association between VISTA and PD-L1 transcript was seen only in lung adenocarcinomas from TCGA, but not in squamous tumors.
Figure 4. VISTA mRNA is correlated with PD-L1 and PD-1 molecules and CD8+ cytotoxic lymphocytes in The Cancer Genome Atlas (TCGA) Data Set.
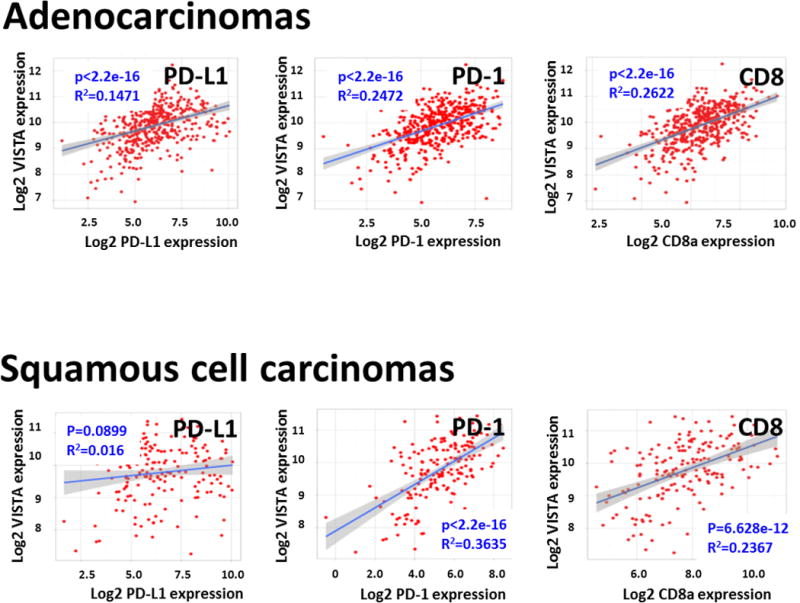
Scatterplot analysis of 250 cases of lung adenocarcinomas and 120 cases of lung squamous cell carcinoma from the TCGA data set were analyzed. Linear regression factor (R2) and P values for the association between VISTA, PD-L1, PD-1 and CD8a are indicated.
Genotype/phenotype associations of VISTA expression in NSCLC
To explore the association of VISTA levels with major molecular subtypes of lung cancer, we studied a third cohort including 139 primary lung adenocarcinomas clinically tested for activating mutations in KRAS and EGFR (supplementary table S3). As shown in Figure 5A, total or tumor specific VISTA levels were comparable across cases with and without KRAS/EGFR mutations. However, elevated VISTA protein in stromal cells was significantly lower in tumors harboring oncogenic mutations in EGFR than in neoplasms lacking KRAS and EGFR mutations (Figure 5B).
Figure 5. VISTA shows a minimal association with lung cancer mutational status.
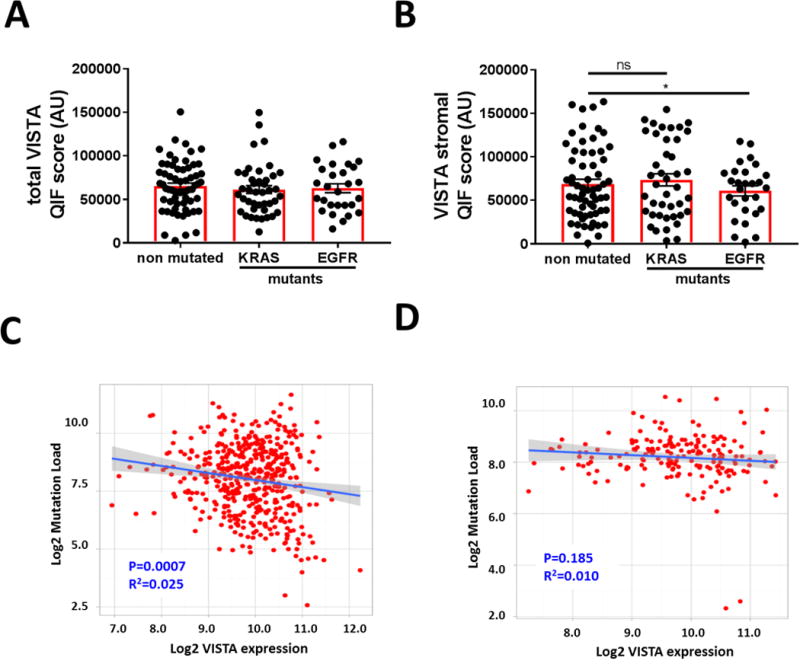
An unrelated and retrospective cohort with major molecular adenocarcinoma variants was analyzed (Cohort #3, N=139). A-B) Levels of VISTA protein in the whole tumor tissue (A) or in the stromal area (B) in primary lung adenocarcinomas lacking mutations in KRAS and EGFR (non-mutated) and in tumors with oncogenic KRAS or EGFR variants (mutants). Scatterplot analysis of 250 cases of lung adenocarcinomas (C) and 120 cases of lung squamous cell carcinoma (D) from the TCGA data set were analyzed. Linear regression factor (R2) and P values for the association between VISTA mRNA expression and global mutational load are indicated. *P<0.05.
To explore the association between VISTA levels and the somatic genomic landscape in NSCLC, we studied the relationship between VISTA mRNA expression and the nonsynonymous mutational burden in lung cancer cases from TCGA. As shown in Figures 5C-D, we found an inverse relationship between VISTA transcript levels and the number of nonsynonymous DNA variants in lung adenocarcinomas (Figure 5C). However, no significant association was seen in squamous lung malignancies (Figure 5D).
Biological implications of VISTA expression in NSCLC
To assess the biological relevance of VISTA expression in lung carcinomas, we determined the association between VISTA levels, major clinico-pathological variables and survival in the NSCLC cohorts. As shown in Table 3 and using the median score as stratification cut-point, we found no consistent association between the level of total VISTA in the samples and major clinico-pathological variables in the cohorts. However, elevated expression of VISTA measured exclusively in the tumor area, was significantly associated with longer 5-year overall survival and this was consistent in both the training cohort #1 and in the validation set/cohort #2 (log-rank P=0.027 – 0.038, Figure 6). No consistent association between stromal VISTA levels or VISTA measured in the total tissue area and survival were detected using the median score as stratification cut-point (supplementary Figure S6).
Table 3. Clinical relevance of VISTA expression in NSCLC.
Contingency analysis between major clinicopathological variables and total QIF scores for VISTA expression from two unrelated retrospective NSCLC cohorts (Cohort #1, N=324 and Cohort #2, N=295) were performed. Studied cohorts were separated in cases with high and low expression using the median QIF score as cut point. P values for each category are indicated.
| Cohort #1 | Cohort #2 | |||||||
|---|---|---|---|---|---|---|---|---|
| VISTA expression | VISTA expression | |||||||
|
| ||||||||
| N | High | Low | P value | N | High | Low | P value | |
| Total patients | 324 | 167 | 157 | 292 | 150 | 142 | ||
| Age (years) | ||||||||
| <70 | 247 | 39.9% | 36.5% | 0.589 | 125 | 29.7% | 27.7% | 0.814 |
| ≥70 | 77 | 11.5% | 12.1% | 167 | 21.5% | 21.2% | ||
| Sex | ||||||||
| Male | 287 | 45.7% | 42.9% | 0.980 | 139 | 25.0% | 22.6% | 0.708 |
| Female | 37 | 5.9% | 5.6% | 153 | 26.4% | 26.0% | ||
| Smoking status | ||||||||
| Never-smoker | 26 | 4.5% | 4.5% | 0.911 | 39 | 7.6% | 5.9% | 0.529 |
| Smoker | 262 | 46.5% | 44.4% | 249 | 44.1% | 42.4% | ||
| Unknown | 36 | 4 | ||||||
| Histology | ||||||||
| Adenocarcinoma | 122 | 23.2% | 20.4% | 0.516 | 162 | 37.9% | 31.9% | 0.315 |
| Squamous cell carcinoma | 158 | 27.9% | 28.6% | 70 | 14.2% | 16.0% | ||
| Others | 44 | 57 | ||||||
| Unknown | 0 | 3 | ||||||
| Stage | ||||||||
| I-II | 191 | 29.2% | 30.7% | 0.293 | 229 | 41.7% | 37.2% | 0.462 |
| III-IV | 128 | 21.9% | 18.2% | 61 | 10.0% | 11.0% | ||
| Unknown | 5 | 2 | ||||||
Figure 6. Association between VISTA levels and overall survival in NSCLC.
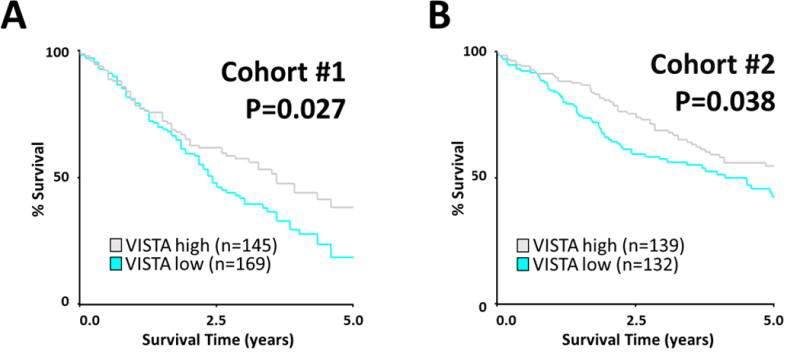
Kaplan-Maier graphical analysis of the 5-years overall survival in NSCLC cases from cohort #1 (A) and cohort #2 (B) based on the levels of VISTA protein expression in the tumor area. Patients from two independent cohorts were stratified by VISTA QIF score (low vs high expression) using the median as a cut point. P values comparing risk groups were calculated with the log-rank test.
Discussion
Despite the prominent interest and possible role of VISTA/PD-1H as a novel anti-cancer immunotherapy target in human malignancies, little is known about its expression in cancer tissues. Here, we have carefully validated a protein detection assay and interrogated the expression, tissue distribution and role of VISTA in a sizable number of human lung carcinomas from 4 independent populations. Our data demonstrate that VISTA is expressed in the vast majority of human NSCLCs with specific geographical/spatial patterns and positively associated with tumor immune infiltration and PD-1/PD-L1 expression. The levels of VISTA are not associated with specific NSCLC histological subtypes or patient clinical/demographical variables. However, compartment specific expression of VISTA in stromal or tumor epithelial cells is associated with oncogenic EGFR mutations and with the nonsynonymous mutational burden in lung adenocarcinomas; and with overall survival in 2 independent NSCLC cohorts. Taken together, these findings suggest an immune-modulatory effect of VISTA in human lung cancer.
Most studies addressing VISTA expression in tissues have used mRNA expression or flow cytometry of mechanically/enzymatically disaggregated samples, thus potentially altering the native cell conditions and precluding assessment of the spatial context. In mice, high expression of VISTA has been detected in hematopoietic cells, lung and small intestine, and very low levels of mRNA have been found in the heart, brain, muscle, kidney, testis, and placenta (14, 15). In humans, VISTA has also been reported to be mainly expressed in hematopoietic cells (14-19). In immune cells, highest level of VISTA expression is detected in monocytes and dendritic cells, intermediate levels on neutrophils, and very low levels on natural killer (NK) cells (16). VISTA expression was also detected with variable levels in both parenchymal and stromal/immune cells from morphologically normal human brain, thyroid, stomach, spleen, liver and in human peripheral blood mononuclear cells (PBMCs) (19). Notably, the levels of VISTA in PBMCs or isolated human monocytes were prominently upregulated by TLR3-, TLR5-ligand, IL-10 and IFN-γ (19). The latter indicates the inducible nature of VISTA under inflammatory conditions and supports the need for context-specific measurements.
To our knowledge, no studies reliably evaluating the expression and location of VISTA protein in human tumors have been reported. For instance, previous reports failed to demonstrate VISTA expression in colon and lung cancer samples using a non-commercial monoclonal antibody (clone GG8) after seeing limited sensitivity and affinity of the assay for use in immunohistochemistry studies (16, 20). In our work and using a validated commercially available assay that is suitable for FFPE tissue samples, we found expression of VISTA in >99% of lung cancer samples from over 700 cases studied. Notably, we found distinct expression patterns with most cases showing stromal-only staining and nearly 20% showing staining in stromal and epithelial tumor cells. The expression in tumor cells was predominantly focal and spatially connected with immune infiltration and PD-1/PD-L1 expression, suggesting that locally secreted factors such as interleukins or interferons could mediate VISTA upregulation. In support of this notion, VISTA expression has been shown to be directly and synergistically induced by IL-10 and IFN-γ (19). Additional studies will be required to determine the effect of multiple cytokines/chemokines (alone or in combination) in VISTA expression on tumor and immune cells. To date, only few studies have directly assessed the role of VISTA protein in tumor cells. One study described that VISTA overexpression in a murine fibro-sarcoma model promotes tumor growth and the effect was T-cell dependent (15). However, the biological (e.g. immune) determinants of this finding and the ligand/receptor function of VISTA in tumor cells remain unclear.
In human lung cancer, VISTA protein was found in different TIL populations and in tumor associated macrophages. Moreover, higher levels of VISTA were seen in effector CD8+ T-cells than in CD4-helper TILs and expression of VISTA in the whole sample or in immune cells was in general associated with increased tumor immune infiltration by CD8+, CD20+ and CD68+ cells, but not by CD4+ helper T-lymphocytes. The latter suggest that VISTA expression in the tumor immune microenvironment could be related with anti-tumor immune pressure. We also observed limited association between the tumor mutational burden and VISTA levels in lung carcinomas. The determinants for this are currently under investigaction.
Several preclinical mouse models have reported that VISTA upregulation in stromal cells can act as an immune evasion mechanism. For instance, VISTA expression is higher on immature dendritic cells, Myeloid-derived suppressor cells (MDSCs) and Tregs than in peripheral tissues (18). Due to prominent limitations in the current understanding and validation of markers to characterize specific myeloid cell subsets in human specimens, our study did not include major immune suppressive cell types such as alternatively polarized macrophages (e.g. M2-type macrophages) and MDSCs. Studies are underway to determine the optimal strategy to accurately interrogate such populations.
After major clinical success of blocking the PD-1 axis using monoclonal antibodies, the current landscape of anti-cancer immunotherapies includes numerous combinations of immune and non-immune agents. Therefore, identification of independent or redundant immune evasion pathways could be used to support optimal treatment modalities and rational design of clinical trials. Previous work using VISTA and PD-1 knockout mice demonstrated that the immune-regulatory pathways for PD-1 and VISTA are functionally non-redundant in antigen-specific responses and during autoimmune inflammatory conditions (21). However, little is known about the association between VISTA and PD-1 pathways in human malignancies. In our study, we found a consistent and prominent association between the levels of VISTA protein, PD-1 and PD-L1 in NSCLC cohorts represented in TMA format and also measuring mRNA transcripts in whole tissue lung cancer specimens from TCGA. The latter indicates the robustness of the association and excludes a possible impact/bias of measuring the targets in relatively small TMA histospots. Although we noted distinct cellular co-expression patterns of VISTA, PD-1 and PD-L1 in the human tumors (Figures 3A-B), our results demonstrate frequent regional co-localization of the markers in lung cancer and suggest a synergetic/cooperative immune evasion effect. The previously reported induction of VISTA and PD-L1 by pro-inflammatory cytokines such as IFN-γ could mechanistically support the markers co-expression and the positive association with TILs. Therefore, simultaneous blockade of both VISTA and PD-1 pathway could represent an effective anti-tumor strategy in human NSCLC. The results from ongoing and future human clinical trials using anti-VISTA monotherapy or combination therapies will be required to support this observation.
Conflicting results about the anti-tumor effect of dual VISTA/PD-1 axis blockade have been reported using two different monoclonal VISTA antibodies in preclinical models (21, 22). A synergistic effect of the combination of a monoclonal therapy against VISTA and PD-L1 was described in a colon cancer mouse model, showing a reduction in the tumor growth and an increased overall survival in comparison to monotherapy regimens (21). However, and despite seeing increased CD8 T-cell function, no effect on tumor growth was detected after treatment with the combination of anti-VISTA/PD-1 treatment in an oral squamous cell carcinoma model (22). In support of our findings in human tumors, a recent study showed a positive association between VISTA and PD-L1 protein levels; and a cooperative effect of VISTA and CD8+ cells to predict survival in a retrospective cohort of human oral squamous carcinomas (31). Taken together, these data suggest that VISTA/PD-1H pathway may contribute to the adaptive resistance mechanisms operating in tumor microenvironment.
Increased VISTA expression could also participate in acquired resistance to immune checkpoint blockade. In this regard, VISTA upregulation after CTLA-4 blockade with ipilimumab was recently reported in prostate carcinomas (32). In this study, VISTA was upregulated in tumor infiltrating immune cells, particularly in CD68+ tumor associated macrophages. The possible role of VISTA in mediating resistance to immune checkpoint blockers in human lung carcinomas is currently under investigation.
Supplementary Material
Significance statement.
VISTA/PD-1H participate in immune regulation and clinical studies are underway to assess the anti-tumor effect of VISTA blockade. However, the biological impact of VISTA expression in human malignancies remains largely unexplored. Our results demonstrate that VISTA is frequently expressed in human NSCLCs and shows differential distribution in tumor and immune cells. Elevated VISTA in NSCLC is associated with increased PD-1 axis markers, effector T-cells and CD68+ macrophages, supporting its modulation by local pro-inflammatory responses. VISTA protein levels are associated with specific genomic alterations in lung adenocarcinomas and its expression in tumor cells predicts longer survival in NSCLC patients. Taken together, our findings support the immuno-modulatory role of VISTA in human NSCLC and suggests its potential as therapeutic target.
Acknowledgments
Thanks to Lori Charette and Yale Pathology Tissue Services for the technical support.
Financial support:
Lung Cancer Research Foundation (LCRF), Yale SPORE in Lung Cancer (P50CA196530), Department of Defense-Lung Cancer Research Program Career Development Award (LC150383), Stand Up to Cancer – American Cancer Society Lung Cancer Dream Team Translational Research Grant (Grant Number: SU2C-AACR-DT17-15). Stand Up To Cancer is a program of the Entertainment Industry Foundation. Research grants are administered by the American Association for Cancer Research, the scientific partner of SU2C, sponsored research support by Navigate Biopharma and Yale Cancer Center Support Grant (P30CA016359).
Footnotes
Conflicts of interest and disclosure statement: Authors declare no conflict of interest.
Author contributions:
F.V-E. and K.A.S. designed research, analyzed data and wrote the manuscript; F.V-E. performed research; F.V-E., X.Y., I.D., N.M., M.S., L.C. K.S., M.T. V.V., H.Z., R.H. contributed new reagents/data analyses & interpretation.
References
- 1.Sznol M, Chen L. Antagonist antibodies to PD-1 and B7-H1 (PD-L1) in the treatment of advanced human cancer–response. Clin Cancer Res. 2013;19(19):5542. doi: 10.1158/1078-0432.CCR-13-2234. [DOI] [PMC free article] [PubMed] [Google Scholar]
- 2.Tumeh PC, Harview CL, Yearley JH, Shintaku IP, Taylor EJ, Robert L, et al. PD-1 blockade induces responses by inhibiting adaptive immune resistance. Nature. 2014;515(7528):568–571. doi: 10.1038/nature13954. [DOI] [PMC free article] [PubMed] [Google Scholar]
- 3.Butte MJ, Keir ME, Phamduy TB, Sharpe AH, Freeman GJ, et al. Programmed death-1 ligand 1 interacts specifically with the B7-1 costimulatory molecule to inhibit T cell responses. Immunity. 2007;27(1):111–122. doi: 10.1016/j.immuni.2007.05.016. [DOI] [PMC free article] [PubMed] [Google Scholar]
- 4.Garon EB, Rizvi NA, Hui R, Leighl N, Balmanoukian AS, Eder JP, et al. Pembrolizumab for the treatment of non-small-cell lung cancer. N Engl J Med. 2015;372(21):2018–2028. doi: 10.1056/NEJMoa1501824. [DOI] [PubMed] [Google Scholar]
- 5.Herbst RS, Baas P, Kim DW, Felip E, Pérez-Gracia JL, Han JY, et al. Pembrolizumab versus docetaxel for previously treated, PD-L1-positive, advanced non-small-cell lung cancer (KEYNOTE-010): a randomised controlled trial. Lancet. 2016;387(10027):1540–1550. doi: 10.1016/S0140-6736(15)01281-7. [DOI] [PubMed] [Google Scholar]
- 6.Larkin J, Lao CD, Urba WJ, McDermott DF, Horak C, Jiang J, Wolchok JD. Efficacy and safety of nivolumab in patients with BRAF V600 mutant and BRAF wild-type advanced melanoma: a pooled analysis of 4 clinical trials. JAMA Oncol. 2015;1(4):433–440. doi: 10.1001/jamaoncol.2015.1184. [DOI] [PubMed] [Google Scholar]
- 7.Larkin J, Chiarion-Sileni V, Gonzalez R, Grob JJ, Cowey CL, Lao CD, et al. Combined Nivolumab and Ipilimumab or Monotherapy in Untreated Melanoma. N Engl J Med. 2015;373(1):23–34. doi: 10.1056/NEJMoa1504030. [DOI] [PMC free article] [PubMed] [Google Scholar]
- 8.Lavin Y, Kobayashi S, Leader A, Amir ED, Elefant N, Bigenwald C, et al. Innate Immune Landscape in Early Lung Adenocarcinoma by Paired Single-Cell Analyses. Cell. 2017;169(4):750–765.e17. doi: 10.1016/j.cell.2017.04.014. [DOI] [PMC free article] [PubMed] [Google Scholar]
- 9.Hirsh V. New developments in the treatment of advanced squamous cell lung cancer: focus on afatinib. Onco Targets Ther. 2017;10:2513–2526. doi: 10.2147/OTT.S104177. [DOI] [PMC free article] [PubMed] [Google Scholar]
- 10.Dong H, Zhu G, Tamada K, Chen L. B7-H1, a third member of the B7 family, costimulates T cell proliferation and interleukin-10 secretion. Nat Med. 1999;5:1365–1369. doi: 10.1038/70932. [DOI] [PubMed] [Google Scholar]
- 11.Freeman GJ, Long AJ, Iwai Y, Bourque K, Chernova T, Nishimura H, et al. Engagement of the PD-1 immunoinhibitory receptor by a novel B7 family member leads to negative regulation of lymphocyte activation. J Exp Med. 2000;192(7):1027–1034. doi: 10.1084/jem.192.7.1027. [DOI] [PMC free article] [PubMed] [Google Scholar]
- 12.Azuma T, Yao S, Zhu G, Flies AS, Flies SJ, Chen L. B7-H1 is a ubiquitous antiapoptotic receptor on cancer cells. Blood. 2008;111(7):3635–3643. doi: 10.1182/blood-2007-11-123141. [DOI] [PMC free article] [PubMed] [Google Scholar]
- 13.Zou W, Chen L. Inhibitory B7-family molecules in the tumour microenvironment. Nat Rev Immunol. 2008;8(6):467–477. doi: 10.1038/nri2326. [DOI] [PubMed] [Google Scholar]
- 14.Flies DB, Wang S, Xu H, Chen L. Cutting edge: A monoclonal antibody specific for the programmed death-1 homolog prevents graft-versus-host disease in mouse models. J Immunol. 2011;187(4):1537–1541. doi: 10.4049/jimmunol.1100660. [DOI] [PMC free article] [PubMed] [Google Scholar]
- 15.Wang L, Rubinstein R, Lines JL, Wasiuk A, Ahonen C, Guo Y, et al. VISTA, a novel mouse Ig superfamily ligand that negatively regulates T cell responses. J Exp Med. 2011;208(3):577–592. doi: 10.1084/jem.20100619. [DOI] [PMC free article] [PubMed] [Google Scholar]
- 16.Lines JL, Pantazi E, Mak J, Sempere LF, Wang L, O’Connell S, et al. VISTA is an immune checkpoint molecule for human T cells. Cancer Res. 2014;74(7):1924–1932. doi: 10.1158/0008-5472.CAN-13-1504. [DOI] [PMC free article] [PubMed] [Google Scholar]
- 17.Flies DB, Han X, Higuchi T, Zheng L, Sun J, Ye JJ, Chen L. Coinhibitory receptor PD-1H preferentially suppresses CD4⁺ T cell-mediated immunity. J Clin Invest. 2014;124(5):1966–1975. doi: 10.1172/JCI74589. [DOI] [PMC free article] [PubMed] [Google Scholar]
- 18.Le Mercier I, Chen W, Lines JL, Day M, Li J, Sergent P, Noelle RJ, Wang L. VISTA Regulates the Development of Protective Antitumor Immunity. Cancer Res. 2014;74(7):1933–1944. doi: 10.1158/0008-5472.CAN-13-1506. [DOI] [PMC free article] [PubMed] [Google Scholar]
- 19.Bharaj P, Chahar HS, Alozie OK, Rodarte L, Bansal A, Goepfert PA, et al. Characterization of programmed death-1 homologue-1 (PD-1H) expression and function in normal and HIV infected individuals. PLoS One. 2014;9(10):e109103. doi: 10.1371/journal.pone.0109103. [DOI] [PMC free article] [PubMed] [Google Scholar]
- 20.Lines JL, Sempere LF, Broughton T, Wang L, Noelle R. VISTA is a novel broad-spectrum negative checkpoint regulator for cancer immunotherapy. Cancer Immunol Res. 2014;2(6):510–517. doi: 10.1158/2326-6066.CIR-14-0072. [DOI] [PMC free article] [PubMed] [Google Scholar]
- 21.Liu J, Yuan Y, Chen W, Putra J, Suriawinata AA, Schenk AD, et al. Immune-checkpoint proteins VISTA and PD-1 nonredundantly regulate murine T-cell responses. Proc Natl Acad Sci U S A. 2015;112(21):6682–6687. doi: 10.1073/pnas.1420370112. [DOI] [PMC free article] [PubMed] [Google Scholar]
- 22.Kondo Y, Ohno T, Nishii N, Harada K, Yagita H, Azuma M. Differential contribution of three immune checkpoint (VISTA, CTLA-4, PD-1) pathways to antitumor responses against squamous cell carcinoma. Oral Oncol. 2016;57:54–60. doi: 10.1016/j.oraloncology.2016.04.005. [DOI] [PubMed] [Google Scholar]
- 23.Velcheti V, Schalper KA, Carvajal DE, Anagnostou VK, Syrigos KN, Sznol M, et al. Programmed death ligand-1 expression in non-small cell lung cancer. Lab Invest. 2014;94(1):107–116. doi: 10.1038/labinvest.2013.130. [DOI] [PMC free article] [PubMed] [Google Scholar]
- 24.Anagnostou VK, Syrigos KN, Bepler G, Homer RJ, Rimm DL. Thyroid transcription factor 1 is an independent prognostic factor for patients with stage I lung adenocarcinoma. J Clin Oncol. 2009;27(2):271–8. doi: 10.1200/JCO.2008.17.0043. [DOI] [PubMed] [Google Scholar]
- 25.Schalper KA, Brown J, Carvajal-Hausdorf D, McLaughlin J, Velcheti V, Syrigos KN, et al. Objective measurement and clinical significance of TILs in non-small cell lung cancer. J Natl Cancer Inst. 2015;107(3) doi: 10.1093/jnci/dju435. pii: dju435. [DOI] [PMC free article] [PubMed] [Google Scholar]
- 26.Carvajal-Hausdorf DE, Schalper KA, Neumeister VM, Rimm DL. Quantitative measurement of cancer tissue biomarkers in the lab and in the clinic. Lab Invest. 2015;95(4):385–96. doi: 10.1038/labinvest.2014.157. [DOI] [PMC free article] [PubMed] [Google Scholar]
- 27.Schalper KA, Carvajal-Hausdorf D, McLaughlin J, Altan M, Velcheti V, Gaule P, et al. Differential Expression and Significance of PD-L1, IDO-1, and B7-H4 in Human Lung Cancer. Clin Cancer Res. 2017;23(2):370–378. doi: 10.1158/1078-0432.CCR-16-0150. [DOI] [PMC free article] [PubMed] [Google Scholar]
- 28.Mani NL, Schalper KA, Hatzis C, Saglam O, Tavassoli F, Butler M, et al. Quantitative assessment of the spatial heterogeneity of tumor-infiltrating lymphocytes in breast cancer. Breast Cancer Res. 2016;18(1):78–84. doi: 10.1186/s13058-016-0737-x. [DOI] [PMC free article] [PubMed] [Google Scholar]
- 29.Gaule P, Smithy JW, Toki M, Rehman J, Patell-Socha F, Cougot D, et al. A Quantitative Comparison of Antibodies to Programmed Cell Death 1 Ligand 1. JAMA Oncol. 2017;3(2):256–259. doi: 10.1001/jamaoncol.2016.3015. [DOI] [PMC free article] [PubMed] [Google Scholar]
- 30.Bordeaux J, Welsh A, Agarwal S, Killiam E, Baquero M, Hanna J, et al. Antibody validation. Biotechniques. 2010;48(3):197–209. doi: 10.2144/000113382. [DOI] [PMC free article] [PubMed] [Google Scholar]
- 31.Wu L, Deng WW, Huang CF, Bu LL, Yu GT, Mao L, et al. Expression of VISTA correlated with immunosuppression and synergized with CD8 to predict survival in human oral squamous cell carcinoma. Cancer Immunol Immunother. 2017;66(5):627–636. doi: 10.1007/s00262-017-1968-0. [DOI] [PMC free article] [PubMed] [Google Scholar]
- 32.Gao J, Ward JF, Pettaway CA, Shi LZ, Subudhi SK, Vence LM, et al. VISTA is an inhibitory immune checkpoint that is increased after ipilimumab therapy in patients with prostate cancer. Nat Med. 2017;23(5):551–555. doi: 10.1038/nm.4308. [DOI] [PMC free article] [PubMed] [Google Scholar]
Associated Data
This section collects any data citations, data availability statements, or supplementary materials included in this article.