

SUMMARY
There is significant need to develop physiologically relevant models for investigating human astrocytes in health and disease. Here, we present an approach for generating astrocyte lineage cells in a three-dimensional (3D) cytoarchitecture using human cerebral cortical spheroids (hCS) derived from pluripotent stem cells. We acutely purified astrocyte-lineage cells from hCS at varying stages up to 20 months in vitro using immunopanning and cell sorting, and performed high-depth bulk and single cell RNA-sequencing to directly compare them to purified primary human brain cells. We found that hCS-derived glia closely resemble primary human fetal astrocytes and that, over time in vitro, they transition from a predominantly fetal to an increasingly mature astrocyte state. Transcriptional changes in astrocytes are accompanied by alterations in phagocytic capacity and effects on neuronal calcium signaling. These findings suggest that hCS-derived astrocytes closely resemble primary human astrocytes and can be used for studying development and modeling disease.
INTRODUCTION
Astrocytes comprise the most numerous cell type in the mammalian brain, yet we understand remarkably little about their development and physiological functions. Their juxtaposition to neuronal synapses explains many of their passive roles in the central nervous system (CNS), such as neurotransmitter recycling. Recent evidence, however, suggests that astrocytes also play active roles (Freeman and Rowitch, 2013), including the control of synapse formation (Allen et al., 2012; Christopherson et al., 2005), function (Eroglu et al., 2009; Tsai et al., 2012) and elimination (Chung et al., 2013). Because of technical limitations, human astrocytes have received particularly little study. Recently (Zhang et al., 2016) reported that human astrocytes exist in at least two distinct stages: a fetal, proliferative, astrocyte progenitor cell (APC) state and an adult, non-proliferative, mature state. Several thousand genes are differentially expressed between fetal and adult human astrocytes (Zhang, Sloan et al, 2016), and many of these genes have been implicated in functional processes such as synapse formation (SPARCL1). Interestingly, in humans, the majority of mature astrocyte markers increase in expression during a time window extending throughout gestation until early postnatal development, which correlates with synapse density in the human cerebral cortex (Huttenlocher, 1979; Huttenlocher et al., 1982) and is thought to be critical for neuropsychiatric disease development. Therefore, understanding the program underlying human astrocyte maturation and the ability to recapitulate these complex processes in human cellular models is a pre-requisite for better understanding astrocyte development and function as well as the role of glia in brain disorders.
Unfortunately, investigating human astrocyte maturation within primary brain tissue is challenging; sample availability is sparse, particularly for critical developmental time periods such as late gestation or early postnatal stages. Human induced pluripotent stem cells (iPSCs) provide a unique platform to investigate neural development in vitro (Dolmetsch and Geschwind, 2011; Pașca et al., 2014; Tabar and Studer, 2014) and to elucidate mechanisms of astrocyte development and dysfunction. To date, several groups have developed methods for generating astrocytes from iPSC in two-dimensional (2D)/monolayer cultures (Emdad et al., 2012; Juopperi et al., 2012; Krencik and Ullian, 2013; Krencik and Zhang, 2011; Roybon et al., 2013; Shaltouki et al., 2013), but these methods have limitations, especially in maintaining long-term cultures and non-reactive states in vitro.
To address these issues, we used a 3D differentiation approach for generating a cerebral cortex–like structure that we previously developed (Pasca et al., 2015), and leveraged the unique ability of these cultures to be maintained for long-term in vitro (20 months and beyond) to study their transcriptional and functional maturation. In these floating 3D neural cultures, named human cortical spheroids (hCS), astrocyte-lineage cells are generated spontaneously among a network of cortical neurons. The hCS grow up to ~4 mm in diameter and recapitulate key features of in vivo cortical development (Paşca et al., 2015), such as the presence of cortical lamination, abundant synaptogenesis, and robust spontaneous electrical activity. We repurposed strategies for isolating primary human neural and glial cells using immunopanning (Zhang et al., 2016) to purify astrocyte-lineage cells directly from hCS, and compared the transcriptional profile of these cells to primary astrocytes isolated from the fetal and adult CNS. We maintained hCS in long-term cultures up to 590 days in vitro and performed a time-series of single cell RNA-seq profiling that allowed us to capture the dynamics of astrocyte differentiation in vitro over a long time-window. This enabled us to ask whether astrocyte-lineage cells within hCS mature over time and whether this process is associated with cell autonomous (synapse phagocytosis) and non-cell autonomous (calcium signals in neurons) effects.
RESULTS
Generation and purification of astrocyte-lineage cells from iPSC-derived hCS
To generate human astrocytes from human pluripotent stem cells in 3D cultures, we derived hCS using a previously established approach (Pasca et al., 2015). hCS are specified and maintained in floating conditions on low-attachment plates, grow up to ~4 mm in diameter, and can either be cryosectioned for immunostaining or dissociated into single cell suspensions for 2D culture, fluorescent-activated cell sorting (FACS) and other downstream analyses (Figure 1A). As previously described (Birey et al., 2017; Deverman et al., 2016; Pasca et al., 2015; Pasca, 2016), immunostainings on hCS cryosections for glial fibrillary acidic protein (GFAP) revealed abundant astrocyte-like cells that were distributed throughout the parenchyma, and 2D culture of dissociated hCS showed GFAP–expressing cells with characteristic morphological features of astrocytes (Figure 1B, C). We refer to these GFAP-expressing cells as astrocyte lineage cells, an umbrella term that encompasses multiple stages of astrocyte differentiation, which may include radial glia (RG), outer radial glia (oRG), astrocyte progenitor cells (APCs), and mature astrocytes.
FIGURE 1. Purification of Astrocytes from hCS.
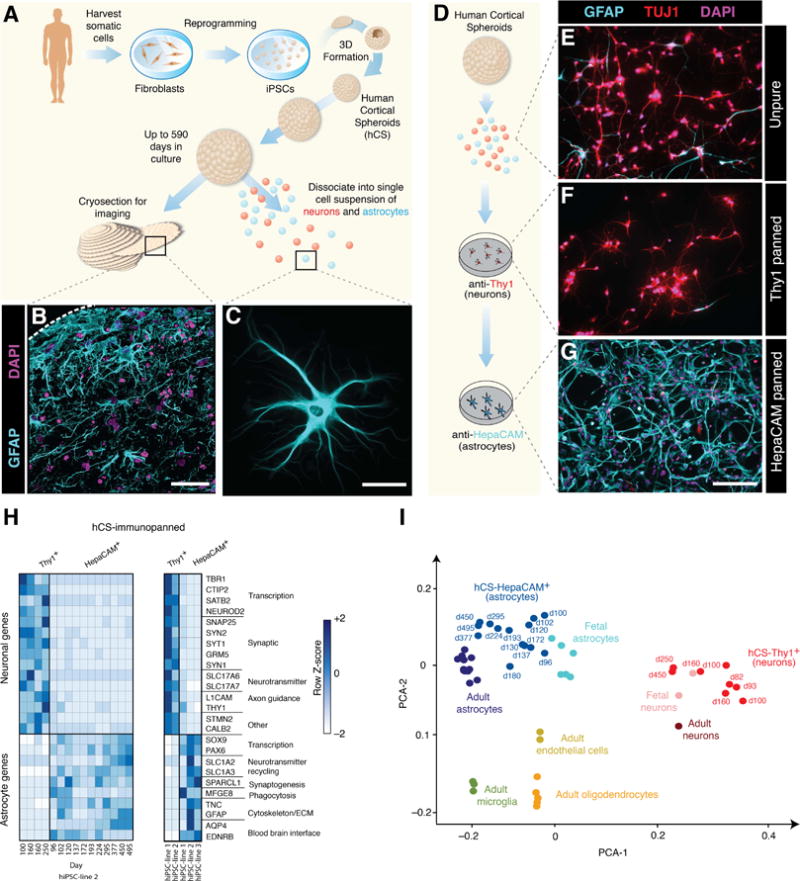
(A) Schematic for generating hCS from iPSCs. Individual colonies are enzymatically dissociated and suspended in low-attachment plates to form neural spheroids.
(B) GFAP immunostaining of astrocytes in a 10 μm hCS cryosection at 363 days in culture. Scale bar = 50 μm.
(C) GFAP staining of an astrocyte isolated from a hCS at 295 day and cultured for 3 days in monolayer. Scale bar = 30 μm.
(D) hCS can be immunopanned after single cell dissociation to isolate neurons with an anti–Thy1 antibody and astrocytes with an anti–HepaCAM antibody.
Representative images are shown for cultured samples of (E) unpurified cells, (F) Thy-1 panned neurons, and (G) HepaCAM panned astrocytes. Cells are immunostained with an anti–TUJ1 antibody (red) for neurons and anti–GFAP antibody (cyan) for astrocytes. Scale bar = 150 μm.
(H) RNA-seq expression data showing enrichment of neuronal and astrocyte-specific genes in bulk Thy1– and HepaCAM– immunopanned samples. (Left) Variability in immunopanned samples from a single iPSC line across multiple differentiations (HepaCAM: 3–15 hCS per time-point from one iPSC line in 11 differentiation experiments; Thy1: 3–15 hCS per time-point from one iPSC line from 4 differentiations experiments). (Right) Variability in immunopanned samples across multiple iPSC lines (HepaCAM: 3–15 hCS per time-point from 3 iPSC lines in 1–11 differentiations per line; Thy1: 3–15 hCS per time-point from 2 iPSC lines in 4 differentiations per line).
(I) PCA using the top 2 principal components and showing bulk RNA-seq of primary human fetal and adult CNS cell type samples along with hCS-derived neurons and astrocytes. The top 5000 over-dispersed genes were used for analysis. hCS-derived cells are labeled by in vitro differentiation stage (d, day); 3–15 hCS were collected from 2 iPSC lines across 18 differentiation experiments.
To purify astrocyte lineage cells from hCS, we adapted our existing protocols for immunopanning primary human fetal and adult brain tissue (Zhang et al., 2016). Immunopanning involves passing a single-cell suspension of dissociated tissue over a series of cell-culture plates coated with antibodies directed against cell-type specific antigens. As few as one hCS can be used for immunopanning, with a yield prior to immunopanning of about 500,000–1,000,000 live cells per hCS. Our immunopanning protocol consisted of an anti–Thy-1 cell surface antigen (Thy1 or CD90) antibody to bind neurons, and an anti–hepatic and glial cell adhesion molecule (HepaCAM) antibody to bind astrocytes (Figure 1D). The advantage of using the cell-adhesion glycoprotein HepaCAM for immunopanning is that the HEPACAM gene is enriched in astrocytes but it is not as highly expressed by radial glia (Zhang et al., 2016). hCS contain only neural ectoderm derivatives, and therefore do not require depletion of myeloid or vascular populations during the purification protocol as compared to primary brain tissue samples. After binding to antibody-coated plates, the cells of interest were either collected via trypsinization for subsequent culture in 2D or directly scraped off the plate to extract RNA for transcriptional profiling.
To verify the purity of the immunopanning process in hCS, we cultured immunopanned hCS-derived neurons and astrocyte lineage cells in monolayer for 7 days, and immunostained with antibodies against β-Tubulin class-III (TUBB3 or TUJ1) to identify neurons, and with anti–GFAP to identify glial cells (Figure 1E–G). Whereas unpurified cultures of dissociated hCS contained both GFAP and TUJ1 expressing cells, the immunopanned populations were enriched for either neurons (Thy1–panned) or astrocyte lineage cells (HepaCAM–panned), respectively. In line with our previous findings (Pasca et al., 2015), immunopanning of hCS with the anti–Thy1 antibody isolated numerous neurons as early as 40 days of differentiation in vitro, whereas HepaCAM immunopanning became increasingly efficient after 100 days of differentiation in vitro. This is suggestive of in vivo cell lineage progression in the human dorsal pallium, as well as the delayed onset of astrocyte generation, which typically begins only after the substantive portion of neurogenesis is complete (Freeman and Rowitch, 2013; Sloan and Barres, 2014).
RNA-seq transcriptional profiling of hCS-derived astrocyte lineage cells and comparison to primary human cells
Because GFAP is present in both astrocytes and radial glia in the developing mammalian brain and is often undetected in some mature astrocytes (Middeldorp et al., 2010; Oberheim et al., 2009), we used RNA-seq to verify the level of expression of a series of well-established neuronal and astrocyte markers (Cahoy et al., 2008; Lovatt et al., 2007; Zhang et al., 2016) in HepaCAM-isolated cells as compared to neurons isolated from hCS. For example, we found high expression of the water transporter Aquaporin–4 (AQP4), the transcription factor SOX9 and the glial high-affinity glutamate transporter (SLC1A3) in hCS-derived astrocyte lineage cells, but not in hCS-derived neurons, which instead showed high expression of neuronal markers such as TBR1, SYN1 or L1CAM (Figure 1H). These findings were consistent across hCS derived from multiple iPSC lines at various time-points and in independent differentiation experiments, as indicated by previous work with this differentiation platform (Pasca et al., 2015).
We next wanted to investigate the transcriptome level fidelity of hCS-derived cells to primary human astrocytes and neurons. We leveraged our primary human RNA-seq transcriptome datasets (Zhang et al., 2016), which include bulk samples of purified forebrain fetal astrocytes, postnatal astrocytes, fetal neurons, postnatal neurons, oligodendrocytes, endothelial cells, and microglia/macrophages, and directly compared these to our hCS-derived samples across multiple in vitro differentiation stages (from day 100 to day 450). hCS can be maintained in floating conditions in ultra-low attachment plates for long periods of time (beyond 25 months in our experience); even after hundreds of days in vitro, hCS were intact, retained a spherical morphology (Supplementary Figure 1A) and displayed high cell viability (>90%) after dissociation (Supplementary Figure 1B, C). As expected, the relative proportions of glia and neurons within hCS varied with in vitro differentiation stage and GFAP+ cells were found increasingly dispersed throughout the neuropil (Supplementary Figure 1D–F and (Pasca et al., 2015)). Principal component analysis (PCA) of immunopanned bulk samples showed hCS-derived HepaCAM+ cells clustering closely to fetal and mature human primary astrocytes and hCS-derived Thy1+ cells clustering closely to fetal and adult human neuronal samples. As expected, the remaining primary human CNS cell type samples (oligodendrocytes, endothelial cells, microglia) clustered distinctly from hCS-derived astrocyte and neuronal samples (Figure 1I, Supplementary Figure 1G). This division could be further appreciated from the degree of correlation between hCS-derived and fetal astrocytes (R2 = 0.83, Pearson correlation, P< 0.0001) versus the correlation between hCS-derived astrocytes and other human CNS cell types (R2 = 0.61, Pearson correlation, P < 0.001) (Supplementary Figure 1H).
Astrocyte maturation within hCS
We next asked whether, over longer time periods in vitro, astrocytes within hCS might undergo a transition from a fetal to a more mature state. To assess astrocyte maturation in hCS, we first established a time window of when the transition from fetal to mature astrocytes might occur in vivo. We utilized our existing datasets of human astrocytes (Zhang et al., 2016) to identify the top 100 fetal and top 100 mature astrocyte genes that demarcate these two maturation states and that were not expressed in other CNS cell types. We then asked how expression of these astrocyte-specific markers varied in transcriptomic datasets obtained from human brain tissue across numerous regions and developmental periods (Kang et al., 2011). This comparison revealed a consistent trend, in which the expression of the top 100 mature astrocyte markers started to increase as early as 50–100 days post-conception, accelerating around birth and continuing to increase throughout the first several months of the postnatal period. Similarly, fetal astrocyte markers declined rapidly over this same time period (Supplementary Figure 2). This suggests that the relevant signaling cues responsible for astrocyte maturation likely occur during this critical developmental window. Therefore, we leveraged the ability of hCS to be maintained for long periods in vitro and cultured hCS for up to 590 days (~20 months) to investigate whether we could capture this maturation process within our system (Figure 2A).
FIGURE 2. Maturation of hCS-derived Astrocyte Lineage Cells.

(A) Schematic predicting the time-course of astrogenesis and maturation in hCS.
(B) (Top) Phase images of dissociated astrocytes on the immunopanning plate at various ages (scale bar = 12 μm), and (Bottom) after immunostaining with an anti–GFAP antibody following 7 days in monolayer culture (scale bar = 50 μm).
(C) GFAP immunostain of a cryosection from a hCS at day 350 demonstrates branched morphology of astrocytes within the 3D cytoarchitecture. Scale bar = 10 μm.
(D) Quantification of the number of primary branches in GFAP+ cells following 7 days in monolayer culture. One-way ANOVA, F(5,143) = 15.68, P < 0.0001; n = 15–38 cells/time point).
(E) Heatmap indicating expression of the top 100 fetal and top 100 mature astrocyte-specific genes in primary fetal and astrocyte samples.
(F) Heatmap for the expression of these same 200 genes in hCS-derived astrocytes over in vitro culture from day 96 to day 495. The heatmaps are normalized across each gene (row). Cells at the extreme early and late timepoints express the highest levels of fetal and mature astrocyte genes, respectively, whereas the transitional timepoints (day 150–300) express more intermediate levels of these genes. Data derived from one iPSC line in 11 differentiation experiments (3–15 hCS per time-point).
(G) Spearman correlations between hCS-derived astrocytes of varying in vitro stages and primary fetal (magenta) or mature (green) astrocytes. Values represent Spearman rank correlations on the 200 genes between panels (F) and (G).
(H) FPKM values of selected mature (top row, green) and fetal (bottom row, purple) astrocyte genes in hCS-astrocytes purified at different in vitro stages. Boxed graphs highlight the decline in expression of proliferative markers as hCS-derived astrocytes mature.
(I) Representative images from the EdU proliferation assay. Astrocytes were purified from hCS and grown in monolayer culture with 10 μM EdU for 48 hours and then fixed at 7 days. Scale bar = 100 μm. Data derived from two iPSC lines in 7 differentiation experiments (3–15 hCS per time-point).
(J) Quantification of proliferation in culture. Percentages represent the number of EdU positive cells per total number of DAPI+ nuclei. One-way ANOVA, F(5,11) = 49.48, P < 0.0001; n = 3 wells/timepoint).
We purified HepaCAM+ cells from hCS at multiple time points ranging from day 100 to day 590. We observed that immediately after dissociation into single cells, the morphologies of older hCS-derived HepaCAM+ cells were more complex than those isolated at earlier time points (Figure 2B). This morphological complexity was maintained in monolayer culture, and purified cells displayed a significant increase in the number of primary branches with increasing in vitro age (Figure 2C, D; one-way ANOVA, F(5,143) = 15.68, P< 0.0001; n= 15–38 cells/time point).
To investigate whether the morphological changes were consistent with transcriptome-level evidence of maturation, we performed RNA-sequencing on hCS-purified astrocyte lineage cells at each of the above time-points. We then identified the top 100 most specifically enriched mature or fetal astrocyte genes from our primary datasets, and used this 200-gene barcode as a benchmark of astrocyte maturation. When we chronologically ordered all hCS-derived astrocyte samples from youngest to oldest we observed a clear trend in the expression pattern of these 200 signature genes: hCS-derived astrocyte lineage cells from day 100–150 were predominantly enriched in the fetal astrocyte cassette of genes, whereas astrocytes from older hCS, and particularly beyond day 250 in vitro, expressed higher levels of nearly all mature astrocyte genes (Figures 2E, F). To better quantify the degree of maturation, we calculated correlation values for hCS-derived astrocytes with either primary fetal or mature human astrocytes. The correlation coefficients with mature primary astrocytes increased steadily with in vitro age of hCS-astrocytes, while the degree of fetal astrocyte correlation declined over the same time-course (Figure 2G, Spearman correlations). We then looked at the expression of individual fetal and mature astrocytes genes over time and observed similar trends in the gradual increase and decrease of mature and fetal genes, respectively (Figure 2H). Based on these data, we hereon refer to astrocyte lineage cells isolated from hCS after 250 days of in vitro differentiation as mature hCS-derived astrocytes, as a respective comparison to those from earlier time points. Despite the close correlation between bulk hCS-derived HepaCAM+ cells and primary adult astrocyte samples, we did observe some degree of separation between these two populations. The genes that contribute to this separation, and the respective gene ontological pathways that are specific to primary adult astrocytes versus hCS-astrocytes after day 250 in vitro can be found in Supplementary Table 1.
The well-established proliferative markers TOP2A and MKI67 are highly enriched in fetal astrocytes and steadily decrease with maturation. Previous work has demonstrated that fetal human astrocytes are highly proliferative as compared to mature astrocytes (Zhang et al., 2016). To determine whether this functional difference was maintained across early and late hCS-derived astrocytes, we purified astrocytes from hCS at various in vitro stages. After purification, the cells were grown in monolayer culture with the nucleoside analog 5-ethynyl-2′-deoxyuridine (EdU) to quantify the degree of cell proliferation. After 7 days, the percent of nuclei labeled with DAPI that had undergone at least one cell division declined from 34.9% ± 3.4% in day 167 hCS to only 3.2% ± 2.6% in cells harvested from day 590 hCS (Figure 2I, J; one-way ANOVA, F(5,11) = 49.48, P< 0.0001, n= 3 wells per condition). Interestingly, we noticed a slight discrepancy between the expression of mitotic markers (MKI67, TOP2A), and the proliferation data that could be related to differences between RNA and protein levels, sensitivity of the two cell proliferation assessments or cell culture related effects.
Single cell RNA-seq of hCS
To obtain a greater resolution into cell type identity and to capture the diversity of hCS-derived glial cells as they transition from fetal progenitors to a more mature state, we performed single cell RNA-seq on individual cells from the same iPSC line and differentiation across 4 different time points (in vitro differentiation days 100, 130, 175, and 450). At each of these time points, we dissociated hCS into a single cell suspension and collected both unsorted cells, as well as sorted astrocyte-lineage cells using anti–HepaCAM antibodies conjugated to fluorescein isothiocyanate (FITC) (Figure 3A). In total, we extracted sufficient RNA for cDNA library construction on 710 individual cells across these differentiation stages. To minimize batch effects, single cells from multiple in vitro differentiation stages were collected in the same sorting experiment, library generation was performed on samples in tandem and cells from multiple time points were sequenced simultaneously.
FIGURE 3. Single Cell RNA-seq of iPSC-derived hCS.
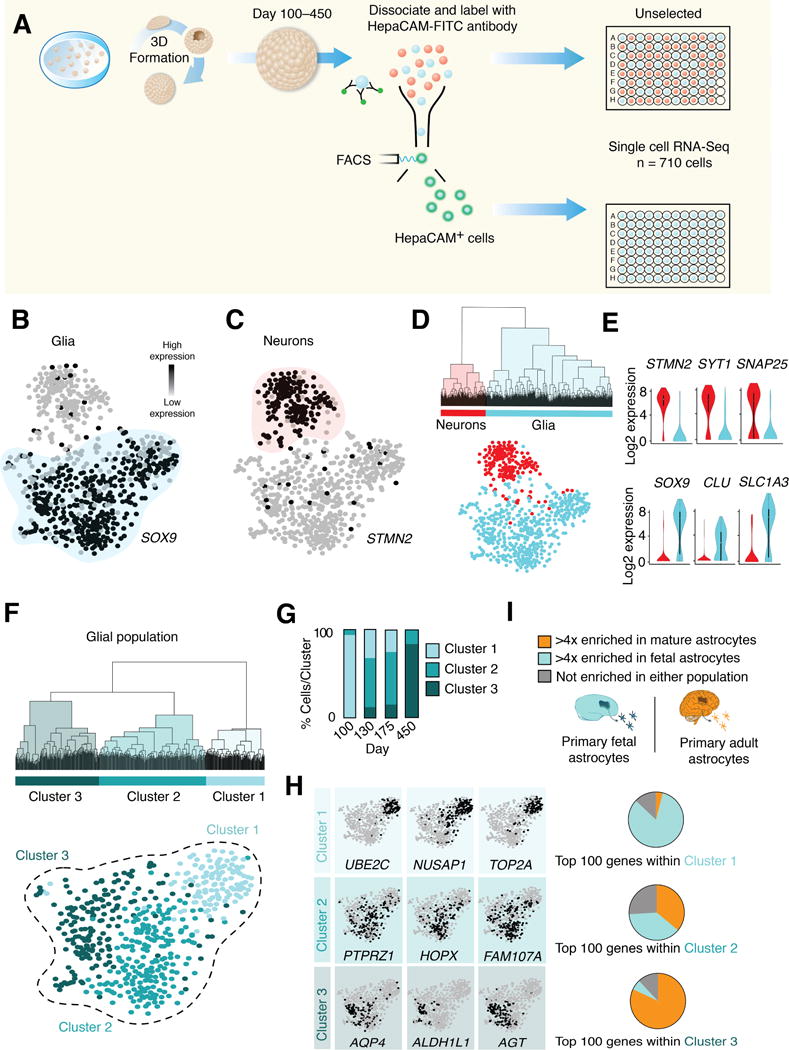
(A) hCS were dissociated at different in vitro stages and single cells were isolated by FACS into 96-well plates (n= 710 cells). Cells were either randomly selected without any immunolabeling or gated by the presence of FITC-conjugated HepaCAM antibodies. Single cells were derived from two iPSC lines from 5 differentiation experiments (3–7 hCS per time-point).
(B) Glial population (cyan) indicated by SOX9 gene expression in the t-SNE space of all hCS cells. Dark circles indicate high expression, grey circles indicate low expression.
(C) Neuronal population (red) indicated by STMN2 gene expression in the t-SNE space of all hCS cells.
(D) Unsupervised hierarchical clustering (top 1000 over-dispersed genes) showing separation of glial and neuronal populations.
(E) Violin plots demonstrating expression patterns of generic cell type-specific markers.
(F) Unsupervised hierarchical clustering of the glial population in (B, D) (top 1000 over-dispersed genes) revealing three Clusters (1–3). Glial population (from B, D) are colored by Cluster identity as shown in (E).
(G) Distribution of cells from each in vitro differentiation stage across Clusters 1–3.
(H) Expression of enriched genes within Clusters 1–3.
(I) The proportion of the top 100 genes in Clusters 1–3 that were enriched in adult astrocytes (orange, > 4–fold expression increase in primary mature versus primary fetal astrocytes), fetal astrocytes (cyan, > 4–fold expression increase in primary fetal versus mature primary astrocytes), or indeterminate (grey).
To cluster hCS-derived cells, we first identified over-dispersed genes to calculate a distance matrix for all cells, and then used t-distributed stochastic neighbor embedding (t-SNE) dimensionality reduction to condense the data into a 2D space (van der Maaten and Hinton, 2008) (Supplementary Information). The t-SNE plot minimizes the distance between cells with similar transcriptomic profiles in an arbitrary 2D space while maximizing the overall distance between populations. We observed two predominant clusters of cells within hCS: one glial that specifically expressed the astrocyte-related marker SOX9 and one neuronal that included cells expressing the neuronal marker STMN2 (Figure 3B, C). To take an unbiased approach towards classifying cells, we performed unsupervised hierarchical clustering, which separated the neuronal and glial populations along the same spatial segregation observed using t-SNE (Figure 3D, E). As expected, the number of HepaCAM-isolated cells was greatly enriched in the glial population (95%), whereas the neuronal population was largely derived from unselected cells (Supplementary Figure 3A, B). Moreover, HepaCAM+ contained a small proportion of ventral RG-like cells (vRGs) as assessed by single cells profiling and immunocytochemistry (Supplementary Figure 3C, D). Within the STMN2+ population we observed neurons expressing deep cortical layer markers (TBR1, ETV1), as well as neurons expressing upper layer markers (SATB2, TLE1). As expected, these upper layer markers were primarily derived from hCS at later stages of in vitro differentiation (Supplementary Figure 3E and (Pasca et al., 2015)).
To further investigate astrocyte-lineage cells, we performed unsupervised hierarchical clustering on the glial cell group. This analysis indicated three primary clusters of cells (Figure 3F), which correlated with in vitro differentiation stage (Supplementary Figure 3F). For example, of the 40 glial cells derived from day 100 hCS, 39 were assigned to Cluster 1, whereas 41 out of 50 cells isolated from hCS at day 450 were located in Cluster 3 (Figure 3G). Cluster 1 contains cells expressing proliferation-related genes, such as TOP2A, NUSAP1, and UBE2C, while Cluster 2 and Cluster 3 includes genes associated with progenitor cells (HOPX, PTPRZ1, FAM107A) or mature astrocytes (ALDH1L1, AQP4, AGT), respectively (the top enriched genes per cluster can be found in Supplementary Table 2). The set of genes that define glial Cluster 2 suggested overlap with the recently reported transcriptomic signature of human oRGs (Pollen et al., 2015). Therefore, we wondered whether Cluster 2 cells might represent a glial lineage of oRGs within hCS. Therefore, we directly compared our single cell RNA-seq data from hCS-derived glia to single cell data from fetal human brain tissue that was micro-dissected from the ventricular or subventricular zones around gestational weeks 16–18 (GW16–18) (Pollen et al., 2015). To control for potential batch effects between these datasets, FPKMs for each cell were normalized via centering and scaling and ERCC spike-in controls were used in all samples. t-SNE analysis separated clusters by cell type rather than by experimental origin (Supplementary Figure 4A–C). Subsequent unsupervised hierarchical clustering of hCS-derived glia and primary fetal ventricular/subventricular zone derived glia produced three distinct clusters (Supplementary Figure 4D–E), which varied in their expression of maturation genes in a pattern similar to what was shown in Figure 3H (Supplementary Figure 4F). We found that the ventricular zone-dissected primary cells (Pollen et al., 2015) were located almost exclusively within the most immature of these clusters (Cluster 1), while subventricular zone-dissected primary cells containing primary oRGs, were almost all located in Cluster 2. To examine the spatial distribution of oRGs within hCS cytoarchitecture, we performed immunohistochemistry on cross-sections of hCS and observed expression of the oRG-related HOPX marker in the outermost region of the hCS proliferative zones (Supplementary Figure 4G). Interestingly, none of the primary human fetal tissue cells from GW16–18 were found close to the most mature hCS-glial Cluster 3 (Supplementary Figure 4H, I), which was primarily comprised of hCS-astrocytes collected at 450 days of in vitro maturation.
These results prompted us to investigate how single cell data collected from primary adult human brain tissue (Darmanis et al., 2015) might juxtapose with the t-SNE clustering of hCS-derived cells. Comparison to our hCS-derived cells revealed close association of adult primary astrocytes and neurons with respective glial and neuronal populations in hCS at late stages of in vitro differentiation (Supplementary Figure 5A–C). We next performed Monocle analysis, which is an unsupervised lineage algorithm that attempts to recover single-cell gene expression kinetics over a temporal process such as cell differentiation (Trapnell et al., 2014). The intent of Monocle is to place cells in order of progress through a biological process without a priori knowledge of which genes to include. This analysis revealed two clear lineage paths (one neuronal and one glial), whose predicted pseudotime assignments matched closely with in vitro differentiation stages of hCS (Supplemental Figure 5D, E). We used this analysis to identify, in an unbiased manner, gene modules associated with astrocyte differentiation (Supplementary Figure 5F; Supplementary Table 3).
To further verify that cells belonging to the various astrocyte clusters reflect astrocyte maturation states that have been identified in vivo, we correlated the degree of maturation within each population to our primary astrocyte data. We identified the top 100 most specific genes in each glial cluster (as determined from the Wilcoxon signed-rank test for each population) and calculated the enrichment (or depletion) of those genes in primary fetal or mature human astrocytes. We binned each gene into either a fetal (> 4-fold enriched in fetal human astrocytes), mature (> 4-fold enriched in mature human astrocytes), or unidentified category. We found that the majority of the genes that define the proliferating Cluster 1 (83/100) were enriched in fetal astrocytes. This is in contrast to the mature astrocyte population (Cluster 3), whose gene signature was defined predominantly by genes enriched in mature human astrocytes (82/100; Figure 3I).
Stage-dependent functional properties of hCS-derived astrocytes
To supplement the transcriptomic comparison to primary human astrocytes, we next asked whether hCS-astrocyte lineage cells display functional physiological properties similar to what would be expected in vivo. In particular, we investigated the ability of hCS-derived HepaCAM-isolated cells to: (1) uptake glutamate via specific excitatory amino acid transporters, (2) phagocytose synaptosomes, (3) induce synapse formation in neurons, and (4) modulate calcium signaling in neurons.
One of the most accepted physiological roles for astrocytes in the CNS is the ability to recycle glutamate that is released at the synaptic cleft (Anderson and Swanson, 2000). To investigate whether excitatory amino acid transporters (EAAT) mediate glutamate uptake in hCS-astrocyte lineage cells, we purified HepaCAM+ cells from hCS at day 153 or day 419 and then incubated them with radioactive glutamate (L-[2,3,4-3H] glutamate) in the presence or absence of DL-threo-β-Benzyloxyaspartic acid (TBOA), a competitive non-transportable blocker of excitatory amino acid transporters (Supplementary Figure 6A). These experiments showed uptake of glutamate in HepaCAM+ cells that was significantly reduced by TBOA (Supplementary Figure 6B; paired T-test, P= 0.04).
A more recent and intriguing finding about astrocytes is their ability to robustly phagocytose synapses in the rodent brain (Chung et al., 2013). Because synapse pruning has critical relevance to CNS development and disease pathophysiology (Penzes et al., 2011), we asked whether hCS-derived astrocytes could also phagocytose synaptosomes in vitro. We purified synaptosomes from mouse brains by differential centrifugation (Dunkley et al., 2008) and labeled them with the fluorescent dextrin pHrodoRed, a succinimidyl ester that is non-fluorescent until it is exposed to a low pH environment like the one in phagosomes. This is advantageous as it prevents quantification of synaptosomes that are simply adhering to the outside of cells. We incubated astrocytes purified from day 160 hCS with pHrodoRed-labeled synaptosomes for 16 hours, and imaged them every 15 minutes with an incubator-mounted system (Incucyte, EssenBiosciences). We observed robust phagocytic activity over this time period with numerous, distinct sites of phagocytic uptake on hCS-derived astrocytes (Figure 4A–C, Supplementary Movie 1, Supplementary Figure 6C). Additionally, we investigated whether synapse phagocytosis by hCS-astrocytes was occurring endogenously within hCS during in vitro differentiation. We labeled glial cells within hCS with a hGFAP::eGFP lentivirus and performed array tomography (AT) and immunostaining on ultra-thin cryosections (70 nm) for both presynaptic (SYN1) and postsynaptic markers (PSD95). Using synaptogram reconstructions (Figure 4D), we identified double positive puncta for SYN1 and PSD95 within individual eGFP+ processes of hCS-derived glia, suggesting that endogenous synaptic phagocytosis may occur within hCS.
FIGURE 4. Functional Changes during hCS-Astrocyte Maturation in vitro.

(A) Synaptosomes were harvested from the mouse brain and labeled with pHrodoRed, a pH sensitive indicator that fluoresces only at acidic pH (< 6).
(B) A representative astrocyte from a hCS (day 150) cultured in monolayer with pHrodoRed-labeled mouse synaptosomes for 2 hours. Phagocytosed synaptosomes fluoresce red and can be seen in multiple locations within the astrocyte. Scale bar = 20 μm.
(C) Quantification of phagocytosis over 16 hours. Synaptosomes were added at t = 1 hour, and images were taken every 15 minutes. Data from three batches of hCS (3–15 hCS per batch) derived from one iPSC line in one differentiation.
(D) (Left) Array tomography from an intact hCS that was previously labeled with the hGFAP::eGFP reporter. (Right) Synaptogram showing the colocalization of pre- and post-synaptic puncta within an astrocyte process.
(E) Time course of hCS-astrocyte purification for functional studies.
(F) Representative images of phagocytosis in hCS-astrocytes (day 100 to day 590) after 16 hours. Scale bar = 100 μm. Cells derived from two iPSC lines in 5–10 differentiation experiments (3–15 hCS per time-point).
(G) Quantification of pHrodoRed phagocytosis. One-way ANOVA, F(10, 273)=)= 2.83, P = 0.002; n = 9 fields/condition.
(H) Astrocyte lineage cells were purified from hCS and grown on inserts. RGCs were simultaneously purified and cultured either beneath an insert with hCS-glia or without any cells on the insert above.
(I) Quantification of co-localized synaptic puncta per cell. Co-localization defined by overlap between the Homer and Bassoon signal as determined by in-house MatLab image processing software. Two-tailed t-test, P = 0.006. Cells derived from one iPSC line in 6 differentiation experiments (3–15 hCS per time-point).
(J) Synaptic immunostainings for the pre– (Bassoon) and post-synaptic (Homer) markers in RGCs after 14 days in culture without (H) or with (I) inserts containing hCS-derived astrocytes. Scale bar = 12 μm. Insets, scale bar = 2 μm
(K) Neurons purified from day 83-old hCS were co-cultured with hCS-derived astrocyte lineage cells at three in vitro differentiation stages, and calcium signaling was assessed using the calcium dye Fura-2.
(L) Depolarization-induced calcium responses in Syn1+ neurons co-cultured with astrocyte-lineage cells isolated from hCS at various in vitro stages
(M) Peak calcium amplitude in Syn1+ cells; one-way ANOVA; F(2, 126)= 15.69, P< 0.0001; posthoc Bonferroni for day 379–437 versus the other two time points, ***P< 0.001, ****P< 0.0001.
We next asked whether astrocyte maturation state correlated with the cell-autonomous functional ability to phagocytose synaptosomes in vitro. We purified HepaCAM+ cells from several differentiation time points spanning day 100 to day 590 in vitro (Figure 4E), and compared their ability to engulf pHrodoRed labeled synaptosomes. We observed a significant decline in the quantity of phagocytosed synaptosomes as the age of the hCS-derived astrocytes increased (Figure 4F, G; one-way ANOVA, F(10,273)= 2.83, P= 0.002; n= 9 fields/time point). Differences in morphology and arborization between hCS-astrocytes of different ages were accounted for by normalizing synaptosome engulfment to the total area of the cell (STAR Methods). This age-dependent decline in astrocyte phagocytosis is consistent with in vivo observations in mice (Chung et al., 2013). Thus, both mouse and human immature astrocytes display a higher phagocytic ability than mature astrocytes.
In addition to synapse elimination, astrocytes also play a crucial synaptogenic role during CNS development. Therefore, we next asked whether hCS-astrocyte lineage cells could induce synapse formation when cultured with retinal ganglion cells (RGCs) (Allen et al., 2012; Christopherson et al., 2005; Ullian et al., 2001). RGCs can be cultured in defined media without astrocytes and therefore are commonly used as a model for assessing synapse formation without confounding alterations in synapse formation with effects on neuronal survival. As seen in rodent and primary human astrocytes, we observed a robust induction of synapses when RGCs were cultured beneath an insert of hCS-derived astrocytes, which was relatively consistent in hCS-derived astrocytes isolated from 172 to 495 days in vitro (Figure 4H–J; RGCs with astrocytes: 14.2 ± 1.7 synapses/field; RGCs without astrocytes 4.4 ± 0.9 synapses/field; two-tailed T-test, P= 0.006; mean +/− S.E.M., Supplementary Figure 6D). These data suggest that the decreased phagocytic activity in older hCS-derived astrocytes is unlikely to be a result of decreased cell health, as older hCS-derived astrocytes demonstrated similar synaptogenic properties as astrocytes from younger time points.
Finally, we investigated whether the maturation of hCS-derived astrocyte lineage cells can influence neuronal function. We tested whether depolarization-induced calcium signaling in immature hCS-derived neurons at early in vitro stages was affected by the presence of hCS-astrocyte lineage cells isolated at early versus late stages of differentiation (Figure 4K). We dissociated human neurons from early hCS (day 83 of differentiation), infected them with a viral reporter (AAV-DJ, hSyn1::mCherry) and co-cultured them in monolayer with HepaCAM-isolated cells from hCS of three in vitro stages: days 117–128, days 232–238 or days 379–437. We then performed calcium imaging using the ratiometric dye Fura-2, and found a significant (~66%) increase in the peak [Ca2+]i amplitude after depolarization in Syn1+ neurons co-cultured with astrocytes isolated from hCS at day 379–437 as compared to earlier time points (Figure 4L, M, one-way ANOVA; F(2, 126)= 15.69, P< 0.0001; posthoc Bonferroni for day 379–437 versus the other two time points, ***P< 0.001, ****P< 0.0001). This effect was also present when analyzing all the cells responding to depolarization, not just the more mature Syn1+ cells (Supplementary Figure 6E, one-way ANOVA; F(2, 654)= 121.8, P< 0.0001; Bonferroni posthoc test, ****P< 0.0001).
DISCUSSION
The prolonged time course of generation of human astrocytes over the first years of life poses an experimental challenge to studying their development and function. We generated astrocyte-lineage cells from iPSCs in 3D cerebral cortical cultures and maintained them for very long periods of time in vitro (up to ~20 months in this study). We found that hCS-astrocytes closely resemble primary in vivo human astrocytes in their transcriptional landscapes. Moreover, hCS-derived astrocyte lineage cells are display key functional characteristics of astrocytes in vivo: they uptake glutamate, promote synapse formation, phagocytose synaptsosomes and augment depolarization-induced calcium signaling in neurons. Lastly, this human 3D culture system is derived in defined media using directed differentiation of iPSC, allows easy maintenance of long-term cultures without significant reactive gliosis and requires no exogenous factors for coaxing astrogenesis in vitro. In addition to enabling fundamental studies of human astrocyte development and function, this preparation has the potential to be a powerful method for elucidating the pathways that promote human astrocyte maturation. Once these pathways are better understood, it may be possible in the future to much more rapidly generate human astrocytes in vitro.
In vivo maturation of astrocytes involves the progression of fetal APCs to mature, adult astrocytes. A fundamental question is to what extent such a transition could be observed in vitro and what functional features are associated with this progression. We observed evidence of maturation in hCS-astrocytes in 590 day-long in vitro cultures using direct comparison to primary fetal and adult human astrocytes. From a morphological standpoint, astrocyte branching within hCS and after isolation, in monolayer, are more complex with increasing in vitro stage. At the transcriptional level, early stage hCS-astrocytes resemble human APCs, whereas late stage hCS-astrocytes resemble more mature astrocytes. Additionally, single-cell analysis of hCS over multiple in vitro stages revealed a similar temporal progression of astrocyte maturation that involves three states: an actively proliferating population, and intermediate stage, and a mature, non-mitotic population that together comprise a continuum from RGs to APCs and eventually mature astrocytes. There has been recent discussion regarding the similarities and differences between APCs and oRG (Pollen et al., 2015; Zhang et al., 2016) due to the considerable overlap in their transcriptional profiles. We found that primary oRGs are similar at the single cell transcriptional level to the intermediate cluster in hCS-derived HepaCAM+ cells. Future studies, including fate-mapping analyses, could elucidate this relationship and bring insights into cortical astrogenesis in humans.
What controls the prolonged timing of human astrocyte maturation? Astrocyte maturation may be governed by numerous factors, including non-cell autonomous paracrine signals, extrinsic hormonal signals, and/or intrinsic regulation of cell states. Our study offers clues about this process and will be a useful tool for additional studies aimed at understanding the maturation process. Despite an environment that differs considerably from the developing fetal human cortex, astrocyte-lineage cells within hCS mature along a similar time-course to what is suggested from primary human data. Furthermore, our findings that astrocytes are maturing in hCS without blood vessels or other vascular signals suggests either that some of the extrinsic cues for astrocyte maturation are of neural origin and/or that a cell intrinsic signal is responsible for their maturation. Although considerable astrocyte maturation occurs in our cultures, it is not complete, suggesting the possibility for future research that missing cell types, such as microglia or endothelial cells may contribute to this process. The ability to generate mature human iPSC-derived astrocytes in vitro may contribute to the development of strategies for accelerating in vitro maturation of neurons and astrocytes, as well as to understanding the role in human CNS disorders of the cellular programs underlying this transition.
What are the functional consequences of astrocyte maturation? In mice and humans, both astrocytes and microglia actively participate in synaptic pruning during development (Chung et al., 2013; Stevens et al., 2007). In the mouse, the rate of astrocyte synaptic phagocytosis is high in the first postnatal week, but then steadily declines as astrocytes mature and stop dividing by about postnatal day 10 (Chung et al., 2013). Strikingly, we also found that more mature human astrocytes are less efficient at phagocytosing synaptosomes compared to younger, fetal astrocytes. A similar phenomenon was also recently observed in vivo in mice, where astrocyte synaptic phagocytosis declined steadily from P4–P9 during the peak of murine astrocyte maturation (Chung et al., 2013). This decline in synapse phagocytosis could be due to a decrease in available synaptic targets to prune or a cell autonomous mechanism. When we looked at the expression of phagocytic genes in hCS-astrocyte lineage cells over time, we found that MERTK is not expressed until human astrocytes mature whereas MEGF10 is expressed at both ages but significantly increases upon astrocyte maturation. Interestingly, however, the expression of SIRPα, a membrane receptor that strongly inhibits phagocytosis and recognizes the ‘don’t eat me’ signal’ CD47 (Barclay and Van den Berg, 2014), which is highly concentrated at synapses, is significantly upregulated when astrocytes mature. It is possible that the progressive increase in the expression of SIRPα or other phagocytic inhibitors on maturing astrocytes could contribute to decreased phagocytic abilities in these cells, and future studies should explore the role of microglia in modulating this process.
The transition from APCs to mature astrocytes has direct relevance to the fatal astrocytic brain tumor Glioblastoma Multiforme (GBM). Transcriptome profiles of neoplastic cells harvested from patients with GBM are highly correlated with APCs (Zhang et al., 2016), suggesting that these tumors are largely comprised of fetal-like astrocytes proliferating uncontrollably. Whereas most failed therapeutic attempts to limit GBM progression have focused on restricting vascular supply and/or destroying proliferating cells, new opportunities arise for therapies that address astrocyte maturation/de-differentiation within GBMs. Exploring the detailed molecular pathways underlying astrocyte maturation within hCS could provide new targets for modulating the transition within GBM tumors from an APC-like proliferative state to a mature, more quiescent phenotype.
Finally, recent work is beginning to implicate abnormal astrocyte development and function in various neurodevelopmental conditions, including autism spectrum disorders and schizophrenias (Ballas et al., 2009; Molofsky et al., 2012; Sloan and Barres, 2014). Because many of the genes involved in synaptogenic and synapse pruning pathways are tightly correlated with astrocyte maturation state, it is possible that the development of abnormal neural circuits in various neurodevelopmental disorders may be related to the inappropriate timing and/or degree of astrocyte maturation.
STAR METHODS
CONTACT FOR REAGENT AND RESOURCE SHARING
Further information and requests for resources and reagents should be directed to and will be fulfilled by the Lead Contact, Dr. Sergiu Pașca (spasca@stanford.edu).
EXPERIMENTAL MODELS AND SUBJECT DETAILS
Human iPSC lines
All human stem cell work was performed with approval from the Stanford Human Stem Cell Research Oversight (SRCO) committee. Human iPSC lines were derived from fibroblasts harvested under informed consent. A total of four human iPSC lines derived from fibroblasts collected from three healthy subjects were used for experiments (two males and one female). Lines were characterized as previously described (Birey et al., 2017; Pașca et al., 2011; Yazawa et al., 2011) and maintained on inactivated mouse embryonic fibroblast feeders as detailed below. Cultures were regularly tested for and maintained in Mycoplasma free conditions.
Fetal and adult primary human samples
Data from primary human samples were generated in (Zhang et al., 2016). Human brain tissue was obtained under a protocol approved by the Stanford University Institutional Review Board. The tissue was processed as previously described (Zhang et al., 2016). In total, tissue from 27 individuals was used in this study (13 female and 14 male). Gender information for each sample can be found in the Supplementary Table 4 from (Zhang et al., 2016).
METHODS DETAILS
Generation of hCS
hCS were generated as previously described (Pasca et al., 2015). Briefly, iPSC colonies were enzymatically detached from inactivated mouse feeders in order to maintain intact colonies, and were subsequently transferred into low-attachment plates in a KnockOut Serum based media without fibroblast growth factor 2 (FGF2). Neural induction was achieved with small molecule inhibition of BMP (dorsomorphin, also known as compound C) and TGF-β (SB-431542) signaling pathways (Chambers et al., 2009). On day six in suspension, the floating spheroids were moved to serum-free Neurobasal with B-27 medium containing FGF2 and epidermal growth factor (EGF). Media was changed daily for the first 10 days and every other day for the subsequent 9 days. After three weeks, FGF2 and EGF were removed from the media, and media (Neurobasal with B-27 only) was replaced approximately every four days for the duration of the time in culture. hCS derived from four iPSC lines/clones (8858-1, 8858-3, 1205-4 and 2242-1) differentiated in 33 independent experiments were used for the various assays.
Purification of hCS-derived astrocytes and neurons
For a detailed purification protocol, see Supplementary Information. Briefly, 3–15 hCS were used for each sample. The tissue was chopped using a #10 blade and then incubated in 30 U/ml papain at 34°C for 90 minutes and washed with a protease inhibitor stock solution. After digestion, the tissue was triturated and then the resulting single cell suspension was added to a series of plastic petri dish pre-coated with cell type specific antibodies and incubated for 10–30 minutes each at room temperature. Unbound cells were transferred to the subsequent petri dish while the dish with bound cells was rinsed with PBS to wash away loosely bound contaminating cell types. The antibodies used include anti–Thy1 (CD90) (R&D, MAB7335) to harvest neurons, anti–HepaCAM (R&D, MAB4108) to harvest astrocytes. For RNA-seq, cell samples were scraped off the panning dish directly with Qiazol reagent (Qiagen). For cell culture and in vitro experiments, astrocytes or neurons bound to the antibody coated dishes were incubated in a trypsin solution at 37°C for 3–5 minutes and gently squirted off the plate. We then spun down the cells and plated them on poly-D-lysine coated plastic coverslips in a Neurobasal/DMEM based serum-free medium (detailed in Supplementary Information). We replaced half of the volume with fresh medium every 3–4 days to maintain the cultures. Fetal human astrocytes and neurons were purified in a similar protocol to the above-mentioned procedure with the modifications detailed in the Supplementary Information.
Bulk RNA-seq library construction and sequencing
Immediately after immunopanning, cells were scraped from each plate to harvest RNA and to minimize the delay between the initial dissociation of the hCS and RNA isolation (~3 hours). Total RNA was extracted using the miRNeasy kit (Qiagen) under the protocols of the manufacturer. The quality of the RNA was assessed by Bioanalyzer. Samples with integrity number higher than 8 were used for library construction. We used the Ovation® RNA-seq system V2 (Nugen 7102) to perform first and second-strand cDNA synthesis. We then used the Next Ultra RNA-seq library prep kit for Illumina (NEB E7530) and NEBNext® multiplex oligos for Illumina® (NEB E7335 E7500) to perform end repair, adaptor ligation, and 5–6 cycles of PCR enrichment according to manufacturer’s instructions. The quality of the libraries was assessed by bioanalyzer and qPCR and high quality libraries were sequenced by the Illumina NextSeq sequencer to obtain 75bp pair-end reads (41.0M ± 5.9M reads per sample, 80.6% ± 3.7% mapped; mean ± SD). All data has been deposited into GEO database.
Bulk RNA-seq read mapping, transcript assembly, and expression level estimation
The FASTQ files were first groomed using the FASTQ groomer and then mapped using TopHat2, which invokes Bowtie as an internal read mapper. The paired end option was selected and human genome version 19 (hg19) was used as the reference genome. We then ran Cufflinks to assemble transcripts and estimate expression level as fragments per kilobase of transcript sequence per million mapped fragments (FPKM).
Single-cell cDNA synthesis and library preparation
Reverse transcription (RT) and PCR amplification was performed using the Smart seq2 protocol, described in (Picelli et al., 2014). Briefly, 96-well plates containing single-cell lysates were thawed on ice followed by incubation at 72°C for 3 minutes and placed immediately on ice. Reverse transcription was carried out after adding 6 μl of RT-mix (100U SMARTScribe™ Reverse Transcriptase (TAKARA BIO), 10U Recombinant RNase Inhibitor (TAKARA BIO), 1X First-Strand Buffer (TAKARA BIO), 8.5 mM DTT (Invitrogen), 0.4 mM Betaine (Sigma), 10 mM MgCl2 (Sigma) and 1.6 μM TSO (5′-AAGCAGTGGTATCAACGCAGAGTACATrGrG+G-3′)), for 90 minutes at 42°C, followed by 5 minutes at 70°C. RT was followed by PCR amplification. PCR was performed using 15 μl of PCR-mix (1x KAPA HiFi HotStart ReadyMix (Kapa Biosystems), 0.16 μM ISPCR oligo (5′-AAGCAGTGGTATCAACGCAGAGT-3′) and 0.56U of Lambda Exonuclease (NEB) using the following thermal-cycling protocol: (1) 37°C for 30 minutes, (2) 95°C for 3 minutes, (3) 21 cycles of 98°C for 20 seconds, 67°C for 15 seconds and 72°C for 4 minutes, and (4) 72°C for 5 minutes. PCR was followed by bead purification using 0.7x AMPure beads (Beckman Coulter), capillary electrophoresis and smear analysis using a Fragment Analyzer™ (AATI). Calculated smear concentrations within the size range of 500 and 5000 bp for each single cell were used to dilute samples for Nextera library preparation as described in (Darmanis et al., 2015).
Single-cell RNA Sequencing and QC
In total, we sequenced 710 single cells using 75bp long paired end reads on a NextSeq instrument (Illumina) using High-output v2 kits (Illumina). Raw reads were preprocessed and aligned to the human genome (hg19) using the pipeline described in (Darmanis et al., 2015). As a quality metric, we first performed hierarchical clustering on all cells using a list of housekeeping genes, and removed any cells with uniformly low expression across all genes (likely a result of low quality RNA or cDNA synthesis). We separated the resulting dendrogram into two clusters containing cells that passed or failed this quality control (QC). All downstream analyses were performed using only the cells that passed QC (n= 710).
Dimensionality reduction, clustering, and Monocle analysis
All data analysis was performed using the R software (https://www.r-project.org/). Dimensionality reduction was performed in three steps. First, we calculated the overdispersion of each gene as described in (Fan et al., 2016). We then selected the top 1000 over-dispersed genes and constructed a cell-to-cell distance matrix (1-absolute correlation) of all cells (using either hCS alone, primary cells from (Pollen et al., 2015) or primary cells from (Darmanis et al., 2015)). The distance matrix was reduced to two dimensions using t-SNE (van der Maaten and Hinton, 2008). Clustering of groups of similar cells was performed on the two-dimensional t-SNE space using k-means. The lineage tree for the single-cells was constructed using the Monocle algorithm (updated 2.0 version) as described in (Trapnell et al., 2014). The lineage trees included all hCS single cells as well as the primary adult single cells from (Darmanis et al., 2015).
Unsupervised hierarchical clustering
Hierarchical clustering was performed using R software. First, the top 1000 over-dispersed genes for a target population were identified using the methods listed above. Clustering was subsequently performed using the hclust package in R, with ward.D2 as the distance metric for all samples.
Immunocytochemistry
Cultured cells were fixed with 4% PFA for 10 minutes at room temperature, permeablized and blocked with 10% goat serum with 0.2% Triton-X100. For cryosections, hCS were fixed overnight at 4C in 4% PFA before transferring to 30% sucrose for 24 hours. Dehydrated hCS were then frozen in OCT and sliced at 10 μm thickness. Antibodies used were GFAP (DAKO, Z033401-2, dilution 1:1500), TUJ1 (Covance, MMS-435P, dilution 1:1500), Homer (Synaptic Systems, #160 011, dilution 1:1000), Bassoon (Synaptic Systems, #141 004, dilution 1:1000), HOPX (Santa Cruz, #sc-398703, dilution 1:300), phosphor-Vimentin (MBL, #D076-3, dilution 1:2000). Array tomography in hCS was performed as previously described (Pasca et al., 2015).
Synapse formation assay
We purified rat RGCs by sequential immunopanning to greater than 99% purity and cultured them in serum-free medium as previously described (Winzeler and Wang, 2013). hCS-derived astrocytes were plated on inserts and co-cultured with RGCs for 14 days. For quantification of structural synapses, RGCs were fixed and stained with antibodies against the presynaptic marker Bassoon and postsynaptic marker Homer. Synaptic pucta colocalization and size were quantified by a custom-written Matlab program (available upon request).
Synaptosome phagocytosis assay
Synaptosome purification and in vitro engulfment assays were performed as previously described (Chung et al., 2013). Briefly, synaptosomes were purified by percoll gradient from adult mouse brains and incubated with pHrodo Red, succinimidyl ester (Life Technologies, P36600). The hCS-astrocyte lineage cells were purified as above and grown for 48 hours in the Incucyte Live Cell Analysis System (Essen Biosciences). After 48 hours, purified synaptosomes were added to the media, and images were taken every 15 minutes. To quantify synaptosome engulfment, phase images were separated from the pHrodoRed signal and imported into ImageJ where a blinded experimented manually traced the outline of cells within the field. After the cell boundaries were established, the pHrodoRed signal was added back, and the intensity of red channel within the cell boundaries was determined and subsequently normalized to the gross area of each cell.
Calcium imaging
hCSs at 83 days of differentiation were dissociated with papain and cultured on poly-L-ornithine (Sigma, P4957) and Laminin (Sigma, L2020) coated coverslips (15 mm, Warner Instruments) at a density of ~290,000 cells/coverslip in NM supplemented BDNF and NT3 (20 ng/ml), and infected next day with AAV-DJ hSyn1::mCherry. In parallel, hCS at the age of days 117–128, days 232–238, and days 379–437 (from two iPSC lines) were immunopanned with anti–HepaCAM antibodies to isolated astrocytes as described above; ~15,000 cells immunopanned astrocytes were added to the neurons cultured in monolayer, and co-cultured for an additional 8 days in vitro before imaging.
Calcium imaging was performed as previously described (Krey et al., 2013; Pașca et al., 2011). Briefly, cells were loaded with 1 μM Fura-2 acetoxymethyl ester (Invitrogen) for 30 min at 37°C in NM medium, washed with NM medium for 10 min and then transferred to a perfusion chamber (RC-20; Warner instruments) in low potassium Tyrode’s solution (2 mM KCl: 129 mM NaCl, 2 mM CaCl2, 1 mM MgCl2, 30 mM glucose, 25 mM HEPES, 0.1% and Bovine Serum Albumin, pH 7.4) on the stage of an inverted fluorescence microscope (TE2000U; Nikon). After imaging for 2 minutes, a high potassium Tyrode’s solution (High-KCl) (67 mM KCl: 67 mM NaCl, 2 mM CaCl2, 1 mM MgCl2, 30 mM glucose, and 25 mM HEPES, 0.1% and Bovine Serum Albumin, pH 7.4) was applied. Imaging was performed at room temperature (~25°C) on an epifluorescence micr oscope equipped with an excitation filter wheel and an automated stage. The Openlab software (PerkinElmer) and IGOR Pro (WaveMetrics) was used to collect and quantify time-lapse excitation ratio images, as previously described (Barreto-Chang and Dolmetsch, 2009).
Glutamate uptake
Cells were first incubated with Krebs-Ringer-HEPES solution pH 7.40 (KRH). After 20 minutes, the solution was replaced with fresh KRH followed by incubation for another 20 minutes. Samples were then incubated in KRH or for negative controls KRH plus 100 μM DL-threo-β-Benzyloxyaspartic acid (TBOA, Tocris 1223) for 5 minutes followed by incubation with 1 μM L-[2,3,4-3H]-glutamate (American Raiodochemicals, ART 0132A) with 100 μM TBOA added to the negative control for 5 minutes. Samples were then quickly washed twice with ice-cold KRH, and then lysed with 1% SDS (200 μl per well). Radioactivity in lysates was measured after dilution in 3 mL of EcoLume scintillation fluid (ICN Biochemicals) by scintillation spectrometry (LS6500, Beckman Coulter Inc., Fullerton, CA, USA).
Live/Dead Assay
hCS were dissociated as described above. Immediately after dissociation, the single cell suspension was mixed with Calcein-AM (which fluoresces green after ester hemolysis in live cells) and Ethidium homodimer-1 according to manufacturer’s instructions (Live/Dead Viability/Cytotoxicity kit, Invitrogen, L3224).
QUANTIFICATION AND STATISTICAL ANALYSIS
Data are presented as mean ± S.E.M., unless otherwise indicated. Distribution of the raw data was tested for normality of distribution. Statistical analyses were performed using the Student’s T-test, the ANOVA with post-hoc tests or non-parametric tests, such as the Mann–Whitney U-test, when data was not normally distributed. Specifics on the type of test applied for each experiment are included in the figure legends and results section. Sample sizes were estimated empirically or based on power calculations. In general, n values refer to the number of individual lines, differentiations, or imaging fields for a given experiment; details are provided for each experiment in the corresponding figure legend. Blinding was used for analyses comparing samples from different lines and time-points.
DATA AND SOFTWARE AVAILABILITY
Gene expression data are available in the Gene Expression Omnibus (GEO): GSE99951. The data that support the findings of this study are available on request from the corresponding author.
| REAGENT or RESOURCE | SOURCE | IDENTIFIER |
|---|---|---|
| Antibodies | ||
| Mouse anti Thy1 (CD90) | R&D | Cat# MAB7335 |
| Mouse anti HepaCAM | R&D | Cat# MAB4108 |
| Rabbit anti GFAP | DAKO | Part# Z033401-2 |
| Mouse anti TUJ1 | Covance | Cat# MMS-435P |
| Mouse anti Homer | Synaptic Systems | Cat# 160 011 |
| Guinea Pig anti Bassoon | Synaptic Systems | Cat# 141 004 |
| Mouse anti HOPX | Santa Cruz | Cat# sc-398703 |
| Mouse anti phosphor-Vimetin | MBL | Cat# D076-3 |
| Goat anti mouse IgG+IgM (Heavy + Light chains) | Jackson ImmunoResearch | Cat# 115-005-044 |
| Bacterial and Virus Strains | ||
| N/A | ||
| Biological Samples | ||
| N/A | ||
| Chemicals, Peptides, and Recombinant Proteins | ||
| B-27 | Thermo Fisher Scientific | Cat# 12587 |
| FGF-2 | R&D | Cat# 233-FB |
| EGF | Millipore | Cat# 01-102 |
| NT-3 | Peprotech | Cat# 450-03 |
| SB-431542 | Tocris | Cat# 1614 |
| Dorsomorphin | Sigma | SKU# P5499 |
| Y-27632 | Tocris | Cat# 1254 |
| Glutamax | Thermo Fisher Scientific | Cat# 35050 |
| Penicillin/Streptomycin | Thermo Fisher Scientific | Cat# 15070-063 |
| Non-essential amino acids | Thermo Fisher Scientific | Cat# 11140 |
| Dispase | Thermo Fisher Scientific | Cat# 17105-041 |
| BDNF | Peprotech | Cat# 450-02 |
| HBEGF | Sigma | SKU# E4643 |
| CNTF | Peprotech | Cat# 450-13 |
| N-Acetyl-L-cysteine | Sigma | SKU# A8199 |
| NS21-MAX | R&D | Cat# AR008 |
| 3,3′,5-Triiodo-L-thyronine sodium salt (T3) | Sigma | SKU# T6397 |
| Trypsin | Sigma | SKU# T9935 |
| Tissue-Tek O.C.T. Compound, | SAKURA FINETEK | Supplier# 4583 |
| 2-Mercaptoethanol | Sigma | SKU# M3148 |
| EBSS | Sigma | SKU# E7510 |
| DNase | Worthington | Cat# LS002007 |
| Papain | Worthington | Cat# LS03126 |
| L-cysteine | Sigma | SKU# C7880 |
| Insulin | Sigma | SKU# I-6634 |
| BSA | Sigma | SKU# A8806 |
| Ovomucoid | Roche Diagnostics | SKU# 109878 |
| DL-TBOA | Tocris | Cat# 1223 |
| SMARTScribe Reverse Transcriptase | Takara | Cat# 639536 |
| Recombinant RNase Inhibitor | Takara | Cat# 2313A |
| DTT | Thermo Fisher Scientific | Cat# P2325 |
| Betaine | Sigma | SKU# B0300-1VL |
| KAPA HiFi HotStart Ready Mix | Kapa | Cat# KK2600 |
| Lambda Exonuclease | NEB | Cat# M0262S |
| AMPure beads | Beckman Coulter | Item# A63880 |
| pHrodo Red, succinimidyl ester | Thermo Fisher Scientific | Cat# P36600 |
| Poly-L-ornithine | Sigma | SKU# P4957 |
| Poly-D-lysine | Sigma | SKU# P6407 |
| Laminin | Sigma | SKU# L2020 |
| Fura-2 acetoxymethyl ester | Thermo Fisher Scientific | Cat# F1201 |
| L-[2,3,4-3H]-glutamate | American Raiodochemicals | Cat# 0132A |
| EcoLume scintillation fluid | ICN Biochemicals | Cat# 0188247001 |
| Critical Commercial Assays | ||
| Ovation RNA-seq System V2 kit | Nugen | Part# 7102 |
| Next Ultra RNA-seq library prep kit for Illumina | NEB | Cat# NEBE7530 |
| FITC conjugation kit | Abcam | Cat# ab102884 |
| miRNeasy Micro Kit | Qiagen | Cat# 217084 |
| Live/Dead Viability/Cytotoxicity kit | Thermo Fisher Scientific | Cat# L3224 |
| Deposited Data | ||
| Raw and analyzed RNA-seq data: Bulk Thy1- and HepaCAM purified cells | Gene Expression Omnibus | Accession# GSE99951 |
| Raw and analyzed RNA-seq data: RNA-seq: Single cell data from hCS | Gene Expression Omnibus | Accession# GSE99951 |
| Experimental Models: Cell Lines | ||
| Human iPSC line 8858-1 | Pasca Lab | N/A |
| Human iPSC line 8858-3 | Pasca Lab | N/A |
| Human iPSC line 2242-1 | Pasca Lab | N/A |
| Human iPSC line 1205-4 | Pasca Lab | N/A |
| DR4 mouse embryonic fibroblast feeders (irradiated) | Millipore | Cat# PMEF-DR4X-5P |
| Experimental Models: Organisms/Strains | ||
| N/A | ||
| Oligonucleotides | ||
| TSO - 5′-AAGCAGTGGTATCAACGCAGAGTACATrGrG+G-3′ | This paper | N/A |
| ISPCR - 5′-AAGCAGTGGTATCAACGCAGAGT-3′ | This paper | N/A |
| Recombinant DNA | ||
| AAV-DJ-hSyn1-mCherry | Stanford Neuroscience Viral Core | N/A |
| pLV-hGFAP-eGFP | Stanford Neuroscience Viral Core | N/A |
| Software and Algorithms | ||
| R package | Open | RRID:SCR_000432 |
| Galaxy | Afgan et al., 2016 | RRID:SCR_006281 |
| TopHat2 | Kim et al., 2013 | RRID:SCR_013035 |
| Bowtie2 | Langmead and Salzberg, 2012 | N/A |
| Cufflinks | Trapnell et al. 2010 | N/A |
| t-SNE | van der Maaten, 2008 | N/A |
| Prism | GraphPad | RRID:SCR_002798 |
| Image J | NIH https://imagej.nih.gov/ij/ |
RRID:SCR_003070 |
| Openlab software | PerkinElmer | RRID:SCR_012158 |
| IGOR Pro | WaveMetrics | RRID:SCR_000325 |
| Other | ||
| Agilent BioAnalyzer 2100 | Agilent | N/A |
| Ilumina NextSeq 500 sequencer | Ilumina | N/A |
| Incucyte Live Cell Analysis System | Essen Biosciences | Cat# 4647 |
| Fluorescence microscope | Nikon | Model# TE2000U |
| Scintillation spectrometry | Beckman Coulter | Model# LS6500 |
| Ultra-low-attachment plastic plates | Corning | Product# 3262 |
| Nitex mesh | Sefar America Inc., Lab Pak | Cat# 03-20 |
| Dulbecco’s phosphate-buffered saline | Thermo Fisher Scientific | Cat# 14287 |
| Dulbecco’s modified eagle medium (DMEM) | Thermo Fisher Scientific | Cat# 11960 |
| DMEM/F12 | Thermo Fisher Scientific | Cat# 11330 |
| Neurobasal | Thermo Fisher Scientific | Cat# 10888 |
| KnockOut Serum | Thermo Fisher Scientific | Cat# 10828 |
| Fetal Bovine Serum | Gibco | Cat# 10437 |
| 24-well cell culture inserts (1 μm pore size) | BD | Cat# 353104 |
Supplementary Material
Acknowledgments
We thank J. Andersen, A.M. Pasca and J.Y. Park in the Pasca lab for experimental support, as well as N. O’Rourke for support with array tomography experiments. This work was supported by the US National Institute of Health (NIH) R01 MH099555, NS081703 (to B.A.B.); the NIH BRAINS Award (R01MH107800), the California Institute of Regenerative Medicine (CIRM), the MQ Fellow Award, Donald E. and Delia B. Baxter Foundation Award (to S.P.P.); NIMH T32GM007365, F30MH106261 and Bio-X Predoctoral Fellowship (to or supporting S.A.S.); the Dean’s Postdoctoral Fellowship (N.H.) and Child Health Research Institute Postdoctoral Fellowship UL1-TR001085 (N.H., F.B).
Footnotes
Publisher's Disclaimer: This is a PDF file of an unedited manuscript that has been accepted for publication. As a service to our customers we are providing this early version of the manuscript. The manuscript will undergo copyediting, typesetting, and review of the resulting proof before it is published in its final citable form. Please note that during the production process errors may be discovered which could affect the content, and all legal disclaimers that apply to the journal pertain.
AUTHOR CONTRIBUTIONS:
S.A.S., B.A.B., and S.P.P. conceived the project. S.A.S., B.A.B., and S.P.P designed the experiments and wrote the manuscript with input from authors. S.D., S.R.Q., N.H. aided in the single cell RNA-seq sorting, sequencing pipeline and analyses, T.K. performed calcium imaging experiments and immunostainings, R.R performed the glutamate uptake assay, and S.A.S., C.C., and N.H. contributed to other experiments. N.H., T.K. and F.B. assisted in generating and maintaining all hCS and long-term cultures.
References
- Allen NJ, Bennett ML, Foo LC, Wang GX, Chakraborty C, Smith SJ, Barres BA. Astrocyte glypicans 4 and 6 promote formation of excitatory synapses via GluA1 AMPA receptors. Nature. 2012;486:410–414. doi: 10.1038/nature11059. [DOI] [PMC free article] [PubMed] [Google Scholar]
- Anderson CM, Swanson RA. Astrocyte glutamate transport: review of properties, regulation, and physiological functions. Glia. 2000;32:1–14. [PubMed] [Google Scholar]
- Ballas N, Lioy DT, Grunseich C, Mandel G. Non-cell autonomous influence of MeCP2-deficient glia on neuronal dendritic morphology. Nat Neurosci. 2009;12:311–317. doi: 10.1038/nn.2275. [DOI] [PMC free article] [PubMed] [Google Scholar]
- Barclay AN, Van den Berg TK. The interaction between signal regulatory protein alpha (SIRPalpha) and CD47: structure, function, and therapeutic target. Annual review of immunology. 2014;32:25–50. doi: 10.1146/annurev-immunol-032713-120142. [DOI] [PubMed] [Google Scholar]
- Barreto-Chang OL, Dolmetsch RE. Calcium imaging of cortical neurons using Fura-2 AM. Journal of visualized experiments: JoVE. 2009 doi: 10.3791/1067. [DOI] [PMC free article] [PubMed] [Google Scholar]
- Birey F, Andersen J, Makinson CD, Islam S, Wei W, Huber N, Fan HC, Metzler KRC, Panagiotakos G, Thom N, et al. Assembly of functionally integrated human forebrain spheroids. Nature. 2017;545:54–59. doi: 10.1038/nature22330. [DOI] [PMC free article] [PubMed] [Google Scholar]
- Cahoy JD, Emery B, Kaushal A, Foo LC, Zamanian JL, Christopherson KS, Xing Y, Lubischer JL, Krieg PA, Krupenko SA, et al. A transcriptome database for astrocytes, neurons, and oligodendrocytes: a new resource for understanding brain development and function. J Neurosci. 2008;28:264–278. doi: 10.1523/JNEUROSCI.4178-07.2008. [DOI] [PMC free article] [PubMed] [Google Scholar]
- Chambers SM, Fasano CA, Papapetrou EP, Tomishima M, Sadelain M, Studer L. Highly efficient neural conversion of human ES and iPS cells by dual inhibition of SMAD signaling. Nat Biotechnol. 2009;27:275–280. doi: 10.1038/nbt.1529. [DOI] [PMC free article] [PubMed] [Google Scholar]
- Christopherson KS, Ullian EM, Stokes CC, Mullowney CE, Hell JW, Agah A, Lawler J, Mosher DF, Bornstein P, Barres BA. Thrombospondins are astrocyte-secreted proteins that promote CNS synaptogenesis. Cell. 2005;120:421–433. doi: 10.1016/j.cell.2004.12.020. [DOI] [PubMed] [Google Scholar]
- Chung WS, Clarke LE, Wang GX, Stafford BK, Sher A, Chakraborty C, Joung J, Foo LC, Thompson A, Chen C, et al. Astrocytes mediate synapse elimination through MEGF10 and MERTK pathways. Nature. 2013;504:394–400. doi: 10.1038/nature12776. [DOI] [PMC free article] [PubMed] [Google Scholar]
- Darmanis S, Sloan SA, Zhang Y, Enge M, Caneda C, Shuer LM, Hayden Gephart MG, Barres BA, Quake SR. A survey of human brain transcriptome diversity at the single cell level. Proc Natl Acad Sci U S A. 2015;112:7285–7290. doi: 10.1073/pnas.1507125112. [DOI] [PMC free article] [PubMed] [Google Scholar]
- Deverman BE, Pravdo PL, Simpson BP, Kumar SR, Chan KY, Banerjee A, Wu WL, Yang B, Huber N, Pasca SP, et al. Cre-dependent selection yields AAV variants for widespread gene transfer to the adult brain. Nat Biotechnol. 2016;34:204–209. doi: 10.1038/nbt.3440. [DOI] [PMC free article] [PubMed] [Google Scholar]
- Dolmetsch R, Geschwind DH. The human brain in a dish: the promise of iPSC-derived neurons. Cell. 2011;145:831–834. doi: 10.1016/j.cell.2011.05.034. [DOI] [PMC free article] [PubMed] [Google Scholar]
- Dunkley PR, Jarvie PE, Robinson PJ. A rapid Percoll gradient procedure for preparation of synaptosomes. Nat Protoc. 2008;3:1718–1728. doi: 10.1038/nprot.2008.171. [DOI] [PubMed] [Google Scholar]
- Emdad L, D’Souza SL, Kothari HP, Qadeer ZA, Germano IM. Efficient differentiation of human embryonic and induced pluripotent stem cells into functional astrocytes. Stem cells and development. 2012;21:404–410. doi: 10.1089/scd.2010.0560. [DOI] [PubMed] [Google Scholar]
- Eroglu C, Allen NJ, Susman MW, O’Rourke NA, Park CY, Ozkan E, Chakraborty C, Mulinyawe SB, Annis DS, Huberman AD, et al. Gabapentin receptor alpha2delta-1 is a neuronal thrombospondin receptor responsible for excitatory CNS synaptogenesis. Cell. 2009;139:380–392. doi: 10.1016/j.cell.2009.09.025. [DOI] [PMC free article] [PubMed] [Google Scholar]
- Fan J, Salathia N, Liu R, Kaeser GE, Yung YC, Herman JL, Kaper F, Fan JB, Zhang K, Chun J, et al. Characterizing transcriptional heterogeneity through pathway and gene set overdispersion analysis. Nature methods. 2016;13:241–244. doi: 10.1038/nmeth.3734. [DOI] [PMC free article] [PubMed] [Google Scholar]
- Freeman MR, Rowitch DH. Evolving concepts of gliogenesis: a look way back and ahead to the next 25 years. Neuron. 2013;80:613–623. doi: 10.1016/j.neuron.2013.10.034. [DOI] [PMC free article] [PubMed] [Google Scholar]
- Huttenlocher PR. Synaptic density in human frontal cortex - developmental changes and effects of aging. Brain Res. 1979;163:195–205. doi: 10.1016/0006-8993(79)90349-4. [DOI] [PubMed] [Google Scholar]
- Huttenlocher PR, de Courten C, Garey LJ, Van der Loos H. Synaptogenesis in human visual cortex–evidence for synapse elimination during normal development. Neurosci Lett. 1982;33:247–252. doi: 10.1016/0304-3940(82)90379-2. [DOI] [PubMed] [Google Scholar]
- Juopperi TA, Kim WR, Chiang CH, Yu H, Margolis RL, Ross CA, Ming GL, Song H. Astrocytes generated from patient induced pluripotent stem cells recapitulate features of Huntington’s disease patient cells. Molecular brain. 2012;5:17. doi: 10.1186/1756-6606-5-17. [DOI] [PMC free article] [PubMed] [Google Scholar]
- Kang HJ, Kawasawa YI, Cheng F, Zhu Y, Xu X, Li M, Sousa AM, Pletikos M, Meyer KA, Sedmak G, et al. Spatio-temporal transcriptome of the human brain. Nature. 2011;478:483–489. doi: 10.1038/nature10523. [DOI] [PMC free article] [PubMed] [Google Scholar]
- Krencik R, Ullian EM. A cellular star atlas: using astrocytes from human pluripotent stem cells for disease studies. Frontiers in cellular neuroscience. 2013;7:25. doi: 10.3389/fncel.2013.00025. [DOI] [PMC free article] [PubMed] [Google Scholar]
- Krencik R, Zhang SC. Directed differentiation of functional astroglial subtypes from human pluripotent stem cells. Nat Protoc. 2011;6:1710–1717. doi: 10.1038/nprot.2011.405. [DOI] [PMC free article] [PubMed] [Google Scholar]
- Krey JF, Pașca SP, Shcheglovitov A, Yazawa M, Schwemberger R, Rasmusson R, Dolmetsch RE. Timothy syndrome is associated with activity-dependent dendritic retraction in rodent and human neurons. Nat Neurosci. 2013;16:201–209. doi: 10.1038/nn.3307. [DOI] [PMC free article] [PubMed] [Google Scholar]
- Lovatt D, Sonnewald U, Waagepetersen HS, Schousboe A, He W, Lin JHC, Han X, Takano T, Wang S, Sim FJ, et al. The transcriptome and metabolic gene signature of protoplasmic Astrocytes in the adult murine cortex. Journal of Neuroscience. 2007;27:12255–12266. doi: 10.1523/JNEUROSCI.3404-07.2007. [DOI] [PMC free article] [PubMed] [Google Scholar]
- Middeldorp J, Boer K, Sluijs JA, De Filippis L, Encha-Razavi F, Vescovi AL, Swaab DF, Aronica E, Hol EM. GFAPdelta in radial glia and subventricular zone progenitors in the developing human cortex. Development. 2010;137:313–321. doi: 10.1242/dev.041632. [DOI] [PubMed] [Google Scholar]
- Molofsky AV, Krencik R, Ullian EM, Tsai HH, Deneen B, Richardson WD, Barres BA, Rowitch DH. Astrocytes and disease: a neurodevelopmental perspective. Genes Dev. 2012;26:891–907. doi: 10.1101/gad.188326.112. [DOI] [PMC free article] [PubMed] [Google Scholar]
- Oberheim NA, Takano T, Han X, He W, Lin JH, Wang F, Xu Q, Wyatt JD, Pilcher W, Ojemann JG, et al. Uniquely hominid features of adult human astrocytes. J Neurosci. 2009;29:3276–3287. doi: 10.1523/JNEUROSCI.4707-08.2009. [DOI] [PMC free article] [PubMed] [Google Scholar]
- Pasca AM, Sloan SA, Clarke LE, Tian Y, Makinson CD, Huber N, Kim CH, Park JY, O’Rourke NA, Nguyen KD, et al. Functional cortical neurons and astrocytes from human pluripotent stem cells in 3D culture. Nature methods. 2015;12:671–678. doi: 10.1038/nmeth.3415. [DOI] [PMC free article] [PubMed] [Google Scholar]
- Pasca SP. Personalized Human Cortical Spheroids. The American journal of psychiatry. 2016;173:332–333. doi: 10.1176/appi.ajp.2016.16020133. [DOI] [PubMed] [Google Scholar]
- Pașca SP, Panagiotakos G, Dolmetsch RE. Generating human neurons in vitro and using them to understand neuropsychiatric disease. Annual review of neuroscience. 2014;37:479–501. doi: 10.1146/annurev-neuro-062012-170328. [DOI] [PubMed] [Google Scholar]
- Pașca SP, Portmann T, Voineagu I, Yazawa M, Shcheglovitov A, Pașca AM, Cord B, Palmer TD, Chikahisa S, Nishino S, et al. Using iPSC-derived neurons to uncover cellular phenotypes associated with Timothy syndrome. Nat Med. 2011;17:1657–1662. doi: 10.1038/nm.2576. [DOI] [PMC free article] [PubMed] [Google Scholar]
- Penzes P, Cahill ME, Jones KA, VanLeeuwen JE, Woolfrey KM. Dendritic spine pathology in neuropsychiatric disorders. Nat Neurosci. 2011;14:285–293. doi: 10.1038/nn.2741. [DOI] [PMC free article] [PubMed] [Google Scholar]
- Picelli S, Faridani OR, Bjorklund AK, Winberg G, Sagasser S, Sandberg R. Full-length RNA-seq from single cells using Smart-seq2. Nat Protoc. 2014;9:171–181. doi: 10.1038/nprot.2014.006. [DOI] [PubMed] [Google Scholar]
- Pollen AA, Nowakowski TJ, Chen J, Retallack H, Sandoval-Espinosa C, Nicholas CR, Shuga J, Liu SJ, Oldham MC, Diaz A, et al. Molecular identity of human outer radial glia during cortical development. Cell. 2015;163:55–67. doi: 10.1016/j.cell.2015.09.004. [DOI] [PMC free article] [PubMed] [Google Scholar]
- Roybon L, Lamas NJ, Garcia-Diaz A, Yang EJ, Sattler R, Jackson-Lewis V, Kim YA, Kachel CA, Rothstein JD, Przedborski S, et al. Human stem cell-derived spinal cord astrocytes with defined mature or reactive phenotypes. Cell reports. 2013;4:1035–1048. doi: 10.1016/j.celrep.2013.06.021. [DOI] [PMC free article] [PubMed] [Google Scholar]
- Shaltouki A, Peng J, Liu Q, Rao MS, Zeng X. Efficient generation of astrocytes from human pluripotent stem cells in defined conditions. Stem Cells. 2013;31:941–952. doi: 10.1002/stem.1334. [DOI] [PubMed] [Google Scholar]
- Sloan SA, Barres BA. Mechanisms of astrocyte development and their contributions to neurodevelopmental disorders. Curr Opin Neurobiol. 2014;27C:75–81. doi: 10.1016/j.conb.2014.03.005. [DOI] [PMC free article] [PubMed] [Google Scholar]
- Stevens B, Allen NJ, Vazquez LE, Howell GR, Christopherson KS, Nouri N, Micheva KD, Mehalow AK, Huberman AD, Stafford B, et al. The classical complement cascade mediates CNS synapse elimination. Cell. 2007;131:1164–1178. doi: 10.1016/j.cell.2007.10.036. [DOI] [PubMed] [Google Scholar]
- Tabar V, Studer L. Pluripotent stem cells in regenerative medicine: challenges and recent progress. Nat Rev Genet. 2014;15:82–92. doi: 10.1038/nrg3563. [DOI] [PMC free article] [PubMed] [Google Scholar]
- Tsai YJ, Huang CT, Lin SC, Yeh JH. Effects of regional and whole-body hypothermic treatment before and after median nerve injury on neuropathic pain and glial activation in rat cuneate nucleus. Anesthesiology. 2012;116:415–431. doi: 10.1097/ALN.0b013e318242a801. [DOI] [PubMed] [Google Scholar]
- Ullian EM, Sapperstein SK, Christopherson KS, Barres BA. Control of synapse number by glia. Science. 2001;291:657–661. doi: 10.1126/science.291.5504.657. [DOI] [PubMed] [Google Scholar]
- van der Maaten L, Hinton G. Visualizing Data using t-SNE. J Mach Learn Res. 2008;9:2579–2605. [Google Scholar]
- Winzeler A, Wang JT. Purification and culture of retinal ganglion cells. Cold Spring Harbor protocols. 2013;2013:614–617. doi: 10.1101/pdb.top070961. [DOI] [PubMed] [Google Scholar]
- Yazawa M, Hsueh B, Jia X, Pașca AM, Bernstein JA, Hallmayer J, Dolmetsch RE. Using induced pluripotent stem cells to investigate cardiac phenotypes in Timothy syndrome. Nature. 2011;471:230–234. doi: 10.1038/nature09855. [DOI] [PMC free article] [PubMed] [Google Scholar]
- Zhang Y, Sloan SA, Clarke LE, Caneda C, Plaza CA, Blumenthal PD, Vogel H, Steinberg GK, Edwards MS, Li G, et al. Purification and Characterization of Progenitor and Mature Human Astrocytes Reveals Transcriptional and Functional Differences with Mouse. Neuron. 2016;89:37–53. doi: 10.1016/j.neuron.2015.11.013. [DOI] [PMC free article] [PubMed] [Google Scholar]
Associated Data
This section collects any data citations, data availability statements, or supplementary materials included in this article.