Abstract
The piRNA pathway is a piRNA‐guided retrotransposon silencing system which includes processing of retrotransposon transcripts by PIWI‐piRNAs in secondary piRNA biogenesis. Although several proteins participate in the piRNA pathway, the ones crucial for the cleavage of target RNAs by PIWI‐piRNAs have not been identified. Here, we show that GTSF1, an essential factor for retrotransposon silencing in male germ cells in mice, associates with both MILI and MIWI2, mouse PIWI proteins that function in prospermatogonia. GTSF1 deficiency leads to a severe defect in the production of secondary piRNAs, which are generated from target RNAs of PIWI‐piRNAs. Furthermore, in Gtsf1 mutants, a known target RNA of PIWI‐piRNAs is left unsliced at the cleavage site, and the generation of secondary piRNAs from this transcript is defective. Our findings indicate that GTSF1 is a crucial factor for the slicing of target RNAs by PIWI‐piRNAs and thus affects secondary piRNA biogenesis in prospermatogonia.
Keywords: ping‐pong cycle, piRNAs, PIWI, secondary piRNA biogenesis, transposon silencing
Subject Categories: RNA Biology
Introduction
Retrotransposons are mobile genetic elements that autonomously replicate and insert into the host genome upon their derepression. Retrotransposon activity is potentially threatening for transgenerational genome stability in germ cells and their precursors 1. Thus, the germline has evolved mechanisms to suppress retrotransposons, including the PIWI‐interacting RNA (piRNA) pathway, a small RNA‐guided silencing system 2, 3. A number of piRNA pathway proteins essential for retrotransposon suppression have been identified 4. In mice, PIWI genes encode the core proteins MILI and MIWI2, which play central roles in the piRNA pathway in prospermatogonia, where paternal imprinting and de novo DNA methylation take place 5, 6. piRNA biogenesis largely consists of two pathways: primary and secondary piRNA biogenesis pathways. Primary piRNAs are derived from transcripts including transposons, genic mRNAs, noncoding RNAs, and piRNA clusters, through a processing mechanism that involves the helicase MOV10L1, and characteristically have a uridine at the 5′ end (1U) 7. MILI binds directly to primary piRNAs and processes target RNAs according to the guide sequence of primary piRNAs to generate secondary piRNAs, which often have adenine at 10th nucleotide (10A) because of the 1U in primary piRNAs 8. The generated secondary piRNAs can process target RNAs according to the guide sequence of the secondary piRNAs to reproduce piRNAs having the same sequence as primary piRNAs. This system of repeated piRNA production is called the ping‐pong cycle. The slicer activity of MILI is essential for secondary piRNA biogenesis and the ping‐pong cycle 9. Thus, posttranscriptional silencing of retrotransposons is mediated in part by transcript cleavage and processing 10. Binding of the secondary piRNA to MIWI2 results in the formation of a piRNA‐bound MIWI2 complex that is thought to recognize transposon targets in the host genome and to recruit components, including the catalytically inactive DNA methyltransferase DNMT3L, to silence them by DNA methylation 8. The putative MIWI2 catalytic domain for slicer activity is not required for secondary piRNA biogenesis and transposon suppression 9. Thus, retrotransposons are also silenced pretranscriptionally by epigenetic regulation.
Several piRNA pathway components reside in cytoplasmic granules termed “nuages”, which are germline‐specific organelles that are classified into two distinct types 11. One type consists of MILI‐containing granules, which are intermitochondrial cement‐like granules (or pi‐bodies) that co‐localize with the Tudor protein TDRD1, a direct binding partner of MILI 12, 13, 14. The second type consists of MIWI2‐containing granules, which are processing bodies (or piP‐bodies) that are larger and less abundant than pi‐bodies, and co‐localize with TDRD9, a direct binding partner of MIWI2 15. Several Tudor proteins are known to act as adaptor molecules through their Tudor domains that bind to effector proteins such as PIWI proteins, and are involved in the piRNA pathway 16.
We previously reported that the mouse Gtsf1 gene, which encodes gametocyte‐specific factor 1 (GTSF1), is expressed preferentially in germ cells and that Gtsf1‐null male mice are sterile 17, 18. Detailed analyses of these mice revealed that Gtsf1 is essential for meiosis progression beyond early prophase I during spermatogenesis and that its loss results in elevated expression of long interspersed nucleotide element‐1 (LINE‐1) and intracisternal A‐particle (IAP) retrotransposons, accompanied by demethylation of their promoter regions 18. Therefore, mouse Gtsf1 was identified as a gene involved in retrotransposon suppression in male germ cells. Previously, three groups demonstrated that the Drosophila Gtsf1 protein (also known as DmGTSF1 or Asterix) interacts with Piwi complex and is an essential component of the piRNA‐guided transcriptional silencing complex in ovarian germline and somatic cells 19, 20, 21. However, the role of mouse GTSF1 in the piRNA pathway is currently unclear.
In this study, we demonstrated that GTSF1 is a component of both MILI and MIWI2 complexes, and lack of GTSF1 in mouse prospermatogonia leads to derepressed LINE‐1 and IAP expression, aberrant localization of several major piRNA pathway components, and defective secondary piRNA biogenesis. Further, we observed that a noncoding RNA known to be targeted by piRNAs remained unsliced in Gtsf1 −/− prospermatogonia. These data indicate that GTSF1 has crucial role(s) in secondary piRNA biogenesis by regulating piRNA‐mediated cleavage of target RNAs.
Results
Loss of Gtsf1 leads to derepression of LINE‐1 and IAP in prospermatogonia
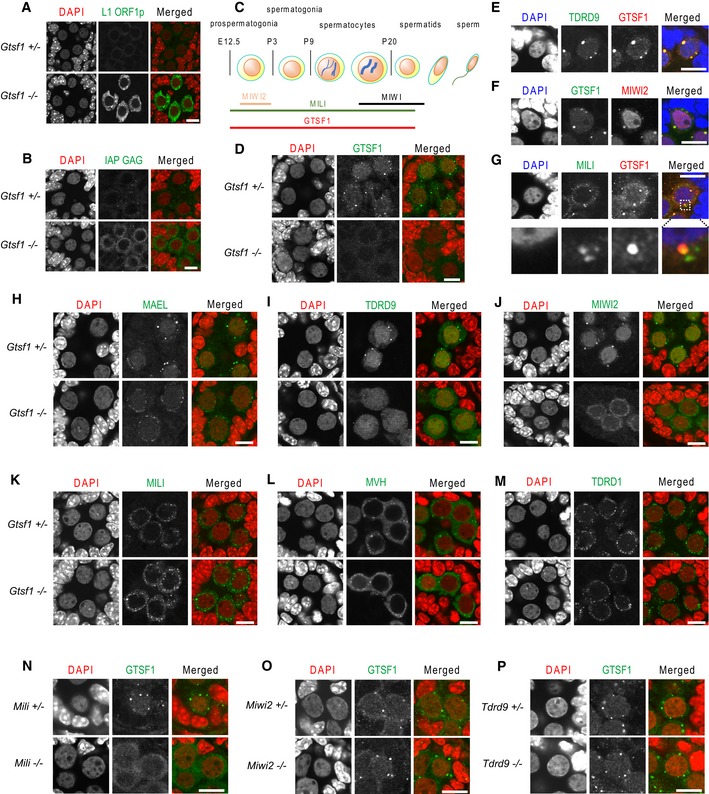
We previously reported that the loss of Gtsf1 leads to the derepression of LINE‐1 and IAP in the testes at postnatal day (P) 14, which precedes the time point at which germ cell defects can be histologically detected 18. Here, we examined LINE‐1 and IAP expression in the earlier developmental stages, embryonic day (E) 17.5, P0, P4, and P8, by immunofluorescence analysis of L1 ORF1p, an active LINE‐1 element protein product 22, and IAP GAG, an IAP protein product 23. Increased LINE‐1 and IAP expression was detected as early as E17.5 in Gtsf1 −/− testes as compared to Gtsf1 +/− testes (Figs 1A and B, and EV1A). These results indicated that GTSF1 is essential for repressing LINE‐1 and IAP expression during the development from prospermatogonia to spermatogonia.
Figure 1. Loss of piP‐body component GTSF1 affects localization of other piP‐body components, whereas loss of pi‐body component MILI affects GTSF1 localization.
-
A, BLoss of Gtsf1 elevates retrotransposon expression in prospermatogonia. Immunostaining of Gtsf1 +/− and Gtsf1 −/− E17.5 testes with anti‐L1 ORF1p (A, green) and anti‐IAP GAG (B, green) antibodies. DNA was stained with 4′,6‐diamidino‐2‐phenylindole (DAPI) (red). Scale bar, 10 μm.
-
C–GGTSF1 localizes to piP‐bodies and nuclei in prospermatogonia. Schematic representation of the timing of expression of Gtsf1 and Piwi family genes in mouse (C). Immunofluorescence analysis of Gtsf1 +/− and Gtsf1 −/− E17.5 prospermatogonia using an anti‐GTSF1 antibody (green) and DAPI (red) for DNA staining (D). GTSF1 localizes to cytoplasmic granules and nuclei. Double staining of GTSF1 with TDRD9 (E), MIWI2 (F), and MILI (G). DNA was stained with DAPI (blue). In (G), lower panels are magnified views of double staining of GTSF1 with MILI in a GTSF1 focus in the upper panel. GTSF1 foci consistently co‐stained with TDRD9 and MIWI2 foci (E, F) and overlapped with MILI foci (G). Scale bar, 10 μm.
-
H–MLoss of Gtsf1 results in abnormal localization of piP‐body components. Immunostaining of Gtsf1 +/− and Gtsf1 −/− E17.5 testes with antibodies to MAEL (H), TDRD9 (I), MIWI2 (J), MILI (K), MVH (L), and TDRD1 (M). DNA was stained with DAPI (red). MIWI2, MAEL, and TDRD9 lost their localization to piP‐bodies in the Gtsf1 −/− prospermatogonia, whereas the localization of MVH, TDRD1, and MILI to pi‐body was unaffected. Nuclear localization of MIWI2 was lost in Gtsf1 −/− prospermatogonia. Scale bar, 10 μm.
-
N–PLoss of Mili, but not of Miwi2 or Tdrd9, abrogates GTSF1 localization to piP‐bodies. Anti‐GTSF1 antibody immunostaining (green) of (N) Mili +/− and Mili −/− E17.5 testes, (O) Miwi2 +/− and Miwi2 −/− E17.5 testes, and (P) Tdrd9 +/− and Tdrd9 −/− E17.5 testes. DNA was stained with DAPI (red). Scale bar, 10 μm.
Figure EV1. Immunofluorescence and electron microscopic analyses of Gtsf1‐deficient testes (related to Fig 1).
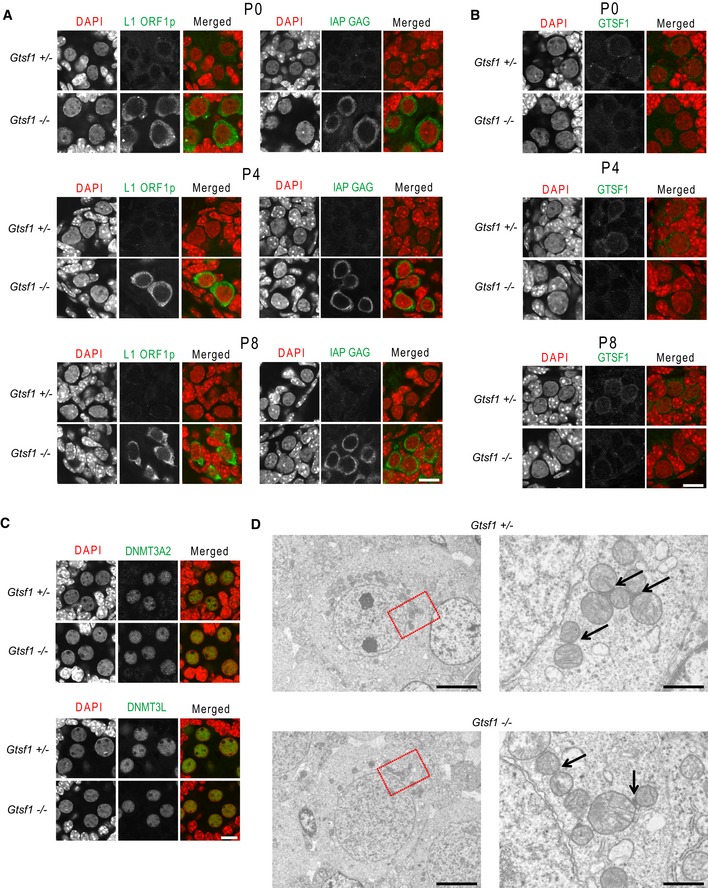
- Elevated expression of LINE‐1 and IAP in early postnatal periods caused by Gtsf1 deficiency. Immunostaining of Gtsf1 +/− and Gtsf1 −/− testes at postnatal days 0, 4, and 8 with antibody to Line‐1 ORF1 protein (left panel, green) and IAP GAG protein (right panel, green). DNA was stained with DAPI (red). Scale bar, 10 μm.
- Expression of GTSF1 in early postnatal periods. Immunostaining of Gtsf1 +/− and Gtsf1 −/− testes at postnatal days 0, 4, and 8 with antibody to GTSF1 (green). DNA was stained with DAPI (red). Scale bar, 10 μm.
- Histological analysis of Gtsf1‐deficiency phenotypes. Immunostaining of Gtsf1 +/− and Gtsf1 −/− E17.5 testes with anti‐DNMT3A2 (upper panel, green) and anti‐DNMT3L (lower panel, green) antibodies. DNA was stained with DAPI (red). Localization of DNMT3L and DNMT3A/3A2 was unaffected in the prenatal Gtsf1 −/− testes. Scale bar, 10 μm.
- Electron microscopy of Gtsf1 +/− (upper panel) and Gtsf1 −/− (lower panel) E17.5 prospermatogonia. Right panels (scale bar, 1 μm) are magnified views of the boxed region in the left panels (scale bar, 5 μm). Arrows indicate intermitochondrial cement.
Mouse GTSF1 localizes to piP‐bodies and nuclei in prospermatogonia
Elevated LINE‐1 and IAP expression in the prospermatogonia of prenatal gonads has also been observed in mice harboring null mutations in the genes encoding piRNA pathway components 9, 24, 25, 26, 27, 28, 29. In prenatal prospermatogonia at E17.5, these components localize to two types of granules, pi‐bodies and piP‐bodies. In Drosophila, DmGTSF1 localizes specifically to the nuclei of ovarian germline and somatic support cells, not to cytoplasmic granules 20, 21.
We previously showed that mouse GTSF1 localizes to cytoplasmic granules in the spermatocytes and spermatids of the adult testes and in the prospermatogonia of E17.5 testes, by immunostaining with anti‐GTSF1 antibody (Fig 1C) 17, 18. To further clarify the localization of GTSF1, we here conducted immunofluorescence analysis using an optimized staining method. We found that GTSF1 localized not only to the cytoplasmic granules but also to the nuclei in the prospermatogonia of E17.5 testes (Fig 1D). At later developmental time points, P0, P4, and P8, cytoplasmic staining was detected although the prominent cytoplasmic GTSF1 foci were gradually lost over time (Fig EV1B). By double immunostaining, we found that the GTSF1 foci completely co‐localized with TDRD9 (Fig 1E) and MIWI2 (Fig 1F) foci, both of which are piP‐body components 11, 15. In contrast, while all GTSF1 foci co‐localized or overlapped with MILI foci, GTSF1 foci appeared to be less abundant than MILI foci (Fig 1G). These observations are consistent with the report that MIWI2 foci co‐stain with or are in close proximity to MILI foci 8. Taken together, these findings suggested that GTSF1 is a component of piP‐bodies in prospermatogonia.
piRNA pathway components of piP‐bodies are mislocalized in Gtsf1‐deficient prospermatogonia
The impact of Gtsf1 disruption on the localization of the piP‐body components, MIWI2, TDRD9, and MAEL, was examined by immunofluorescence analysis of E17.5 Gtsf1 +/− and Gtsf1 −/− testes. MAEL is an evolutionarily conserved protein involved in the piRNA pathway 11, 29. MAEL‐positive granules were clearly observed as large foci in Gtsf1 +/− prospermatogonia, while granules were only weekly stained in Gtsf1 −/− prospermatogonia (Fig 1H). TDRD9‐positive granules were completely lost in Gtsf1 −/− prospermatogonia. However, the uniform nuclear staining of TDRD9 was unchanged (Fig 1I), indicating that GTSF1 is not required for the nuclear localization of TDRD9. Similarly, the nuclear localization of DNMT3L and DNMT3A2, which are essential for de novo DNA methylation of retrotransposons, appeared to be unaffected by Gtsf1 disruption (Fig EV1C). In contrast, the nuclear localization of MIWI2 disappeared in Gtsf1 −/− prospermatogonia, and MIWI2 staining was found only in the cytoplasm, without prominent foci (Fig 1J). Taken together, these findings indicated that GTSF1 deficiency alters the granular localization of MAEL and TDRD9 and severely affects the localization of MIWI2 in prospermatogonia, implying that GTSF1 has a strong influence on the piRNA pathway‐associated components of piP‐bodies.
Next, we examined the effects of Gtsf1 disruption on the localization of the pi‐body components MILI, MVH, and TDRD1. MVH is an evolutionarily conserved helicase that plays an essential role in the piRNA pathway 26. The MILI‐, MVH‐, and TDRD1‐stained granules exhibited similar staining patterns between Gtsf1 +/− and Gtsf1 −/− (Fig 1K–M), but the MILI‐stained granules appeared to be more intensely stained in Gtsf1 −/− than in Gtsf1 +/− prospermatogonia (Fig 1K). The fine structure of pi‐bodies was analyzed by electron microscopy, which showed the presence of electron‐dense intermitochondrial cement in both Gtsf1 +/− and Gtsf1 −/− prospermatogonia (Fig EV1D). These results demonstrated that GTSF1 deficiency appears to have limited impact on the structure of pi‐bodies and the localization of their components.
To further investigate the functional relationship between GTSF1 and the other piRNA pathway components, we examined the subcellular localization of GTSF1 in MILI‐, MIWI2‐, and TDRD9‐deficient prospermatogonia. Notably, cytoplasmic granular localization of GTSF1 was completely lost in prospermatogonia of Mili −/− (Fig 1N), but was unaffected in those of Miwi2 −/− (Fig 1O) and Tdrd9 −/− (Fig 1P) mice. These results indicated that MILI is crucial for GTSF1 localization into piP‐bodies, and therefore may impact the molecular function of GTSF1 in prospermatogonia.
GTSF1 associates with both MILI and MIWI2 complexes
The above findings that GTSF1 localizes to the piP‐bodies (Fig 1E–G) and that loss of GTSF1 leads to mislocalization of the piP‐body components (Fig 1H–J) suggested that GTSF1 interacts with piRNA pathway‐associated granule components. To identify the protein complexes from prenatal or adult testes that can associate with GTSF1, pull‐down experiments were carried out using recombinant full‐length GTSF1‐glutathione S‐transferase (GST)‐fusion proteins (Fig 2A). Complexes from E17.5 testes containing MILI, MIWI2, TDRD1, or TDRD9 interacted with full‐length GTSF1 (Fig 2B lane FL). Similarly, complexes from adult testes containing MILI, MIWI, TDRD1, or TDRD9 interacted with GTSF1 (Fig EV2A lane FL). To identify the region(s) in GTSF1 essential for these interactions, the following truncated GTSF1 derivatives were produced, fused with GST, and used in GST pull‐down experiments (Fig 2A): (i) ΔC, lacking the C‐terminal region; (ii) ZnF, containing only the N‐terminal Zn‐finger region; and (iii) CR, containing only the central region. The results showed that the C‐terminal domain of GTSF1 was not required for interactions with either PIWI or Tudor‐containing complexes (Figs 2B and EV2A) and that the central region of GTSF1 was sufficient for interactions with MILI‐ and MIWI2‐containing complexes (Fig 2B). It is noteworthy that RNase A treatment considerably reduced the interaction of GTSF1 with MIWI2 (Fig 2B), but not with MILI or MIWI complexes (Figs 2B and EV2A), suggesting that RNA in the MIWI2 complex is required for the binding of GTSF1.
Figure 2. GTSF1 interacts with PIWI protein complexes.
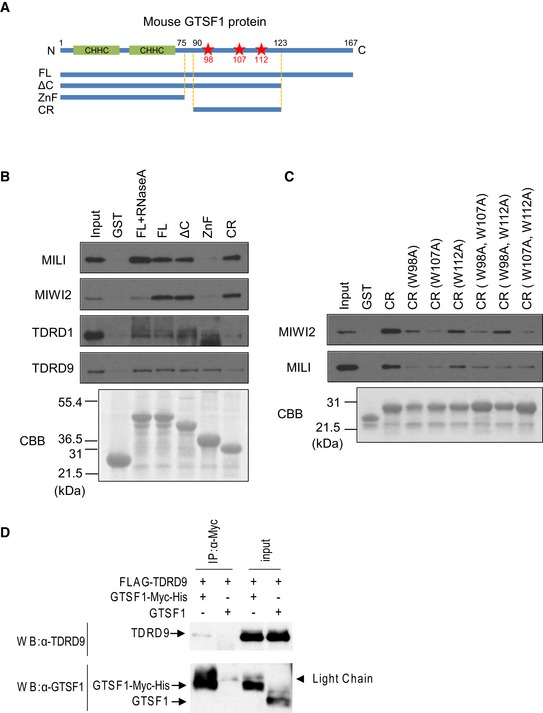
- Schematic illustration of the GTSF1 protein with two N‐terminal CHHC‐type Zn fingers, and the following deletion fragments used to generate GST‐fusion proteins for pull‐down experiments: FL (full length), ΔC (C‐terminal deletion), ZnF (Zn‐finger region), and CR (central region). In addition, CR fragments containing one or two alanine substitutions at W98, W107, or W112 (red stars) were used to generate GST‐fusion proteins for pull‐down analysis.
- GST pull‐down analysis of the interaction of GTSF1 with MILI, MIWI2, TDRD1, or TDRD9. GST‐fusion proteins bound to glutathione sepharose were incubated with E17.5 testis lysates. In some experiments, testis lysates were pretreated with RNase A prior to the incubation with GST‐fusion proteins. The proteins bound to GST‐fusion proteins were analyzed by SDS–PAGE followed by Western blotting with antibodies to MILI, MIWI2, TDRD1, and TDRD9 (upper panels). Coomassie brilliant blue (CBB) staining shows the amount of the GST‐fusion proteins in each of the reactions (lower panels).
- GST pull‐down analysis of the interaction of mutated CR proteins with MILI or MIWI2. GST‐fusion proteins bound to glutathione sepharose were incubated with E17.5 testis lysates. The proteins bound to GST‐fusion proteins were analyzed by SDS–PAGE followed by Western blotting with antibodies to MILI and MIWI2 (upper panels). CBB staining shows the amount of the GST‐fusion proteins in each of the reactions (lower panels).
- Immunoprecipitation analysis of the interaction between GTSF1 and TDRD9. FLAG‐tagged TDRD9 and Myc‐tagged GTSF1 were expressed in HEK293 cells. Cell lysates were immunoprecipitated with an anti‐Myc‐tag antibody, followed by SDS–PAGE and Western blotting analysis using an anti‐TDRD9 or anti‐GTSF1 antibody.
Figure EV2. Analysis of GTSF1‐associated proteins (related to Fig 2).
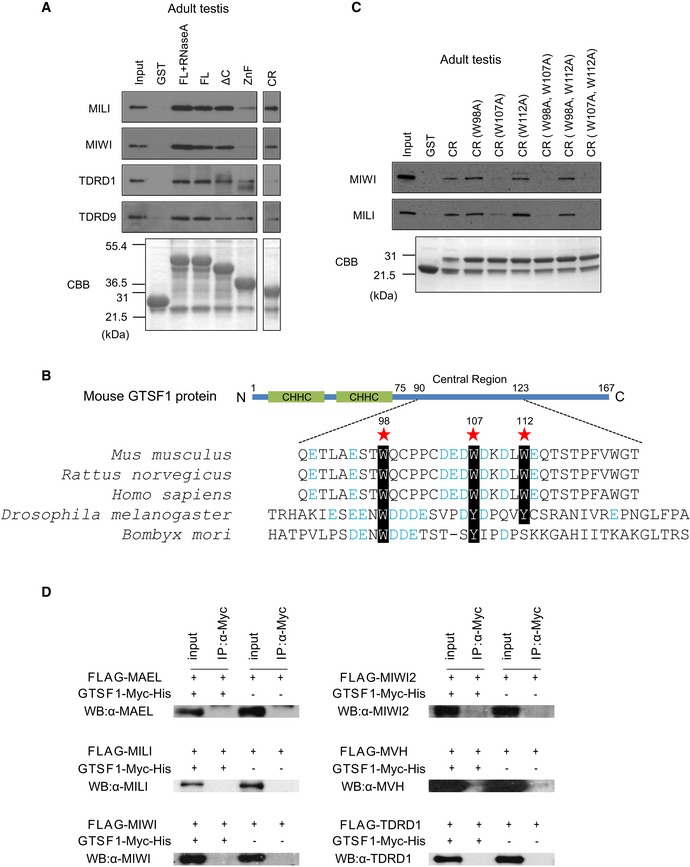
- GST pull‐down analysis of the interaction of GTSF1 with MILI, MIWI, TDRD1, or TDRD9. The GST‐fusion proteins bound to glutathione sepharose were incubated with adult testis lysates. In some experiments, testis lysates were pretreated with RNase A prior to incubation with GST‐fusion proteins. The proteins bound to GST‐fusion proteins were analyzed by SDS–PAGE followed by Western blotting with antibodies to MILI, MIWI, TDRD1, and TDRD9 (upper panels). CBB staining shows the amount of the GST‐fusion proteins in each of the reactions (lower panels).
- Schematic illustration of mouse GTSF1 protein. Amino acid sequences in the central regions of five species, including mouse, are shown. Black‐and‐white inverted characters represent conserved aromatic amino acid residues in the central regions among the species, which were used for alanine substitutions in pull‐down analysis. These aromatic amino acid residues are surrounded by several negatively charged amino acid residues (in blue font).
- GST pull‐down analysis of the interaction of mutated CR proteins with MILI or MIWI complexes. The GST‐fusion proteins bound to glutathione sepharose were incubated with adult testis lysates. The proteins bound to GST‐fusion proteins were analyzed by SDS–PAGE followed by Western blotting with antibodies to MILI and MIWI (upper panels). CBB staining shows the amount of the GST‐fusion proteins in each of the reactions (lower panels).
- Immunoprecipitation analysis of the binding of GTSF1 to several piRNA pathway components. Myc‐tagged GTSF1 was co‐expressed with FLAG‐tagged MAEL, MILI, MIWI, MIWI2, MVH, or His‐tagged TDRD1 in HEK293 cells. Lysates of the transfected cells were immunoprecipitated with an anti‐Myc antibody and separated by SDS–PAGE, followed by Western blotting using the indicated antibodies.
DmGTSF1 interacts with the Piwi complex via its central region, which includes the aromatic residues, tryptophan (W) 89 and tyrosine (Y) 98, which are crucial for interaction with the Piwi complex 20, surrounded by negatively charged amino acids. To identify the residues in mouse GTSF1 that potentially mediate interactions with the PIWI proteins, we searched its amino acid sequence for aromatic residues surrounded by negatively charged amino acids and found three W residues in the CR (Figs 2A and EV2B). We investigated their involvement in interactions with the PIWI complex by generating CR‐GST‐fusion proteins in which either one or two residues were substituted with alanine and using them in pull‐down experiments. The W107A mutation most efficiently abrogated the interaction with the PIWI proteins (Figs 2C and EV2C), suggesting that W107 may be directly or indirectly involved in mediating interactions between GTSF1 and PIWI in mice.
To confirm GTSF1 binding to PIWI complexes, we used liquid chromatography–mass spectrometry (LC‐MS) to evaluate anti‐GTSF1 antibody immunoprecipitates from adult mouse testes. The analysis showed that various piRNA pathway‐related proteins, including PIWI proteins, were recovered in the immunoprecipitates from Gtsf1 +/− testes, but not from Gtsf1 −/− testes or when using normal IgG (Table EV1). Thus, GTSF1 binds to and is a component of PIWI complexes in vivo.
Direct interactions between PIWI and Tudor family proteins have been intensely examined 12, 13, 14, 27, 15, 30. On the other hand, direct interaction between DmGTSF1 and Piwi in ovarian somatic cells has been suggested 20, 21. Here, we examined the direct binding of mouse GTSF1 to other piRNA pathway components by expressing them as tagged proteins in HEK293 or BMT10 cells and then examining their interactions by immunoprecipitation followed by Western blotting analysis. Recombinant GTSF1 bound only to TDRD9 (Fig 2D). We could not detect binding of GTSF1 to MAEL, MILI, MIWI, MIWI2, MVH, or TDRD1 (Fig EV2D). Therefore, mouse GTSF1 may bind to PIWI proteins with the help of or via other factors.
Lack of GTSF1 results in loss of MIWI2‐bound piRNAs
To investigate the impact of GTSF1 deficiency on piRNA biogenesis, we deep‐sequenced total small RNAs from Gtsf1 +/− and Gtsf1 −/− E17.5 testes. We mapped the reads to the mouse reference genome, and their origins were annotated (Dataset EV1; Fig EV3A). The read‐length distribution profiles revealed two discernible groups of small RNAs that represented miRNAs [19–22 nucleotides (nt)] and piRNAs (24–30 nt) in the libraries from both Gtsf1 +/− and Gtsf1 −/− E17.5 testes (Fig EV3B). MILI‐ and MIWI2‐bound piRNAs have different size distributions: from 23 to 30 nt, with a peak at 26–27 nt, and from 24 to 31 nt, with a peak at 28 nt, respectively (Fig 3A) 8. Comparison of the small RNA size profiles of the libraries suggested that the size profile of MIWI2‐bound piRNAs appeared to be ablated in the Gtsf1 −/− libraries although that of MILI‐bound piRNAs appeared to be intact (Fig 3B). This was obvious in small RNAs derived from LINEs and long terminal repeats (LTRs) (Fig 3C). Furthermore, in Gtsf1 −/− E17.5 testes, nuclear MIWI2 staining was lost (Fig 1J). This phenotype is commonly observed in several piRNA pathway mutant mice, in which loading of MIWI2 with piRNAs is compromised 8, 26, 27, 28, 31. Therefore, we hypothesized that MIWI2‐bound piRNA biogenesis would be defective in the absence of GTSF1. Thus, we conducted immunoprecipitation analyses of Gtsf1 +/− and Gtsf1 −/− E17.5 testes using anti‐MILI and anti‐MIWI2 antibodies. The results showed that MIWI2 was not loaded with piRNA in Gtsf1 −/− testes, whereas MILI was (Fig 3D).
Figure EV3. Analysis of deep‐sequencing data obtained from the libraries of total small RNAs and MIWI2‐bound piRNAs (related to Fig 3).
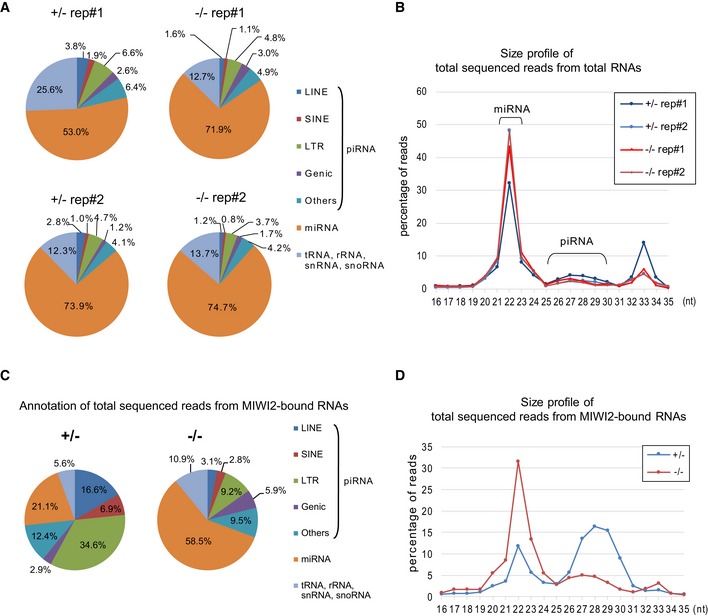
- RNA annotation of total sequenced reads from total RNA libraries prepared from Gtsf1 +/− and Gtsf1 −/− E17.5 testes (n = 2).
- Size profile of total sequenced reads from total RNA libraries prepared from Gtsf1 +/− and Gtsf1 −/− E17.5 testes (n = 2). Shown is the percentage of total reads of each length to total reads of 16–35 nt RNAs.
- RNA annotation of total sequenced reads from MIWI2‐bound RNA libraries prepared from Gtsf1 +/− and Gtsf1 −/− E17.5 testes.
- Size profile of total sequenced reads from MIWI2‐bound RNA libraries prepared from Gtsf1 +/− and Gtsf1 −/− E17.5 testes. Shown is the percentage of total reads of each length in total reads of 16–35 nt MIWI2‐bound RNAs.
Figure 3. Lack of GTSF1 results in loss of MIWI2‐bound piRNAs in prenatal testes.
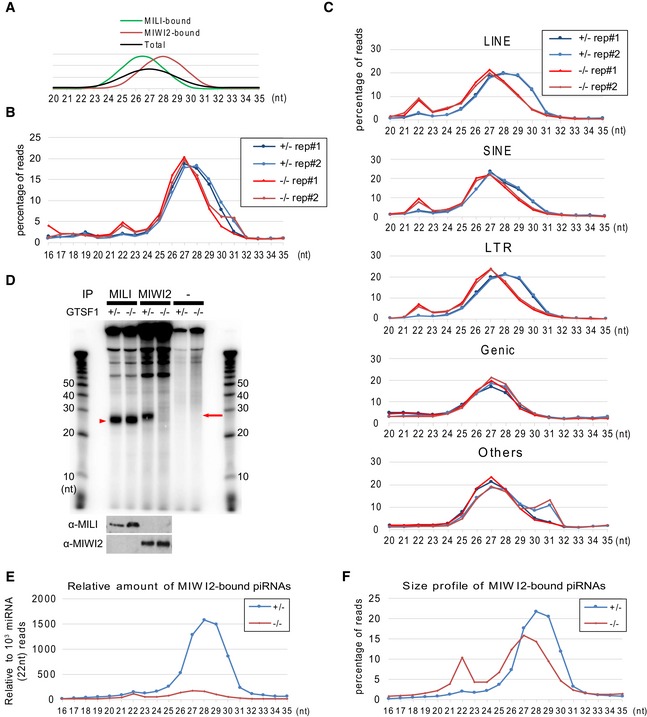
- Schematic illustration depicting size profile of MILI‐ and MIWI2‐bound piRNAs in prospermatogonia.
- Size profile of total small RNAs in duplicated libraries prepared from Gtsf1 +/− and Gtsf1 −/− E17.5 testes. Shown is the percentage of total small RNA read of each length in total reads of 16–35 nt small RNAs.
- Size profile of the small RNAs annotated as LINE, SINE, LTR, genic, and others in total RNA libraries. Shown is the percentage of piRNA reads of each length in total reads of 20–35 nt piRNAs for each annotation.
- Analysis of MILI and MIWI2 piRNA loading. MILI‐ and MIWI2‐piRNA complexes were prepared from Gtsf1 +/− and Gtsf1 −/− E17.5 testes. Immunoprecipitated RNAs were 32P‐end‐labeled and separated in a 15% denaturing urea‐polyacrylamide gel, followed by autoradiography (upper panels). The amount of RNAs for each lane corresponded to that of MILI or MIWI2 complex immunoprecipitated from 7.5 or 16 testes, respectively. Red arrowhead and arrow indicate MILI‐ and MIWI2‐bound piRNAs, respectively. The immunoprecipitated proteins were subjected to Western blotting using an anti‐MILI or ‐MIWI2 antibody (lower panels).
- Relative amounts of MIWI2‐bound piRNAs to 103 reads of 22 nt miRNA in Gtsf1 +/− and Gtsf1 −/− E17.5 testes.
- Size profile of MIWI2‐bound piRNAs. Shown is the percentage of total piRNA reads of each length in the total reads of 16–35 nt piRNAs. Note that the peak of piRNA length in the piRNAs immunoprecipitated with MIWI2 antibody from Gtsf1 −/− E17.5 testes corresponds to that of MILI‐bound piRNA.
To confirm these results, we prepared cDNA libraries of MIWI2‐bound small RNAs from Gtsf1 +/− and Gtsf1 −/− E17.5 testes, and deep‐sequenced them (Dataset EV2; Fig EV3C). In the size profile of total sequenced reads from MIWI2‐bound RNAs of Gtsf1 −/− E17.5 testes, a small piRNA peak was found (Fig EV3D), although the relative amount to 22 nt miRNAs was substantially lower than that of Gtsf1 +/− E17.5 testes (Fig 3E). However, the size profile showed the MILI‐bound piRNA peak (27 nt; Fig 3F) but not the MIWI2‐bound piRNA peak (28 nt). This is probably due to the presence of MILI‐piRNA complexes in anti‐MIWI2 immunoprecipitates, as interaction between these protein complexes has been reported 30. These results suggest that MIWI2‐bound piRNAs are nearly completely absent in Gtsf1 −/− E17.5 testes.
The piRNA amplification cycle is inactive in Gtsf1 −/− testes
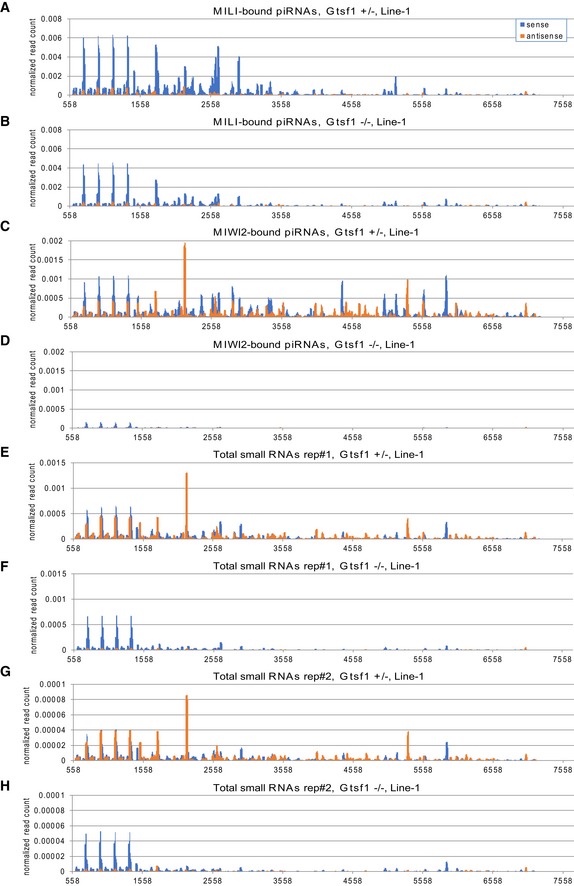
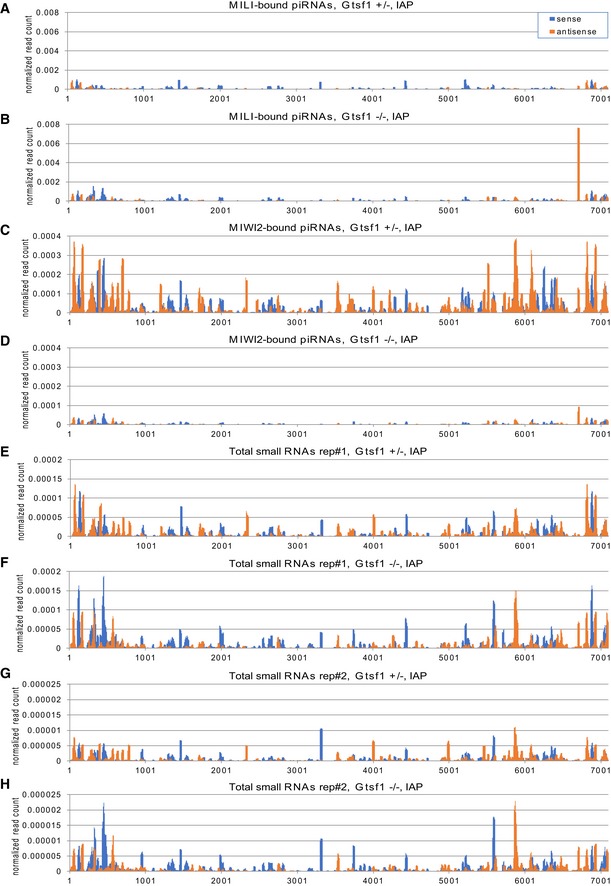
To further delineate the involvement of GTSF1 in piRNA biogenesis, we deep‐sequenced MILI‐bound small RNAs (Dataset EV2; Fig EV4A and B). MILI‐bound piRNAs in Gtsf1 +/− and Gtsf1 −/− E17.5 testes shared the same size profile (Fig EV4C). However, the amount of MILI‐bound piRNAs relative to 22 nt miRNAs was slightly lower in Gtsf1 −/− than in Gtsf1 +/− E17.5 testes (Fig 4A), which is mainly attributed to the lower abundance of transposon‐derived piRNAs (especially LINEs) in Gtsf1 −/− than in Gtsf1 +/− E17.5 testes (Figs 4B, and EV5 and EV6). This observation implies that the absence of MIWI2‐bound piRNAs cannot simply account for their lower abundance in total small RNA libraries derived from Gtsf1 −/− than in those derived from Gtsf1 +/− E17.5 testes (Fig EV4D).
Figure EV4. Analysis of deep‐sequencing data obtained from the libraries of MILI‐bound piRNAs and total small RNAs (related to Fig 4).
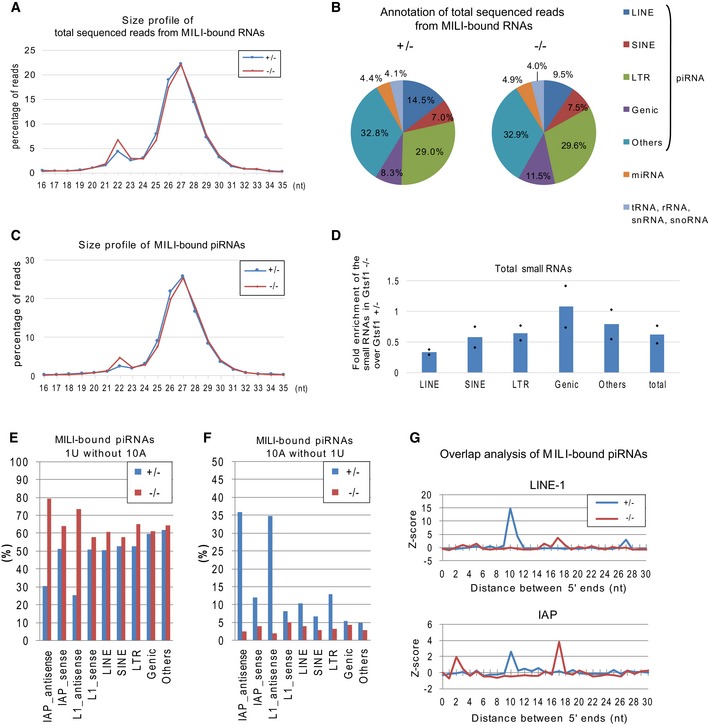
- Size profile of total sequenced reads from MILI‐bound RNA libraries prepared from Gtsf1 +/− and Gtsf1 −/− E17.5 testes. Shown is the percentage of MILI‐bound small RNA reads of each length in total reads of 16–35 nt MILI‐bound RNAs.
- RNA annotation of total sequenced reads from MILI‐bound RNA libraries prepared from Gtsf1 +/− and Gtsf1 −/− E17.5 testes.
- Size profile of the piRNAs in MILI‐bound RNA libraries prepared from Gtsf1 +/− and Gtsf1 −/− E17.5 testes. Shown is the percentage of MILI‐bound piRNA reads of each length in the total reads of 16–35 nt MILI‐bound piRNAs.
- Small RNAs are less abundant in Gtsf1 −/− total small RNA libraries. Shown is the fold enrichment of each annotated piRNA in Gtsf1 −/− over Gtsf1 +/−. Total read number of each annotated piRNA was normalized to that of 22 nt miRNA in the same libraries and plotted relative to its average value in Gtsf1 +/− testes. Bar graphs represent the mean of two biological replicates in each annotated piRNA.
- The 1U signature for primary processing was increased in transposon‐derived piRNAs in the Gtsf1 mutant. Shown is the percentage of small RNAs containing 1U without 10A in each annotated group of MILI‐bound piRNAs from Gtsf1 +/− and Gtsf1 −/− E17.5 testes.
- The 10A ping‐pong signature was lost in transposon‐derived piRNAs under Gtsf1 deficiency. Shown is the percentage of small RNAs containing 10A without 1U in each annotated group of MILI‐bound piRNAs from Gtsf1 +/− and Gtsf1 −/− E17.5 testes.
- Ping‐pong Z‐scores 47 for the significance of the distance between the 5′ ends of complementary MILI‐bound piRNAs for LINE‐1 (upper panel) and IAP (lower panel) from the Gtsf1 −/− and Gtsf1 +/− E17.5 testes.
Figure 4. Lack of GTSF1 causes defects in MILI‐directed piRNA amplification.
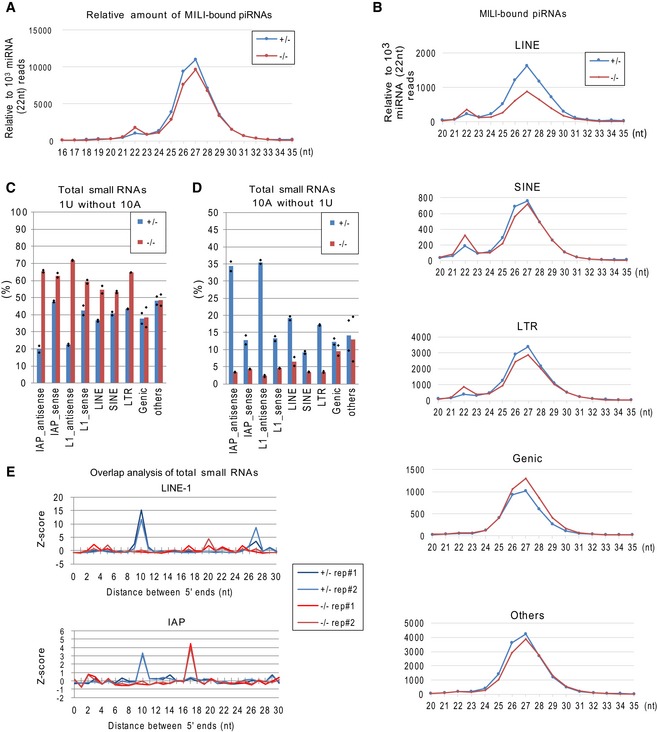
- MILI‐bound piRNAs are slightly less abundant in Gtsf1 −/− than in Gtsf1 +/−. Shown are relative amounts of MILI‐bound piRNAs to 103 reads of 22 nt miRNA in the Gtsf1 +/− and Gtsf1 −/− E17.5 testes.
- MILI‐bound piRNAs for LINE are less abundant in Gtsf1 −/− than in Gtsf1 +/−. Shown are relative amounts of the MILI‐bound piRNAs annotated as LINE, SINE LTR, genic, and others to 103 reads of 22 nt miRNA in Gtsf1 +/− and Gtsf1 −/− E17.5 testes.
- The signature (1U) for primary processing was increased in transposon‐derived piRNAs in the Gtsf1 mutant. Shown is the percentage of small RNAs containing 1U without 10A in each annotated group of total small RNAs from Gtsf1 +/− and Gtsf1 −/− E17.5 testes. Bar graphs represent the mean of two biological replicates in each annotated piRNA.
- Ping‐pong signature (10A) is lost in transposon‐derived piRNAs under Gtsf1 deficiency. Shown is the percentage of small RNAs containing 10A without 1U in each annotated group of total small RNAs from Gtsf1 +/− and Gtsf1 −/− E17.5 testes. Bar graphs represent the mean of two biological replicates in each annotated piRNA.
- Ten‐nucleotide overlap between complementary piRNA pairs is lost under Gtsf1 deficiency. Ping‐pong Z‐scores 47 are shown for the significance of the distance between the 5′ ends of complementary small RNAs for LINE‐1 (upper panel) and IAP (lower panel) from the Gtsf1 −/− and Gtsf1 +/− E17.5 testes. Note that the 10‐nt peaks for LINE‐1 and IAP piRNAs are lost in the libraries from Gtsf1 −/− testes.
Figure EV5. Mapping of small RNAs to LINE‐1 sequence (related to Figs 3 and 4).
-
A–HMapping of small RNAs derived from Gtsf1 +/− (A, C, E, and G) and Gtsf1 −/− (B, D, F, and H) testes to the genomic sequences of LINE‐1 (Accession No. M13002), allowing up to three mismatches. The piRNAs for IAP from MILI‐bound (A, B), MIWI2‐bound (C, D), and two replicates of total (E–H) small RNA libraries were subjected to the analysis. The x‐axis shows the position in M13002 sequence. The y‐axis shows the normalized read count relative to 22 nt miRNAs in the deep‐sequencing data from each library. Sense and antisense reads to retrotransposon transcripts are shown in blue and orange, respectively.
Figure EV6. Mapping of small RNAs to IAP sequence (related to Figs 3 and 4).
-
A–HMapping of piRNAs derived from Gtsf1 +/− (A, C, E, and G) and Gtsf1 −/− (B, D, F, and H) testes to the genomic sequences of IAP (Accession No. M17551), allowing up to three mismatches. The piRNAs for IAP from MILI‐bound (A, B), MIWI2‐bound (C, D), and two replicates of total (E–H) small RNA libraries were subjected to the analysis. The x‐axis shows the position in M17551 sequence. The y‐axis shows the normalized read count relative to 22 nt miRNAs in the deep‐sequencing data from each library. Sense and antisense reads to retrotransposon transcripts are shown in blue and orange, respectively.
Transposon transcripts are a major substrate for the MILI‐directed ping‐pong cycle 8. We reasoned that a defect in the ping‐pong cycle may have caused the decrease in transposon‐derived piRNAs in Gtsf1 −/−. To determine whether lack of GTSF1 affects the ping‐pong cycle, we analyzed the total small RNA and MILI‐bound piRNA sequences in Gtsf1 +/− and Gtsf1 −/− testes by quantifying the amount of piRNAs having 1U, which represents the signature of primary piRNA processing, and the amount of piRNAs with the ping‐pong signature 10A 8. In these libraries, the percentage of repetitive piRNAs [annotated as LINEs, short interspersed nuclear elements (SINEs), or LTRs] with 1U without 10A was higher (Figs 4C and EV4E), while that with 10A without 1U was significantly lower in Gtsf1 −/− than in Gtsf1 +/− E17.5 testes (Figs 4D and EV4F). This trend was especially clear for antisense LINE‐1 and IAP piRNAs, which are mainly produced by secondary piRNA biogenesis (Figs 4D and EV4F). In contrast, the base composition of piRNA sequences corresponding to gene exons (shown as “genic”) appeared to be unaffected in the absence of GTSF1; indeed, these are mainly produced by primary piRNA biogenesis 8. These results indicated that secondary piRNA biogenesis is defective whereas primary biogenesis is still active in the testes of Gtsf1 −/− mice.
Next, we measured the overlap between the 5′ ends of complementary piRNAs from LINE‐1 and IAP. As MILI cleaves the target RNA at the site corresponding to that between the 10th and 11th nucleotides of the guide piRNA, the piRNA pair yielded by the ping‐pong cycle contains a 10‐nt overlap between the 5′ ends. The results showed a peak corresponding to a 10‐nt overlap in the piRNA pairs from Gtsf1 +/−, but not Gtsf1 −/− testes in the total small RNA and MILI‐bound piRNA libraries (Figs 4E and EV4G). Taken together, these data showed that GTSF1 has crucial role(s) in the secondary piRNA biogenesis pathway.
Lack of GTSF1 results in unsliced MILI‐target RNA
GTSF1 is required for the ping‐pong cycle, which comprises multiple steps, such as grasping of the target, slicing it, and loading the resultant piRNA precursor intermediate onto another MILI or MIWI2. When one of these critical steps is impaired, the ping‐pong cycle is disturbed. To elucidate the role of GTSF1 in the ping‐pong cycle, we selected the Rasgrf1 differentially methylated region as a model region in which relationships between piRNA and its target RNA have been clearly identified 32. From this region, a noncoding RNA transcript (pit‐RNA) with two RMER4B retrotransposon fragments is transcribed (Fig 5A, upper panel). A piRNA cluster on chr7 has another RMER4B sequence from which piRNAs targeting two sites (the same sites as those in the two RMER4B retrotransposon fragments) in pit‐RNA are generated. The targeted pit‐RNAs generate secondary piRNAs (shown in −strand in Fig 5B, left panel) that show a 10‐nt overlap (characteristic for ping‐pong cycle) with piRNAs from the chr7 piRNA cluster (shown in +strand in Fig 5B, left panel) 32. According to the exclusive homophilic ping‐pong cycle by MILI in mouse 9, it is conceivable, as a current model, that piRNAs from chr7 piRNA cluster are loaded onto MILI, and the resultant MILI‐piRNA complexes make the pit‐RNA a substrate to produce secondary piRNAs. The deep‐sequencing data showed that a number of MILI‐bound piRNAs were generated from pit‐RNA in both Gtsf1 +/− (311 reads) and Gtsf1 −/− (434 reads) testes (Fig 6, middle panel). The same was observed for total small RNAs in both Gtsf1 +/− (36 reads) and Gtsf1 −/− (42 reads) testes (Fig 5A, lower panel). Further, the 5′ nucleotide of the mapped small RNAs in Gtsf1 −/− testes showed the U bias characteristic for primary piRNAs (Fig 6, middle panel, pie charts; Fig 5A, lower panel, pie charts). By contrast, putative secondary piRNAs generated from the targeted RMER4B sequences in Rasgrf1 were not found in total small RNA libraries from Gtsf1 −/− (Fig 5B, right, −strand; Gtsf1 +/−, 12 reads vs. Gtsf1 −/−, 0 reads). The corresponding piRNAs (+strand) from the chr7 piRNA cluster that target pit‐RNA still existed in Gtsf1 −/− (Fig 5B, right, +strand). These findings are in sharp contrast to those in mice lacking MitoPLD, an essential factor for primary piRNA biogenesis, which lack a large fraction of piRNAs in pit‐RNA region 32. Intriguingly, these putative secondary piRNAs bound to MIWI2 at a high ratio (Fig 6, lower panel, −strand; Gtsf1 +/−, 69 out of 364 reads in pit‐RNA region), while they bound to MILI at a low ratio (Fig 6, middle panel, −strand; Gtsf1 +/−, six out of 311 reads in pit‐RNA region). Considering the high ratio of these putative secondary piRNAs in total small RNAs (12 out of 42 reads in pit‐RNA region), this observation suggested that a large fraction of the piRNAs bind to MIWI2 in a steady state of prospermatogonia at E17.5. Furthermore, consistent with the results in total small RNAs, these putative secondary piRNAs were nearly lost in MILI‐ and MIWI2‐bound piRNA libraries from Gtsf1 −/− (Fig 6, middle and lower panels, −strand; MILI‐bound, Gtsf1 −/−, one out of 434 reads in pit‐RNA region; MIWI2‐bound, Gtsf1 −/−, 0 out of 80 reads in pit‐RNA region). Taken together, these mapping data are consistent with our observation that primary piRNA biogenesis was intact while secondary piRNA biogenesis was impaired in the absence of GTSF1.
Figure 5. A known target RNA (pit‐RNA) of PIWI‐piRNAs is a model transcript undergoing primary and secondary piRNA processing.
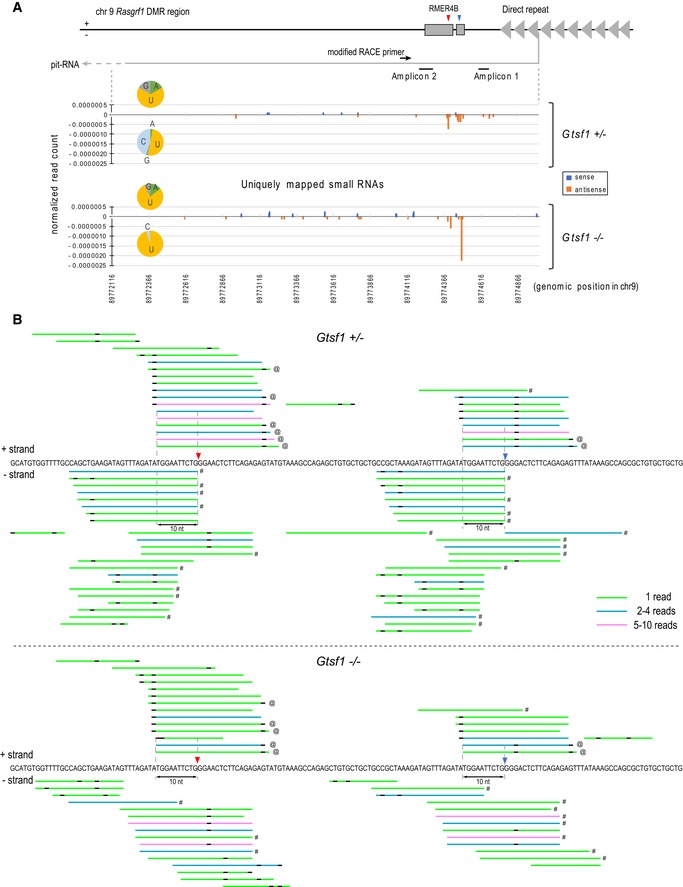
- Schematic illustration of the genomic locus of pit‐RNA in Rasgrf1 DMR region on chr9 (upper panel). Red and blue arrowheads indicate the slicing position of downstream and upstream side in pit‐RNA, respectively. Mapping of small RNAs from Gtsf1 +/− and Gtsf1 −/− E17.5 testes uniquely hits to genomic region transcribing pit‐RNA (lower panel). The x‐axis shows the position in mm9 chr9: 89772116–89775012. The y‐axis shows the normalized read count relative to 22 nt miRNAs in the deep‐sequencing data from each library. “+” and “−” indicate sense and antisense small RNAs, respectively. The number of mapped small RNAs was counted in the position of their 5′ nucleotide. Pit‐RNA is transcribed into minus strand. Pie charts represent the base composition of 5′ nucleotide in mapped small RNAs in each strand. Note that small RNAs derived from pit‐RNAs can be generated without secondary piRNA biogenesis pathway, which is defective in the absence of GTSF1.
- Mapping of small RNAs (rep#2), allowing up to two mismatches, from Gtsf1 +/− and Gtsf1 −/− E17.5 testes in Rasgrf1 RMER4B locus (corresponding to mm9 chr9: 89774351–89774510). Small RNAs are shown in color bars according to the number of same hit sequences. Plus and minus strand hits are shown above and below the sequence, respectively. Black portions of the bar indicate mismatches. Uniquely hit small RNAs on the represented genomic loci are indicated by “#” in the right side of each bar. Uniquely hit small RNAs on chr7 piRNA cluster are indicated by “@” in the right side of each bar. Red and blue arrowheads indicate the slicing position of downstream and upstream side in pit‐RNA, respectively.
Figure 6. Intact primary piRNA biogenesis pathway increases MILI‐bound piRNAs derived from pit‐RNAs in the absence of GTSF1.
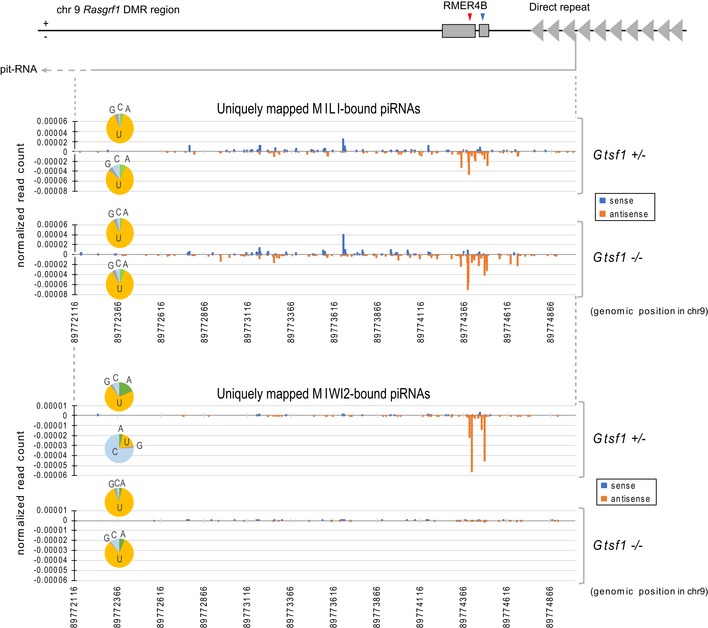
Schematic illustration depicting the genomic locus of pit‐RNA in Rasgrf1 DMR region on chr9 (upper panel). Red or blue arrowhead indicates the slicing position of downstream or upstream side in pit‐RNA, respectively. Uniquely hit MILI (middle panel)‐ and MIWI2 (lower panel)‐bound piRNAs from Gtsf1 +/− and Gtsf1 −/− E17.5 testes were mapped to genomic region transcribing pit‐RNA. The x‐axis shows the position in mm9 chr9: 89772116–89775012. The y‐axis shows the normalized read count relative to 22 nt miRNAs in the deep‐sequencing data from each library. “+” and “−” indicate sense and antisense piRNAs, respectively. The number of mapped piRNAs was counted in the position of their 5′ nucleotide. Pit‐RNA is transcribed in minus strand. Pie charts represent the base composition of the 5′ nucleotide in mapped piRNAs in each strand.
To examine whether pit‐RNAs are sliced at its cleavage site by MILI slicing activity under GTSF1 deficiency, we applied modified RNA ligase‐mediated rapid amplification of cDNA ends (modified RACE) 32. This method specifically detects RNAs with phosphate at their 5′ end, including RNAs cleaved by the MILI‐piRNA complex (Fig 7A). Cleavage of pit‐RNA at the RMER4B site (Fig 5A, red arrow) was observed in Gtsf1 +/+ and Gtsf1 +/−, but not in Gtsf1 −/− testes (Fig 7B, arrow). The results indicated that the slicing activity of MILI‐piRNA complex on pit‐RNAs is largely impaired without GTSF1. Consistent with this, pit‐RNA was increased in Gtsf1 −/− as compared to Gtsf1 +/− testes (Fig 7C), likely because of the lack of pit‐RNAs processed to piRNAs by MILI slicing. Further, the data suggest that pit‐RNAs are also a substrate for primary processing because MILI‐bound piRNAs derived from pit‐RNA region were increased in accordance with the increased substrate (pit‐RNAs) in Gtsf1 −/− as compared to Gtsf1 +/− testes (Fig 6, middle panel). Taken together, these data indicate that compromised secondary piRNA pathway in the absence of GTSF1 is due to a defect in the slicing of target RNAs.
Figure 7. Lack of GTSF1 results in a target RNA (pit‐RNA) unsliced at the cleavage site for MILI‐directed secondary piRNA processing.
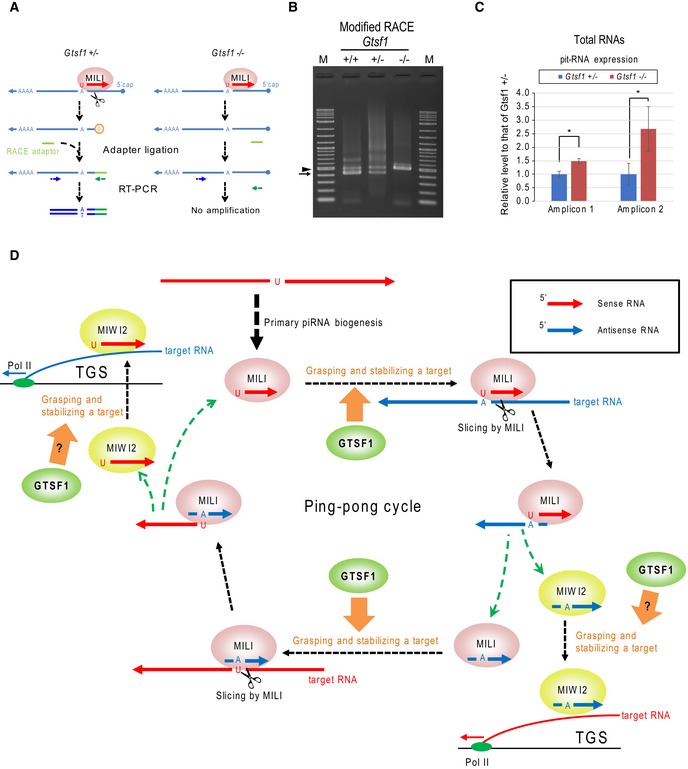
- Schematic illustration of the modified RACE method.
- Modified RACE was used for the detection of pit‐RNA cleaved by MILI. Arrow shows a specific band amplified by nested PCRs (417 bp). Arrowhead shows nonspecific bands. Amplified DNAs were separately purified and sequenced. The same results were obtained in biologically duplicated samples.
- RT–qPCR analysis of pit‐RNA expression in Gtsf1 +/− and Gtsf1 −/− E17.5 testes. Pit‐RNA expression was normalized to Gtsf1l expression 48 and plotted relative to its average expression level in Gtsf1 +/− testes. Error bars represent SD (n = 3). *P < 0.01, Student's t‐test.
- Model of involvement of mouse GTSF1 in the prenatal piRNA pathway. Our data suggest that mouse GTSF1 has crucial role(s) in the step where the PIWI‐piRNA complex grasps and stabilizes a target RNA. Red and blue arrows represent sense and antisense RNAs (including piRNAs, its precursors, or source RNAs), respectively. We propose that mouse GTSF1 is involved in not only posttranscriptional gene silencing (PTGS) with MILI but also transcriptional gene silencing (TGS) with MIWI2.
Discussion
In the present study, we demonstrated that mouse GTSF1 is essential for secondary piRNA biogenesis (ping‐pong cycle), but is not involved in primary piRNA biogenesis. Further, loss of GTSF1 resulted in a defect of piRNA‐mediated cleavage of a specific noncoding RNA (pit‐RNA) in the Rasgrf1 locus, which is one of the targets of the ping‐pong cycle. We concluded that mouse GTSF1 is a crucial factor for the slicing of target RNAs by the PIWI‐piRNA complex in mouse prospermatogonia. Thus, we discovered that GTSF1 is a novel factor, indispensable for understanding the PIWI‐piRNA guiding mechanism, central to and characteristic for the piRNA pathway.
In Drosophila, the Piwi subfamily consists of Piwi, Aub, and Ago3. Aub and Ago3 process retrotransposon transcripts and contribute to ping‐pong piRNA amplification 33, 34. In contrast, Piwi does not participate in the ping‐pong cycle, but translocates to the nucleus when loaded with primary or phased piRNAs, where it mediates the transcriptional silencing of genomic transposons 35, 36. DmGTSF1 interacts with nuclear Piwi complex and coordinately functions in the transcriptional silencing of transposons 20, 21. Therefore, it has been predicted that mouse GTSF1 is an effector of transcriptional gene silencing, but is not crucial for ping‐pong cycle 37, 38. DmGTSF1 is unlikely to be involved in the ping‐pong cycle because (i) DmGTSF1 is not localized to perinuclear nuages, in which the ping‐pong cycle by Aub and Ago takes place, (ii) the absence of DmGTSF1 has no impact on the perinuclear localization of Aub and Ago3, and (iii) lack of DmGTSF1 results in increased sense piRNA level, probably because an intact ping‐pong cycle processes the accumulated sense transposon transcripts 20. Therefore, the function of DmGTSF1 appears to be quite different from that of mouse GTSF1. This diversity in molecular evolution is reminiscent of the contribution of MAEL to piRNA biogenesis, as loss of Mael in Drosophila and in mouse results in intact piRNA biogenesis and abrogated secondary biogenesis, respectively 11, 39. As is the case for GTSF1, the underlying mechanism for this nonconserved effect of Mael deficiency to piRNA biogenesis has not yet been understood.
In the present study, we found that GTSF1 associates with MIWI2 complex (Fig 2B and C) and directly binds to TDRD9 (Fig 2D), likely an essential factor in the MIWI2‐piRNA silencing complex. TDRD9 has been reported as a binding partner of MIWI2 and an essential factor for LINE‐1 silencing 15. The absence of TDRD9 decreases LINE‐1 antisense piRNAs but increases LINE‐1 sense piRNAs, and has no impact on MIWI2 localization and MIWI2‐bound piRNA biogenesis 15, 40. On the other hand, the absence of GTSF1 led to a decrease in LINE‐1 piRNAs of both sense and antisense orientations (Fig EV5A and B), mislocalization of MIWI2 (Fig 1J), and lack of MIWI2‐bound piRNAs (Fig 3D and E). Therefore, the contribution of the two proteins to the piRNA biogenesis is clearly distinct. Alternatively, it is possible that the association between GTSF1 and TDRD9 exerts a function in the transcriptional silencing complex. Both GTSF1 and TDRD9 not only co‐localized in piP‐bodies but also resided in the nuclei (Fig 1E). Furthermore, GTSF1 might affect the function of TDRD9 because the presence of GTSF1 is required for the localization of TDRD9 to piP‐bodies (Fig 1I). We speculate that GTSF1 and TDRD9 coordinately function in the transcriptional silencing complex.
We found that GTSF1 has role(s) at and/or before the step in which the MILI‐piRNA complex exerts its slicing activity on target RNAs. We propose that mouse GTSF1 is involved in the mechanism(s) for stabilizing and/or grasping the target RNA so that MILI‐piRNA can slice it at a specific position (Fig 7D). This model could also apply to the MIWI2‐piRNA silencing complex. Namely, GTSF1 is probably required for the MIWI2‐piRNA silencing complex to stabilize and/or grasp the nascent RNA transcribed from the target genomic locus depending on the guide sequence of piRNA (Fig 7D). We propose this model because it can account for not only the common molecular function of GTSF1 in both MILI‐piRNA and MIWI2‐piRNA complexes, but also the evolutionarily conserved function of GTSF1 in transcriptional retrotransposon silencing and therefore is in line with the previous reports that DmGTSF1 functions with Piwi for the establishment of H3K9me3 at transposon loci 19, 20, 21. However, it remains elusive why DmGTSF1 is not required for Aub‐ and Ago3‐directed secondary processing in Drosophila. Possible explanations are as follows: (i) Aub and Ago3 may have obtained a molecular function independent of DmGTSF1 during evolution, and (ii) either of DmGTSF1 paralogs may be involved in secondary processing instead of DmGTSF1 because knockdown of these paralogs in the germline, in which Aub and Ago3 function, has not been reported to clarify their involvement in transposon control 19, 21. Future studies of the detailed molecular functions of GTSF1 in several model organisms should shed light on the mechanism of the piRNA pathway, including the guiding mechanism of the PIWI‐piRNA complex to target RNAs.
Materials and Methods
Animals
Experiments involving animals were approved by the Animal Care and Use Committee of the Osaka University Graduate School of Medicine (approval Nos. 21‐089 and 25‐061) and carried out in accordance with institutional guidelines. Gtsf1‐, Mili‐, Miwi2‐, and Tdrd9‐knockout mice were reported previously 18, 25, 15, 41.
Antibodies
For immunoprecipitation, rabbit polyclonal anti‐MILI (PM044; MBL, Nagoya, Japan), anti‐MIWI2 (directed against MIWI2‐N1, aa 31–45) 25, and mouse monoclonal anti‐MYC (M047‐3; MBL) antibodies were used. For Western blotting, rabbit polyclonal anti‐MILI (ab36764; Abcam, Cambridge, MA, USA), anti‐MIWI (2079; Cell Signaling, Beverly, MA, USA), anti‐MIWI2 (directed against MIWI2‐C, aa 831–847) 42, anti‐TDRD1 43, and anti‐TDRD9 15 antibodies were used. The following primary antibodies were used for immunofluorescence analysis: rabbit polyclonal anti‐GTSF1 17, anti‐IAP GAG 23, anti‐L1ORF1p (a kind gift from Alex Bortvin), anti‐MILI (ab36764; Abcam), anti‐MIWI2 (a kind gift from Javier Martinez), anti‐MAEL (ab28661; Abcam), anti‐TDRD1 43, anti‐TDRD9 15, anti‐MVH 44, anti‐DNMT3A2 45, and anti‐DNMT3L 45 antibodies. The secondary antibody used was Alexa Fluor 488‐conjugated anti‐rabbit IgG (Molecular Probes, Eugene, OR) for immunofluorescence analysis and horseradish peroxidase‐conjugated goat anti‐rabbit IgG (Dako, Kyoto, Japan) for Western blotting.
GST pull‐down assay
To construct bacterial vectors expressing N‐terminal GST full‐length and truncated GTSF1‐fusion proteins, Gtsf1 cDNA fragments corresponding to aa 1–167 (FL), aa 1–123 (ΔC), aa 1–75 (ZnF), and aa 90–123 (CR) were inserted into pGEX‐6P‐3 (Fig 2A).
To prepare testes lysate, E17.5 and adult testes were homogenized in ten times their volume of lysis buffer [20 mM Tris–HCl (pH 7.5), 150 mM NaCl, and 0.1% Nonidet P‐40] containing protease inhibitor cocktail III (Roche).
GST or GST‐fusion protein expression in Escherichia coli BL21 cells was induced with 1 mM isopropyl β‐D‐1‐thiogalactopyranoside for 3 h at 30°C. The cells were collected, resuspended in lysis buffer [20 mM Tris–HCl (pH 7.5), 1 mM EDTA, 200 mM NaCl, 14 mM 2‐mercaptoethanol, 1 mM phenylmethylsulfonyl fluoride (PMSF), and 50 mg/l lysozyme], incubated on ice for 30 min, and disrupted with a sonicator (Branson, Danbury, CT). After centrifugation at 6,000 × g for 15 min, glutathione sepharose beads (Glutathione Sepharose 4 Fast Flow or 4B; GE Healthcare, Little Chalfont, UK) prewashed with lysis buffer two times were added to the supernatant. GST or GST‐fusion proteins immobilized on glutathione sepharose were incubated with adult testis lysates for 2 h at 4°C and then washed three times with immunoprecipitation buffer [20 mM Tris–HCl (pH 7.5), 150 mM NaCl, and 0.1% Nonidet P‐40]. Bound complexes were eluted by adding sodium dodecyl sulfate (SDS) sample buffer [62.5 mM Tris–HCl (pH 6.8), 2% SDS, 10% glycerol, and 0.01% bromophenol blue] and analyzed by SDS–polyacrylamide gel electrophoresis (PAGE) followed by Western blotting using antibodies against MILI, MIWI, MIWI2, TDRD1, and TDRD9. In experiments for RNA dependence in protein bindings, testis lysates were pretreated with RNase A (40 U/ml) for 5 h on ice and then for 90 min at room temperature prior to incubation with GST‐fusion proteins.
Electron microscopy
E17.5 testes were fixed in 2.5% glutaraldehyde in 0.1 M phosphate buffer (pH 7.3) at 4°C overnight. After postfixation with 1% OsO4, the specimens were dehydrated and embedded in Epon and cut into ultrathin sections. The sections were observed under a JEOL 1010 transmission electron microscope (JEOL, Tokyo, Japan) at 80 kV.
Immunofluorescence analysis
Testes were fixed at 4°C in 2% paraformaldehyde in phosphate‐buffered saline (PBS) for 1 h, followed by three washes with PBS and sequential washes with 10% and 20% sucrose in PBS. The testes were embedded in O.C.T. compound (4583; Sakura Finetek, Torrance, CA, USA). For antigen activation, the sections were incubated with briefly boiled 0.01 M sodium citrate/0.1% Nonidet P‐40 solution for 10 min. For anti‐TDRD9 antigen activation, the sections were incubated with 1 N NaOH at room temperature for 10 min. Then, the sections were blocked with Blocking One (Nakalai Tesque, Kyoto, Japan) or 10% goat serum and 3% BSA in PBS at room temperature for 1 h. Primary and secondary antibodies were diluted in the same buffer as that used for blocking and incubated with the sections at room temperature for 1 h. For double immunostaining with two rabbit antibodies, the sections were further incubated sequentially with either anti‐TDRD9, anti‐MILI, or anti‐GTSF1 antibodies labeled with CF488A dye (Biotium, Hayward, CA, USA) after secondary antibody reaction.
Immunoprecipitation
For direct binding assays of GTSF1 with piRNA pathway components, HEK293 or BMT10 cells subconfluently grown in six‐well plates were transfected with each expression plasmid using Lipofectamine 2000 (Life Technologies, Carlsbad, CA, USA). The cells were lysed in 250 μl lysis buffer [50 mM Tris–HCl (pH 7.2), 2 mM EDTA, 250 mM NaCl, 0.1% Nonidet P‐40, and 10% glycerol] containing protease inhibitor cocktail (Roche, Branchburg, NJ, USA) and centrifuged. The supernatants were incubated with 20 μl agarose conjugated with anti‐MYC‐tag antibody (M047‐8; MBL) or with 50 μl protein G‐coupled magnetic beads (88847; Life Technologies) bound to anti‐MYC‐tag antibody (M047‐3; MBL) at room temperature for 1 h. After three washes with 1 ml of lysis buffer, the immunoprecipitated samples were subjected to Western blotting.
For LC‐MS analysis, 50 μl of protein G‐coupled magnetic beads (10003D, Life Technologies) was washed twice with 600 μl of immunoprecipitation buffer [20 mM Tris–HCl (pH 7.5), 200 mM NaCl, 0.1% Nonidet P‐40] containing protease inhibitor cocktail (Roche). The magnetic beads in 600 μl of the immunoprecipitation buffer were incubated with 15 μg of anti‐GTSF1 antibody or rabbit IgG (ab37415; Abcam) for 1 h at 4°C and washed with 600 μl of the immunoprecipitation buffer twice. The antibody–bead complexes were incubated with protein extracts from testes of 6‐ to 8‐week‐old mice at 4°C for 1 h. After four washes with 800 μl of the immunoprecipitation buffer, the immunoprecipitated samples were eluted with 20 μl of 50 mM glycine (pH 2.8) and neutralized with 2 μl of 2 M Tris–HCl (pH 7.5). The eluted samples were subjected to LC‐MS analysis.
For piRNA detection and small RNA isolation, 30 or 64 testes per genotype from mice at E17.5 were collected for immunoprecipitation of MILI or MIWI2 ribonuclear complexes, respectively. The collected testes were homogenized in lysis buffer [20 mM HEPES (pH 8.0), 150 mM NaCl, 2.5 mM MgCl2, 0.1% Nonidet P‐40, and 1 mM dithiothreitol] containing cOmplete Protease Inhibitor Cocktail (Roche). Ribonuclear complexes were immunoprecipitated using anti‐MILI (MBL) and anti‐MIWI2 (anti‐MIWI2‐N1) antibodies. Then, the samples were subjected to RNA purification using ISOGEN‐LS (Nippon Gene, Tokyo, Japan) and to Western blotting using anti‐MILI (Abcam) and anti‐MIWI2 (anti‐MIWI2‐C) antibodies.
piRNA detection
A portion (1/4) of RNAs immunoprecipitated with anti‐MILI or anti‐MIWI2 antibody for sequencing analyses was labeled with [γ‐32P]‐ATP with T4 polynucleotide kinase at 37°C for 1 h. The labeled RNAs were separated using 15% denaturing PAGE, followed by autoradiography.
LC‐MS analysis
Protein samples were solubilized in 50 mM Tris–HCl (pH 9.0) containing 6 M urea and 5% sodium deoxycholate and reduced with 10 mM dithiothreitol at 37°C for 60 min and alkylated with 55 mM iodoacetamide in the dark at 25°C for 30 min. The reduced and alkylated samples were diluted 10‐fold with 50 mM Tris–HCl (pH 9.0) and digested with trypsin at 37°C for 16 h (trypsin‐to‐protein ratio of 1:20 (w/w)). An equal volume of ethyl acetate was added to each sample solution, and the mixtures were acidified with trifluoroacetic acid at a final concentration of 0.5%. The mixtures were shaken for 1 min and centrifuged at 15,700 × g for 2 min. The aqueous phase was collected. Digested samples were desalted with C18‐StageTips.
LC‐MS was performed using an UltiMate 3000 nano LC system (Thermo Fisher Scientific) coupled to Q‐Exactive hybrid quadrupole‐Orbitrap mass spectrometer (Thermo Fisher Scientific) with a nano‐electrospray ionization source. Digested sample was injected using an autosampler and enriched on a C18 reverse‐phase trap column (100 μm I.D. × 5 mm length; Thermo Fisher Scientific) at a flow rate of 4 μl/min. Subsequently, the sample was resolved on a C18 reverse‐phase column (75 μm I.D. × 150 mm length; Nikkyo Technos, Tokyo, Japan) at a flow rate of 300 nl/min with a linear gradient from 2 to 35% mobile phase B comprised of 95% acetonitrile with 0.1% formic acid. Peptide ionization was conducted using nano‐electrospray ionization in positive ion mode.
To create peak lists on the basis of the recorded fragmentation spectra, raw data files were analyzed using Mascot Distiller v2.3 (Matrix Science, London, UK). Peptide and protein identification was carried out using Mascot v2.3 (Matrix Science) against the UniProt database with a precursor mass tolerance of 10 ppm, a fragment ion mass tolerance of 0.01 Da, and strict trypsin specificity allowing one missed cleavage. Carbamidomethylation of cysteine and oxidation of methionine were allowed as variable modifications.
Modified RACE
RNA ligase‐mediated rapid amplification of cDNA ends was carried out using the GeneRacer Kit (Invitrogen, Carlsbad, CA) with omission of the calf intestine alkaline phosphatase and tobacco acid pyrophosphatase treatment steps 32. Total RNAs (5 μg) isolated from E17.5 testes were ligated to the GeneRacer RNA Oligo as per the manufacturer's protocol. First‐strand cDNA synthesis primed was conducted using SuperScript IV Reverse Transcriptase (Invitrogen) with Oligo(dT)20 primer (Toyobo) as per the manufacturer's protocols. To detect cDNA of cleaved pit‐RNAs ligated with RNA Oligo, initial and nested PCRs were conducted using PrimeSTAR MAX (Takara) or Blend Taq (Toyobo) with the primers listed in Table 1.
Table 1.
Primer list
| Modified RACE | |
|---|---|
| –For initial PCR– | |
| Rasgrf1 modified RACE 1st primer 2 | CAGGAGACTGAACTTATTATACGGGCAA |
| GeneRacer 5′ primer | CGACTGGAGCACGAGGACACTGA |
| –For nested PCR– | |
| Rasgrf1 modified RACE 2nd primer | TACCTTGCCTGGTTTATGTAGAGCTG |
| GeneRacer 5′ nested primer | GGACACTGACATGGACTGAAGGAGTA |
| pit‐RNA expression analysis | |
|---|---|
| –For Amplicon 1 in pit‐RNA– | |
| pit‐RNA 1 S | ACCGCTGCCGCTAAGCTATG |
| pit‐RNA 1 AS | CAGTAGCAGTCGTGGTAGTTGTAG |
| –For Amplicon 2 in pit‐RNA– | |
| pit‐RNA 2 S | GCTATTATTATGTGCCATGTGTAGTAA |
| pit‐RNA 2 AS | CAGCCCCATATTCTGCACCTGAGA |
| –For Gtsf1l expression– | |
| Gtsf1l ex2 qPCR F | TTCACTCCAGAGACCCAAGAGC |
| Gtsf1l ex2 qPCR R | ACGTGGTACACCTCGAAAGGAA |
Quantitative reverse transcription–PCR (RT–qPCR)
RNA was purified from testes of mice at E17.5 using ISOGEN‐LS (Nippon Gene, Tokyo, Japan) or TRIzol reagent (Invitrogen). The purified RNAs were treated with RNase‐free DNase (Promega) and subjected to cDNA synthesis with ReverTra Ace reverse transcriptase (FSK‐101; Toyobo) according to the manufacturer's instructions. The cDNAs were subjected to qPCR using SYBR Green PCR Reagents (Toyobo) on an ABI ViiA7 (Applied Biosystems, Foster, CA, USA) according to the manufacturer's instructions. The thermal cycles were as follows: 60 s at 95°C, followed by 45 cycles of 15 s at 95°C and 45 s at 60°C. Each sample was analyzed in triplicate. The primers used are listed in Table 1. Statistical analysis was performed by Student's t‐test.
Small RNA sequencing
To isolate small RNAs, MILI‐bound, MIWI2‐bound, and total RNAs derived from Gtsf1 +/− and Gtsf1 −/− E17.5 testes were gel‐fractionated. The small RNAs were sequentially ligated to 3′‐ and 5′‐adapters and then amplified by RT–PCR using the TruSeq Small RNA Sample Prep Kit (Illumina, San Diego, CA, USA). The small RNA libraries were sequenced using an Illumina HiSeq 2000 sequencer. The number of raw sequencing reads in each library is shown in Table EV2.
Annotation of small RNAs
Analysis of piRNAs was basically performed as described 46. Briefly, after adaptor sequences were removed from raw read sequences, the retrieved small RNA reads were mapped to the mouse genome (mm9) using Bowtie. Only perfectly matched reads were used for annotation. They were mapped to known RNAs allowing two mismatches (rRNA, tRNA, small nuclear [sn]RNA, and small nucleolar [sno]RNA) or without allowing mismatch [miRNA, SINE, LINE, LTR, and genic (gene exon)]. Reads not annotated as any of the above categories were classified as “others”. The reads were annotated using the following order of priority (rRNA, tRNA, snRNA, and snoRNA > miRNA > SINE > LTR > LINE > genic). miRNA sequences were downloaded from miRBase (http://www.mirbase.org/). We used Ensemble genes for genic sequences. Other sequences were based on RepeatMasker annotation and were downloaded using UCSC Table Browser.
Ten‐nucleotide overlap analyses
Small RNAs annotated as LINEs or LTRs were mapped to a representative L1_MdA or IAP1 sequence (L1_MdA; M13002, IAP1; M17551), respectively. Three mismatches were allowed for mapping. A Z‐score was calculated as reported by Zhang et al 47.
Accession numbers
The small RNA sequences are registered in DDBJ sequence read archive (DRA) with the following accession numbers: DRA0006245–DRA0006252.
Author contributions
TY conceived and designed the experiments. TW conducted bioinformatic analyses. TY analyzed the sequence data. TY, SK‐M, and YS carried out purification of PIWI‐bound piRNAs. SK‐M and YS carried out piRNA detection. NT performed pull‐down assays and prepared the sample for mass spectrometry. TY performed immunohistochemical experiments. SK‐M helped in immunohistochemistry. TW conceived the modified RACE method. TY carried out modified RACE and RT–qPCR. AKu and MK‐A carried out electron microscopic experiments. FT and SM helped in pull‐down assay. SK‐M, AKa, and SC helped in immunohistochemistry. TY wrote the manuscript. TW and JM helped in writing the manuscript. JM managed the study.
Conflict of interest
The authors declare that they have no conflict of interest.
Supporting information
Expanded View Figures PDF
Dataset EV1
Dataset EV2
Table EV1
Table EV2
Review Process File
Acknowledgements
We acknowledge the support of Tatsuya Tanaka, Kazuaki Takafuji, Saki Ishino, and Tae Ando (Center for Medical Innovation and Translational Research, Osaka University), and Eiji Oiki (Center for Medical Research and Education, Graduate School of Medicine, Osaka University). Deep sequencing was conducted at Hokkaido System Science Co., Ltd. and Yale Stem Cell Center Genomics Core Facility supported by the Connecticut Regenerative Medicine Research Fund and the Li Ka Shing Foundation. We are grateful to Drs. Alex Bortvin (L1 ORF1p), Bryan R. Cullen (IAP GAG), Toshiaki Noce (MVH), Javier Martinez (MIWI2), and Shoji Tajima (DNMT3A2 and DNMT3L) for their kind gifts of antibodies. We appreciate Dr. Toru Nakano for providing helpful comments on the manuscript. We thank Masafumi Ashida and Sachie Matsubara for excellent technical assistance. This research was supported by Grants‐in‐Aid for Scientific Research (JP23790225 and JP17K08632 to T.Y.) from Japan Society for the Promotion of Science.
EMBO Reports (2018) 19: e42054 29437694
References
- 1. Crichton JH, Dunican DS, Maclennan M, Meehan RR, Adams IR (2014) Defending the genome from the enemy within: mechanisms of retrotransposon suppression in the mouse germline. Cell Mol Life Sci 71: 1581–1605 [DOI] [PMC free article] [PubMed] [Google Scholar]
- 2. Bortvin A (2013) PIWI‐interacting RNAs (piRNAs) – a mouse testis perspective. Biochemistry (Mosc) 78: 592–602 [DOI] [PubMed] [Google Scholar]
- 3. Chuma S, Nakano T (2013) piRNA and spermatogenesis in mice. Philos Trans R Soc Lond B Biol Sci 368: 20110338 [DOI] [PMC free article] [PubMed] [Google Scholar]
- 4. Iwasaki YW, Siomi MC, Siomi H (2015) PIWI‐interacting RNA: its biogenesis and functions. Annu Rev Biochem 84: 405–433 [DOI] [PubMed] [Google Scholar]
- 5. Lees‐Murdock DJ, De Felici M, Walsh CP (2003) Methylation dynamics of repetitive DNA elements in the mouse germ cell lineage. Genomics 82: 230–237 [DOI] [PubMed] [Google Scholar]
- 6. Li JY, Lees‐Murdock DJ, Xu GL, Walsh CP (2004) Timing of establishment of paternal methylation imprints in the mouse. Genomics 84: 952–960 [DOI] [PubMed] [Google Scholar]
- 7. Vourekas A, Zheng K, Fu Q, Maragkakis M, Alexiou P, Ma J, Pillai RS, Mourelatos Z, Wang PJ (2015) The RNA helicase MOV10L1 binds piRNA precursors to initiate piRNA processing. Genes Dev 29: 617–629 [DOI] [PMC free article] [PubMed] [Google Scholar]
- 8. Aravin AA, Sachidanandam R, Bourc'his D, Schaefer C, Pezic D, Toth KF, Bestor T, Hannon GJ (2008) A piRNA pathway primed by individual transposons is linked to de novo DNA methylation in mice. Mol Cell 31: 785–799 [DOI] [PMC free article] [PubMed] [Google Scholar]
- 9. De Fazio S, Bartonicek N, Di Giacomo M, Abreu‐Goodger C, Sankar A, Funaya C, Antony C, Moreira PN, Enright AJ, O'Carroll D (2011) The endonuclease activity of Mili fuels piRNA amplification that silences LINE1 elements. Nature 480: 259–263 [DOI] [PubMed] [Google Scholar]
- 10. Aravin AA, Hannon GJ, Brennecke J (2007) The Piwi‐piRNA pathway provides an adaptive defense in the transposon arms race. Science 318: 761–764 [DOI] [PubMed] [Google Scholar]
- 11. Aravin AA, van der Heijden GW, Castaneda J, Vagin VV, Hannon GJ, Bortvin A (2009) Cytoplasmic compartmentalization of the fetal piRNA pathway in mice. PLoS Genet 5: e1000764 [DOI] [PMC free article] [PubMed] [Google Scholar]
- 12. Wang J, Saxe JP, Tanaka T, Chuma S, Lin H (2009) Mili interacts with tudor domain‐containing protein 1 in regulating spermatogenesis. Curr Biol 19: 640–644 [DOI] [PMC free article] [PubMed] [Google Scholar]
- 13. Reuter M, Chuma S, Tanaka T, Franz T, Stark A, Pillai RS (2009) Loss of the Mili‐interacting Tudor domain‐containing protein‐1 activates transposons and alters the Mili‐associated small RNA profile. Nat Struct Mol Biol 16: 639–646 [DOI] [PubMed] [Google Scholar]
- 14. Kojima K, Kuramochi‐Miyagawa S, Chuma S, Tanaka T, Nakatsuji N, Kimura T, Nakano T (2009) Associations between PIWI proteins and TDRD1/MTR‐1 are critical for integrated subcellular localization in murine male germ cells. Genes Cells 14: 1155–1165 [DOI] [PubMed] [Google Scholar]
- 15. Shoji M, Tanaka T, Hosokawa M, Reuter M, Stark A, Kato Y, Kondoh G, Okawa K, Chujo T, Suzuki T et al (2009) The TDRD9‐MIWI2 complex is essential for piRNA‐mediated retrotransposon silencing in the mouse male germline. Dev Cell 17: 775–787 [DOI] [PubMed] [Google Scholar]
- 16. Pek JW, Anand A, Kai T (2012) Tudor domain proteins in development. Development 139: 2255–2266 [DOI] [PubMed] [Google Scholar]
- 17. Yoshimura T, Miyazaki T, Toyoda S, Miyazaki S, Tashiro F, Yamato E, Miyazaki J (2007) Gene expression pattern of Cue110: a member of the uncharacterized UPF0224 gene family preferentially expressed in germ cells. Gene Expr Patterns 8: 27–35 [DOI] [PubMed] [Google Scholar]
- 18. Yoshimura T, Toyoda S, Kuramochi‐Miyagawa S, Miyazaki T, Miyazaki S, Tashiro F, Yamato E, Nakano T, Miyazaki J (2009) Gtsf1/Cue110, a gene encoding a protein with two copies of a CHHC Zn‐finger motif, is involved in spermatogenesis and retrotransposon suppression in murine testes. Dev Biol 335: 216–227 [DOI] [PubMed] [Google Scholar]
- 19. Muerdter F, Guzzardo PM, Gillis J, Luo Y, Yu Y, Chen C, Fekete R, Hannon GJ (2013) A genome‐wide RNAi screen draws a genetic framework for transposon control and primary piRNA biogenesis in Drosophila . Mol Cell 50: 736–748 [DOI] [PMC free article] [PubMed] [Google Scholar]
- 20. Donertas D, Sienski G, Brennecke J (2013) Drosophila Gtsf1 is an essential component of the Piwi‐mediated transcriptional silencing complex. Genes Dev 27: 1693–1705 [DOI] [PMC free article] [PubMed] [Google Scholar]
- 21. Ohtani H, Iwasaki YW, Shibuya A, Siomi H, Siomi MC, Saito K (2013) DmGTSF1 is necessary for Piwi‐piRISC‐mediated transcriptional transposon silencing in the Drosophila ovary. Genes Dev 27: 1656–1661 [DOI] [PMC free article] [PubMed] [Google Scholar]
- 22. Branciforte D, Martin SL (1994) Developmental and cell type specificity of LINE‐1 expression in mouse testis: implications for transposition. Mol Cell Biol 14: 2584–2592 [DOI] [PMC free article] [PubMed] [Google Scholar]
- 23. Bogerd HP, Wiegand HL, Doehle BP, Lueders KK, Cullen BR (2006) APOBEC3A and APOBEC3B are potent inhibitors of LTR‐retrotransposon function in human cells. Nucleic Acids Res 34: 89–95 [DOI] [PMC free article] [PubMed] [Google Scholar]
- 24. Frost RJ, Hamra FK, Richardson JA, Qi X, Bassel‐Duby R, Olson EN (2010) MOV10L1 is necessary for protection of spermatocytes against retrotransposons by Piwi‐interacting RNAs. Proc Natl Acad Sci USA 107: 11847–11852 [DOI] [PMC free article] [PubMed] [Google Scholar]
- 25. Kuramochi‐Miyagawa S, Watanabe T, Gotoh K, Totoki Y, Toyoda A, Ikawa M, Asada N, Kojima K, Yamaguchi Y, Ijiri TW et al (2008) DNA methylation of retrotransposon genes is regulated by Piwi family members MILI and MIWI2 in murine fetal testes. Genes Dev 22: 908–917 [DOI] [PMC free article] [PubMed] [Google Scholar]
- 26. Kuramochi‐Miyagawa S, Watanabe T, Gotoh K, Takamatsu K, Chuma S, Kojima‐Kita K, Shiromoto Y, Asada N, Toyoda A, Fujiyama A et al (2010) MVH in piRNA processing and gene silencing of retrotransposons. Genes Dev 24: 887–892 [DOI] [PMC free article] [PubMed] [Google Scholar]
- 27. Pandey RR, Tokuzawa Y, Yang Z, Hayashi E, Ichisaka T, Kajita S, Asano Y, Kunieda T, Sachidanandam R, Chuma S et al (2013) Tudor domain containing 12 (TDRD12) is essential for secondary PIWI interacting RNA biogenesis in mice. Proc Natl Acad Sci USA 110: 16492–16497 [DOI] [PMC free article] [PubMed] [Google Scholar]
- 28. Zheng K, Xiol J, Reuter M, Eckardt S, Leu NA, McLaughlin KJ, Stark A, Sachidanandam R, Pillai RS, Wang PJ (2010) Mouse MOV10L1 associates with Piwi proteins and is an essential component of the Piwi‐interacting RNA (piRNA) pathway. Proc Natl Acad Sci USA 107: 11841–11846 [DOI] [PMC free article] [PubMed] [Google Scholar]
- 29. Soper SFC, van der Heijden GW, Hardiman TC, Goodheart M, Martin SL, de Boer P, Bortvin A (2008) Mouse maelstrom, a component of nuage, is essential for spermatogenesis and transposon repression in meiosis. Dev Cell 15: 285–297 [DOI] [PMC free article] [PubMed] [Google Scholar]
- 30. Vagin VV, Wohlschlegel J, Qu J, Jonsson Z, Huang X, Chuma S, Girard A, Sachidanandam R, Hannon GJ, Aravin AA (2009) Proteomic analysis of murine Piwi proteins reveals a role for arginine methylation in specifying interaction with Tudor family members. Genes Dev 23: 1749–1762 [DOI] [PMC free article] [PubMed] [Google Scholar]
- 31. Xiol J, Cora E, Koglgruber R, Chuma S, Subramanian S, Hosokawa M, Reuter M, Yang Z, Berninger P, Palencia A et al (2012) A role for Fkbp6 and the chaperone machinery in piRNA amplification and transposon silencing. Mol Cell 47: 970–979 [DOI] [PubMed] [Google Scholar]
- 32. Watanabe T, Tomizawa S, Mitsuya K, Totoki Y, Yamamoto Y, Kuramochi‐Miyagawa S, Iida N, Hoki Y, Murphy PJ, Toyoda A et al (2011) Role for piRNAs and noncoding RNA in de novo DNA methylation of the imprinted mouse Rasgrf1 locus. Science 332: 848–852 [DOI] [PMC free article] [PubMed] [Google Scholar]
- 33. Brennecke J, Aravin AA, Stark A, Dus M, Kellis M, Sachidanandam R, Hannon GJ (2007) Discrete small RNA‐generating loci as master regulators of transposon activity in Drosophila . Cell 128: 1089–1103 [DOI] [PubMed] [Google Scholar]
- 34. Gunawardane LS, Saito K, Nishida KM, Miyoshi K, Kawamura Y, Nagami T, Siomi H, Siomi MC (2007) A slicer‐mediated mechanism for repeat‐associated siRNA 5′ end formation in Drosophila . Science 315: 1587–1590 [DOI] [PubMed] [Google Scholar]
- 35. Mohn F, Handler D, Brennecke J (2015) Noncoding RNA. piRNA‐guided slicing specifies transcripts for Zucchini‐dependent, phased piRNA biogenesis. Science 348: 812–817 [DOI] [PMC free article] [PubMed] [Google Scholar]
- 36. Han BW, Wang W, Li C, Weng Z, Zamore PD (2015) Noncoding RNA. piRNA‐guided transposon cleavage initiates Zucchini‐dependent, phased piRNA production. Science 348: 817–821 [DOI] [PMC free article] [PubMed] [Google Scholar]
- 37. Xiol J, Spinelli P, Laussmann MA, Homolka D, Yang Z, Cora E, Coute Y, Conn S, Kadlec J, Sachidanandam R et al (2014) RNA clamping by Vasa assembles a piRNA amplifier complex on transposon transcripts. Cell 157: 1698–1711 [DOI] [PubMed] [Google Scholar]
- 38. Yu Y, Gu J, Jin Y, Luo Y, Preall JB, Ma J, Czech B, Hannon GJ (2015) Panoramix enforces piRNA‐dependent cotranscriptional silencing. Science 350: 339–342 [DOI] [PMC free article] [PubMed] [Google Scholar]
- 39. Sienski G, Donertas D, Brennecke J (2012) Transcriptional silencing of transposons by Piwi and maelstrom and its impact on chromatin state and gene expression. Cell 151: 964–980 [DOI] [PMC free article] [PubMed] [Google Scholar]
- 40. Wenda JM, Homolka D, Yang Z, Spinelli P, Sachidanandam R, Pandey RR, Pillai RS (2017) Distinct roles of RNA helicases MVH and TDRD9 in PIWI slicing‐triggered mammalian piRNA biogenesis and function. Dev Cell 41: 623–637.e629 [DOI] [PMC free article] [PubMed] [Google Scholar]
- 41. Kuramochi‐Miyagawa S, Kimura T, Ijiri TW, Isobe T, Asada N, Fujita Y, Ikawa M, Iwai N, Okabe M, Deng W et al (2004) Mili, a mammalian member of piwi family gene, is essential for spermatogenesis. Development 131: 839–849 [DOI] [PubMed] [Google Scholar]
- 42. Shiromoto Y, Kuramochi‐Miyagawa S, Daiba A, Chuma S, Katanaya A, Katsumata A, Nishimura K, Ohtaka M, Nakanishi M, Nakamura T et al (2013) GPAT2, a mitochondrial outer membrane protein, in piRNA biogenesis in germline stem cells. RNA 19: 803–810 [DOI] [PMC free article] [PubMed] [Google Scholar]
- 43. Chuma S, Hosokawa M, Kitamura K, Kasai S, Fujioka M, Hiyoshi M, Takamune K, Noce T, Nakatsuji N (2006) Tdrd1/Mtr‐1, a tudor‐related gene, is essential for male germ‐cell differentiation and nuage/germinal granule formation in mice. Proc Natl Acad Sci USA 103: 15894–15899 [DOI] [PMC free article] [PubMed] [Google Scholar]
- 44. Toyooka Y, Tsunekawa N, Takahashi Y, Matsui Y, Satoh M, Noce T (2000) Expression and intracellular localization of mouse Vasa‐homologue protein during germ cell development. Mech Dev 93: 139–149 [DOI] [PubMed] [Google Scholar]
- 45. Sakai Y, Suetake I, Shinozaki F, Yamashina S, Tajima S (2004) Co‐expression of de novo DNA methyltransferases Dnmt3a2 and Dnmt3L in gonocytes of mouse embryos. Gene Expr Patterns 5: 231–237 [DOI] [PubMed] [Google Scholar]
- 46. Watanabe T, Totoki Y, Sasaki H, Minami N, Imai H (2007) Analysis of small RNA profiles during development. Methods Enzymol 427: 155–169 [DOI] [PubMed] [Google Scholar]
- 47. Zhang Z, Xu J, Koppetsch BS, Wang J, Tipping C, Ma SM, Weng ZP, Theurkauf WE, Zamore PD (2011) Heterotypic piRNA ping‐pong requires Qin, a protein with both E3 ligase and tudor domains. Mol Cell 44: 572–584 [DOI] [PMC free article] [PubMed] [Google Scholar]
- 48. Takemoto N, Yoshimura T, Miyazaki S, Tashiro F, Miyazaki J (2016) Gtsf1l and Gtsf2 are specifically expressed in gonocytes and spermatids but are not essential for spermatogenesis. PLoS One 11: e0150390 [DOI] [PMC free article] [PubMed] [Google Scholar]
Associated Data
This section collects any data citations, data availability statements, or supplementary materials included in this article.
Supplementary Materials
Expanded View Figures PDF
Dataset EV1
Dataset EV2
Table EV1
Table EV2
Review Process File


