

Abstract
Levels and patterns of genetic diversity can provide insights into a population’s history. In species with sex chromosomes, differences between genomic regions with unique inheritance patterns can be used to distinguish between different sets of possible demographic and selective events. This review introduces the differences in population history for sex chromosomes and autosomes, provides the expectations for genetic diversity across the genome under different evolutionary scenarios, and gives an introductory description for how deviations in these expectations are calculated and can be interpreted. Predominantly, diversity on the sex chromosomes has been used to explore and address three research areas: 1) Mating patterns and sex-biased variance in reproductive success, 2) signatures of selection, and 3) evidence for modes of speciation and introgression. After introducing the theory, this review catalogs recent studies of genetic diversity on the sex chromosomes across species within the major research areas that sex chromosomes are typically applied to, arguing that there are broad similarities not only between male-heterogametic (XX/XY) and female-heterogametic (ZZ/ZW) sex determination systems but also any mating system with reduced recombination in a sex-determining region. Further, general patterns of reduced diversity in nonrecombining regions are shared across plants and animals. There are unique patterns across populations with vastly different patterns of mating and speciation, but these do not tend to cluster by taxa or sex determination system.
Keywords: diversity, natural selection, demography, U/V sex determination, female heterogamety, male heterogamety
Introduction
Genetic diversity refers to variations in DNA between individuals in a population. Instead of studying the absolute number of individuals in a population, the census population size, studies of genetic diversity only capture signals of genetic variation from individuals in the population who passed on their genetic material, the effective population size, Ne (Wright 1931). The effective population sizes of males and females can be different if there is sex-bias in reproductive success, and together these affect the sex-averaged effective population size (Caballero 1995). Further, the effective population size of different genomic regions will vary if any region is inherited in a sex-biased or sex-exclusive manner. In animals with chromosomal sex determination there are typically four genomic regions in which diversity can be investigated: The autosomes, the mitochondrial DNA (mtDNA), and the sex chromosomes, typically X and Y or Z and W (Boxes 1 and 2). In plants, there is additionally the chloroplast genome. An example of computing genetic diversity is shown in Box 2. A benefit is that the variations in diversity between genomic regions, relative to neutral equilibrium expectations (fig. 1), can be used to distinguish between alternative demographic scenarios. A limitation is that typically there is not a homologous recombination across part or all of the Y or W chromosome, nor on the mtDNA, so effectively, each of these regions adds only a single linked marker to the analysis (Balloux 2010). The mtDNA has an added complication of sometimes being heteroplasmic, which will not be discussed here, but on which there is a growing literature (Payne et al. 2013; Rebolledo-Jaramillo et al. 2014). The first half of this review presents the expectations for patterns of neutral diversity under equilibrium (equal contributions of the sexes) extended with how selection and demography can alter these expectations. Then empirical observations of diversity on sex chromosomes across species are discussed, including how these fit, or deviate from, neutral expectations. In particular, one highlight of this review is that even with the mounting genomic data, most analyses of diversity on the sex chromosomes do not yet adequately distinguish between neutral and selective explanations for the observed data. Rather most studies that include genetic variation on the sex chromosomes address just one of these three areas: 1) Mating patterns and sex-biased variance in reproductive success, 2) signatures of selection, and 3) evidence for modes of speciation and introgression.
Fig. 1.
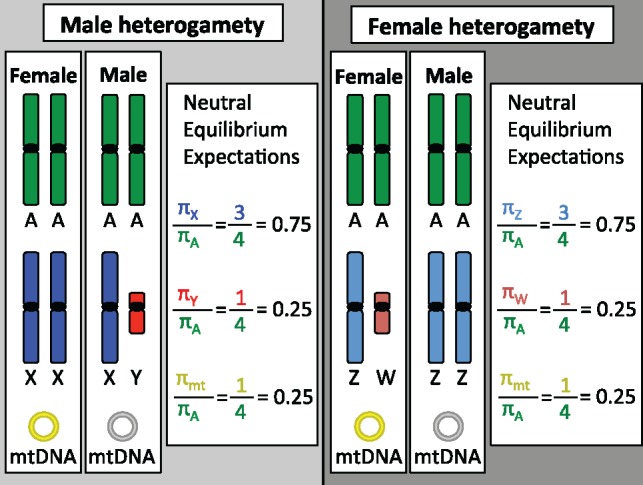
—Expected sex chromosome diversity. For understanding and interpreting patterns of diversity across the genome, we start with expectations of diversity under equilibrium demographic scenarios (equal and constant male and female populations sizes) and under the assumption that diversity in the regions we are looking at are neutral, that is, they have not been shaped by natural selection. Here diversity will be represented by π, the average pairwise difference between individuals. These neutral equilibrium expectations for diversity differ for each region of the genome and are expected to be proportional to the frequency of each region in the genome. For the mtDNA, although all individuals have mtDNA, it is only inherited through eggs, and so the only genetic evidence for mtDNA is from the mtDNA passed on through the genetic female lineages. Because overall population sizes differ, neutral equilibrium expectations for diversity, measured by π, are shown for the X or Z chromosome, the Y or W chromosome, and the mtDNA, relative to autosomal diversity. Chloroplast DNA is not shown but behaves similar to the mtDNA.
Expectations of Diversity across Sex Chromosome Types
Genetic Drift
To interpret patterns of genetic variation on the sex chromosomes, one first needs to understand the neutral equilibrium expectations (Box 3; fig. 1). Genetic drift occurs as a result of random sampling of alleles in a finite population and is the null expectation for allele change (Wright 1931). An introduction into how genetic diversity can be computed is found in Box 3. Under assumptions of a constant population size, random mating, equal contributions of the sexes (the effective number of males, Nm, is equal to the effective number of females, Nf), and a Poisson-distribution of the number of offspring, the diversity across the autosomes, X chromosome, Y chromosome, and mtDNA are expected to mimic their relative numbers in the population, governed by genetic drift (Charlesworth 2009) (expectations are also similar for the Z and W chromosomes; fig. 1). In sexually reproducing populations, the effective size of the entire population is a combination of the effective population size of each sex (Caballero 1995).
Demography
Both sex-independent and sex-biased demography will affect neutral diversity on the sex chromosomes (Box 3; fig. 2). Because the sex chromosomes and the autosomes have different effective population sizes, a population bottleneck that affects males and females equally will reduce diversity more on the X chromosome than on the autosomes (Pool and Nielsen 2007). However, because of its smaller effective population size, the X chromosome will also recover from a bottleneck faster than the autosomes (Pool and Nielsen 2007). Similarly, simulations suggest that haplotype diversity will recover faster on the Y chromosome and mtDNA than on the X chromosome after a bottleneck (Lawson Handley et al. 2006), likely because of their smaller effective population size. This means that inferring the time since a population-wide bottleneck can be extremely important for accurately interpreting patterns of diversity between the X chromosome and the autosomes for avoiding inference of sex-biased demographic events.
Fig. 2.
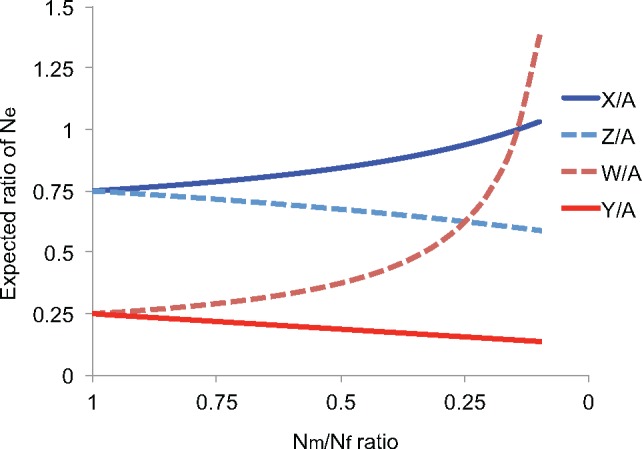
—Expected ratios of diversity on sex chromosomes and autosomes under varying numbers of reproducing males and females. The expected ratio of the effective population size of each sex chromosome (NeX, NeY, NeZ, and NeW) relative to the autosomal effective population size (NeA) is plotted for varying ratios of the effective numbers of males to females (Nm/Nf). The X or Z chromosomes are plotted in shades of blue, whereas the Y or W chromosomes are plotted in shades of red. Chromosomes from male-heterogametic systems (X and Y) are plotted with solid lines, whereas chromosomes from female-heterogametic systems (Z and W) are plotted with dotted lines.
That said, sex-biased demography is expected to dramatically shape variation across the sex-chromosomes relative to the autosomes (Box 3; fig. 2). High variance in reproductive success—meaning that, on average, the number of individuals of one sex contributing their genetic material to the next generation is smaller than the number of individuals of the other sex passing on their DNA—can tremendously affect relative diversity between genomic regions (Wilson Sayres et al. 2014). Nonrandom mating that increases variance in reproductive success in one sex (but not monogamous nonrandom mating) is expected to affect genetic diversity on the sex chromosomes versus the autosomes relative to randomly mating populations (Evans and Charlesworth 2013). Population structure and migration can also occur in a sex-specific way, leaving a signature on the genome (Laporte and Charlesworth 2002).
Selection
Selection can increase or decrease patterns of diversity across the genome, and theory predicts that the evolution of sexually antagonist traits and sexual dimorphism may especially shape variation on the sex chromosomes (Rice 1984; Charlesworth et al. 1987). Both purifying and positive selection are expected to reduce diversity in and near selected regions. Purifying (or negative) selection acts to decrease the frequency of alleles that result in traits that decrease fitness, reducing diversity in the associated region, as well as reducing diversity in linked neutral regions near the deleterious mutation (Charlesworth et al. 1993; Charlesworth 2012), a process called background selection. Positive selection will increase the frequency of alleles that result in traits that increase fitness, reducing diversity in this region as well as reducing diversity in linked neutral regions near the beneficial mutation via a process called genetic hitchhiking (Smith and Haigh 1974). Both noncoding regions (Yu et al. 2015) and regions of the genome that have previously been described as unconstrained (Lohmueller et al. 2011) may be affected by natural selection. However, because the effective population sizes of the autosomes and sex chromosomes are different, linked selection will impact patterns of genetic diversity differently across the genome (Hammer et al. 2010; Gottipati et al. 2011; Arbiza et al. 2014). In contrast to purifying and positive selection, balancing selection is expected to maintain genetic diversity at a locus and nearby linked sites (Charlesworth 2006). But, although there are many studies of balancing selection on the autosomes (DeGiorgio et al. 2014), and balancing selection is important across species (e.g., for maintenance of self-incompatibility and other features as reviewed in Delph and Kelly [2014]), the relative effects of balancing selection on the sex chromosomes versus the autosomes have not been thoroughly investigated. The maintenance of separate sex chromosomes is, in itself, a form of frequency-dependent selection (reviewed in Charlesworth [2006]). Additional discussion of mutation bias and selection, particularly positive selection, on the X versus the autosomes and observations across species can be found in Vicoso and Charlesworth (2006).
Mutation Rate Variation
When measuring patterns of genetic variation across the genome, one must consider that mutations will accumulate at different rates across genomic regions. One major source of variation is male mutation bias (reviewed in Hurst and Ellegren [1998] and Ellegren [2007]). If most mutations are the result of errors during replication, and there are more germline cell divisions in the production of sperm than egg by the time of reproduction, then we expect more mutations will be inherited from sperm than egg, resulting in a male mutation bias (Miyata et al. 1987). This has consequences for the accumulation of mutations across genomic regions because the sex chromosomes and autosomes spend different amounts of time in the male and female germlines. In species with male heterogamety, the Y chromosome is inherited only via sperm, and so is expected to accumulate more mutations than the autosomes (inherited in equal ratios from males and females), which are both expected to have higher mutation rates than the X chromosome, which spends two-thirds of its time in the female germline (fig. 1). Alternatively, for species with female heterogamety, the female-specific W chromosome is expected to have the lowest mutation rate in the genome. This is because the W spends the least amount of time in the male germline (and thus will accumulate fewer replication-dependent mutations), while the autosomes are expected, again, to exhibit an intermediate mutation rate, and the Z chromosome is expected to exhibit the highest mutation rate because it spends two-thirds of its time in the male germline (fig. 1). Male mutation bias has been documented across mammals (Wilson Sayres et al. 2011), birds (Axelsson et al. 2004), fish (Ellegren and Fridolfsson 2003), and in at least one Drosophila species (Bachtrog 2008). When measuring patterns of diversity across the genome, it is important to correct for the different mutation rates in each region to avoid over- or underestimating the accumulation of variation (fig. 3).
Fig. 3.
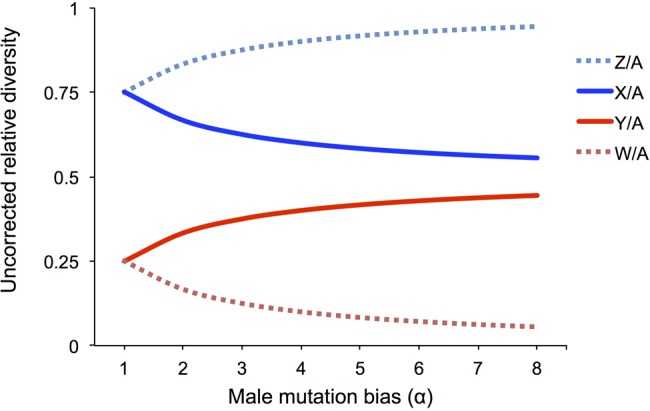
—Mutation rate variation and estimates of genetic diversity. Relative estimates of diversity uncorrected for mutation rate variation between the sex chromosomes and autosomes are plotted for male and female heterogametic systems under varying assumptions of mutation rate differences between males and females. Uncorrected relative diversity ratios are plotted under hypothetical situations where the underlying ratios reflect neutral diversity (expected 0.75 for X/A and Z/A, and 0.25 for Y/A and W/A) but are biased by mutation rate variation across chromosome types. Expected relative diversity, uncorrected for mutation rate variation, is plotted for constant populations with no variance in reproductive success, first assuming equal mutation rates between males, μm, and females, μf, (α = μm/μf = 1), and then with increasing levels of male mutation bias (α = 2, 3, and 4). Diversity uncorrected for mutation rate variation on the X or Z chromosome relative to autosomes is plotted in shades of blue, and diversity uncorrected for mutation rates on the Y or W chromosome relative to the autosomes is plotted in shades of red. Male heterogametic systems (X and Y) are plotted using solid lines, and female heterogametic systems (Z and W) are plotted using dotted lines.
Recombination
There is a positive correlation between rate of recombination and observed diversity (Nachman et al. 1998; Payseur and Nachman 2002). While debate continues, at least a portion of the positive correlation between rates of recombination and genetic diversity are due to the interaction of recombination and natural selection (McGaugh et al. 2012). Four major processes are expected to reduce the effective population size nonrecombining regions in the presence of selection, and thus, observed diversity: Muller’s ratchet, Hill–Robertson effect with weak selection, background selection, and hitchhiking (reviewed in reference to the Y chromosome in Charlesworth B and Charlesworth D [2000]). Rates of recombination vary across the autosomes, sex chromosomes, mtDNA, and chloroplasts, suggesting that at least some of the variation in observed patterns of diversity could be due to the absence or presence of recombination. Further, sex chromosomes are not always entirely sex-specific.
Pseudoautosomal regions are recombining sex-linked regions that maintain homologous sequence between the sex chromosomes (reviewed in Otto et al. [2011]). These regions, then, are expected to exhibit rates of recombination, mutation accumulation, drift, and selection that are distinct from the regions of sex chromosomes that are not shared (e.g., X- or Z-specific and Y- or W-specific) and should be analyzed separately. But, pseudoautosomal regions are not static, sometimes changing in length dramatically across species (Raudsepp et al. 2012), and genetic diversity may not support a strict pseudoautosomal boundary (Cotter et al. 2016). Given the variation in presence, absence, and length of pseudoautosomal regions, when analyzing sex-linked diversity, it is extremely important to ensure the regions being analyzed are entirely sex-linked. However, given the paucity of analysis of diversity in pseudoautosomal regions, they will not be further discussed here.
Interpretations
The effects of selection and demographic history can easily be confounded (reviewed in Li et al. [2012]). Sexual selection can lead to high variance in reproductive success, which ultimately affects genome-wide patterns of diversity between the sex chromosomes and the autosomes, as has been suggested in analyses of Z-linked versus autosomal diversity in birds (Corl and Ellegren 2012). Although evidence for selection has been inferred by comparing rates of polymorphism to divergence (McDonald and Kreitman 1991), this test can be biased by nonconstant effective population sizes (Eyre-Walker 2002) and may be especially difficult to use to compare between the sex chromosomes and the autosomes. In particular, purifying selection has been inferred to significantly affect genealogical structure across the human X chromosome (O’Fallon 2013). Tajima’s D (Tajima 1989)—used to infer deviations from neutrality by comparing two different measures of genetic diversity, the number of segregating sites, s, and the average number of pairwise differences, π—is also sensitive to demographic changes, particularly population expansions and bottlenecks (Tajima 1996). High variance in male reproductive success, common in both mammals and birds (Greenwood 1980), can especially skew the effective population sizes of the X chromosome, Y chromosome, and mtDNA relative to the autosomes (Wilson Sayres et al. 2014) and should lead to cautious interpretations of Tajima’s D between genomic regions.
Predominantly, diversity on the sex chromosomes has been used to explore and address one of three research areas: 1) Mating patterns and sex-biased variance in reproductive success, 2) signatures of selection, and 3) evidence for modes of speciation and introgression. In the remainder of this review, interpretations of patterns of genomic diversity are discussed broadly by taxa focusing predominantly on these three areas, acknowledging that the confounding effects of drift and demography, selection, and mutation on genetic diversity are typically not considered together.
Mammals
Genetic diversity on the sex chromosomes in humans has been recently reviewed (Webster and Wilson Sayres 2016). Briefly, however, genetic variation in humans, as with many species, is routinely compared between the Y chromosome and mtDNA (see Shan et al. 2014; van Oven et al. 2014; Vilar et al. 2014) or between the X chromosome and autosomes (see Hammer et al. 2008; Keinan and Reich 2010 b; Gottipati et al. 2011) to make inferences about evolutionary forces shaping population history (Aimé et al. 2015). In humans, neutral explanations for variation in diversity include sex-biased migration and sex-specific variance in reproductive success (Heyer et al. 2012). That said, both purifying (O’Fallon 2013) and positive (Dutheil et al. 2015) selection are certainly acting on X-linked variation (Veeramah et al. 2014) and will affect inferences of demography if not completely accounted for. Furthermore, different measurements of genetic variation will capture the effects of demography on different timescales and could lead to contradictory interpretations of the same data (Emery et al. 2010). What is agreed upon is that there are differences in the ratio of X-linked to autosomal diversity relative to neutral equilibrium expectations across human populations (Hammer et al. 2004; Keinan et al. 2009; Keinan and Reich 2010a), and that the historical effective population sizes of males and females are not the same (Wilder et al. 2004; Karmin et al. 2015).
Curiously, the pattern of X/A diversity with increasing distance from genes is not the same across the great apes; the ratio of X/A diversity is extremely low relative to neutral expectations (fig. 1) in gorillas and orangutans in windows near and far from genes, and the ratio of X/A diversity in the bonobo, while not as reduced as the former species, is also relatively constant across windows with increasing distance from genes (Prado-Martinez et al. 2013). Further, natural selection has appeared to have left long regions of low genetic diversity across the X chromosome in all great apes (Hvilsom et al. 2012; Nam et al. 2015).
In contrast to the great apes, in tonkean macaques, reported ratios of diversity on the X chromosome to the autosomes are lower (but not necessarily significantly lower) than neutral expectations under an assumption of equal sex ratios (Evans et al. 2014). Curiously, however, in the crab-eating macaque, the ratio of X/A diversity is significantly below 0.75 and could only be explained by a combination of sex-biased mutation rate variation, sex-biased demography, and selection acting on the X chromosome (Osada et al. 2013). Thus, even among closely related taxa, patterns of sex-linked to autosomal variation can be very different. In these cases, including Y-linked or mtDNA may help illuminate whether the observed patterns are primarily driven by selection on the X chromosome in the crab-eating macaque (in which case ratios of Y-linked to autosomal and mtDNA to autosomal variation would be near neutral expectations), or whether population history is driving the patterns.
Despite the multiple evolutionary pressures acting on the nonrecombining human Y chromosome (with caveats similar to using mtDNA [Balloux 2010]), relationships between Y chromosomes, based on shared and derived genetic diversity, are routinely used to infer the peopling of the world (Cruciani et al. 2011; Barbieri et al. 2016), including ancient population structure (Scozzari et al. 2014) and recent population expansions (Hallast et al. 2015; Poznik et al. 2016). There have been many studies (over 1,000 entries returned in PubMed at the time this article was written) of variation on any single sex-linked region across humans, including a review of X-linked population variation (Schaffner 2004), and many studies of just Y-linked or mtDNA variation, so when possible this review focuses on discussions of patterns of sex-linked diversity where at least two loci are compared.
One concern about using the Y chromosome alone to infer demographic history is that, as a single linked marker, natural selection acting anywhere on the nonrecombining portion of the Y chromosome will affect all Y-linked loci. Other studies have identified a male-specific bottleneck that coincided with a global change in culture (Karmin et al. 2015) and significant natural selection (Poznik et al. 2016). Genome-wide comparisons of autosomes, X-linked, Y-linked, and mtDNA loci showed that Y-linked genetic diversity is extremely low in both African and European populations relative to neutral equilibrium expectations, and only by analyzing the entire genome could it be determined that both natural selection (purifying selection seemed the most consistent with the data, and had previously been observed on the human Y chromosome; Wilson and Makova 2009) along with sex-biased demography were required to explain the observed reduction (Wilson Sayres et al. 2014). Notably, because it is a single, nonrecombining marker, one divergent Y chromosome haplotype can make a large change in estimates of the most recent common ancestor for this region (Mendez et al. 2013; Poznik et al. 2013; Wilson Sayres 2013).
Similar to humans, the ratio of Y-linked diversity relative to autosomal diversity is much lower than 0.25 in most chimpanzee subspecies, across gorillas, and across orangutans (Hallast et al. 2016). In these great apes, lower Y relative to autosomal diversity than expected is interpreted as evidence of sex-bias in reproductive success. In contrast, two independent analyses report higher than expected diversity across bonobo Y chromosomes (Stone et al. 2002; Hallast et al. 2016). Comparisons of X-linked versus autosomal variation in bonobos could suggest whether bonobo genomes reflect their matriarchal population (Sommer et al. 2011) and could explain their high Y-linked diversity.
Bonobos nonwithstanding, Y-linked nucleotide variation is typically low in mammals (though, in contrast, copy number variation can sometimes highly polymorphic [Lucotte et al, 2017; Ye et al, 2017]). Y chromosome diversity is reported to be lower than neutral expectations in lynx, wolf, reindeer, cattle, and field vole (Hellborg and Ellegren 2004), and across Felidae (tiger, leopard, Asian leopard cat, fishing cat, Asian golden cat, and marbled cat; Luo et al. 2007). It is not yet clear whether this trend is due to high variance in male reproductive success, natural selection acting on the nonrecombining Y chromosome, or both. Y chromosome variation is especially low on the Y chromosomes of domesticated species, but this is likely due to artificial breeding and founder events, including purebred dogs (Bannasch et al. 2005), cattle (Yue et al. 2015), and in horses (Lindgren et al. 2004; Wallner et al. 2013). Genetic variation across dog Y chromosomes is highly structured across the globe, with the most diversity in dog Y chromosomes in Africa, but also high levels of Y-linked variation in India, East and Southwest Asia (Shannon et al. 2015). Differences in genetic diversity across the X chromosome, Y chromosome, and autosomes between domesticated horses and Przewalski’s horse suggest that there was a recent bottleneck in the male lineage in both populations—consistent with fixed Y-linked differences between them (Wallner et al. 2003). But, the two populations do not form monophyletic groups based on autosomal and X-linked variation (Lau et al. 2009). Thus, while an analysis of Y-linked regions alone may have implicated high divergence between domesticated horses and Przewalski's horse, inclusion of autosomal and X-linked loci suggests that there has been significant gene flow.
Birds
All birds have a homologous ZZ/ZW female-heterogametic sex determination system (Zhou et al. 2014), with variable levels of divergence between the Z and W chromosomes (Wang et al. 2014), and provide a test of general features of sex-linked diversity. A neo-sex chromosome system (a fusion between 10 Mb of zebrafinch chromosome 4a with both the Z and the W chromosomes) was identified in three passerine bird species in the Sylvoidea clade (common whitethroat, the great reed warbler, and the skylark) and not in two outgroups, the goldcrest and the blue tit (Pala, Naurin, et al. 2012). The transition from autosomal linkage to sex linkage was accompanied by a reduction in diversity at Z-linked loci relative to autosomal loci, though the reduction ranged from a Z/A ratio of 0.01 in the great reed warbler to only 0.82 in the common whitethroat (Pala, Hasselquist, et al. 2012). These variations could be due to the fact that the sequences studied were introns, and so may have been affected strongly by selection.
Ratios of Z-linked to autosomal diversity have been used to infer modes of speciation, mating patterns, and selection across birds. Patterns of diversity and divergence across the Z chromosome (relative to autosomes) in mallards versus Mexican ducks are consistent with the Z chromosome playing a disproportionately large role in speciation, a large-Z effect (Box 1), even when patterns of population demography and the differences in chromosome-specific effective population size are considered (Lavretsky et al. 2015). A joint inference of Z-linked and autosomal diversity across exons and introns in the vinaceous rosefinch and the Taiwan rosefinch was used to infer that these two populations diverged about 0.5 Ma, and that the effective population size of males is five times lower than that of females for both populations (Chu et al. 2013). Z-linked diversity across microsatellites was significantly lower than autosomal diversity in three populations of Siberian jays, suggesting that these populations experience male-biased dispersal across populations (more mixing of Z chromosomes than autosomal loci in these female-heterogametic species; Li and Merilä 2010). Genetic diversity on the Z chromosome relative to the autosomes in three independent contrasts of shorebirds (least sandpipers vs. white-rumped sandpipers, western sandpipers vs. pectoral sandpipers, and red-necked phalaropes vs. Ruffs) was consistent with a reduced effective population size of males relative to females in polygynous species when compared with species that are typically monogamous (Corl and Ellegren 2012). Similarly, genetic diversity on the Z chromosome relative to the autosomes was also greatly reduced relative to expectations of 0.75 (fig. 1) in two species of polygynous sage-grouse (0.38 in Centrocercus minimus, 0.48–0.59 in two populations of Centrocercusurophasianus; Oyler-McCance et al. 2015). Given that these are polygynous populations, the small effective numbers of males relative to females (fig. 2) may explain the low Z/A diversity in one or both species. Selection can also be acting to reduce Z-linked diversity relative to the autosomes, but was not investigated in this case. In addition to demography and selection, genetic drift, which is expected to be stronger in smaller populations and has been suggested to explain at least some observations of fast-Z (Mank et al. 2010), may also explain lower Z-linked and W-linked diversity relative to autosomal diversity. In all cases, further data collection and analysis is needed to disentangle the possible drivers of reduced Z/A diversity.
Heterozygosity within individuals among RADseq reads covering about 3.3% of the genome was used to compare Z-linked and autosomal variation in eight phylogenetic pairs of sexually dichromatic birds (where male and female birds have highly sex-differentiated color patterns) versus monochromatic birds (Huang and Rabosky 2015). If sexually dichromatic birds are the result of intense, and maintained, sexual selection, one might expect to see reduced Z/A diversity in sexually dichromatic birds relative to monochromatic birds. In contrast, the authors observed that the Z/A diversity ratio was consistently lower in monochromatic birds than in sexually dichromatic birds, sometimes lower than theoretical minimums for unconstrained regions (Huang and Rabosky 2015). Low Z/A ratios could occur, in part, if the RADseq predominantly captured sequences affected by selection, but there is no reason to expect that this technical artifact would disproportionately affect the monochromatic species.
Although the Y chromosome is used to study male-specific population history, the W chromosome also holds information about female-specific population history, but is much less studied than Z-linked or autosomal loci. Genetic diversity across genomic regions from 96 females in four species of flycatchers (collared flycatcher, pied flycatcher, semicollared flycatcher, and Atlas flycatcher) and an outgroup (red-breasted flycatcher) reported extremely low W-linked variation; genetic diversity is 8–13 times lower for W-linked loci than for autosomal loci (Smeds et al. 2015). Extremely low W chromosome diversity has also been reported for chicken (Berlin and Ellegren 2004; Moghadam et al. 2012). It is not yet known whether low W-linked diversity is driven primarily by selection or demography.
Drosophila and Lepidoptera
All investigated species of Drosophila are male-heterogametic, and while there have been fusions, Drosophila species that have been studied share at least one large homologous sex-linked region (Muller Element A; Schaeffer et al. 2008). Diversity in Drosophila has been used to study population structure, introgression, natural selection, and sex-biased processes. Perhaps, one of the most important lessons from diversity on the sex chromosomes in Drosophila is on the importance of genetic drift. Genetic diversity (measured using both π and s) across four loci on the X chromosome and two mtDNA loci in wild caught Drosophilapseudoobscura and Drosophilapersimilis populations with samples taken 16 years apart (sampled in 1997 and in 2003) was not significantly different in either population, but Tajima’s D was very different for one locus, reiterating that genetic drift over time can affect estimates of Tajima’s D (Gredler et al. 2015).
An analysis of genetic diversity across the X chromosome and autosomes in an African population of Drosophilamelanogaster (chosen because it was not expected to exhibit the extreme bottlenecks of non-African populations) confirmed that diversity is lower in regions with low rates of recombination, and that the efficacy of selection correlates positively with the rate of recombination (Campos et al. 2014). The X chromosome in African D. melanogaster shows a pattern consistent with increased adaptive evolution on the X chromosome (Campos et al. 2014), also called a fast-X effect (Meisel and Connallon 2013; Box 1). Similarly, the X chromosome is routinely underenriched for regions involved in admixture across Drosophila species (Herrig et al. 2014), which could occur if the X chromosome harbors alleles with negative epistatic effects (Pool et al. 2012), also referred to as the large-X effect (Box 1). A comparison of X-linked and autosomal divergence between Drosophilamauritiana and Drosophilasechellia, and diversity across the genome of D. mauritiana, also reported that X-linked divergence is increased relative to autosomal divergence, but X-linked diversity is much lower, consistent with selective sweeps acting in the X as these two populations diverged about 240,000 years ago (Garrigan et al. 2014).
Overall, putatively neutral diversity on the X chromosome (which should not be subject to the Fast-X effect) relative to diversity on the autosomes is still lower than 0.75 in many species and subpopulations of Drosophila (e.g., D. subobscura [Herrig et al. 2014], D. simulans [Begun et al. 2007], D. pseudoobscura and D. miranda [Haddrill et al. 2010], and non-African populations of D. melanogaster [Andolfatto 2001]). Some species of Drosophila, like D. madeirensis (Herrig et al. 2014), exhibit an X/A diversity ratio that is not significantly different from 0.75, and, curiously, African populations of D. melanogaster have typically been found to exhibit an X/A diversity ratio greater than 0.75 (Andolfatto 2001; Langley et al. 2012; Singh et al. 2013). But, before definite conclusions can be drawn about what these ratios mean, linked selection, and its effects on diversity, must be taken into account. Analysis of X-linked and autosomal diversity far from genes in African and non-African populations of D. melanogaster did not find the striking differences in X/A diversity as previous studies, but still concluded that both population demography and selection together shape the ratio of X/A diversity (Singh et al. 2007).
The ratio of diversity on the Y chromosome relative to the autosomes should be about 0.25, under neutral demographic scenarios, but similar to the Y in mammals and the W in birds, Y-linked diversity across Drosophila populations is routinely much lower than neutral expectations. Y chromosome diversity is exceedingly low across all D. melanogaster populations studied, some of which can be explained by population demography, but not in African populations, where recent selective sweeps are proposed to explain the low Y-linked diversity in populations from Zimbambwe and Uganda (Larracuente and Clark 2013). Diversity is also reported to be much lower than neutral expectations in D. subobscura and D. madeirensis and is inferred to be due to linked selection—either background selection or hitchhiking—because corresponding X/A ratios in these species are not consistent with extreme variance in male reproductive success (Herrig et al. 2014). In contrast, a study of Y-linked diversity in D. simulans reported only a single polymorphism in ten lines (Zurovcova and Eanes 1999), but the authors ruled out background selection because of the limited number of genes on the D. simulans Y chromosome; further investigations are needed to determine whether this low Y variation in D. simulans is due primarily to selection or extreme variance in male reproductive success.
Patterns of low Y-linked diversity can also extend to neo-Y chromosomes (a neo-sex chromosome is an old sex chromosome to which an autosome has recently been fused). Genetic diversity is reduced on the neo-Y chromosome in D. miranda relative to the neo-X chromosome at single nucleotide markers (Yi and Charlesworth 2000) and microsatellite loci (Bachtrog and Charlesworth 2000) relative to neo-X loci. In contrast, analyses of the genetic diversity on the neo-Y chromosome in D. albomicans did not find low Y-linked diversity (Satomura and Tamura 2016). It is possible that the results of these studies may be reconciled by considering the effects of time since total recombination suppression on the Y chromosome (the neo-Y in D. albomicans is about 0.5 Myr old [Lin et al. 2008], whereas the D. miranda neo-Y is approximately double that age, at about 1 Myr old [Bachtrog and Charlesworth 2002]), or there may be unique species-specific demography that affected sex-linked diversity differently in these species.
Understanding variation on the Y chromosome is also important for comprehensive characterization of genome-wide variation. Natural variation on the Y chromosome in D. melanogaster is significantly associated with change in expression for 2.84% of non-Y-linked genes (Sackton et al. 2011), especially genes involved in the immune system and in detecting pheromones (Jiang et al. 2010). There is also evidence that variation on the Y chromosome in Drosophila preferentially regulates tissue-specific genes and genes in repressive chromatin (Sackton and Hartl 2013).
Genetic diversity in butterflies and moths has not yet been used to test many theoretical predictions, but, because moths and butterflies (together called Lepidoptera) have a ZZ/ZW female-heterogametic sex determination system (Kaiser and Bachtrog 2010), they make an excellent comparison group to the XX/XY Drosophila and mosquitos. Largely, sex-linked genetic diversity in Lepidoptera has been studied to test for evidence of speciation and species interbreeding. High levels of shared genetic diversity across five loci on the Z chromosome in two species of Swallowtail butterfly species (Papilio canadensis and Papilioglaucus) were used to reject a model of allopatric speciation between them (Putnam et al. 2007). Similarly, autosomal variation across 31 Heliconius butterflies (H. melpomene, H. cydno, and H. timareta) suggests sympatric speciation with routine admixture between species, but Z-linked loci show significantly reduced levels of admixture relative to the autosomes (Martin et al. 2013). This is consistent with the large-Z effect that alleles involved in inter-species genetic incompatibility accumulate faster on the Z chromosome than on the autosomes (Box 1). The large-Z is expected to occur either as the result of more genetic drift on the Z relative to the autosomes or when positive selection fixes unique alleles between species on the Z faster than on the autosomes. Consistent with the latter, patterns of genetic diversity suggest a stronger signal of positive selection on the silkmoth Z chromosome relative to the autosomes (a fast-Z effect; Box 1) (Sackton et al. 2014). However, hemizygosity can result in several evolutionary differences between the sex chromosomes and the autosomes; in contrast to strong positive selection, low rates of evolution and diversity suggest that purifying selection is stronger on the Z than the autosomes in two satyrine butterflies (Rousselle et al. 2016).
W-linked loci have not yet been studied extensively across Lepidoptera. Unlike the shared ancestry of the Y in mammals, or homologous W chromosomes across birds, the W chromosomes of Lepidoptera show evidence of frequent turnover (Sahara et al. 2012), which may limit future analyses if sequencing of a reference chromosome is required. Similar to other W and Y chromosomes, Lepidoptera W chromosomes are extremely repeat-rich (Abe et al. 2005), which is a challenge for chromosome assembly and estimates of diversity across species. But, W-linked markers from silkworm are also female-specific in the sugar cane borer (Heideman et al. 2010), suggesting that at least some regions of this W chromosome are conserved enough to facilitate future studies of genetic diversity.
Plants
Systems of sexual reproduction, including unisexual flowers, have evolved multiple times in plants (see Westergaard 1958 and Dellaporta and Calderon-Urrea 1993). Similarly, genetic sex determination, including sex chromosomes, has arisen several times in flowering plants (Charlesworth 2002). As more plant genomes—and especially domesticated plants—are studied, more cases of genetic sex determination in plants are being discovered (e.g., papaya [VanBuren et al. 2015], asparagus [Gebler et al. 2007], persimmon [Akagi et al. 2014], kiwifruit [Zhang et al. 2015], wild strawberry [Ashman et al. 2015], spinach [Fujito et al. 2015], hop [Neve 1958], and wild grapes [Picq et al. 2014]). Studying plant sex chromosomes is an opportunity to understand how sex-linkage affects evolution and sex-linked diversity in taxa with remarkably different life history and reproductive strategies than in the more broadly studied chromosomal sex determination systems of flies, birds, and mammals.
To date, the majority of analyses of sex chromosome diversity in plants has been conducted in Silene latifolia (also called the white campion), a flowering plant with a 10–20 Myr-old chromosomal sex determination system (Filatov and Charlesworth 2002). Silenelatifolia has separate sexes and male heterogametic sex determination; female plants are XX and male plants are XY with a region of the Y chromosome that does not recombine with the X (Marais et al. 2008). Y-linked variation is low in S. latifolia, and by comparing genetic variation on the Y chromosome, X chromosome, and autosomes, it was determined that this is likely due to selection acting on the Y chromosome rather than due to high variance in male reproductive success because the ratio of X/A diversity does not differ from equilibrium expectations (Qiu et al. 2010). As with all genomic analyses, individual genes may deviate from chromosome-wide trends. One sex-linked gametologous pair, SIX9/SIY9, is functional on both the S. latifolia X and Y chromosomes, but the X-linked copy shows elevated levels of diversity relative to other X-linked genes, whereas the Y-linked loci have reduced diversity relative to other Y loci (Kaiser et al. 2011). Evidence suggests that two processes, purifying selection at SIY9 and SIX9 introgression from a closely related species, Silenedioica, may together explain these two observations of unique sex-linked diversity (Kaiser et al. 2011). Curiously, however, introgression is reduced on the Silene X chromosome, relative to the autosomes, between S. latifolia and S. dioica, suggesting that the large-X effect is also acting in plants (Hu and Filatov 2016; Box1), although its expected effects on diversity have not been investigated.
Low Y diversity is a feature across S. latifolia populations (Muir et al. 2011) and the dioecious Rumex hastatulus (Hough et al. 2017), similar to mammals, birds, and flies. Particularly in R. hastatulus, the Y diversity is 93% lower than neutral expectations but can only be explained by models of purifying selection acting in aggregate over many sites on the Y chromosome (Hough et al. 2017), similar to the observations and models of extremely low Y-linked diversity on the human Y chromosome (Wilson Sayres et al. 2014). There is also high differentiation between Y chromosomes of different S. latifolia populations, which is likely explained by independent reductions in Y variation across populations (Muir et al. 2011). Unlike mammals or birds, sex determination systems vary widely among closely related species; S. latifolia is sister to a species that does not have chromosomal sex determination (Casimiro-Soriguer et al. 2015). Such comparisons between Silene taxa will have a much larger set of genes to compare (because the S. latifolia sex chromosomes are not as degraded as those of eutherian mammals) and may lead to exciting new insights about the effects of sex-linkage on evolution.
Papaya, Carica papaya, is a trioecious species with females, males in wild populations, and hermaphrodites in domesticated populations, with corresponding sex-biased regions: XX, XY, and XYh (Na et al. 2012). Hermaphrodites are only found in domesticated populations, whereas males occur in the wild. Curiously the hermaphrodite-specific region of the Yh is larger than the corresponding X-linked region due to retrotransposon insertions (Wang et al. 2012), and a candidate for the region that differentiates males (XY) from hermaphrodites (XYh) has been identified (Ueno et al. 2015). In a striking difference relative to the expectations, analysis of genetic diversity between four X-linked and Y-linked gene pairs sampled in wild papayas observed higher diversity in the Y-linked regions than the X-linked regions (Weingartner and Moore 2012). The authors hypothesized that this pattern could be consistent with an X-specific selective sweep that preferentially reduced diversity in the genic regions analyzed on the X chromosomes. However, further analyses of nonsynonymous polymorphism at other sex-linked genes suggest that selection may be reduced at both X-linked and Y-linked exons in papaya (Wu and Moore 2015). Future studies of chromosome-wide genetic variation between X, Y, and Yh relative to autosomal diversity are needed to understand the unique history of selection and demography in shaping wild and domesticated papaya genetic variation.
Algae, Mosses, and Fungi
UV sex determination is a haploid sex determination system where the U chromosome occurs in haploid genetic females and the V chromosome occurs in haploid genetic males (Bachtrog et al. 2011). Unlike male-heterogametic (XX/XY) and female-heterogametic (ZZ/ZW) systems, in the UV sex determination system, recombination is suppressed on the sex chromosome in both sexes (Box 1). The UV sex determination system in brown algae, Ectocarpus, is estimated to be at least 70 Myr old, with evidence of reduced gene density and expression in the very small nonrecombining male-specific and female-specific regions (Ahmed 2014). Although genetic diversity was not explicitly analyzed, one expects diversity to be low in both the male- and female-specific regions. Consistent with this expectation, an analysis of nucleotide diversity on the U chromosome and V chromosome in the bryophyte moss, Ceratodon purpureus, reported reduced diversity in sex-specific regions relative to autosomal regions (McDaniel et al. 2013). But, curiously, the absence of recombination may not always lead to a reduction in diversity in the nonrecombining region. In the smut fungus Microbotryum violaceum, genetic diversity is not significantly different between the recombining and nonrecombining regions of the genome that were assayed, potentially explained by the selection against selfing in this species (Votintseva and Filatov 2011).
Fungal mating types, though routinely multilocus, share many similarities with plant and animal sex chromosomes (reviewed in Fraser and Heitman [2005]), including the suppression of recombination at mating type loci (Fraser et al. 2004). In the absence of recombination, genetic diversity is expected to be low at these mating type loci. Although genetic diversity does not appear to be low at the mating type loci in the fungus Cryptococcus neoformans (Lengeler et al. 2002), nor in the smut fungus Microbotryum violaceum (Votintseva and Filatov 2011), it has been hypothesized that genome-wide reductions in diversity due to extensive selfing (at least in M. violaceum) may result in a negligible difference between levels of genetic diversity in the recombining and nonrecombining regions (Votintseva and Filatov 2011). Curiously, however, analysis of nonrecombining mating type loci across 12 species of the anther-smut fungi Microbotryum showed evidence of degeneration in the nonrecombining region, including elevated rates of nonsynonymous to synonymous substitutions, gene loss, and accumulation of transposable elements (Fontanillas et al. 2015). Thus, future studies of genetic diversity in nonrecombining fungal mating types relative to recombining regions may yet find differences in levels of genetic diversity in recombining and nonrecombining fungal mating types that mirror patterns observed in the evolution of sex chromosomes.
In conclusion, despite abundant theory on expectations for diversity across the sex chromosomes under different evolutionary scenarios, empirical data have been often limited to a handful of loci and species. Optimistically, technological and methodological advances are providing the opportunity to make these comparisons genome-wide. As more whole genomes are being sequenced and assembled, the homogametic sex (e.g., female mammals and male birds) is still the most likely to be sequenced; but, even one sex provides the opportunity to study diversity and evolution on at least one of the sex chromosomes relative to the rest of the genome. Patterns of genome-wide diversity will continue inform about modes of speciation, population-specific demography, and selective pressures within and across species, illuminating shared and unique features of life.
Box 1: Definitions
Male: In species with two sexes, males are the individuals that produce the small gametes, typically called sperm.
Female: In species with two sexes, females are the individuals that produce the large gametes, typically called eggs.
Homomorphic sex chromosomes: In species with chromosomal sex determination, if the sex chromosomes are not highly differentiated from one another, meaning they are morphologically indistinguishable (though there will be small genetic differences), they are called homomorphic sex chromosomes.
Heteromorphic sex chromosomes: In species with chromosomal sex determination, if the sex chromosomes have differentiated from each other and are morphologically distinguishable, then they are called heteromorphic sex chromosomes.
Male heterogamety (XX/XY): A sex-determination system in which males have sex chromosomes of different shapes and/or compositions. XX refers to the typical sex chromosome pair in females: Two sex chromosomes that can recombine over their entire lengths. XY refers to the typical sex chromosome pair in males: A pair of sex chromosomes that has some region of recombination suppression between them, and one of which (the Y chromosome) is inherited in a male-specific way. Another way to think about it is that XX individuals can make only one type of egg (all eggs will typically have one copy of each autosome and one X chromosome) whereas XY individuals can make two types of sperm (typically sperm will have one copy of each autosome, but can have either an X or a Y). XX/XY is used as shorthand to refer to all male-heterogametic sex determination systems and does not imply that the X or Y chromosomes are of the same origin. Further, systems with complex XY or multiple X and Y chromosomes are still considered male heterogametic if the sperm-producing individuals can make gametes with different sex chromosome complements (e.g., the platypus, where males have ten sex chromosomes and can make a sperm with either five X chromosomes or five Y chromosomes).
Female heterogamety (ZZ/ZW): A sex-determination system in which females have sex chromosomes of different shapes and/or compositions. ZZ refers to the typical sex chromosome pair males: A pair of sex chromosomes that can recombine over their entire lengths. ZW refers to the typical sex chromosome pair in females: The pair of sex chromosomes that has a region of recombination suppression between them, and one of which (the W chromosome) is inherited in a female-specific way. ZZ individuals can make only one type of sperm (all sperm will typically have one copy of each autosome and one Z chromosome) whereas ZW individuals can make two types of eggs (typically eggs will have one copy of each autosome and will have either a Z or a W). ZZ/ZW is used as shorthand to refer to all female-heterogametic sex determination systems.
UV sex determination: A sex determination system in which the haploid females have one sex chromosome (U) and the haploid males have the other sex chromosome (V), and the genomes of diploid individuals have both the U chromosome and the V chromosome, with a region of suppressed recombination between the U and V chromosomes.
Fast-X/fast-Z: The theory and observation that divergence on the X chromosome (or Z chromosome) is faster than corresponding divergence on the autosomes. Many factors may result in a fast-X or fast-Z, including that these chromosomes are hemizygous in one sex, and so if recessive alleles are common, selection will be able to act on these alleles faster on the X or Z when it is hemizygous than it would on autosomal chromosomes where the phenotypes of de novo recessive alleles will be masked. Fast-X/fast-Z theory and observations are reviewed in Meisel and Connallon (2013).
Large-X/large-Z effect: The theory and observation that alleles with the largest effect on hybrid sterility and inviability will be on the X chromosome or the Z chromosome (Coyne and Orr 1989). The large-X and large-Z effects are expected to be a result of the evolutionary mechanisms driving fast-X/fast-Z.
Sexually antagonistic selection: When an allele results in a trait that increases fitness (reproductive success) in one sex but reduces fitness in the other sex.
Heteroplasmy: Existence of genetically distinct organelles within an individual. Though the mitochondria have a haploid genome, there can be multiple genetically distinct mitochondria in a cell, or within an individual, resulting in heteroplasmic sites that are variable across distinct mtDNA (distinct from heterozygous sites that are variable across homologous chromosomes).
Box 2: Calculating Genetic Diversity
There are two main measures of genetic diversity at nucleotide sites: π and θw. π is the average number of pairwise differences. θw is the number of segregating sites, S, divided by a correction for the number of sequences analyzed, an. Both π and θw are routinely computed per site to normalize for the total number of nucleotides analyzed. In this example, we will go through the equations for π and θw, then apply to an example with sequences.
The equation for π calculates the number of difference between all pairs of sequences, i and j, then takes the average across all pairs of comparisons across the n sequences analyzed:
The equation for θw for first counts the total number of sites that vary in any individual, then divides by a correction factor to take into account the total number of sequences, n, analyzed.
In both cases, π and θw can be divided by the total number of sites analyzed. Normalizing by the total number of sites analyzed makes both estimates more readily comparable across genomic regions analyzed and especially across studies that may have looked at different total numbers of nucleotides.
To see how these work, let us consider the n = 4 sequences below:
Seq1: ATGCAGCGTTCG
Seq2: ATGGAGCGTTAG
Seq3: ACGCATCGGTAG
Seq4: ACGCAGCGGTAG.
To compute π, we first compute all pairwise differences:
Differences between Seq1–Seq2 = 2
Differences between Seq1–Seq3 = 4
Differences between Seq1–Seq4 = 3
Differences between Seq2–Seq3 = 4
Differences between Seq2–Seq4 = 3
Differences between Seq3–Seq4 = 1.
Now we take the average = (2 + 4 + 3 + 4 + 3 + 1)/6 = 17/6 ≈ 2.83.
To compute θw we first compute the total number of sites that segregate in the population, S:
S = 5 (columns where the nucleotides are not identical across all sequences).
Then, we compute an for our n = 4 sequences: (1/1 + 1/2 + 1/3) ≈ 1.83.
So, θw is 5/1.83 = 2.72.
If we want to compute π and θw per site, we divide both estimates by the total number of nucleotides analyzed (in this case, 12 nucleotide sites):
π/site = 2.83/12 ≈ 0.236,
θw/site = 2.72/12 ≈ 0.227.
Box 3: Calculating Expected Diversity for Varying Effective Numbers of Males and Females
In male-heterogametic systems, we can compute the effective population size of each chromosome type (Nauto, NchrX, NchrY, and NmtDNA), for variable male and female effective population sizes (Nm and Nf) (for details see, e.g., Hartl and Clark 1997):
Alternatively, in female-heterogametic systems, the effective sizes of the autosomes and mtDNA (Nauto and NmtDNA) are the same as in male-heterogametic systems (above), but because of their different inheritance type, we now compute different effective population sizes for the Z and W chromosomes (NchrZ and NchrW) for variable male and female effective population sizes (Nm and Nf):
The results of applying these equations are visualized in figure 2.
Acknowledgments
I sincerely thank three anonymous reviewers whose comments pointed me to additional literature and significantly improved the structure and flow of the manuscript. This publication was supported by the National Institute of General Medical Sciences of the National Institutes of Health under Award Number R35GM124827. The content is solely the responsibility of the author and does not necessarily represent the official views of the National Institutes of Health.
Literature Cited
- Abe H, Mita K, Yasukochi Y, Oshiki T, Shimada T.. 2005. Retrotransposable elements on the W chromosome of the silkworm, Bombyx mori. Cytogenet Genome Res. 110(1–4):144–151. [DOI] [PubMed] [Google Scholar]
- Ahmed S. 2014. A haploid system of sex determination in the brown alga Ectocarpus sp. Curr Biol. 24(17):1945–1957. [DOI] [PubMed] [Google Scholar]
- Aimé C, Heyer E, Austerlitz F.. 2015. Inference of sex-specific expansion patterns in human populations from Y-chromosome polymorphism. Am J Phys Anthropol. 157(2):217–225. [DOI] [PubMed] [Google Scholar]
- Akagi T, Henry IM, Tao R, Comai L.. 2014. Plant genetics. A Y-chromosome-encoded small RNA acts as a sex determinant in persimmons. Science 346(6209):646–650. [DOI] [PubMed] [Google Scholar]
- Andolfatto P. 2001. Contrasting patterns of X-Linked and autosomal nucleotide variation in Drosophila melanogaster and Drosophila simulans. Mol Biol Evol. 18(3):279–290. [DOI] [PubMed] [Google Scholar]
- Arbiza L, Gottipati S, Siepel A, Keinan A.. 2014. Contrasting X-linked and autosomal diversity across 14 human populations. Am J Hum Genet. 94(6):827–844. [DOI] [PMC free article] [PubMed] [Google Scholar]
- Ashman T-L, et al. 2015. Multilocus sex determination revealed in two populations of gynodioecious wild strawberry, Fragaria vesca subsp. bracteata. G3 5(12):2759–2773. [DOI] [PMC free article] [PubMed] [Google Scholar]
- Axelsson E, Smith NGC, Sundström H, Berlin S, Ellegren H.. 2004. Male-biased mutation rate and divergence in autosomal, Z-linked and W-linked introns of chicken and turkey. Mol Biol Evol. 21(8):1538–1547. [DOI] [PubMed] [Google Scholar]
- Bachtrog D. 2008. Evidence for male-driven evolution in Drosophila. Mol Biol Evol. 25(4):617–619. [DOI] [PubMed] [Google Scholar]
- Bachtrog D, Charlesworth B.. 2000. Reduced levels of microsatellite variability on the neo-Y chromosome of Drosophila miranda. Curr Biol. 10(17):1025–1031. [DOI] [PubMed] [Google Scholar]
- Bachtrog D, Charlesworth B.. 2002. Reduced adaptation of a non-recombining neo-Y chromosome. Nature 416(6878):323–326. [DOI] [PubMed] [Google Scholar]
- Bachtrog D, et al. 2011. Are all sex chromosomes created equal? Trends Genet. 27(9):350–357. [DOI] [PubMed] [Google Scholar]
- Balloux F. 2010. The worm in the fruit of the mitochondrial DNA tree. Heredity 104(5):419–420. [DOI] [PubMed] [Google Scholar]
- Bannasch DL, Bannasch MJ, Ryun JR, Famula TR, Pedersen NC.. 2005. Y chromosome haplotype analysis in purebred dogs. Mamm Genome. 16(4):273–280. [DOI] [PubMed] [Google Scholar]
- Barbieri C, et al. 2016. Refining the Y chromosome phylogeny with southern African sequences. Hum Genet. 135(5):541–553. [DOI] [PMC free article] [PubMed] [Google Scholar]
- Begun DJ, et al. 2007. Population genomics: whole-genome analysis of polymorphism and divergence in Drosophila simulans. PLOS Biol. 5(11):e310. [DOI] [PMC free article] [PubMed] [Google Scholar]
- Berlin S, Ellegren H.. 2004. Chicken W: a genetically uniform chromosome in a highly variable genome. Proc Natl Acad Sci U S A. 101(45):15967–15969. [DOI] [PMC free article] [PubMed] [Google Scholar]
- Caballero A. 1995. On the effective size of populations with separate sexes, with particular reference to sex-linked genes. Genetics 139(2):1007–1011. [DOI] [PMC free article] [PubMed] [Google Scholar]
- Campos JL, Halligan DL, Haddrill PR, Charlesworth B.. 2014. The relation between recombination rate and patterns of molecular evolution and variation in Drosophila melanogaster. Mol Biol Evol. 31(4):1010–1028. [DOI] [PMC free article] [PubMed] [Google Scholar]
- Casimiro-Soriguer I, Buide ML, Narbona E.. 2015. Diversity of sexual systems within different lineages of the genus Silene. AoB Plants. 7(0):plv037.. [DOI] [PMC free article] [PubMed] [Google Scholar]
- Charlesworth B. 2009. Effective population size and patterns of molecular evolution and variation. Nat Rev Genet. 10(3):195–205. [DOI] [PubMed] [Google Scholar]
- Charlesworth B. 2012. The effects of deleterious mutations on evolution at linked sites. Genetics 190(1):5–22. [DOI] [PMC free article] [PubMed] [Google Scholar]
- Charlesworth B, Charlesworth D.. 2000. The degeneration of Y chromosomes. Philos Trans R Soc B Biol Sci. 355(1403):1563–1572. [DOI] [PMC free article] [PubMed] [Google Scholar]
- Charlesworth B, Coyne JA, Barton NH.. 1987. The relative rates of evolution of sex chromosomes and autosomes. Am Nat. 130(1):113–146. [Google Scholar]
- Charlesworth B, Morgan MT, Charlesworth D.. 1993. The effect of deleterious mutations on neutral molecular variation. Genetics 134(4):1289–1303. [DOI] [PMC free article] [PubMed] [Google Scholar]
- Charlesworth D. 2002. Plant sex determination and sex chromosomes. Heredity 88(2):94–101. [DOI] [PubMed] [Google Scholar]
- Charlesworth D. 2006. Balancing selection and its effects on sequences in nearby genome regions. PLoS Genet. 2(4):e64.. [DOI] [PMC free article] [PubMed] [Google Scholar]
- Chu J-H, et al. 2013. Inferring the geographic mode of speciation by contrasting autosomal and sex-linked genetic diversity. Mol Biol Evol. 30(11):2519–30. [DOI] [PubMed] [Google Scholar]
- Corl A, Ellegren H.. 2012. The genomic signature of sexual selection in the genetic diversity of the sex chromosomes and autosomes. Evolution 66(7):2138–2149. [DOI] [PubMed] [Google Scholar]
- Cotter DJ, Brotman SM, Wilson Sayres MA.. 2016. Genetic diversity on the human X chromosome does not support a strict pseudoautosomal boundary. Genetics. 203(1):485–492. [DOI] [PMC free article] [PubMed] [Google Scholar]
- Coyne JA, Orr HA.. 1989. Two rules of speciation In: Otte D, Endler J, editors. Speciation and its consequences. Sunderland (MA: ): Sinauer Associates; p. 180–207. [Google Scholar]
- Cruciani F, et al. 2011. A revised root for the human Y chromosomal phylogenetic tree: the origin of patrilineal diversity in Africa. Am J Hum Genet. 88(6):814–818. [DOI] [PMC free article] [PubMed] [Google Scholar]
- DeGiorgio M, Lohmueller KE, Nielsen R.. 2014. A model-based approach for identifying signatures of ancient balancing selection in genetic data. PLOS Genet. 10(8):e1004561.. [DOI] [PMC free article] [PubMed] [Google Scholar]
- Dellaporta SL, Calderon-Urrea A.. 1993. Sex determination in flowering plants. Plant Cell 5(10):1241–1251. [DOI] [PMC free article] [PubMed] [Google Scholar]
- Delph LF, Kelly JK.. 2014. On the importance of balancing selection in plants. New Phytol. 201(1):45.. [DOI] [PMC free article] [PubMed] [Google Scholar]
- Dutheil JY, Munch K, Nam K, Mailund T, Schierup MH.. 2015. Strong selective sweeps on the X chromosome in the human-chimpanzee ancestor explain its low divergence. PLoS Genet. 11(8):e1005451.. [DOI] [PMC free article] [PubMed] [Google Scholar]
- Ellegren H. 2007. Characteristics, causes and evolutionary consequences of male-biased mutation. Proc R Soc B Biol Sci. 274(1606):1–10. [DOI] [PMC free article] [PubMed] [Google Scholar]
- Ellegren H, Fridolfsson A-K.. 2003. Sex-specific mutation rates in salmonoid fish. J Mol Evol. 56(4):458–463. [DOI] [PubMed] [Google Scholar]
- Emery LS, Felsenstein J, Akey JM.. 2010. Estimators of the human effective sex ratio detect sex biases on different timescales. Am J Hum Genet. 87(6):848–856. [DOI] [PMC free article] [PubMed] [Google Scholar]
- Evans BJ, Charlesworth B.. 2013. The effect of nonindependent mate pairing on the effective population size. Genetics 193(2):545–556. [DOI] [PMC free article] [PubMed] [Google Scholar]
- Evans BJ, Zeng K, Esselstyn JA, Charlesworth B, Melnick DJ.. 2014. Reduced representation genome sequencing suggests low diversity on the sex chromosomes of tonkean macaque monkeys. Mol Biol Evol. 31(9):2425–2440. [DOI] [PubMed] [Google Scholar]
- Eyre-Walker A. 2002. Changing effective population size and the McDonald-Kreitman test. Genetics 162(4):2017–2024. [DOI] [PMC free article] [PubMed] [Google Scholar]
- Filatov DA, Charlesworth D.. 2002. Substitution rates in the X- and Y-linked genes of the plants, Silene latifolia and S. dioica. Mol Biol Evol. 19(6):898–907. [DOI] [PubMed] [Google Scholar]
- Fontanillas E, et al. 2015. Degeneration of the nonrecombining regions in the mating-type chromosomes of the anther-smut fungi. Mol Biol Evol. 32(4):928–943. [DOI] [PMC free article] [PubMed] [Google Scholar]
- Fraser JA, et al. 2004. Convergent evolution of chromosomal sex-determining regions in the animal and fungal kingdoms. PLoS Biol. 2(12):e384. [DOI] [PMC free article] [PubMed] [Google Scholar]
- Fraser JA, Heitman J.. 2005. Chromosomal sex-determining regions in animals, plants and fungi. Curr Opin Genet Dev. 15(6):645–651. [DOI] [PubMed] [Google Scholar]
- Fujito S, et al. 2015. Evidence for a common origin of homomorphic and heteromorphic sex chromosomes in distinct Spinacia species. G3 5(8):1663–1673. [DOI] [PMC free article] [PubMed] [Google Scholar]
- Garrigan D, Kingan SB, Geneva AJ, Vedanayagam JP, Presgraves DC.. 2014. Genome diversity and divergence in Drosophila mauritiana: multiple signatures of faster X evolution. Genome Biol Evol. 6(9):2444–2458. [DOI] [PMC free article] [PubMed] [Google Scholar]
- Gebler P, Wolko Ł, Knaflewski M.. 2007. Identification of molecular markers for selection of supermale (YY) asparagus plants. J Appl Genet. 48(2):129–131. [DOI] [PubMed] [Google Scholar]
- Gottipati S, Arbiza L, Siepel A, Clark AG, Keinan A.. 2011. Analyses of X-linked and autosomal genetic variation in population-scale whole genome sequencing. Nat Genet. 43(8):741–743. [DOI] [PMC free article] [PubMed] [Google Scholar]
- Gredler JN, Hish AJ, Noor MAF.. 2015. Temporal stability of molecular diversity measures in natural populations of Drosophila pseudoobscura and Drosophila persimilis. J Hered. 106(4):407–411. [DOI] [PMC free article] [PubMed] [Google Scholar]
- Greenwood PJ. 1980. Mating systems, philopatry and dispersal in birds and mammals. Anim Behav. 28(4):1140–1162. [Google Scholar]
- Haddrill PR, Loewe L, Charlesworth B.. 2010. Estimating the parameters of selection on nonsynonymous mutations in Drosophila pseudoobscura and D. miranda. Genetics 185(4):1381–1396. [DOI] [PMC free article] [PubMed] [Google Scholar]
- Hallast P, et al. 2015. The Y-chromosome tree bursts into leaf: 13,000 high-confidence SNPs covering the majority of known clades. Mol Biol Evol. 32(3):661–673. [DOI] [PMC free article] [PubMed] [Google Scholar]
- Hallast P, et al. 2016. Great-ape Y chromosome and mitochondrial DNA phylogenies reflect subspecies structure and patterns of mating and dispersal. Genome Res. 26(4):427–439. [DOI] [PMC free article] [PubMed] [Google Scholar]
- Hammer MF, et al. 2004. Heterogeneous patterns of variation among multiple human X-linked loci the possible role of diversity-reducing selection in non-Africans. Genetics 167(4):1841–1853. [DOI] [PMC free article] [PubMed] [Google Scholar]
- Hammer MF, et al. 2010. The ratio of human X chromosome to autosome diversity is positively correlated with genetic distance from genes. Nat Genet. 42(10):830–831. [DOI] [PubMed] [Google Scholar]
- Hammer MF, Mendez FL, Cox MP, Woerner AE, Wall JD.. 2008. Sex-biased evolutionary forces shape genomic patterns of human diversity. PLoS Genet. 4(9):e1000202.. [DOI] [PMC free article] [PubMed] [Google Scholar]
- Hartl DL, Clark AG.. 1997. Principles of population genetics. Sunderland (MA): Sinauer Associates. [Google Scholar]
- Heideman C, Munhoz REF, Pattaro Júnior JR, Fernandez MA.. 2010. Genetic diversity analysis with RAPD linked to sex identification in the sugar cane borer Diatraea saccharalis. Genet Mol Res. 9(4):2343–2348. [DOI] [PubMed] [Google Scholar]
- Hellborg L, Ellegren H.. 2004. Low levels of nucleotide diversity in mammalian Y chromosomes. Mol Biol Evol. 21(1):158–163. [DOI] [PubMed] [Google Scholar]
- Herrig DK, Modrick AJ, Brud E, Llopart A, Navarro A.. 2014. Introgression in the Drosophila subobscura—D. madeirensis sister species: evidence of gene flow in nuclear genes despite mitochondrial differentiation. Evol Int J Org Evol. 68(3):705–719. [DOI] [PMC free article] [PubMed] [Google Scholar]
- Heyer E, Chaix R, Pavard S, Austerlitz F.. 2012. Sex-specific demographic behaviours that shape human genomic variation. Mol Ecol. 21(3):597–612. [DOI] [PubMed] [Google Scholar]
- Hough J, Wang W, Barrett SCH, Wright SI.. 2017. Hill-Robertson interference reduces genetic diversity on a young plant Y-chromosome. Genetics. 207(2):685–695. [DOI] [PMC free article] [PubMed] [Google Scholar]
- Hu X-S, Filatov DA.. 2016. The large-X effect in plants: increased species divergence and reduced gene flow on the Silene X-chromosome. Mol Ecol. 25(11):2609–2619. [DOI] [PubMed] [Google Scholar]
- Huang H, Rabosky DL.. 2015. Sex-linked genomic variation and its relationship to avian plumage dichromatism and sexual selection. BMC Evol Biol. 15:199.. [DOI] [PMC free article] [PubMed] [Google Scholar]
- Hurst LD, Ellegren H.. 1998. Sex biases in the mutation rate. Trends Genet. 14(11):446–452. [DOI] [PubMed] [Google Scholar]
- Hvilsom C, et al. 2012. Extensive X-linked adaptive evolution in central chimpanzees. Proc Natl Acad Sci U S A. 109(6):2054–2059. [DOI] [PMC free article] [PubMed] [Google Scholar]
- Jiang P-P, Hartl DL, Lemos B.. 2010. Y not a dead end: epistatic interactions between Y-linked regulatory polymorphisms and genetic background affect global gene expression in Drosophila melanogaster. Genetics 186(1):109–118. [DOI] [PMC free article] [PubMed] [Google Scholar]
- Kaiser VB, Bachtrog D.. 2010. Evolution of sex chromosomes in insects. Annu Rev Genet. 44:91–112. [DOI] [PMC free article] [PubMed] [Google Scholar]
- Kaiser VB, Bergero R, Charlesworth D.. 2011. A new plant sex-linked gene with high sequence diversity and possible introgression of the X copy. Heredity 106(2):339–347. [DOI] [PMC free article] [PubMed] [Google Scholar]
- Karmin M, et al. 2015. A recent bottleneck of Y chromosome diversity coincides with a global change in culture. Genome Res. 25(4):459–466. [DOI] [PMC free article] [PubMed] [Google Scholar]
- Keinan A, Mullikin JC, Patterson N, Reich D.. 2009. Accelerated genetic drift on chromosome X during the human dispersal out of Africa. Nat Genet. 41(1):66–70. [DOI] [PMC free article] [PubMed] [Google Scholar]
- Keinan A, Reich D.. 2010a. Can a sex-biased human demography account for the reduced effective population size of chromosome X in non-Africans? Mol Biol Evol. 27(10):2312–2321. [DOI] [PMC free article] [PubMed] [Google Scholar]
- Keinan A, Reich D.. 2010b. Human population differentiation is strongly correlated with local recombination rate. PLoS Genet. 6(3):e1000886.. [DOI] [PMC free article] [PubMed] [Google Scholar]
- Langley CH, et al. 2012. Genomic variation in natural populations of Drosophila melanogaster. Genetics 192(2):533–598. [DOI] [PMC free article] [PubMed] [Google Scholar]
- Laporte V, Charlesworth B.. 2002. Effective population size and population subdivision in demographically structured populations. Genetics 162(1):501–519. [DOI] [PMC free article] [PubMed] [Google Scholar]
- Larracuente AM, Clark AG.. 2013. Surprising differences in the variability of Y chromosomes in African and cosmopolitan populations of Drosophila melanogaster. Genetics 193(1):201–214. [DOI] [PMC free article] [PubMed] [Google Scholar]
- Lau AN, et al. 2009. Horse domestication and conservation genetics of Przewalski’s horse Inferred from sex chromosomal and autosomal sequences. Mol Biol Evol. 26(1):199–208. [DOI] [PubMed] [Google Scholar]
- Lavretsky P, et al. 2015. Speciation genomics and a role for the Z chromosome in the early stages of divergence between Mexican ducks and mallards. Mol Ecol. 24(21):5364–5378. [DOI] [PubMed] [Google Scholar]
- Lawson Handley LJ, Berset-Brändli L, Perrin N.. 2006. Disentangling reasons for low Y chromosome variation in the greater white-toothed shrew (Crocidura russula). Genetics 173(2):935–942. [DOI] [PMC free article] [PubMed] [Google Scholar]
- Lengeler KB, et al. 2002. Mating-type locus of Cryptococcus neoformans: a step in the evolution of sex chromosomes. Eukaryot Cell. 1(5):704–718. [DOI] [PMC free article] [PubMed] [Google Scholar]
- Li J, et al. 2012. Joint analysis of demography and selection in population genetics: where do we stand and where could we go? Mol Ecol. 21(1):28–44. [DOI] [PubMed] [Google Scholar]
- Li M-H, Merilä J.. 2010. Genetic evidence for male-biased dispersal in the Siberian jay (Perisoreus infaustus) based on autosomal and Z-chromosomal markers. Mol Ecol. 19(23):5281–5295. [DOI] [PubMed] [Google Scholar]
- Lin S-H, Huang Y-Y, Chang H.. 2008. Cooption of neo-X and neo-Y chromosomes in Drosophila albomicans. Zool Stud. 47(3):293–301. [Google Scholar]
- Lindgren G, et al. 2004. Limited number of patrilines in horse domestication. Nat Genet. 36(4):335–336. [DOI] [PubMed] [Google Scholar]
- Lohmueller KE, et al. 2011. Natural selection affects multiple aspects of genetic variation at putatively neutral sites across the human genome. PLoS Genet. 7(10):e1002326. [DOI] [PMC free article] [PubMed] [Google Scholar]
- Lucotte EA, et al. 2017. Dynamic copy number evolution of X- and Y-linked ampliconic genes in human populations. BioRxiv. doi: 10.1101/228841. [DOI] [PMC free article] [PubMed]
- Luo S-J, et al. 2007. Development of Y chromosome intraspecific polymorphic markers in the Felidae. J Hered. 98(5):400–413. [DOI] [PubMed] [Google Scholar]
- Mank JE, Nam K, Ellegren H.. 2010. Faster-Z evolution is predominantly due to genetic drift. Mol Biol Evol. 27(3):661–670. [DOI] [PubMed] [Google Scholar]
- Marais GAB, et al. 2008. Evidence for degeneration of the Y chromosome in the dioecious plant Silene latifolia. Curr Biol. 18(7):545–549. [DOI] [PubMed] [Google Scholar]
- Martin SH, et al. 2013. Genome-wide evidence for speciation with gene flow in Heliconius butterflies. Genome Res. 23(11):1817–1828. [DOI] [PMC free article] [PubMed] [Google Scholar]
- McDaniel SF, Neubig KM, Payton AC, Quatrano RS, Cove DJ.. 2013. Recent gene-capture on the UV sex chromosomes of the moss Ceratodon purpureus. Evol Int J Org Evol. 67(10):2811–2822. [DOI] [PMC free article] [PubMed] [Google Scholar]
- McDonald JH, Kreitman M.. 1991. Adaptive protein evolution at the Adh locus in Drosophila. Nature 351(6328):652–654. [DOI] [PubMed] [Google Scholar]
- McGaugh SE, et al. 2012. Recombination modulates how selection affects linked sites in Drosophila. PLoS Biol. 10(11):e1001422. [DOI] [PMC free article] [PubMed] [Google Scholar]
- Meisel RP, Connallon T.. 2013. The faster-X effect: integrating theory and data. Trends Genet. 29(9):537–544. [DOI] [PMC free article] [PubMed] [Google Scholar]
- Mendez FL, et al. 2013. An African American paternal lineage adds an extremely ancient root to the human Y chromosome phylogenetic tree. Am J Hum Genet. 92(3):454–459. [DOI] [PMC free article] [PubMed] [Google Scholar]
- Miyata T, Hayashida H, Kuma K, Mitsuyasu K, Yasunaga T.. 1987. Male-driven molecular evolution: a model and nucleotide sequence analysis. Cold Spring Harb Symp Quant Biol. 52:863–867. [DOI] [PubMed] [Google Scholar]
- Moghadam HK, Pointer MA, Wright AE, Berlin S, Mank JE.. 2012. W chromosome expression responds to female-specific selection. Proc Natl Acad Sci U S A. 109(21):8207–8211. [DOI] [PMC free article] [PubMed] [Google Scholar]
- Muir G, Bergero R, Charlesworth D, Filatov DA.. 2011. Does local adaptation cause high population differentiation of Silene latifolia Y chromosomes? Evol Int J Org Evol. 65(12):3368–3380. [DOI] [PubMed] [Google Scholar]
- Na J-K, et al. 2012. Construction of physical maps for the sex-specific regions of papaya sex chromosomes. BMC Genomics 13:176.. [DOI] [PMC free article] [PubMed] [Google Scholar]
- Nachman MW, Bauer VL, Crowell SL, Aquadro CF.. 1998. DNA variability and recombination rates at X-linked loci in humans. Genetics 150(3):1133–1141. [DOI] [PMC free article] [PubMed] [Google Scholar]
- Nam K, et al. 2015. Extreme selective sweeps independently targeted the X chromosomes of the great apes. Proc Natl Acad Sci U S A. 112(20):6413–6418. [DOI] [PMC free article] [PubMed] [Google Scholar]
- Neve RA. 1958. Sex chromosomes in the hop Humulus lupulus. Nature 181(4615):1084–1085. [Google Scholar]
- O’Fallon B. 2013. Purifying selection causes widespread distortions of genealogical structure on the human X chromosome. Genetics 194:485–492. [DOI] [PMC free article] [PubMed] [Google Scholar]
- Osada N, et al. 2013. Finding the factors of reduced genetic diversity on X chromosomes of Macaca fascicularis: male-driven evolution, demography, and natural selection. Genetics 195(3):1027–1035. [DOI] [PMC free article] [PubMed] [Google Scholar]
- Otto SP, et al. 2011. About PAR: the distinct evolutionary dynamics of the pseudoautosomal region. Trends Genet. 27(9):358–367. [DOI] [PubMed] [Google Scholar]
- van Oven M, et al. 2014. Human genetics of the Kula Ring: Y-chromosome and mitochondrial DNA variation in the Massim of Papua New Guinea. Eur J Hum Genet. 22(12):1393–1403. [DOI] [PMC free article] [PubMed] [Google Scholar]
- Oyler-McCance SJ, Cornman RS, Jones KL, Fike JA.. 2015. Z chromosome divergence, polymorphism and relative effective population size in a genus of lekking birds. Heredity 115(5):452–459. [DOI] [PMC free article] [PubMed] [Google Scholar]
- Pala I, Hasselquist D, Bensch S, Hansson B.. 2012. Patterns of molecular evolution of an avian neo-sex chromosome. Mol Biol Evol. 29(12):3741–3754. [DOI] [PubMed] [Google Scholar]
- Pala I, Naurin S.. et al. 2012. Evidence of a neo-sex chromosome in birds. Heredity 108(3):264–272. [DOI] [PMC free article] [PubMed] [Google Scholar]
- Payne BAI, et al. 2013. Universal heteroplasmy of human mitochondrial DNA. Hum Mol Genet. 22(2):384–390. [DOI] [PMC free article] [PubMed] [Google Scholar]
- Payseur BA, Nachman MW.. 2002. Gene density and human nucleotide polymorphism. Mol Biol Evol. 19(3):336–340. [DOI] [PubMed] [Google Scholar]
- Picq S, et al. 2014. A small XY chromosomal region explains sex determination in wild dioecious V. vinifera and the reversal to hermaphroditism in domesticated grapevines. BMC Plant Biol. 4:229. [DOI] [PMC free article] [PubMed] [Google Scholar]
- Pool JE, et al. 2012. Population genomics of sub-Saharan Drosophila melanogaster: African diversity and non-African admixture. PLoS Genet. 8(12):e1003080. [DOI] [PMC free article] [PubMed] [Google Scholar]
- Pool JE, Nielsen R.. 2007. Population size changes reshape genomic patterns of diversity. Evolution 61(12):3001–3006. [DOI] [PMC free article] [PubMed] [Google Scholar]
- Poznik GD, et al. 2013. Sequencing Y chromosomes resolves discrepancy in time to common ancestor of males versus females. Science 341(6145):562–565. [DOI] [PMC free article] [PubMed] [Google Scholar]
- Poznik GD, et al. 2016. Punctuated bursts in human male demography inferred from 1, 244 worldwide Y-chromosome sequences. Nat Genet., advance online publication. 48(6):593–599. [DOI] [PMC free article] [PubMed] [Google Scholar]
- Prado-Martinez J, et al. 2013. Great ape genetic diversity and population history. Nature 499(7459):471–475. [DOI] [PMC free article] [PubMed] [Google Scholar]
- Putnam AS, Scriber JM, Andolfatto P.. 2007. Discordant divergence times among Z-chromosome regions between two ecologically distinct Swallowtail butterfly species. Evolution 61(4):912–927. [DOI] [PubMed] [Google Scholar]
- Qiu S, et al. 2010. Nucleotide diversity in Silene latifolia autosomal and sex-linked genes. Proc R Soc B Biol Sci. 277(1698):3283–3290. [DOI] [PMC free article] [PubMed] [Google Scholar]
- Raudsepp T, Das PJ, Avila F, Chowdhary BP.. 2012. The pseudoautosomal region and sex chromosome aneuploidies in domestic species. Sex Dev. 6(1–3):72–83. [DOI] [PubMed] [Google Scholar]
- Rebolledo-Jaramillo B, et al. 2014. Maternal age effect and severe germ-line bottleneck in the inheritance of human mitochondrial DNA. Proc Natl Acad Sci. 111(43):15474–15479. [DOI] [PMC free article] [PubMed] [Google Scholar]
- Rice WR. 1984. Sex chromosomes and the evolution of sexual dimorphism. Evolution 38(4):735–742. [DOI] [PubMed] [Google Scholar]
- Rousselle M, Faivre N, Ballenghien M, Galtier N, Nabholz B.. 2016. Hemizygosity enhances purifying selection: lack of fast-Z evolution in two Satyrine butterflies. Genome Biol Evol. 8(10):3108–3119. [DOI] [PMC free article] [PubMed] [Google Scholar]
- Sackton TB, et al. 2014. Positive selection drives faster-Z evolution in silkmoths. Evolution 68(8):2331–2342. [DOI] [PMC free article] [PubMed] [Google Scholar]
- Sackton TB, Hartl DL.. 2013. Meta-analysis reveals that genes regulated by the Y chromosome in Drosophila melanogaster are preferentially localized to repressive chromatin. Genome Biol Evol. 5(1):255–266. [DOI] [PMC free article] [PubMed] [Google Scholar]
- Sackton TB, Montenegro H, Hartl DL, Lemos B.. 2011. Interspecific Y chromosome introgressions disrupt testis-specific gene expression and male reproductive phenotypes in Drosophila. Proc Natl Acad Sci U S A. 108(41):17046–17051. [DOI] [PMC free article] [PubMed] [Google Scholar]
- Sahara K, Yoshido A, Traut W.. 2012. Sex chromosome evolution in moths and butterflies. Chromosome Res. 20(1):83–94. [DOI] [PubMed] [Google Scholar]
- Satomura K, Tamura K.. 2016. Ancient male recombination shaped genetic diversity of neo-Y chromosome in Drosophila albomicans. Mol Biol Evol. 33(2):367–374. [DOI] [PubMed] [Google Scholar]
- Schaffner SF. 2004. The X chromosome in population genetics. Nat Rev Genet. 5(1):43–51. [DOI] [PubMed] [Google Scholar]
- Schaeffer SW, et al. 2008. Polytene chromosomal maps of 11 Drosophila species: the order of genomic scaffolds inferred from genetic and physical maps. Genetics 179(3):1601–1655. [DOI] [PMC free article] [PubMed] [Google Scholar]
- Scozzari R, et al. 2014. An unbiased resource of novel SNP markers provides a new chronology for the human Y chromosome and reveals a deep phylogenetic structure in Africa. Genome Res. 24(3):535–544. [DOI] [PMC free article] [PubMed] [Google Scholar]
- Shan W, et al. 2014. Maternal and paternal diversity in Xinjiang Kazakh population from China. Genetika 50(11):1374–1385. [DOI] [PubMed] [Google Scholar]
- Shannon LM, et al. 2015. Genetic structure in village dogs reveals a Central Asian domestication origin. Proc Natl Acad Sci U S A. 112(44):13639–13644. [DOI] [PMC free article] [PubMed] [Google Scholar]
- Singh ND, Jensen JD, Clark AG, Aquadro CF.. 2013. Inferences of demography and selection in an African population of Drosophila melanogaster. Genetics 193(1):215–228. [DOI] [PMC free article] [PubMed] [Google Scholar]
- Singh ND, Macpherson JM, Jensen JD, Petrov DA.. 2007. Similar levels of X-linked and autosomal nucleotide variation in African and non-African populations of Drosophila melanogaster. BMC Evol Biol. 7:202.. [DOI] [PMC free article] [PubMed] [Google Scholar]
- Smeds L, et al. 2015. Evolutionary analysis of the female-specific avian W chromosome. Nat Commun. 6:7330. [DOI] [PMC free article] [PubMed] [Google Scholar]
- Smith JM, Haigh J.. 1974. The hitch-hiking effect of a favourable gene. Genet Res. 23(1):23–35. [PubMed] [Google Scholar]
- Sommer V, Bauer J, Fowler A, Ortmann S.. 2011. Patriarchal chimpanzees, matriarchal bonobos: potential ecological causes of a pan dichotomy. In: Sommer V, Ross C, editors. Primates of Gashaka, Developments in Primatology: 417 Progress and Prospects 35, New York: Springer. p. 469–501.
- Stone AC, Griffiths RC, Zegura SL, Hammer MF.. 2002. High levels of Y-chromosome nucleotide diversity in the genus Pan. Proc Natl Acad Sci U S A. 99(1):43–48. [DOI] [PMC free article] [PubMed] [Google Scholar]
- Tajima F. 1989. Statistical method for testing the neutral mutation hypothesis by DNA polymorphism. Genetics 123(3):585–595. [DOI] [PMC free article] [PubMed] [Google Scholar]
- Tajima F. 1996. The amount of DNA polymorphism maintained in a finite population when the neutral mutation rate varies among sites. Genetics 143:1457–1465. [DOI] [PMC free article] [PubMed] [Google Scholar]
- Ueno H, et al. 2015. Genome sequence comparison reveals a candidate gene involved in male-hermaphrodite differentiation in papaya (Carica papaya) trees. Mol Genet Genomics. 290(2):661–670. [DOI] [PubMed] [Google Scholar]
- VanBuren R, et al. 2015. Origin and domestication of papaya Yh chromosome. Genome Res. 25(4):524–533. [DOI] [PMC free article] [PubMed] [Google Scholar]
- Veeramah KR, Gutenkunst RN, Woerner AE, Watkins JC, Hammer MF.. 2014. Evidence for increased levels of positive and negative selection on the X chromosome versus autosomes in humans. Mol Biol Evol. 31(9):2267–2282. [DOI] [PMC free article] [PubMed] [Google Scholar]
- Vicoso B, Charlesworth B.. 2006. Evolution on the X chromosome: unusual patterns and processes. Nat Rev Genet. 7(8):645–653. [DOI] [PubMed] [Google Scholar]
- Vilar MG, et al. 2014. Genetic diversity in Puerto Rico and its implications for the peopling of the Island and the West Indies. Am J Phys Anthropol. 155(3):352–368. [DOI] [PubMed] [Google Scholar]
- Votintseva AA, Filatov DA.. 2011. DNA polymorphism in recombining and non-recombing mating-type-specific loci of the smut fungus Microbotryum. Heredity 106(6):936–944. [DOI] [PMC free article] [PubMed] [Google Scholar]
- Wallner B, Brem G, Müller M, Achmann R.. 2003. Fixed nucleotide differences on the Y chromosome indicate clear divergence between Equus przewalskii and Equus caballus. Anim Genet. 34(6):453–456. [DOI] [PubMed] [Google Scholar]
- Wallner B, et al. 2013. Identification of genetic variation on the horse Y chromosome and the tracing of male founder lineages in modern breeds. PLoS One 8(4):e60015. [DOI] [PMC free article] [PubMed] [Google Scholar]
- Wang J, et al. 2012. Sequencing papaya X and Yh chromosomes reveals molecular basis of incipient sex chromosome evolution. Proc Natl Acad Sci U S A. 109(34):13710–13715. [DOI] [PMC free article] [PubMed] [Google Scholar]
- Wang Z, et al. 2014. Temporal genomic evolution of bird sex chromosomes. BMC Evol Biol. 109(34):13710–13715. [DOI] [PMC free article] [PubMed] [Google Scholar]
- Webster TH, Wilson Sayres MA.. 2016. Genomic signatures of sex-biased demography: progress and prospects. Curr Opin Genet Dev. 41:62–71. [DOI] [PubMed] [Google Scholar]
- Weingartner LA, Moore RC.. 2012. Contrasting patterns of X/Y polymorphism distinguish Carica papaya from other sex chromosome systems. Mol Biol Evol. 29(12):3909–3920. [DOI] [PubMed] [Google Scholar]
- Westergaard M. 1958. The mechanism of sex determination in dioecious flowering plants. Adv Genet. 9:217–281. [DOI] [PubMed] [Google Scholar]
- Wilder JA, Mobasher Z, Hammer MF.. 2004. Genetic evidence for unequal effective population sizes of human females and males. Mol Biol Evol. 21(11):2047–2057. [DOI] [PubMed] [Google Scholar]
- Wilson MA, Makova KD.. 2009. Evolution and survival on eutherian sex chromosomes. PLoS Genet. 5(7):e1000568.. [DOI] [PMC free article] [PubMed] [Google Scholar]
- Wilson Sayres MA. 2013. Timing of ancient human Y lineage depends on the mutation rate: a comment on Mendez et al. ArXiv13046098 Q-Bio. Available from: http://arxiv.org/abs/1304.6098 (accessed May 8, 2016).
- Wilson Sayres MA, Lohmueller KE, Nielsen R.. 2014. Natural selection reduced diversity on human Y chromosomes. PLoS Genet. 10(1):e1004064.. [DOI] [PMC free article] [PubMed] [Google Scholar]
- Wilson Sayres MA, Venditti C, Pagel M, Makova KD.. 2011. Do variations in substitution rates and male mutation bias correlate with life-history traits? A study of 32 mammalian genomes. Evol Int J Org Evol. 65(10):2800–2815. [DOI] [PubMed] [Google Scholar]
- Wright S. 1931. Evolution in Mendelian populations. Genetics 16(2):97–159. [DOI] [PMC free article] [PubMed] [Google Scholar]
- Wu M, Moore RC.. 2015. The evolutionary tempo of sex chromosome degradation in Carica papaya. J Mol Evol. 80(5–6):265–277. [DOI] [PubMed] [Google Scholar]
- Yi S, Charlesworth B.. 2000. Contrasting patterns of molecular evolution of the genes on the new and old sex chromosomes of Drosophila miranda. Mol Biol Evol. 17(5):703–717. [DOI] [PubMed] [Google Scholar]
- Yu F, et al. 2015. Population genomic analysis of 962 whole genome sequences of humans reveals natural selection in non-coding regions. PLoS One 10(3):e0121644. [DOI] [PMC free article] [PubMed] [Google Scholar]
- Yue X-P, Dechow C, Liu W-S.. 2015. A limited number of Y chromosome lineages is present in North American Holsteins. J Dairy Sci. 98(4):2738–2745. [DOI] [PubMed] [Google Scholar]
- Ye D, et al. 2017. Copy number variation of ampliconic genes across major human Y haplogroups. BioRxiv. doi: 10.1101/230342. [DOI] [PMC free article] [PubMed]
- Zhang Q, et al. 2015. High-density interspecific genetic maps of kiwifruit and the identification of sex-specific markers. DNA Res. 22(5):367–375. [DOI] [PMC free article] [PubMed] [Google Scholar]
- Zhou Q, et al. 2014. Complex evolutionary trajectories of sex chromosomes across bird taxa. Science 346(6215):1246338. [DOI] [PMC free article] [PubMed] [Google Scholar]
- Zurovcova M, Eanes WF.. 1999. Lack of nucleotide polymorphism in the Y-linked sperm flagellar dynein gene Dhc-Yh3 of Drosophila melanogaster and D. simulans. Genetics 153:1709–1715. [DOI] [PMC free article] [PubMed] [Google Scholar]