

Abstract
Objective
To determine the effect of disclosure of rheumatoid arthritis (RA) risk personalized with genetics, biomarkers, and lifestyle factors on health behavior intentions.
Methods
We performed a randomized controlled trial among first-degree relatives without RA. Subjects assigned to the Personalized Risk Estimator for RA (PRE-RA) group received the web-based PRE-RA tool for RA risk factor education and disclosure of personalized RA risk estimates including genotype/autoantibody results and behaviors (n=158). Subjects assigned to the comparison arm received standard RA education (n=80). The primary outcome was readiness for change based on the transtheoretical model, using validated contemplation ladder scales. Increased motivation to improve RA risk-related behaviors (smoking, diet, exercise, or dental hygiene) was defined as an increase in any ladder score compared to baseline assessed immediately, 6 weeks, and 6 months post-intervention. Subjects reported behavior change at each visit. We performed intention-to-treat analyses using generalized estimating equations for the binary outcome.
Results
Subjects randomized to PRE-RA were more likely to increase ladder scores over post-intervention assessments (RR 1.23, 95%CI 1.01–1.51) than those randomized to non-personalized education. At 6 months, 63.9% of PRE-RA subjects and 50.0% of comparison subjects increased motivation to improve behaviors (age-adjusted difference 15.8%, 95%CI 2.8–28.8%). Compared to non-personalized education, more PRE-RA subjects increased fish intake (45.0% vs. 22.1%; p=0.005), brushed more frequently (40.7% vs. 22.9%; p=0.01), flossed more frequently (55.7% vs. 34.8%; p=0.004), and quit smoking (62.5% vs. 0.0% among 11 smokers; p=0.18).
Conclusion
Disclosure of RA risk personalized with genotype/biomarker results and behaviors increased motivation to improve RA risk-related behaviors. Personalized medicine approaches may motivate health behavior improvements for those at risk for RA and provide rationale for larger studies evaluating effects of behavior changes on clinical outcomes such as RA-related autoantibody production or RA development.
Keywords: personalized medicine, genetics, public health, rheumatoid arthritis, prevention
The identification of genetics, biomarkers, and behavioral risk factors associated with chronic diseases in epidemiologic studies has helped to elucidate pathogenesis and enhance prevention strategies. Personalized medicine approaches incorporating these factors have been advocated to target chronic disease prevention efforts to those at highest risk (1). Health behavior improvements, such as smoking cessation, can prevent or reduce the risk of developing many serious chronic diseases such as cancer and diabetes as well as cardiovascular, respiratory, and autoimmune diseases (2). A meta-analysis of 18 clinical trials evaluating risk disclosure for chronic diseases personalized with genetic information reported minimal effect for improving health behaviors or increasing motivation to change behavior (3). Since many genes are not deterministic, but rather susceptibility genes that increase the probability of chronic disease, risk disclosure incorporating behavioral or biomarker risk factors may be needed to further motivate behavior improvements.
Similar to other complex chronic diseases, the etiology of rheumatoid arthritis (RA) is not yet fully understood, but many risk factors have been identified. HLA-DRB1 positivity is the strongest genetic risk factor, increasing risk by about three-fold (4, 5). Behavioral factors, such as smoking, obesity, low fish intake, and poor dental health, are associated with increased RA risk (6–9). Smoking is the strongest behavioral RA risk factor and prolonged cessation >20 years decreases RA risk to that of never smokers, suggesting that smoking cessation may lower RA risk (6, 10, 11) Increased fish intake is associated with decreased RA risk perhaps due to the anti-inflammatory effects of omega-3 fatty acids (8, 12, 13). Being overweight or obese is associated with increased RA risk (7, 14). Poor dental hygiene is a risk factor for periodontitis, which is associated with increased RA risk perhaps related to the effects of bacterial peptidylarginine deiminase enzymes from Porphyromonas gingivalis on citrullination and autoimmunity (9, 15, 16). None of these factors have been studied for risk reduction with behavior change, except for smoking cessation (10, 11). Having a first-degree relative (FDR) with RA increases personal RA risk by four-fold, likely due to shared genetic and behavioral risk factors (17, 18). The presence of RA-related serum autoantibodies (rheumatoid factor [RF] and cyclic citrullinated peptide [CCP]) markedly increases the risk for subsequent RA development (19). Risk models incorporating these factors can accurately identify those at very elevated RA risk, particularly when performed among FDRs (20). The population attributable risk for RA of known behavioral factors is about 40%, suggesting that improving these health behaviors may reduce risk of developing RA (17). Intention to change behavior is the first step toward persistent behavior change, which may subsequently lead to demonstrable effects on health outcomes such as autoantibody development or RA risk.
We conducted the Personalized Risk Estimator for RA (PRE-RA) Family Study as a proof-of-concept trial to investigate whether RA risk disclosure to unaffected FDRs personalized with genetics, biomarkers, and behaviors would increase motivation to change behaviors related to RA development. We hypothesized that those who received personalized RA risk disclosure would be more motivated to change RA risk-related behaviors compared to those not receiving this information.
METHODS
Study Population
We recruited unaffected adult FDRs of patients with RA at a single academic rheumatology center (Brigham and Women’s Hospital, Boston, Massachusetts) from 2013–2016. Patients with RA received study information and we asked them to reach out to their relatives to identify potential subjects (21). We studied unaffected FDRs since they are both familiar with RA and at increased risk for disease development. We excluded FDRs who were >70 years of age, had symptoms or a diagnosis of RA or another systemic rheumatic disease, and were non-English speakers since the interventions were not developed in other languages. The Partners HealthCare Institutional Review Board approved the study. The study was registered on ClinicalTrials.gov (Identifier: NCT02046005).
Screening
Potential participants were screened to verify that the affected relative was a parent, sibling, or offspring diagnosed with RA on medical record review according to accepted classification criteria (22). Questionnaires screened for RA symptoms and systemic rheumatic disease (23). A positive screen prompted evaluation by a study rheumatologist (JAS) who obtained history and performed musculoskeletal physical examination. Those with evidence of past/current inflammatory arthritis were ineligible. All subjects agreed to participate in the study after written informed consent.
PRE-RA Web-Based Educational Intervention
We developed the PRE-RA tool as a web-based educational intervention, adapted from YourDiseaseRisk (http://www.yourdiseaserisk.wustl.edu/), previously described in detail (21). The PRE-RA tool collected data on age, sex, family history, and behavioral risk factors. It also disclosed genetic (HLA-DRB1) and autoantibody (RF/CCP) results. Furthermore, it combined risk factors and disclosed personalized risk displayed as both relative risk and absolute lifetime RA risk estimates to provide several formats for displaying numeric results (24). The methods and primary literature for relative risks and population prevalence of each RA risk factor that were components of the PRE-RA tool were reported in detail in a previous publication (21). Finally, the PRE-RA tool provided personalized education about RA including visual presentation of personal risk factors with tailored tips on how to modify personal behavioral factors, and how to recognize early RA symptoms.
Study Design
We conducted a randomized controlled trial to test the effect of disclosing risk factors for RA, personalized with behavioral factors, HLA-DRB1 genotype, and autoantibody status, on motivation to change RA behavioral risk factors among FDRs. At baseline, surveys were administered and blood samples were obtained. RF and CCP were performed using clinical assays (RF by nephelometry; CCP by second generation enzyme-linked immunosorbent assay). HLA-DRB1 genotyping was performed using sequenced-based typing and sequence-specific oligonucleotide probe hybridization (positive: presence of at least one classical RA shared epitope alleles) (5).
Subjects were randomized to one of three study arms in equal ratios (Figure 1) using permuted block randomization from a random number generator using statistical software. The comparison arm received standard education about RA epidemiology, symptoms, and diagnosis a one-on-one verbal presentation and handouts. The PRE-RA arm received the web-based PRE-RA risk disclosure and education tool alone. The PRE-RA Plus arm received the PRE-RA tool as well as a one-on-one session with a health educator lasting 45 minutes to facilitate interpretation and provide personalized education about potential RA risk-related behavioral changes using motivational interviewing techniques. Our primary hypothesis evaluated the group of subjects receiving personalized RA risk disclosure by PRE-RA (PRE-RA and PRE-RA Plus arms) compared to those not receiving personalized RA risk disclosure in the comparison arm.
Figure 1.
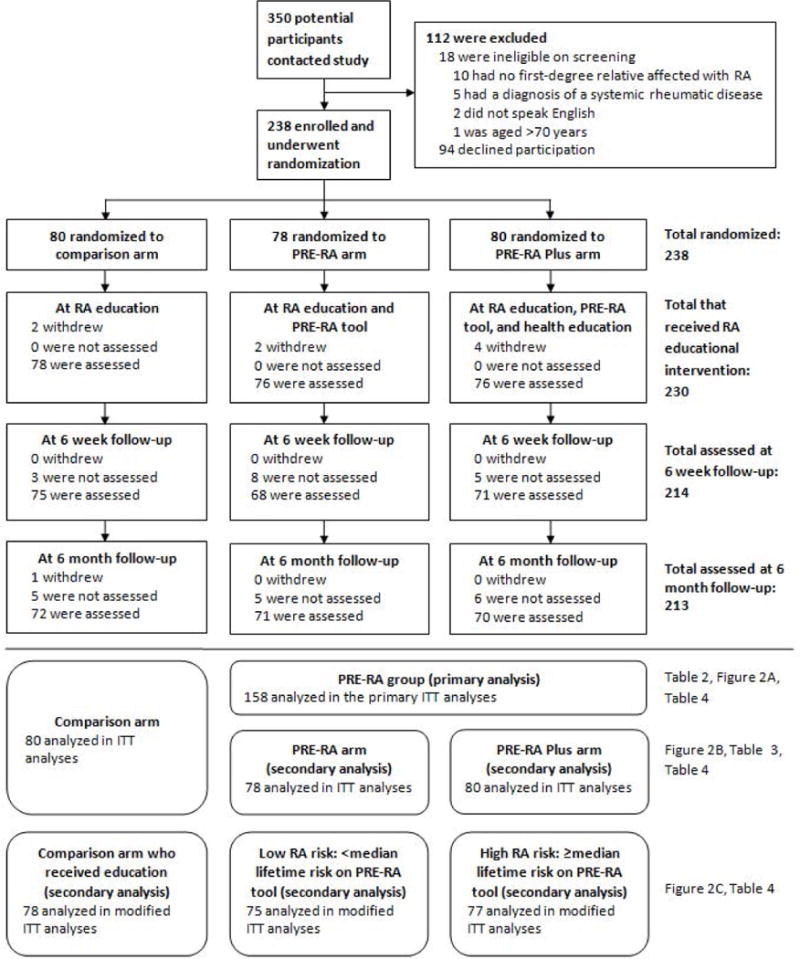
Subject flow diagram in a randomized controlled trial of personalized vs. non-personalized rheumatoid arthritis educational interventions. ITT, intention-to-treat; RA, rheumatoid arthritis
Subjects completed questionnaires on sociodemographics, risk behavior, and healthcare utilization at baseline and immediately, 6 weeks, 6 months, and 12 months after the RA educational intervention. All subjects received a booster education session identical to the intervention at baseline after the completion of the 6-month follow-up visit. Subjects randomized to the comparison arm could receive their personalized RA risk results by the PRE-RA tool after the conclusion of their participation.
Outcome Measures
We measured motivation to improve behaviors based on Prochaska’s stages of readiness for change using validated contemplation ladder scales (range 0–10, higher score indicating more motivation to change) at the following time points: baseline and immediately, 6 weeks, 6 months, and 12 months post-intervention (25, 26). Rungs on the ladder correspond to stages of motivation to change behavior according to the trans-theoretical model as a progression through pre-contemplation, contemplation, preparation, action, and maintenance (27). The contemplation ladder outcome was originally validated in studies investigating behavior change in smokers and has been commonly used as an outcome in clinical trials measuring motivation to change many health behaviors (25, 26, 28–30).
We measured the four RA-related behaviors using contemplation ladders for each behavior. Only current smokers answered the smoking ladder. Our pre-specified primary composite outcome was defined as an increase in any of these four ladders by at least one point at the immediate, 6-week, and 6-month post-intervention time points compared to baseline. In secondary analyses, we analyzed the outcome for each individual contemplation ladder and included the 12-month post-intervention time point to evaluate the long-term effects of the intervention.
At each post-intervention visit, subjects reported changes in food intake, physical activity, tooth brushing, tooth flossing, and smoking compared to before the educational intervention. We secondary analyses, we analyzed these self-reported behavior changes.
Sample Size Calculation and Power
A previous trial evaluated motivation to improve passive smoking behaviors among pregnant women and those with young children and found that 25.4% improved their stages of motivation to change behavior according to the trans-theoretical model after intensive education, compared to 12.8% of the comparison group that received standard education (difference of 12.6%) (31). Therefore, a sample size of 148 in the PRE-RA group and 74 in the comparison arm provided >80% power to detect a difference ranging from 8–14% depending on the proportion of the comparison arm that increased motivation to improve behaviors (21).
Statistical Analysis
We used t-tests, chi-square, or Fisher’s exact tests to compare baseline variables between the two groups compared in the primary analysis (PRE-RA group and comparison arm). Our pre-specified primary analysis was to compare relative risk for the primary composite outcome between the two groups at the 3 primary post-intervention time points (immediate, 6 weeks, and 6 months) in intention-to-treat analyses using generalized estimating equations (GEE) for the binary outcome. For those with missing data, we carried forward the last observation to preserve randomization. For example, a randomized subject that withdrew before receiving the intervention was assigned baseline ladder scores at all time points, and would be analyzed as having no increased motivation to improve behaviors. Since age was unbalanced between the randomization groups and associated with the primary composite outcome, the final multivariable model adjusted for continuous years of age. Other baseline characteristics were balanced across randomization groups. There was no interaction between time after intervention and randomization group for the primary composite outcome so this was not included in the final model. We performed sensitivity analyses using generalized linear mixed models that assume missing data are missing at random, instead of GEE, that assume missing data are missing completely at random. We additionally used the raw data by weighted GEE without carrying forward observations to evaluate whether the pattern of missing data affected our results.
We compared the difference in proportions of the outcome between the PRE-RA group and comparison arm at each post-intervention time point. We compared increases in the four individual contemplation ladders for each behavior by groups at each of the 3 primary post-intervention time points. In secondary analyses evaluating the long-term effect of the intervention, we additionally included the 12-month time-point and analyzed these 4 post-intervention time points identically as already described.
In secondary analyses, we compared the PRE-RA Plus arm to the PRE-RA arm to evaluate the effect of the health educator on motivation to improve behaviors. We investigated the composite outcome as an increase in at least one ladder scale compared to baseline at each post-intervention time point. We further stratified the PRE-RA group into those who received high vs. low lifetime RA risk results, defined as those who had scores greater than or less than the median [5%] lifetime risk on the PRE-RA tool. For this secondary analysis, we performed a modified intention-to-treat analysis since subjects were required to receive the intervention to be categorized as high or low lifetime RA risk. For missing data in these analyses, we carried the last observation forward as in our primary analysis. We compared self-reported behavior changes at post-intervention time points by the groups using chi-square tests. Two-sided p<0.05 was considered statistically significant in all analyses.
RESULTS
Subjects
Of the 350 potential participants that contacted study staff, 238 FDRs met the inclusion criteria, agreed to participate, and were randomized (Figure 1). Eighty subjects were randomized to the comparison arm, 78 to the PRE-RA arm, and 80 to the PRE-RA Plus arm. For the primary analysis, we combined the two PRE-RA arms into a single group (n=158). Eight subjects were randomized but withdrew prior to receiving an RA educational intervention but were included in intention-to-treat analyses. Withdrawal and loss to follow-up rates were similarly low in all study arms, ranging from 8–12% at last follow-up.
Table 1 shows baseline characteristics of subjects according to randomized groups. Most subjects were female (76.5%), white (87.0%), and had greater than high school education (87.8%). Mean age was lower in the comparison arm (43.4 years) than the PRE-RA group (46.7 years) but other factors were balanced across randomization groups. At baseline, most subjects had Ladder scores >5 indicating that many were in the preparation stage or beyond for behavior change prior to intervention. Few subjects were in the pre-contemplative stage (rungs 0 or 1 on ladders) at baseline (0% for smoking, 2.9% for dental care, 9.7% for diet, and 0.8% for exercise).
Table 1.
Baseline characteristics of the 238 randomized unaffected first-degree relatives in the PRE-RA Family Study.
| Primary analysis | Secondary analyses | |||
|---|---|---|---|---|
|
| ||||
| Comparison arm n=80 |
PRE-RA group n=158 |
PRE-RA arm (n=78) |
PRE-RA Plus arm (n=80) |
|
| Mean age, years (SD) | 43.4 (14.7) | 46.7 (14.4) | 45.0 (14.9) | 48.3 (13.7) |
| Female, n (%) | 63 (78.8) | 119 (75.3) | 62 (79.5) | 57 (71.3) |
| White, n (%) | 69 (86.3) | 138 (87.3) | 65 (83.3) | 73 (91.3) |
| >High school education, n (%) | 72 (90.0) | 137 (86.7) | 68 (87.2) | 69 (86.3) |
| Current smoker, n (%) | 4 (5.0) | 11 (7.0) | 6 (7.7) | 5 (6.3) |
| Mean body mass index, kg/m2 (SD)* | 27.2 (6.2) | 27.4 (6.0) | 26.9 (5.8) | 27.9 (6.1) |
| Body mass index categories, n (%)* | ||||
| Underweight (<18.5 kg/m2) | 0 (0.0) | 2 (1.3) | 0 (0.0) | 2 (2.6) |
| Normal (≥18.5 and <25.0 kg/m2) | 28 (45.9) | 62 (40.8) | 37 (48.7) | 25 (32.9) |
| Overweight (≥25.0 and <30.0 kg/m2) | 16 (26.2) | 42 (27.6) | 17 (22.4) | 25 (32.9) |
| Obese (≥30.0 kg/m2) | 17 (27.9) | 46 (30.3) | 22 (29.0) | 24 (31.6) |
| Fish consumption less than once per week** | N/A | 38 (25.0) | 19 (25.0) | 19 (25.0) |
| Tooth flossing less than once per day** | N/A | 92 (60.5) | 44 (57.9) | 48 (63.2) |
| Dental check-up less than once every 6 months** | N/A | 32 (21.1) | 22 (29.0) | 10 (13.2) |
| Perceived RA severity of relative with RA, n (%) | ||||
| Mild | 11 (13.8) | 16 (10.1) | 9 (12.3) | 7 (9.0) |
| Moderate | 44 (55.0) | 93 (58.9) | 50 (68.5) | 43 (55.1) |
| Severe | 21 (26.3) | 38 (24.1) | 12 (16.4) | 26 (33.3) |
| Unsure | 4 (5.0) | 11 (7.0) | 7 (9.0) | 4 (5.0) |
| Type of relative with RA, n (%) | ||||
| Parent only | 55 (68.8) | 100 (63.2) | 53 (67.9) | 47 (58.8) |
| Sibling only | 9 (11.2) | 29 (18.4) | 13 (16.7) | 16 (20.0) |
| Offspring only | 7 (8.8) | 17 (10.8) | 9 (11.5) | 8 (10.0) |
| More than one type of relative with RA | 9 (11.3) | 12 (7.6) | 3 (3.8) | 9 (11.3) |
| HLA-DRB1 shared epitope alleles present | ||||
| None | 40 (50.0) | 84 (53.3) | 39 (50.0) | 45 (56.3) |
| 1 | 35 (43.8) | 58 (36.7) | 34 (43.6) | 24 (30.0) |
| 2 | 5 (6.3) | 16 (10.1) | 5 (6.4) | 11 (13.8) |
| Positive CCP2 | 0 (0.0) | 2 (1.3) | 2 (2.6) | 0 (0.0) |
| Positive RF | 4 (5.0) | 7 (4.4) | 4 (5.1) | 3 (3.8) |
| Positive CCP2 or RF | 4 (5.0) | 7 (4.4) | 4 (5.1) | 3 (3.8) |
| Mean ladder score (SD) | ||||
| Dental | 9.0 (1.7) | 8.5 (2.4) | 8.6 (2.2) | 8.4 (2.7) |
| Exercise | 8.4 (2.0) | 8.3 (2.2) | 8.4 (2.2) | 8.2 (2.3) |
| Diet | 7.1 (2.9) | 7.0 (3.1) | 7.3 (2.9) | 6.7 (3.2) |
| Smoking*** | 6.3 (1.9) | 5.3 (1.9) | 6.0 (1.7) | 4.8 (2.1) |
| Mean of dental, exercise, and diet ladders (SD) | 8.2 (1.4) | 8.0 (1.6) | 8.1 (1.5) | 7.8 (1.7) |
Data on body mass index was obtained on 61 subjects in the comparison arm, 76 in the PRE-RA arm, and 76 in the PRE-RA Plus arm.
Data on dietary intake and dental health behaviors were only obtained in the PRE-RA arm and PRE-RA Plus arms as part of the PRE-RA tool.
Only current smokers were assessed by the smoking ladder (n=15). Ladder scores ranged from 0–10, with higher score indicating increased motivation to improve that behavior.
CCP2, cyclic citrullinated peptide antibody (2nd generation); RA, rheumatoid arthritis; RF, rheumatoid factor; SD, standard deviation.
PRE-RA (Personalized Risk Estimator for Rheumatoid Arthritis) is a web-based risk assessment tool that uses an individual’s genetics (HLA-DRB1), autoantibodies (cyclic citrullinated peptide and rheumatoid factor), age, sex, family history, and rheumatoid arthritis risk-related behaviors to provide personalized education on their rheumatoid arthritis risk.
The primary analysis compared the PRE-RA group to the comparison arm. Secondary analyses compared all three study arms.
Motivation to Improve RA Risk-Related Behaviors
Figure 2A shows the proportion of subjects in each randomization group who met the primary composite outcome of increased motivation to improve RA risk-related behaviors (≥1 point increase in any ladder score) at each post-intervention time point compared to baseline. In the primary analysis using GEE, those who received personalized RA risk disclosure with the PRE-RA tool were more likely to increase motivation to improve behaviors than those in the comparison arm over the three post-intervention time points (age-adjusted relative risk [RR] 1.23, 95%CI 1.01–1.51, p=0.043). Results were similar in sensitivity analyses using alternative methods for missing data (p=0.048 for the generalized linear mixed model and p=0.030 for weighted GEE not carrying forward missing data, both comparing the PRE-group to the reference of the comparison arm).
Figure 2.
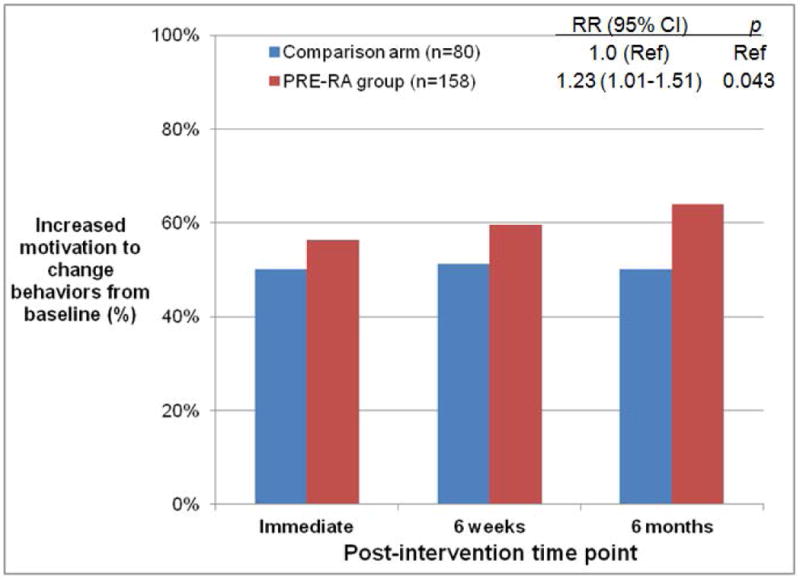
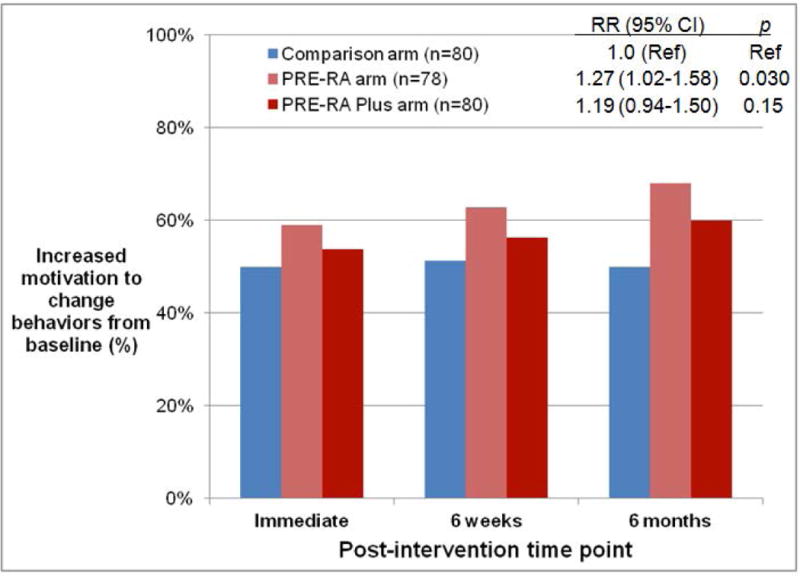
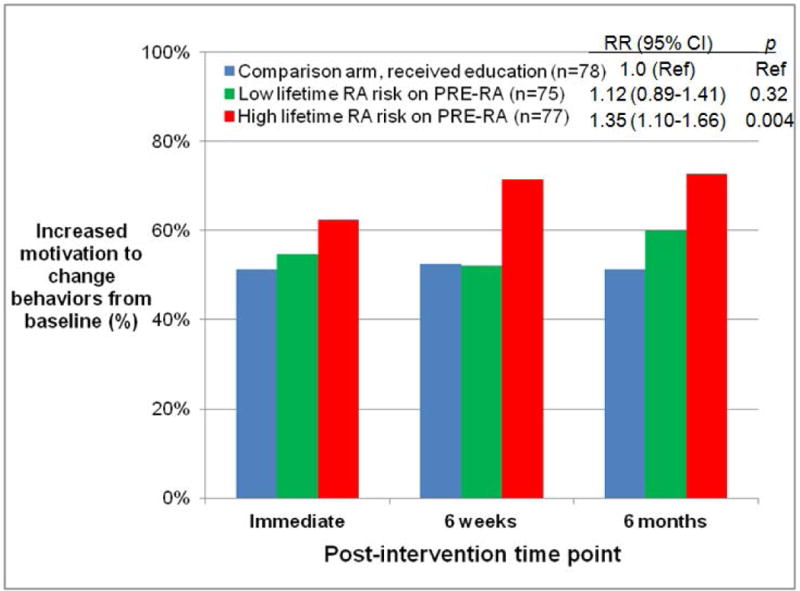
Proportion of subjects with increased motivation to improve rheumatoid arthritis risk-related behaviors from baseline to post-intervention time points. A) PRE-RA group and comparison arm in intention-to-treat (ITT) analysis, B) PRE-RA arm, PRE-RA Plus arm, and comparison arm in ITT analysis, and C) Subjects disclosed to have high (≥5%) lifetime risk of RA on the PRE-RA tool, those disclosed to have low (<5%) lifetime risk of RA on the PRE-RA tool, and subjects in the comparison arm who received education in modified ITT analysis performed among those who received an RA educational intervention.
PRE-RA (Personalized Risk Estimator for Rheumatoid Arthritis) is a web-based risk assessment tool that uses an individual’s genetics (HLA-DRB1), autoantibodies (cyclic citrullinated peptide and rheumatoid factor), age, sex, family history, and rheumatoid arthritis risk-related behaviors to provide personalized education on rheumatoid arthritis risk.
Relative risks (RR) for increased willingness to improve behaviors from baseline, 95% confidence intervals (CI), and p values were all age-adjusted and attained using generalized estimating equations for repeated measures over time.
At 6 months post-intervention, 63.9% of subjects that received PRE-RA disclosure increased motivation to improve RA risk-related behaviors compared to 50.0% in the comparison arm (age-adjusted difference of 15.8%, 95%CI 2.8–28.8, p=0.017). When examining individual components of the composite outcome, subjects in the PRE-RA group were more likely to have ≥1 point increase in the dental hygiene ladder than those in the comparison group (26.3% vs. 14.1%; age-adjusted difference of 12.6% [95%CI 2.6–22.5%], p=0.014, Table 2). The proportion of subjects who had an increase in diet and exercise ladders was similar between the PRE-RA group and comparison arm, although the diet ladder improvement approached statistical significance favoring the PRE-RA group (p=0.069). There was no difference in motivation to quit smoking between the PRE-RA group and comparison arm among the 15 subjects that were current smokers at baseline.
Table 2.
Proportion of subjects who had increased motivation to improve rheumatoid arthritis-related behaviors at baseline and 6 months after rheumatoid arthritis educational intervention (n=238).
| Measure | Comparison arm (n=80) |
PRE-RA group (n=158) |
Unadjusted difference (95% CI) | Unadjusted p value | Age-adjusted difference (95% CI) | Age-adjusted p value |
|---|---|---|---|---|---|---|
|
Composite Outcome
| ||||||
| % with ≥1 point increase in any ladder score | 50.0% | 63.9% | 13.9% (0.7%, 27.2%) | 0.039 | 15.8% (2.8%, 28.8%) | 0.017 |
|
Individual Components of Composite Outcome | ||||||
| Dental ladder | ||||||
| Mean at baseline (SD) | 9.0 (1.7) | 8.5 (2.4) | ||||
| Mean at 6 months after intervention (SD) | 8.1 (2.7) | 8.8 (2.1) | ||||
| % with ≥1 point increase | 14.1% | 26.3% | 12.2% (1.8%, 22.5%) | 0.035 | 12.6% (2.6%, 22.5%) | 0.014 |
|
| ||||||
| Diet ladder | ||||||
| Mean at baseline (SD) | 7.1 (2.9) | 7.0 (3.1) | ||||
| Mean at 6 months after intervention (SD) | 6.4 (3.5) | 7.5 (2.9) | ||||
| % with ≥1 point increase | 31.3% | 42.7% | 11.4% (−1.3%, 24.2%) | 0.088 | 11.7% (−0.9%, 24.2%) | 0.069 |
|
| ||||||
| Exercise ladder | ||||||
| Mean at baseline (SD) | 8.4 (2.0) | 8.3 (2.2) | ||||
| Mean at 6 months after intervention (SD) | 8.7 (1.8) | 8.8 (1.6) | ||||
| % with ≥1 point increase | 27.5% | 33.5% | 6.0% (−6.2%, 18.3%) | 0.34 | 6.1% (−6.1%, 18.3%) | 0.33 |
|
| ||||||
| Smoking ladder* | ||||||
| Mean at baseline (SD) | 6.3 (1.9) | 6.2 (2.4) | ||||
| Mean at 6 months after intervention (SD) | 7.0 (1.83) | 7.4 (2.9) | ||||
| % with ≥1 point increase | 50.0% | 54.6% | 4.6% (−52.6%, 61.7%) | 0.88 | 13.0% (−45.5%, 71.5%) | 0.66 |
Only current smokers at baseline were assessed by the smoking ladder (n=15).
CI, confidence interval; PRE-RA, Personalized Risk Estimator for Rheumatoid Arthritis
Secondary Analyses
Figure 2B shows the proportion of subjects at each post-intervention time point that achieved the primary composite outcome according to the three study arms. Those who received the PRE-RA tool alone were more likely than those in the comparison arm to achieve the primary outcome at 6 months after the intervention (p=0.022). There was no significant difference between those who received the PRE-RA tool alone compared to those who received the PRE-RA Plus health education, although the proportion who achieved the primary composite outcome tended to be higher for subjects that received PRE-RA alone (Table 3).
Table 3.
Proportion of subjects among the PRE-RA group who had increased motivation to improve rheumatoid arthritis-related behaviors at baseline and 6 months after rheumatoid arthritis educational intervention (n=158).
| Measure | PRE-RA arm (n=78) |
PRE-RA Plus arm (n=80) |
Unadjusted difference (95% CI) | Unadjusted p value | Age-adjusted difference (95% CI) | Age-adjusted p value |
|---|---|---|---|---|---|---|
|
Composite Outcome
| ||||||
| % with ≥1 point increase in any ladder score | 68.0% | 60.0% | −8.0% (−22.9%, 7.0%) | 0.30 | −4.8% (−19.8%, 10.3%) | 0.54 |
|
Individual Components of Composite Outcome | ||||||
| Dental ladder | ||||||
| Mean at baseline (SD) | 8.6 (2.2) | 8.4 (2.7) | ||||
| Mean at 6 months after intervention (SD) | 8.8 (2.1) | 8.8 (2.1) | ||||
| % with ≥1 point increase | 25.6% | 26.9% | 1.3% (−12.5%, 15.1%) | 0.86 | 0.8% (−12.9%, 14.5%) | 0.91 |
|
| ||||||
| Diet ladder | ||||||
| Mean at baseline (SD) | 7.4 (2.9) | 6.7 (3.2) | ||||
| Mean at 6 months after intervention (SD) | 8.1 (2.4) | 6.9 (3.3) | ||||
| % with ≥1 point increase | 43.6% | 41.8% | −1.8% (−17.3%, 13.7%) | 0.82 | 0.6% (−14.6%, 15.9%) | 0.94 |
|
| ||||||
| Exercise ladder | ||||||
| Mean at baseline (SD) | 8.4 (2.2) | 8.2 (2.3) | ||||
| Mean at 6 months after intervention (SD) | 8.9 (1.5) | 8.7 (1.7) | ||||
| % with ≥1 point increase | 35.9% | 31.3% | −4.6% (−19.4%, 10.1%) | 0.54 | −3.3% (−18.2%, 11.7%) | 0.67 |
|
| ||||||
| Smoking ladder* | ||||||
| Mean at baseline (SD) | 6.5 (2.1) | 5.8 (3.0) | ||||
| Mean at 6 months after intervention (SD) | 8.0 (2.8) | 6.6 (3.1) | ||||
| % with ≥1 point increase | 66.7% | 40.0% | −26.7% (−83.8%, 30.5%) | 0.57 | −29.3% (−102.8%, 44.2%) | 0.44 |
Only current smokers at baseline were assessed by the smoking ladder (n=11 among those who were randomized to receive PRE-RA).
CI, confidence interval; PRE-RA, Personalized Risk Estimator for Rheumatoid Arthritis
We further stratified the PRE-RA group into those who received high vs. low lifetime RA risk results, defined as those who had scores greater than or less than the median [5%] lifetime risk on the PRE-RA tool. Those with high lifetime RA risk were more likely to reach the primary composite outcome than the comparison arm (RR 1.35, 95%CI 1.10–1.66; p=0.004, Figure 2C) while those with low lifetime RA risk had no difference compared to the comparison arm (RR 1.12, 95%CI 0.89–1.41; p=0.32).
As a secondary analysis, we assessed the long-term effect of the intervention by including the 12-month post-intervention time point and found similar effects as the primary analysis (RR 1.21, 95%CI 1.00–1.47, p=0.05) for the primary composite outcome.
Self-Reported Behavior Changes
At 6 months post-intervention, 40.7% of the PRE-RA group reported brushing teeth more frequently, compared to 22.9% of the comparison arm (p=0.010, Table 4). Similarly, more subjects in the PRE-RA group reported flossing teeth more frequently (p=0.004) and increasing fish intake (p=0.005) than in the comparison arm. Although both the PRE-RA group (50.4%) and comparison arm (46.5%) reported high rates of increasing physical activity at 6 months post-intervention, these proportions were not significantly different (p=0.59).
Table 4.
Self-reported behavior improvements at 6 months after rheumatoid arthritis educational intervention.
| Behavior | Action | Comparison arm, % | PRE-RA group, % | PRE-RA arm, % | PRE-RA Plus arm, % | Low lifetime RA risk on PRE-RA, % | High lifetime RA risk on PRE-RA, % | ||||
|---|---|---|---|---|---|---|---|---|---|---|---|
|
Behaviors with directed health education in the PRE-RA arm and PRE-RA Plus arm
| |||||||||||
| Brushing teeth | More frequent | 22.9 | 40.7†† | 37.1 | 44.3†† | 38.9† | 42.7†† | ||||
| Flossing teeth | More frequent | 34.8 | 55.7†† | 51.4† | 60.0†† | 48.6 | 63.2†† | ||||
| Fish | More consumption | 22.1 | 45.0†† | 42.0† | 47.9†† | 42.3† | 47.8†† | ||||
| Physical activity | Increased | 46.5 | 50.4 | 47.9 | 52.9 | 47.2 | 53.6 | ||||
| Smoking1 | Quit | 0.0 | 62.5 | 60.0 | 66.7 | 75.0 | 50.0 | ||||
|
Behaviors without directed health education | |||||||||||
| Fruit | More consumption | 26.8 | 40.9† | 36.6 | 45.1† | 37.5 | 44.3†† | ||||
| Vegetables | More consumption | 33.8 | 39.7 | 41.3 | 38.0 | 30.6 | 49.3‡ | ||||
| Beans, nuts | More consumption | 18.6 | 22.7 | 23.9 | 21.4 | 19.4 | 26.1 | ||||
| Fats, oils | Less consumption | 22.9 | 21.6 | 25.7 | 17.4 | 18.6 | 24.6 | ||||
| Meat, poultry | Less consumption | 7.3 | 17.0 | 15.7 | 18.3 | 19.7† | 14.3 | ||||
| Sugar | Less consumption | 37.7 | 42.6 | 49.3 | 35.7 | 40.3 | 44.9 | ||||
Smoking behavior change was analyzed among 11 current smokers at baseline who had follow-up data 6 months after educational intervention. Five out of eight smokers in the PRE-RA group reported quitting smoking at 6 months after educational intervention compared to none out of three smokers in the comparison arm (p=0.18).
p<0.05 compared to comparison arm
p<0.01 compared to comparison arm
p<0.05 for high (≥5%) lifetime RA risk compared to low (<5%) lifetime RA risk on the PRE-RA tool
There were no statistical differences in self-reported behavior improvements between the PRE-RA arm and PRE-RA Plus arm.
PRE-RA, Personalized Risk Estimator for Rheumatoid Arthritis; RA, rheumatoid arthritis.
Subjects randomized to the PRE-RA Plus arm were more likely to report increased tooth brushing (p=0.025), flossing (p=0.010), and fish consumption (p=0.009) 6 months post-intervention than subjects randomized to the comparison arm. For food items without directed education in the PRE-RA group, there were few differences between the PRE-RA group and comparison arm. There were no statistically significant differences in behavior changes between the PRE-RA Plus and PRE-RA arms.
Among current smokers at baseline who had follow-up data at 6 months post-intervention, 63% (5/8) of those in the PRE-RA group reported quitting smoking compared to 0% (0/3) in the comparison arm (p=0.18). One subject in the PRE-RA arm who had both RF and CCP tests positive at high titers reported developing RA about one year after randomization.
DISCUSSION
In this proof-of-concept trial, subjects who were randomly assigned to receive personalized RA risk disclosure and education using an online tool personalized with genetics, biomarkers, demographics, and behavioral factors were 23% more likely to increase motivation to improve behaviors related to RA risk compared to those randomized to receive standard, non-personalized RA education. Beyond motivation to improve behaviors, subjects who received personalized RA risk disclosure were also more likely to report health behavior improvements than those that not receiving personalized risk disclosure. These findings demonstrate that a personalized medicine approach can motivate those at increased chronic disease risk to make health behavior improvements. We further evaluated the effect of incorporating a health educator and found that the web-based PRE-RA tool performed similarly with and without a health educator at all post-intervention time points. Therefore, web-based personalized medicine approaches may be useful to motivate health behavior improvements to potentially lower RA or other chronic disease risk (3, 32).
Those at increased genetic risk for a chronic disease may be more likely to undergo screening for that condition (33, 34). However, genetic risk disclosure alone has had limited impact on other health behavior changes (3, 35). Our study is one of the few to evaluate the effect of factors beyond genetics by including the impact of biomarkers, demographics, and behavioral risk factors to motivate positive health behaviors changes. While the entire group randomized to receive personalized risk disclosure and education was more likely to increase motivation than the comparison arm, we found that those who were at the highest lifetime RA risk had the most marked increase in motivation to change behaviors. Those at highest RA risk were motivated to improve behaviors despite receiving information on non-modifiable factors such as age, sex, genetics, and autoantibodies that also contributed to their personalized RA risk estimates. In a similar investigation, the REVEAL Study used genetic risk disclosure alone for Alzheimer’s disease (AD); those with high-risk alleles for AD and with high lifetime AD risk were significantly more likely to report AD-specific health behavior changes than those without risk alleles (36–38). In contrast, a recent meta-analysis concluded that disclosure of genetic factors for chronic diseases alone did not significantly motivate health behavior improvements (3). Our findings suggest that disclosing multiple personalized factors for disease risk may have a greater impact on motivating behavior improvements to those at high risk than genetic risk disclosure alone.
We evaluated self-reported changes of four RA risk-related behaviors as secondary outcomes. We found that dietary and dental hygiene changes were more likely to be reported in the PRE-RA group than the comparison arm, whereas changes in exercise were similar. There was a high rate of smoking cessation in the PRE-RA group, but we were unable to detect a statistical difference in cessation rates likely due to a low number of current smokers. Behaviors such as increasing physical activity and smoking cessation are commonly recommended as healthy in many contexts, so specific interventions for a chronic disease such as RA may not offer additional motivation (39). We found that education about less recognized RA risk factors of fish intake and dental health resulted in greater motivation to improve behaviors as well as self-reported behavior improvements. Personalized approaches for chronic disease risk reduction may therefore offer the most benefit for behaviors that are less familiar to the population at risk and more amenable to behavioral interventions. We were unable to measure behavior changes and had to rely on self-report. It is therefore possible that the differential education in each arm could explain differences in self-reported behaviors. Due to the nature of the interventions, we were unable to blind subjects to assignment of study intervention.
While the health behaviors we chose to include in our primary composite outcome are related to RA risk, it is unclear that improving many of these behaviors, other than smoking, reduces RA risk. While smoking cessation has been shown to decrease RA risk, it may take up to 20 years after sustained cessation until the risk of former smokers approaches that of never smokers (10, 11). While obesity is associated with increased RA risk, studies have not investigated whether weight loss decreases RA risk or weight gain increases RA risk (7, 14). There is currently no evidence that increasing physical activity, improving dental hygiene, or increasing fish intake reduces RA risk, despite other known health benefits of these behaviors. Education about other dietary behaviors that may be related to RA risk (such as alcohol, vitamin D, and sugar-sweetened soda intake) were not included in the PRE-RA tool and may have motivated behavior changes differently (40–42). Other RA risk-related biomarkers (such as other genetic factors, novel autoantibodies, and serum inflammatory markers) were not included in RA risk estimates of the PRE-RA tool, but could be incorporated in future versions (4, 43–48). We included factors in the PRE-RA tool with the strongest evidence for validity and were limited in the number of serologic factors we could measure prior to disclosing RA risk (21).
Our findings may only be applicable to unaffected FDRs of patients with RA but not to other chronic rheumatic diseases. However, we adapted the PRE-RA tool from a website developed to calculate personalized risk for many common chronic diseases, used accepted methods to display relative and absolute risks, and provided education about common behavioral risk factors, so a similar framework is likely to be relevant to other chronic diseases (49). We recruited at a single site and subjects were well-educated and mostly women so our findings may not be generalizable to other populations. Since lower socioeconomic status is associated with increased prevalence of high-risk health behaviors such as smoking, implementing the PRE-RA tool in a different population might yield more pronounced effects on motivation to change health behaviors. While we performed a randomized controlled trial, we were unable to blind subjects to the educational interventions they received. It is possible that lack of blinding might have biased the study since subjects knew which RA educational intervention they received. However, rates of loss to follow-up were similarly low in all three study arms. We analyzed our primary outcome using multiple strategies for missing data in follow-up and found that our results were similar regardless of the method for handling missing data. Due to sample size limitations, we used a composite measure of motivation to change any of four behaviors as our primary outcome. However, our findings of improvements in diet and dental hygiene ladder scores and self-reported behaviors were consistent in secondary analyses so these subjects likely were more motivated to change these behaviors. While we found a statistical difference between randomization groups, a high proportion of subjects in the comparison arm achieved the primary outcome perhaps due to the study sample being primed to increase motivation by participation and the meaningful change in the composite outcome of increasing motivation of any health behavior is unclear. However, over 60% of smokers in the PRE-RA group had quit smoking 6 months after the intervention compared to none in the comparison arm, so it is possible that our intervention might have marked effects on behavior changes that may affect RA risk. In secondary analyses with extension to 12 months of follow-up, we found similar increased motivation to improve behaviors arguing that our intervention may have relatively long lasting effects. Lastly, the outcomes in our study were self-reported so subjects may not have actually improved behaviors. In this proof-of-concept trial, we showed that personalized RA risk disclosure motivated health behavior improvements for lifestyle factors important in the development of RA, particularly dental hygiene and fish intake. Since behaviors may be the only potentially modifiable risk factors for RA, encouraging behavior change is the first step towards establishing rationale for larger behavior intervention trials powered to investigate the effect of behavior change on RA risk or surrogate biologic markers, such as RA-related autoantibody development (50).
In conclusion, we demonstrated a personalized medicine approach that translated epidemiologic findings for genetics, biomarkers, and health behaviors into a personalized web-based intervention for those at elevated RA risk and may improve health behaviors related to RA development.
SIGNIFICANCE & INNOVATIONS.
We previously developed a web-based personalized rheumatoid arthritis (RA) risk education tool to disclose RA risk personalized to genetics, biomarkers, demographics, and RA risk-related behaviors.
We performed a randomized controlled trial among 238 first-degree relatives without RA as a proof-of-concept study to evaluate whether personalized RA risk disclosure motivated health behavior improvements compared to standard, non-personalized RA education.
Relatives assigned to receive personalized RA risk through the web-based tool were 23% more likely to increase motivation to improve RA risk-related behaviors over 6 months compared to those assigned to receive standard, non-personalized education about RA.
These results suggest that personalized medicine approaches may motivate health behavior improvements in those at risk for RA and provide rationale for larger studies evaluating the effect of health behavior changes on clinical outcomes such as RA risk or autoantibody production.
Acknowledgments
We thank Graham Colditz, MD, DrPH and Hank Dart, MSc for their assistance in creating the web-based PRE-RA tool, based on Your Disease Risk (http://www.yourdiseaserisk.wustl.edu/).
The authors thank Michelle L. Frits, BA, Christine K. Iannaccone, MPH, Taysir G. Mahmoud, BA, J. Adebukola Awosogba, MA, Jessica Brandano, BA, Jonathan C. Karlson, David J. Kreps, MS, and the Massachusetts chapter of the Arthritis Foundation for assistance in recruitment and data collection. Finally, we thank the patients, families, staff, and physicians at the Brigham Orthopaedic and Arthritis Center at Brigham and Women’s Hospital, the Arthritis and Orthopedic Center at Brigham and Women’s Faulkner Hospital, the 850 Boylston Arthritis Center, the Fish Center at 850 Boylston, and the BWH Arthritis Center at Braintree.
Funding/Support: This work was supported by the National Institute of Arthritis and Musculoskeletal and Skin Diseases (NIAMS) under award number P60 AR047782. Dr. Sparks is supported by NIAMS under award numbers K23 AR069688 and L30 AR066953 as well as the Rheumatology Research Foundation Scientist Development Award. Dr. Karlson is supported by NIAMS under award numbers K24 AR052403, R01 AR049880, P30 AR070253, and P30 AR069625. Dr. Green is supported by U01 HG006500, U19 HD077671, R01 HG005092, U01 HG008685, and U41 HG006834. Dr. Deane is supported by UM1 AI110503. Dr. Costenbader is supported by R01 AR049880 and K24 AR066109. Dr. Costenbader and Dr. Iversen are supported by R01 AR059086. The funders had no role in study design, data collection, analysis, decision to publish, or preparation of the manuscript. The content is solely the responsibility of the authors and does not necessarily represent the official views of the National Institutes of Health.
Footnotes
AUTHOR CONTRIBUTIONS
All authors were involved in drafting the article or revising it critically for important intellectual contact, and all authors approved the final version to be published. Dr. Sparks had full access to all of the data in the study and takes responsibility for the integrity of the data and the accuracy of the data analysis.
Study conception and design. Sparks, Iversen, Miller Kroouze, Kalia, Atkinson, Deane, Green, Karlson
Acquisition of data. Sparks, Iversen, Triedman, Prado, Miller Kroouze, Kalia, Mody, Helfgott, Todd, Dellaripa, Bermas, Green, Karlson
Analysis and interpretation of data. Sparks, Iversen, Yu, Triedman, Prado, Miller Kroouze, Kalia, Atkinson, Mody, Helfgott, Todd, Dellaripa, Bermas, Costenbader, Deane, Lu, Green, Karlson
References
- 1.Collins FS, Varmus H. A new initiative on precision medicine. N Engl J Med. 2015;372(9):793–5. doi: 10.1056/NEJMp1500523. [DOI] [PMC free article] [PubMed] [Google Scholar]
- 2.Johnson NB, Hayes LD, Brown K, Hoo EC, Ethier KA, Centers for Disease C et al. CDC National Health Report: leading causes of morbidity and mortality and associated behavioral risk and protective factors–United States, 2005–2013. MMWR Suppl. 2014;63(4):3–27. [PubMed] [Google Scholar]
- 3.Hollands GJ, French DP, Griffin SJ, Prevost AT, Sutton S, King S, et al. The impact of communicating genetic risks of disease on risk-reducing health behaviour: systematic review with meta-analysis. BMJ. 2016;352:i1102. doi: 10.1136/bmj.i1102. [DOI] [PMC free article] [PubMed] [Google Scholar]
- 4.Okada Y, Wu D, Trynka G, Raj T, Terao C, Ikari K, et al. Genetics of rheumatoid arthritis contributes to biology and drug discovery. Nature. 2014;506(7488):376–81. doi: 10.1038/nature12873. [DOI] [PMC free article] [PubMed] [Google Scholar]
- 5.Fernando MM, Stevens CR, Walsh EC, De Jager PL, Goyette P, Plenge RM, et al. Defining the role of the MHC in autoimmunity: a review and pooled analysis. PLoS Genet. 2008;4(4):e1000024. doi: 10.1371/journal.pgen.1000024. [DOI] [PMC free article] [PubMed] [Google Scholar]
- 6.Sugiyama D, Nishimura K, Tamaki K, Tsuji G, Nakazawa T, Morinobu A, et al. Impact of smoking as a risk factor for developing rheumatoid arthritis: a meta-analysis of observational studies. Ann Rheum Dis. 2010;69(1):70–81. doi: 10.1136/ard.2008.096487. [DOI] [PubMed] [Google Scholar]
- 7.Qin B, Yang M, Fu H, Ma N, Wei T, Tang Q, et al. Body mass index and the risk of rheumatoid arthritis: a systematic review and dose-response meta-analysis. Arthritis Res Ther. 2015;17:86. doi: 10.1186/s13075-015-0601-x. [DOI] [PMC free article] [PubMed] [Google Scholar]
- 8.Di Giuseppe D, Crippa A, Orsini N, Wolk A. Fish consumption and risk of rheumatoid arthritis: a dose-response meta-analysis. Arthritis Res Ther. 2014;16(5):446. doi: 10.1186/s13075-014-0446-8. [DOI] [PMC free article] [PubMed] [Google Scholar]
- 9.Mikuls TR, Payne JB, Yu F, Thiele GM, Reynolds RJ, Cannon GW, et al. Periodontitis and Porphyromonas gingivalis in patients with rheumatoid arthritis. Arthritis Rheumatol. 2014;66(5):1090–100. doi: 10.1002/art.38348. [DOI] [PMC free article] [PubMed] [Google Scholar]
- 10.Costenbader KH, Feskanich D, Mandl LA, Karlson EW. Smoking intensity, duration, and cessation, and the risk of rheumatoid arthritis in women. Am J Med. 2006;119(6):503 e1–9. doi: 10.1016/j.amjmed.2005.09.053. [DOI] [PubMed] [Google Scholar]
- 11.Di Giuseppe D, Orsini N, Alfredsson L, Askling J, Wolk A. Cigarette smoking and smoking cessation in relation to risk of rheumatoid arthritis in women. Arthritis Res Ther. 2013;15(2):R56. doi: 10.1186/ar4218. [DOI] [PMC free article] [PubMed] [Google Scholar]
- 12.Gan RW, Demoruelle MK, Deane KD, Weisman MH, Buckner JH, Gregersen PK, et al. Omega-3 fatty acids are associated with a lower prevalence of autoantibodies in shared epitope-positive subjects at risk for rheumatoid arthritis. Ann Rheum Dis. 2016 doi: 10.1136/annrheumdis-2016-209154. [DOI] [PMC free article] [PubMed] [Google Scholar]
- 13.Gan RW, Young KA, Zerbe GO, Demoruelle MK, Weisman MH, Buckner JH, et al. Lower omega-3 fatty acids are associated with the presence of anti-cyclic citrullinated peptide autoantibodies in a population at risk for future rheumatoid arthritis: a nested case-control study. Rheumatology (Oxford) 2016;55(2):367–76. doi: 10.1093/rheumatology/kev266. [DOI] [PMC free article] [PubMed] [Google Scholar]
- 14.Lu B, Hiraki LT, Sparks JA, Malspeis S, Chen CY, Awosogba JA, et al. Being overweight or obese and risk of developing rheumatoid arthritis among women: a prospective cohort study. Ann Rheum Dis. 2014;73(11):1914–22. doi: 10.1136/annrheumdis-2014-205459. [DOI] [PMC free article] [PubMed] [Google Scholar]
- 15.Mikuls TR, Thiele GM, Deane KD, Payne JB, O’Dell JR, Yu F, et al. Porphyromonas gingivalis and disease-related autoantibodies in individuals at increased risk of rheumatoid arthritis. Arthritis Rheum. 2012;64(11):3522–30. doi: 10.1002/art.34595. [DOI] [PMC free article] [PubMed] [Google Scholar]
- 16.Quirke AM, Lugli EB, Wegner N, Hamilton BC, Charles P, Chowdhury M, et al. Heightened immune response to autocitrullinated Porphyromonas gingivalis peptidylarginine deiminase: a potential mechanism for breaching immunologic tolerance in rheumatoid arthritis. Ann Rheum Dis. 2014;73(1):263–9. doi: 10.1136/annrheumdis-2012-202726. [DOI] [PMC free article] [PubMed] [Google Scholar]
- 17.Sparks JA, Chen CY, Hiraki LT, Malspeis S, Costenbader KH, Karlson EW. Contributions of familial rheumatoid arthritis or lupus and environmental factors to risk of rheumatoid arthritis in women: a prospective cohort study. Arthritis Care Res (Hoboken) 2014;66(10):1438–46. doi: 10.1002/acr.22366. [DOI] [PMC free article] [PubMed] [Google Scholar]
- 18.Frisell T, Holmqvist M, Kallberg H, Klareskog L, Alfredsson L, Askling J. Familial risks and heritability of rheumatoid arthritis: role of rheumatoid factor/anti-citrullinated protein antibody status, number and type of affected relatives, sex, and age. Arthritis Rheum. 2013;65(11):2773–82. doi: 10.1002/art.38097. [DOI] [PubMed] [Google Scholar]
- 19.Rantapaa-Dahlqvist S, de Jong BA, Berglin E, Hallmans G, Wadell G, Stenlund H, et al. Antibodies against cyclic citrullinated peptide and IgA rheumatoid factor predict the development of rheumatoid arthritis. Arthritis Rheum. 2003;48(10):2741–9. doi: 10.1002/art.11223. [DOI] [PubMed] [Google Scholar]
- 20.Sparks JA, Chen CY, Jiang X, Askling J, Hiraki LT, Malspeis S, et al. Improved performance of epidemiologic and genetic risk models for rheumatoid arthritis serologic phenotypes using family history. Ann Rheum Dis. 2015;74(8):1522–9. doi: 10.1136/annrheumdis-2013-205009. [DOI] [PMC free article] [PubMed] [Google Scholar]
- 21.Sparks JA, Iversen MD, Miller Kroouze R, Mahmoud TG, Triedman NA, Kalia SS, et al. Personalized Risk Estimator for Rheumatoid Arthritis (PRE-RA) Family Study: rationale and design for a randomized controlled trial evaluating rheumatoid arthritis risk education to first-degree relatives. Contemp Clin Trials. 2014;39(1):145–57. doi: 10.1016/j.cct.2014.08.007. [DOI] [PMC free article] [PubMed] [Google Scholar]
- 22.Aletaha D, Neogi T, Silman AJ, Funovits J, Felson DT, Bingham CO, 3rd, et al. 2010 Rheumatoid arthritis classification criteria: an American College of Rheumatology/European League Against Rheumatism collaborative initiative. Arthritis Rheum. 2010;62(9):2569–81. doi: 10.1002/art.27584. [DOI] [PubMed] [Google Scholar]
- 23.Karlson EW, Sanchez-Guerrero J, Wright EA, Lew RA, Daltroy LH, Katz JN, et al. A connective tissue disease screening questionnaire for population studies. Ann Epidemiol. 1995;5(4):297–302. doi: 10.1016/1047-2797(94)00096-c. [DOI] [PubMed] [Google Scholar]
- 24.Sinayev A, Peters E, Tusler M, Fraenkel L. Presenting Numeric Information with Percentages and Descriptive Risk Labels: A Randomized Trial. Med Decis Making. 2015;35(8):937–47. doi: 10.1177/0272989X15584922. [DOI] [PMC free article] [PubMed] [Google Scholar]
- 25.Prochaska JO, DiClemente CC. Stages and processes of self-change of smoking: toward an integrative model of change. J Consult Clin Psychol. 1983;51(3):390–5. doi: 10.1037//0022-006x.51.3.390. [DOI] [PubMed] [Google Scholar]
- 26.Coolidge T, Skaret E, Heima M, Johnson EK, Hillstead MB, Farjo N, et al. Thinking about going to the dentist: a Contemplation Ladder to assess dentally-avoidant individuals’ readiness to go to a dentist. BMC Oral Health. 2011;11:4. doi: 10.1186/1472-6831-11-4. [DOI] [PMC free article] [PubMed] [Google Scholar]
- 27.Prochaska JO, Velicer WF, Rossi JS, Goldstein MG, Marcus BH, Rakowski W, et al. Stages of change and decisional balance for 12 problem behaviors. Health Psychol. 1994;13(1):39–46. doi: 10.1037//0278-6133.13.1.39. [DOI] [PubMed] [Google Scholar]
- 28.Amodei N, Lamb RJ. Convergent and concurrent validity of the Contemplation Ladder and URICA scales. Drug Alcohol Depend. 2004;73(3):301–6. doi: 10.1016/j.drugalcdep.2003.11.005. [DOI] [PubMed] [Google Scholar]
- 29.Carey KB, Maisto SA, Carey MP, Purnine DM. Measuring readiness-to-change substance misuse among psychiatric outpatients: I. Reliability and validity of self-report measures. J Stud Alcohol. 2001;62(1):79–88. doi: 10.15288/jsa.2001.62.79. [DOI] [PMC free article] [PubMed] [Google Scholar]
- 30.Losina E, Michl GL, Smith KC, Katz JN. A Randomized Controlled Trial of an Educational Intervention Using an Online Risk Calculator for Knee Osteoarthritis: Effect on Risk Perception. Arthritis Care Res (Hoboken) 2016 doi: 10.1002/acr.23136. [DOI] [PMC free article] [PubMed] [Google Scholar]
- 31.Huang CM, Wu HL, Huang SH, Chien LY, Guo JL. Transtheoretical model-based passive smoking prevention programme among pregnant women and mothers of young children. Eur J Public Health. 2013;23(5):777–82. doi: 10.1093/eurpub/cks177. [DOI] [PubMed] [Google Scholar]
- 32.Collins FS, Green ED, Guttmacher AE, Guyer MS, Institute USNHGR A vision for the future of genomics research. Nature. 2003;422(6934):835–47. doi: 10.1038/nature01626. [DOI] [PubMed] [Google Scholar]
- 33.Krieger JL, Murray F, Roberts JS, Green RC. The impact of personal genomics on risk perceptions and medical decision-making. Nat Biotechnol. 2016;34(9):912–8. doi: 10.1038/nbt.3661. [DOI] [PubMed] [Google Scholar]
- 34.Christensen KD, Roberts JS, Zikmund-Fisher BJ, Kardia SL, McBride CM, Linnenbringer E, et al. Associations between self-referral and health behavior responses to genetic risk information. Genome Med. 2015;7(1):10. doi: 10.1186/s13073-014-0124-0. [DOI] [PMC free article] [PubMed] [Google Scholar]
- 35.Grant RW, O’Brien KE, Waxler JL, Vassy JL, Delahanty LM, Bissett LG, et al. Personalized genetic risk counseling to motivate diabetes prevention: a randomized trial. Diabetes Care. 2013;36(1):13–9. doi: 10.2337/dc12-0884. [DOI] [PMC free article] [PubMed] [Google Scholar]
- 36.Chao S, Roberts JS, Marteau TM, Silliman R, Cupples LA, Green RC. Health behavior changes after genetic risk assessment for Alzheimer disease: The REVEAL Study. Alzheimer Dis Assoc Disord. 2008;22(1):94–7. doi: 10.1097/WAD.0b013e31815a9dcc. [DOI] [PMC free article] [PubMed] [Google Scholar]
- 37.Christensen KD, Roberts JS, Whitehouse PJ, Royal CD, Obisesan TO, Cupples LA, et al. Disclosing Pleiotropic Effects During Genetic Risk Assessment for Alzheimer Disease: A Randomized Trial. Ann Intern Med. 2016;164(3):155–63. doi: 10.7326/M15-0187. [DOI] [PMC free article] [PubMed] [Google Scholar]
- 38.Green RC, Roberts JS, Cupples LA, Relkin NR, Whitehouse PJ, Brown T, et al. Disclosure of APOE genotype for risk of Alzheimer’s disease. N Engl J Med. 2009;361(3):245–54. doi: 10.1056/NEJMoa0809578. [DOI] [PMC free article] [PubMed] [Google Scholar]
- 39.Aimer P, Treharne GJ, Stebbings S, Frampton C, Cameron V, Kirby S, et al. Efficacy of a Rheumatoid Arthritis-Specific Smoking Cessation Programme; a Pilot Randomized Controlled Trial. Arthritis Care Res (Hoboken) 2016 doi: 10.1002/acr.22960. [DOI] [PubMed] [Google Scholar]
- 40.Lu B, Solomon DH, Costenbader KH, Karlson EW. Alcohol consumption and risk of incident rheumatoid arthritis in women: a prospective study. Arthritis Rheumatol. 2014;66(8):1998–2005. doi: 10.1002/art.38634. [DOI] [PMC free article] [PubMed] [Google Scholar]
- 41.Song GG, Bae SC, Lee YH. Association between vitamin D intake and the risk of rheumatoid arthritis: a meta-analysis. Clin Rheumatol. 2012;31(12):1733–9. doi: 10.1007/s10067-012-2080-7. [DOI] [PubMed] [Google Scholar]
- 42.Hu Y, Costenbader KH, Gao X, Al-Daabil M, Sparks JA, Solomon DH, et al. Sugar-sweetened soda consumption and risk of developing rheumatoid arthritis in women. Am J Clin Nutr. 2014;100(3):959–67. doi: 10.3945/ajcn.114.086918. [DOI] [PMC free article] [PubMed] [Google Scholar]
- 43.Gan RW, Trouw LA, Shi J, Toes RE, Huizinga TW, Demoruelle MK, et al. Anti-carbamylated protein antibodies are present prior to rheumatoid arthritis and are associated with its future diagnosis. J Rheumatol. 2015;42(4):572–9. doi: 10.3899/jrheum.140767. [DOI] [PMC free article] [PubMed] [Google Scholar]
- 44.Deane KD, O’Donnell CI, Hueber W, Majka DS, Lazar AA, Derber LA, et al. The number of elevated cytokines and chemokines in preclinical seropositive rheumatoid arthritis predicts time to diagnosis in an age-dependent manner. Arthritis Rheum. 2010;62(11):3161–72. doi: 10.1002/art.27638. [DOI] [PMC free article] [PubMed] [Google Scholar]
- 45.van de Stadt LA, van Sijl AM, van Schaardenburg D, Nurmohamed MT. Dyslipidaemia in patients with seropositive arthralgia predicts the development of arthritis. Ann Rheum Dis. 2012;71(11):1915–6. doi: 10.1136/annrheumdis-2012-201709. [DOI] [PubMed] [Google Scholar]
- 46.van Beers-Tas MH, Marotta A, Boers M, Maksymowych WP, van Schaardenburg D. A prospective cohort study of 14-3-3eta in ACPA and/or RF-positive patients with arthralgia. Arthritis Res Ther. 2015;18:76. doi: 10.1186/s13075-016-0975-4. [DOI] [PMC free article] [PubMed] [Google Scholar]
- 47.Karlson EW, Chibnik LB, Tworoger SS, Lee IM, Buring JE, Shadick NA, et al. Biomarkers of inflammation and development of rheumatoid arthritis in women from two prospective cohort studies. Arthritis Rheum. 2009;60(3):641–52. doi: 10.1002/art.24350. [DOI] [PMC free article] [PubMed] [Google Scholar]
- 48.Sokolove J, Bromberg R, Deane KD, Lahey LJ, Derber LA, Chandra PE, et al. Autoantibody epitope spreading in the pre-clinical phase predicts progression to rheumatoid arthritis. PLoS One. 2012;7(5):e35296. doi: 10.1371/journal.pone.0035296. [DOI] [PMC free article] [PubMed] [Google Scholar]
- 49.Lautenbach DM, Christensen KD, Sparks JA, Green RC. Communicating genetic risk information for common disorders in the era of genomic medicine. Annu Rev Genomics Hum Genet. 2013;14:491–513. doi: 10.1146/annurev-genom-092010-110722. [DOI] [PMC free article] [PubMed] [Google Scholar]
- 50.Bykerk VP. Strategies to prevent rheumatoid arthritis in high-risk patients. Curr Opin Rheumatol. 2011;23(2):179–84. doi: 10.1097/BOR.0b013e32834379ee. [DOI] [PubMed] [Google Scholar]