Abstract
Purpose
Optical prospective motion correction substantially reduces sensitivity to motion in neuroimaging of human subjects. However, a major barrier to clinical deployment has been the time-consuming cross-calibration between the camera and MRI scanner reference frames. This work addresses this challenge.
Methods
A single camera was mounted onto the head coil for tracking head motion. Two new methods were developed: i) a rapid calibration method for camera-to-scanner cross-calibration using a custom-made tool incorporating wireless active markers; and ii) a calibration adjustment method to compensate for table motion between scans. Both methods were tested at 1.5 T and 3 T in vivo. Simulations were performed to determine the required mechanical tolerance for repositioning of the camera.
Results
The rapid calibration method is completed in a short (< 30 s) scan, which is performed only once per installation. The calibration adjustment method requires no extra scan time and runs automatically whenever the system is used. The mechanical tolerance analysis indicates that most motion (90% reduction in voxel displacement) could be corrected even with far larger camera repositioning errors than are observed in practice.
Conclusion
The methods presented here allow calibration of sufficient quality to be performed and maintained with no additional technologist workload.
Keywords: optical adaptive motion correction, prospective motion correction, in-bore camera, cross-calibration, wireless active markers
INTRODUCTION
Image degradation caused by patient motion remains a challenge in clinical magnetic resonance imaging (1). A recent study by Andre et al. showed that 29.4% of inpatient and emergency department MR examinations of the neuroaxis contained at least one sequence exhibiting ‘significant motion artifacts’ over a week of data collection at their institution (2). Andre et al. calculate that the repeated scans required result in substantial lost revenue to the radiology department of approximately $115,000 per scanner per year; less quantifiable is the inconvenience and stress experienced by the patient. It is evident that despite some effective solutions for specific sequences (3,4), there remains a need for better, more general, motion correction methods in MRI of the brain.
In the research community, prospective motion correction has gained prominence as an effective method to prevent motion artifacts (5). Head pose (position and orientation) information is used to update the imaging volume position and orientation during scanning, thereby compensating in real-time for any motion that occurs. Several methods exist to obtain the required head tracking data: one of these is optical tracking using a camera system. Optical tracking is independent of the MRI scanner, so sequence modifications are minor, and steady state magnetization is unaffected by tracking. Thus, in principle, optical prospective correction can be applied to any clinical neuroimaging sequence, and has already been demonstrated in many of these in practice (6–10). Aside from compensating for large bulk motions, recent work by Stucht et al. indicates that effective prospective correction further enables higher resolution imaging in volunteers than would otherwise be achievable (11), due to the correction of tiny involuntary movements. Nonetheless, despite the promise of this technique, it has not yet become widely available in clinical practice.
One obstacle to effective optical prospective motion correction in the clinic is maintaining a sufficiently clear line of sight from the camera, or cameras, to a head-mounted optical marker. Early proof-of-concept studies used multiple cameras external to the bore of the MRI scanner (12,13). However, line of sight is often problematic for this configuration, particularly for narrow-bore magnets, enclosed head coils, or large subjects. Typically, the geometry of such a setup requires the marker to be attached to a mouthpiece, which makes the method impractical for clinical use. Later work with MR-compatible cameras made it possible to use cameras within the B0 field of the MRI scanner, for example attached to the inner surface of the bore (14) or to a ring placed around the head coil (15). A remaining challenge with these methods is that most commercially available head coils are relatively enclosed, particularly those with a high number of receive channels. Achieving reliable line of sight to a head-mounted marker is therefore not always possible. We have found that an effective solution to this problem is to place a single camera directly on the head coil, such that an unimpeded view of the head can be achieved between the rungs of the coil (16). Others have used the same approach with multiple cameras (17).
A challenge for coil-mounted cameras is the need to calibrate the position and orientation of the camera system relative to the MRI coordinate system, as defined by the imaging gradients. This need arises because the camera’s reference frame (where motion is measured) is not automatically aligned with the MRI scanner’s reference frame (where motion correction is applied). The process of determining the transformation between these two reference frames is typically termed ‘cross-calibration’, as described by Zaitsev et al. in 2006 (12). In most systems described previously, performing an accurate cross-calibration has typically required at least 30 minutes (12,14,18,19). If the camera system is moved relative to the gradient system of the MRI scanner, then either the camera needs to be returned to an identical position (not normally done in practice) or cross-calibration needs to be repeated. This requirement has made head-coil-mounted systems difficult to deploy in a clinical setting.
Previous theoretical work (20) indicates that cross-calibration needs to be extremely accurate (‘substantially below 1 mm and 1°’) for optical prospective motion correction. However, we have observed that even with suboptimal cross-calibration, due to errors of several millimeters in camera repositioning, excellent results can be obtained. At first sight, this seems to contradict the earlier theoretical work, indicating the need for further investigation.
The primary goal of this work was to produce a rapid, accurate, cross-calibration system for optical tracking systems mounted on the head coil, allowing optical motion correction to be used clinically, without a drain on technologist time. Two new methods – a rapid calibration method and a calibration adjustment method – are introduced here to achieve this goal. A secondary goal was to establish practical guidelines concerning how precisely a camera that is moved must be repositioned and to reconcile this with previous theoretical work.
METHODS
Camera hardware
The optical tracking system used in this work was a custom-built monochrome camera, with a resolution of 640 × 480 and a frame rate of 60 Hz. It is used within the MRI bore to measure head motion by tracking a ‘checkerboard’ optical marker placed on the forehead of the subject. In this work, the camera was mounted on a standard 8-channel head coil (Fig. 1, right panel), which has an advantage over a bore-mounted configuration (Fig. 1, left panel), since the patient table and coil can be moved without obscuring the camera’s view of the head-mounted marker. As shown in Figure 1, the challenge with this approach is that the original transformation, , between camera and scanner isocenter will change as the table moves (indicated by in Fig. 1). The development of a practical method to determine and was the major goal of this work.
Figure 1.
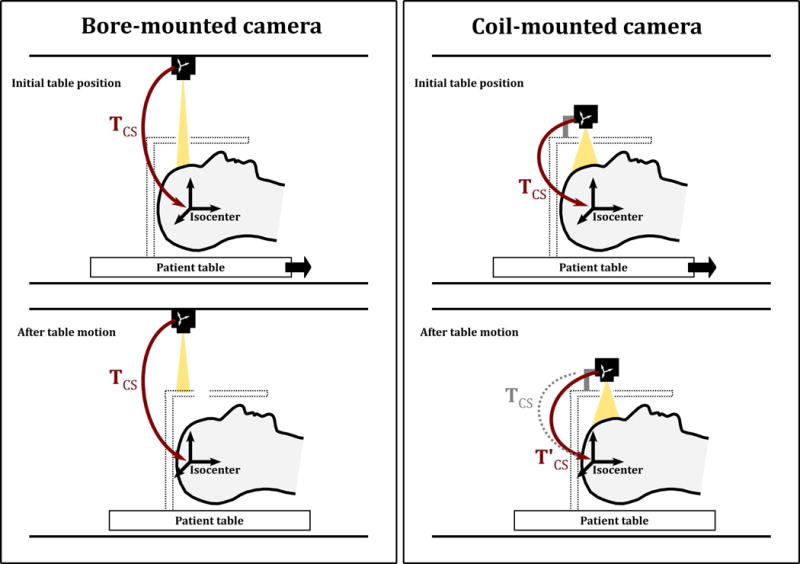
Two different approaches for optical prospective motion correction: the camera mounted on the scanner bore (left) and the camera mounted on the head coil (right). The bottom row illustrates the effect of moving the patient table during or between scans. A bore-mounted camera remains in the same position relative to the scanner isocenter, denoted by the transform ; however, the head coil may then block the line of sight to the patient. A coil-mounted camera moves with the patient table, so line of sight to the patient is maintained; however, the relative position of the camera to the scanner frame of reference is changed, denoted by .
Rapid Calibration Method: Calibration tool and software
To perform the cross-calibration procedure described in the following, we designed and constructed a ‘calibration tool’ (Figure 2a), comprising three wireless active markers (21) and an optical tracking marker (22). By rigidly coupling scanner-trackable and camera-trackable markers, the calibration tool allows simultaneous tracking of the same applied motion in both the scanner and camera reference frames. This features is exploited to rapidly calculate the cross-calibration transformation, .
Figure 2.
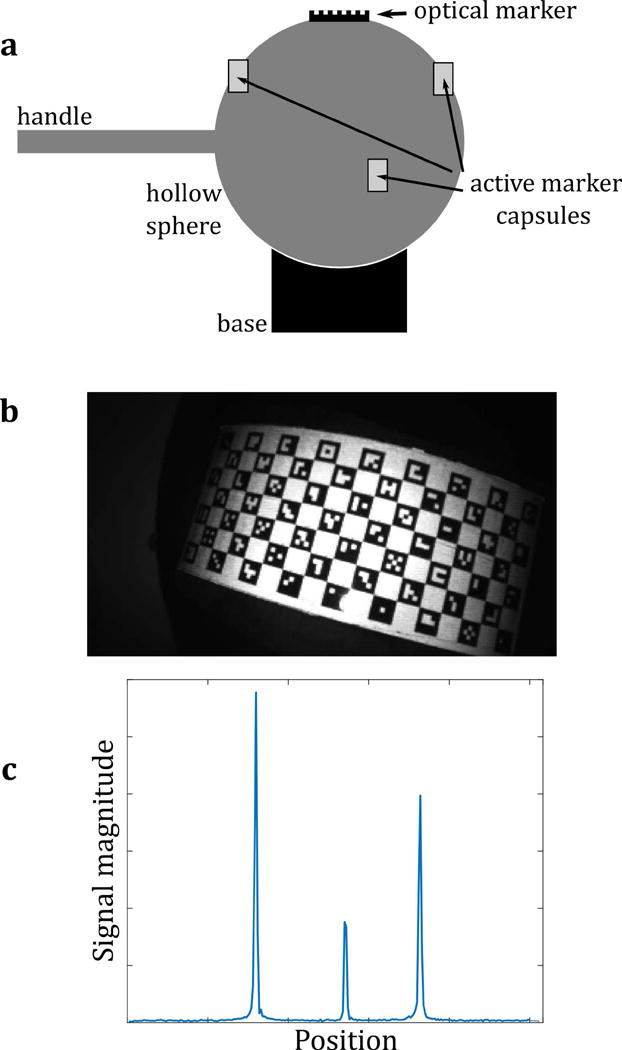
(a) The calibration tool, comprising both an optical marker and three wireless active markers, combined in a rigid arrangement. All markers are fixed to a hollow plastic sphere (10 cm diameter), which can be moved as a rigid body (rotations and translations only; no scaling or shearing). The calibration tool is placed at approximately the scanner isocenter. Rotations in all three directions are applied manually using the plastic handle. (b) A video frame of the calibration tool, used to calculate the pose of the tool in camera coordinates (c) MR projection data of the active markers on the tool, used to calculate the pose of the tool in scanner coordinates.
The calibration tool is based on a plastic sphere mounted on a curved base. This allows rotations to be performed approximately about the scanner isocenter. Following the description in Ooi et al. (21) for in vivo imaging, the active markers are placed on the phantom such that their approximate geometric configuration is known. However, the exact geometric relationship between the active markers and the optical marker is not known in advance and is never explicitly calculated. The only requirement for the methods that follow is that the relationship is constant, i.e., that the calibration tool is rigid throughout the calibration process.
Simultaneous tracking of the calibration tool in both camera and scanner reference frames is illustrated in Fig. 2b and 2c, respectively. A video frame of the calibration tool (Figure 2b) shows the optical marker, which allows the calibration tool’s position to be measured in the camera reference frame. A tracking pulse sequence was created that measures the active marker positions, by applying projections in the x, y and z directions. The reconstructed projection data contains peaks (Fig. 2c), which are localized to determine the position of the markers (21) in the scanner reference frame. A key difference to the sequence in Ooi et al. (21) is the omission of the volume spoiler gradients. These are not necessary for the calibration phantom, since it contains no source of MR signal other than the samples within the markers. In Ooi et al. (21), the spoiler gradients act to suppress signal from any ‘large’ object in the field of view, by generating multiple phase rolls across the object. However, to a lesser extent, they also create non-negligible phase variation across the samples in the active markers, which leads to reduced signal from the markers. The omission of these spoiler gradients is therefore useful in this case to avoid suppressing the marker signal and reducing the signal-to-noise ratio.
An additional feature of this setup is that prospective motion correction can be simultaneously applied to the active marker tracking pulse sequence using the optical tracking data. This provides a useful self-consistency check and allows further refinement of the cross-calibration transformation.
Figure 3 illustrates the procedure for cross-calibration acquisition and post-processing. First, the calibration tool is scanned for ~30 seconds (the exact time used depends on the protocol settings) using the tracking pulse sequence, which continuously measures the active marker positions. Concurrently, the position of the calibration tool is monitored using the optical tracking system. During the scan, the operator moves the calibration tool in a step-wise manner through an arbitrary number of poses (typically between 10 and 20) pausing for an arbitrary amount of time (typically 1.5 s to 3 s) as each pose is reached. The movements themselves are also arbitrary, but should ideally include rotations about all three axes to improve the conditioning of the problem. (If all rotations were about a single axis, there would be insufficient information to determine the cross-calibration transformation.) In this work, we used rotations with a maximum magnitude of approximately 15°, which are easily performed within the constraints of the head coil. The calibration procedure is performed while attempting to avoid ‘peak crossover’ (21), which would cause marker tracking to fail. It is also important to keep the optical marker in the camera field of view. However, failure of either tracking modality for a given pose simply results in data for that pose being discarded at a later stage and does not cause complete calibration failure.
Figure 3.
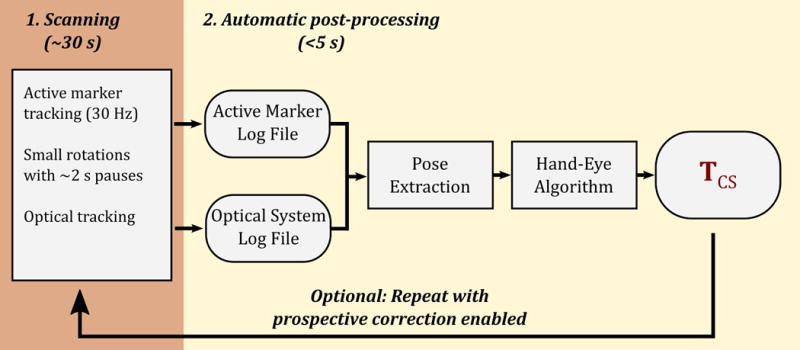
A flowchart illustrating the one-time cross-calibration process used to find the camera-to-scanner coordinate transformation, TCS. The calibration tool (Fig. 2a) is scanned for approximately 30 s with a tracking pulse sequence, and concurrently monitored with the optical tracking system, while the operator manually rotates the calibration tool. The automatic post-processing algorithm then computes TCS based on the data logged during this process. Optionally, this process can be repeated with prospective motion correction of the active marker tracking pulse sequence enabled.
As illustrated in Figure 3, the output of the calibration scan is two log files: the active marker log file and the optical tracking system log file. Once the calibration scan is completed, data from these files are automatically processed using custom software written in Matlab (The Mathworks, USA). The processing algorithm proceeds as follows. Tracking logs from both tracking systems are processed to extract a series of ‘poses’ from both data sets. For each set of poses, a series of ‘movements’ (i.e., rigid-body transformations) are then calculated between pairs of consecutive poses. The two sets of movements correspond to the same physical motion of the calibration tool; however, one set of movements is defined in the MRI scanner reference frame, while the other is in the camera reference frame. To compute the cross-calibration transformation, a hand-eye calibration approach known as the Tsai method (23) is used, common in the field of robotics, and similar to that used by Zahneisen et al. (19). To summarize the Tsai method, a transformation is calculated between the two systems, such that the observed motion is as consistent as possible when the transformation is used to map data from one reference frame to the other.
Optionally, the above procedure can be repeated, while applying prospective motion correction to the tracking pulse sequence using the transformation matrix calculated after the first iteration. This allows larger rotations to be applied to the calibration tool, without risk of peak overlap in the projections. This could potentially lead to better conditioning of the final calculated transform by using a larger range of calibration tool motions. It is also a useful quality assurance tool, since it tests that the real time scanner updates are working correctly.
The result of the cross-calibration procedure is a 4-by-4 homogeneous transformation matrix, . This homogenous transformation matrix includes a 3-by-3 rotation matrix, R, and a 3-by-1 translation vector v, i.e.,
where the translation vector, v, contains three components
and where x, y, and z describe the shift from the origin of the MRI scanner coordinate system to the origin of the optical tracking coordinate system, and are defined according to the scanner’s physical gradient axes. For a patient lying head-first supine, x corresponds to the patient left-right (LR) direction, y to the patient anterior-posterior (AP) direction, and z to the patient head-feet (HF) direction.
It is assumed that remains constant in all future experiments, except for the z-component of v, which is adjusted as described in the following.
Calibration Adjustment Method
For the coil-mounted setup shown in Figure 1, any movement of the patient table (and head coil) between patients or between scans invalidates as obtained using the rapid calibration method described above. A calibration adjustment method is therefore employed to compensate for table motion, which is based on two assumptions: (1) table motion occurs only in the z-direction; (2) this offset in z can be adequately measured using the table ‘position encoder’.
The position encoder is part of the scanner manufacturer’s patient table mechanism, and returns a value indicating the table position in the z-direction. When the initial calibration is performed, this value, tz0, is recorded, along with the calculated transformation matrix. Whenever a new patient is scanned with a different landmark, or the table is moved during a scan, a new value, tz1, is obtained from the position encoder. The translation vector component of the transformation matrix is then updated such that z, the component of the translation vector describing the shift in the z direction is replaced with z′, i.e.,
where z′ = z + (tz1 – tz0).
Repeatability experiment
To test the repeatability of the calibration method, the entire calibration process was performed 6 times on a single scanner (1.5 T, MR450w, GE Healthcare). Between each calibration, the table was undocked and re-docked and the head coil and camera were removed and replaced. This simulates the workflow in the hospital at our institution, where the table is typically removed between patient scans.
Simulations
Software was written in Matlab to simulate the effect of calibration errors in prospective motion correction. The input data to the simulation includes four components:
A 3D model derived from the patient’s (or any patient’s) T1-weighted MRI data by straightforward surface rendering.
Recorded or simulated motion.
The camera position and orientation in the scanner.
Cross-calibration error terms for both translations and rotations.
The use of a 3D head model (i) makes the simulation more realistic than if the head was modeled as a sphere or ellipsoid. The inclusion of arbitrary motion (ii) allows a patient scan to be ‘repeated’ in the simulator using real-world tracking data from the scan. The camera position and orientation (iii) in the scanner bore is needed, since this influences tracking errors resulting from cross-calibration errors (iv). Given fixed input data for (i)-(iii), it is then possible to allow cross-calibration errors (iv) to vary to produce plots showing the effect of these errors on motion correction performance.
To aid interpretation of the results, we define a new metric: the mean voxel displacement (MVD). This allows motion occurring during an MRI scan to be quantified using a single parameter. Similarly, the MVD metric can be used to indicate how much residual motion occurs due to cross-calibration errors when prospective motion correction is enabled. The MVD is calculated by summing the absolute vector displacement for all points (representing voxels) in the 3D head model between each pair of consecutive poses and then dividing by the number of points. Specifically,
| (1) |
where q and p represent all points in the head model for two poses q and p, respectively, and n is the total number of points in the model. The physical interpretation of Eq. (1) is the mean distance travelled by a voxel in the head model during the change in pose from p to q. The voxel size in the model is arbitrary and has little effect on the final value; here we used an isotropic resolution of 15 mm, to keep the number of points low and computation time short. Figure 4 illustrates the calculation of the MVD for a single time point. The MVD can be trivially extended to the entire scan duration by summing the mean voxel displacement over all pairs of consecutive poses (Fig. 5). In this way, a measure of the total amount of motion occurring during the scan is obtained (nearly 400 mm in the example shown).
Figure 4.
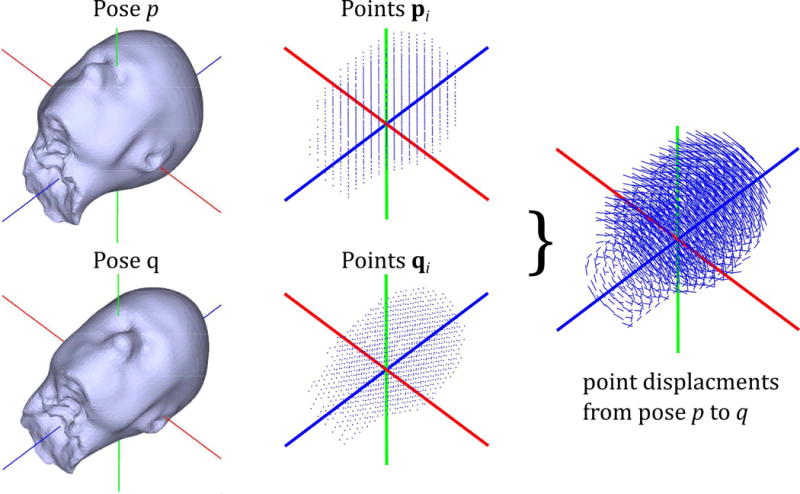
Simulation environment and ‘mean voxel displacement’ (MVD) calculation. Point clouds representing all n voxels inside the head model are used to calculate the mean voxel displacement (MVD) between consecutive time points (p and q, here). This is summed over the entire scan (see Fig. 5) to serve as a metric to quantify motion that occurred or remained uncorrected.
Figure 5.
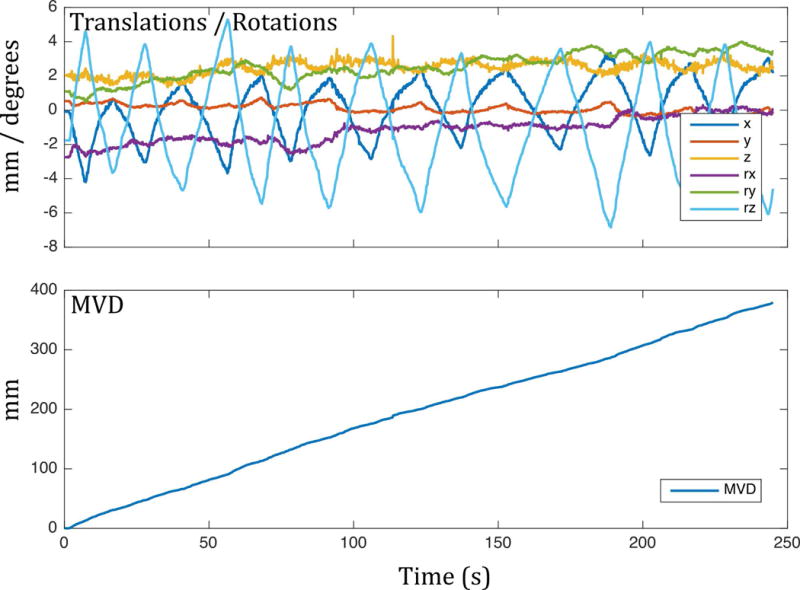
Example mean voxel displacement (MVD) for a volunteer making a ‘head-shaking’ motion. The MVD allows greatly simplified quantification of motion.
Mechanical tolerance determination
The simulator and MVD metric were used to determine the acceptable mechanical tolerance for repositioning of the head coil and camera. Since any calibration error results in motion correction errors, to answer this question it was necessary to define a threshold for ‘acceptable’ motion correction. A reduction in MVD of 90% was chosen as the threshold and used in the simulations. The choice of 90% is arbitrary, but in our experience, it represents a significant (and potentially clinically important) reduction in motion artifacts in the final MR images. The fixed input data for the mechanical tolerance simulation comprised:
A 3D head model derived from a structural scan (sagittal 3D IR-SPGR, 27 cm FOV, 256 × 256 matrix size, 1.2mm slice thickness) of a volunteer.
Simulated ‘worst-case’ motion consisting of consecutive sinusoidal rotations about each axis. For each axis, the amplitude was set at the maximum show by Ooi et al. (21) to be physically reasonable within an 8-channel head coil.
The camera position and orientation in the scanner, as obtained by calibrating the system in its normal position on an 8-channel head coil.
In vivo experiments
At the time of writing, the methods described here have been used to calibrate the optical tracking system on nine different 1.5 T / 3 T MR scanners and two 3T PET/MR scanners for IRB-approved studies of patients and volunteers. These results will be reported elsewhere. For testing and demonstrating the calibration algorithm, here we report a small subset of these results, namely an experiment performed on two subjects, who were instructed to make large voluntary motions, which inherently tests the quality of cross-calibration.
This experiment was performed on a 3 T MR750 scanner (GE Healthcare). Two outpatient volunteers with known pathology were imaged: a male with a vessel abnormality (Subject 1), and a female with a pituitary microadenoma (Subject 2). Subject 1 was imaged using a 3D time-of-flight (TOF) MRA sequence. Subject 2 was imaged using a 2D sagittal T2-weighted FSE sequence (echo train length: 16, TE: 101 ms, TR: 4942 ms, slice thickness: 2 mm). Both subjects were instructed to move continuously during two scans: one with prospective correction off and one with prospective correction on.
Finally, we performed an experiment on a volunteer to provide an in vivo illustration of the meaning of the mechanical tolerance results derived in this manuscript. In this experiment, we replicated the effect of potential cross calibration errors in the z-direction by deliberately introducing errors (denoted ez) into the cross-calibration transform. The z-direction was chosen, because that is the degree of freedom that is the least tightly constrained, due to motion of the patient table in that direction.
Prior to the experiment, the volunteer practiced a motion trajectory involving tracing out a ‘figure of eight’ with their nose, a motion pattern proposed by Herbst et al. (8) (see Figure 3 in Ref. (8) for an illustration). This motion was repeated continuously during all the following imaging experiments, with a period of approximately 15 s. The volunteer was imaged six times using an axial IR-FSPGR BRAVO acquisition (TE: 3.2 ms, TR: 9.7 ms, TI: 450 ms, matrix size: 256 × 256, slice thickness: 1.2 mm), while performing the motion continuously. The six acquisitions were identical, other than the type of motion correction used: 1) no correction, 2) correction with no extra errors, 3) correction with ez values of 3 mm, 6 mm, 12 mm and 24 mm, respectively. Setting ez equal to 3 mm, for example, is equivalent to a 3 mm error in knowledge of the camera’s position along the z-axis of the MRI scanner. In practice, such an error could be caused by errors in the table position encoder or by errors in the cross-calibration algorithm itself.
RESULTS
Figure S1, in the supporting information, shows plots generated by the calibration software. The data are from ‘Calibration #1’ of the repeatability experiment, and are typical of the data obtained using the methods described here. Figure S1a is a plot of the ‘raw’ input data logged to file during the scan and used by the calibration algorithm to determine the cross-calibration transformation . As the calibration tool is moved, its pose is simultaneously recorded in the optical reference frame by the camera system (red curves), and the scanner reference frame by the wireless marker tracking pulse sequence (blue curves). The flat regions in the curves correspond to the discrete poses traversed by the calibration tool during the calibration procedure. The translations for the wireless marker tracking data are close to zero: this is because the rotations performed are approximately about the scanner isocenter, so associated translations of the tracking tool are minimal in the scanner reference frame.
Once obtained, can be applied to transform the optical poses to the scanner reference frame. Figure S1b plots the result of this: 13 discrete poses have been extracted from the data shown in Fig. S1a and the data from both tracking modalities are now shown in the same reference frame. These curves are not used in practice (the entire process is automated), but nonetheless, the plot is useful to indicate the consistency of the optical data and the wireless marker data. The mean absolute errors between the curves are 0.07 mm, 0.06 mm, and 0.15 mm for translations in x, y, and z, respectively, and 0.08°, 0.03° and 0.05° for the respective rotations about the x, y and z axis.
Tables 1 and 2 show results from the repeatability experiment. For each repetition, the translation and rotation values (Euler angles) shown are calculated from the corresponding . These values indicate the position and orientation of the camera in the scanner reference frame. In other words, from the data in the table, it is evident that the camera is located approximately 50 mm to the patient left of the isocenter, 160 mm above the isocenter, and 45 mm behind the isocenter. Table 1 shows calibration results purely from the first stage of the calibration; Table 2 shows results from the second stage, which incorporates prospective motion correction into the marker tracking pulse sequence.
Table 1.
Results of the calibration repeatability experiment, using only one iteration of the calibration procedure.
| Translations (mm) | Rotations (degrees) | |||||
|---|---|---|---|---|---|---|
| x | y | z* | Rx | Ry | Rz | |
| Calibration #1 | −51.73 | 163.69 | 45.17 | −88.46 | 1.10 | −22.76 |
| Calibration #2 | −51.96 | 163.21 | 45.26 | −88.69 | 0.69 | −22.76 |
| Calibration #3 | −51.80 | 162.87 | 45.62 | −89.02 | 0.32 | −22.90 |
| Calibration #4 | −51.50 | 163.10 | 44.88 | −88.53 | 0.72 | −22.82 |
| Calibration #5 | −51.95 | 163.56 | 45.22 | −88.74 | 0.60 | −22.96 |
| Calibration #6 | −50.81 | 162.41 | 44.51 | −88.79 | 0.22 | −22.50 |
| Mean | −51.63 | 163.14 | 45.11 | −88.71 | 0.61 | −22.78 |
| Standard deviation | 0.43 | 0.47 | 0.38 | 0.20 | 0.31 | 0.16 |
z translation value adjusted to correct for measured table position differences
Table 2.
Results of the calibration repeatability experiment, using two iterations of the calibration procedure: first with prospective correction off, then with prospective correction on.
| Translations (mm) | Rotations (degrees) | |||||
|---|---|---|---|---|---|---|
| x | y | z* | Rx | Ry | Rz | |
| Calibration #1 | −51.57 | 161.68 | 45.54 | −88.67 | 0.53 | −22.77 |
| Calibration #2 | −51.14 | 162.49 | 45.43 | −88.68 | 1.04 | −22.68 |
| Calibration #3 | −52.01 | 161.47 | 45.14 | −88.83 | −0.17 | −23.19 |
| Calibration #4 | −52.01 | 162.70 | 44.96 | −88.66 | 0.97 | −22.81 |
| Calibration #5 | −51.77 | 162.65 | 45.54 | −88.82 | 0.22 | −22.86 |
| Calibration #6 | −51.77 | 160.70 | 45.62 | −88.95 | −0.40 | −23.02 |
| Mean | −51.71 | 161.95 | 45.37 | −88.77 | 0.36 | −22.89 |
| Standard deviation | 0.33 | 0.80 | 0.26 | 0.12 | 0.59 | 0.19 |
z translation value adjusted to correct for measured table position differences
Figure 6 shows the results of the mechanical tolerance simulations. Plots are shown for three difference scenarios: errors in camera repositioning of 0.5°, 1° and 1.5°. The plots then explore the effect of translational errors in camera reposition on the reduction in mean voxel displacement (MVD). In each case, the dotted line indicates the values of translation error that correspond to reduction in MVD of 90%. For example, the lower plot indicates that if the camera is repositioned with rotation errors of 1.5° in all three degrees of freedom, and translation errors of 6 mm in all three degrees of freedom, the reduction in ‘apparent’ motion after prospective motion correction is applied is 90%.
Figure 6.
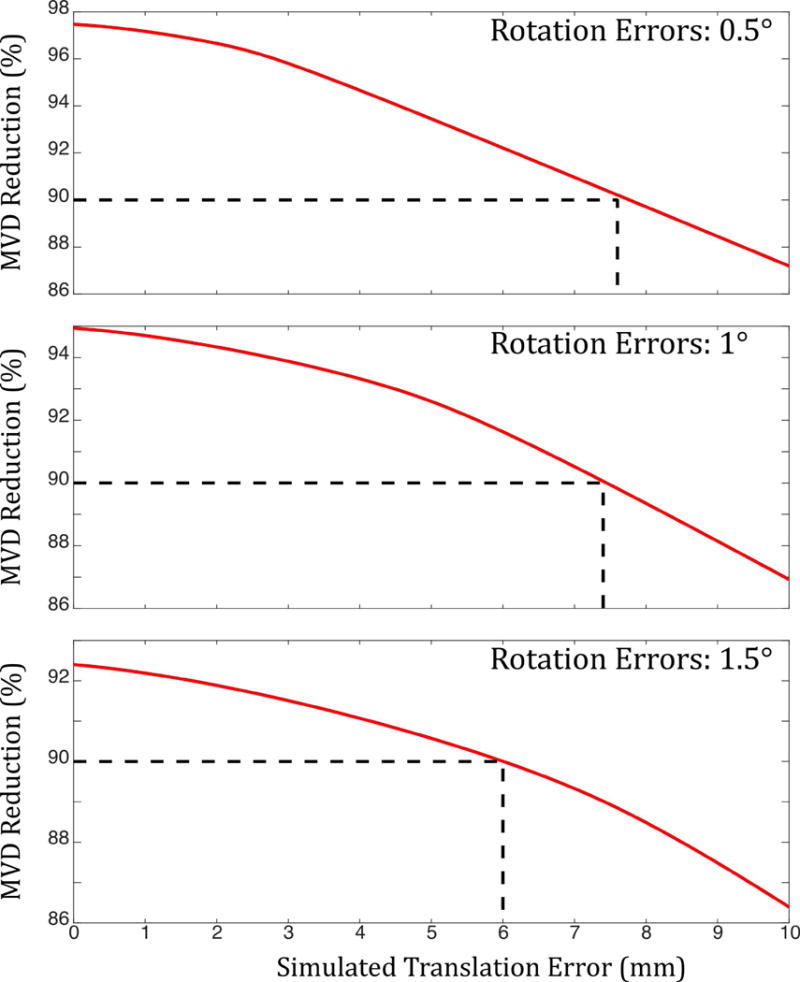
Results of mechanical tolerance simulations. Plots show motion (MVD) reduction after prospective correction against errors in camera translation for three different values of error in camera rotation. Even with rotation errors of 1.5 degrees and translation errors of 6 mm, MVD reduction of 90% can be achieved.
In vivo results are shown in Figure 7 with (left) and without (right) motion correction. The time of flight angiogram indicates that Subject 1 has a left middle cerebral artery occlusion; this is not apparent in the uncorrected angiogram, since the smaller vessels on the right side are also not visible, due to the severe motion artifacts. A similar situation is apparent in the sagittal FSE used to image Subject 2: motion artifacts obscure the clinical pathology, in this case a pituitary microadenoma (red arrow).
Figure 7.
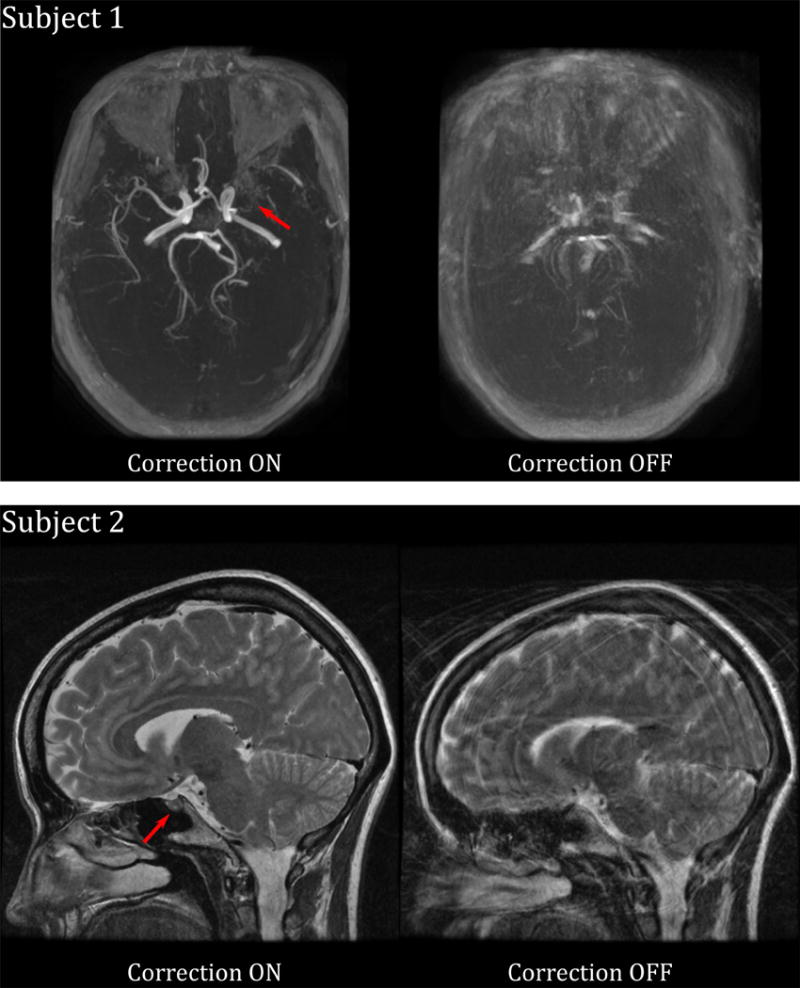
Images obtained from two outpatient volunteers who were instructed to move continuously during imaging. Both subjects have pathology (red arrows) that is visible with motion correction on, but not with motion correction off. Subject 1 has a middle cerebral artery occlusion; Subject 2 has a pituitary microadenoma.
Figure 8 shows results of the in vivo experiment performed to illustrate the effect of errors (ez) in the knowledge of the z-position of the camera. The continuous ‘figure of eight’ motion trajectory produced severe motion artifacts (top left) when left uncorrected. These artifacts were largely prevented when using optical prospective motion correction (top middle) with the ‘true’ (unperturbed) cross-calibration transformation. Apparent differences in image quality are minor for ez = 3 mm (top right) and ez = 6 mm (bottom left). However, ez = 12 mm results in obvious residual artifacts (bottom middle) and this effect becomes more serious for ez = 24 mm.
Figure 8.
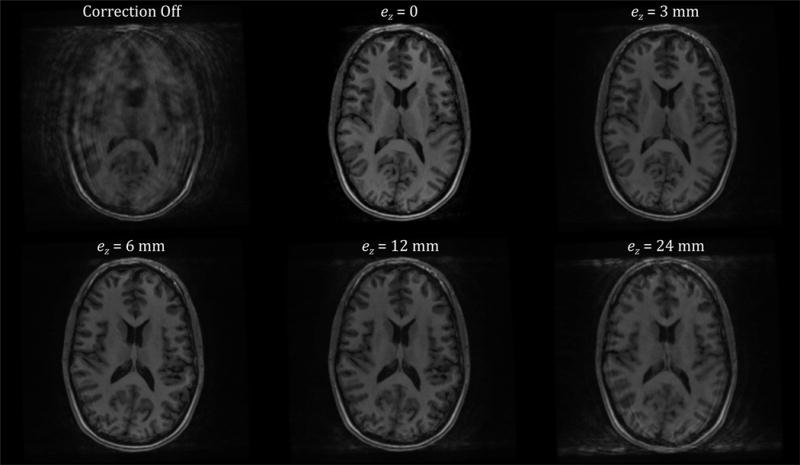
Results of the in vivo experiment performed to illustrate the effect of errors in the knowledge of the z-position of the camera (ez). The subject was trained to continuously perform head motion by moving the tip of their noise in a ‘figure of eight’ pattern with a period of approximately 15 s. This produces severe motion artifacts (top left), which are largely prevented when using optical prospective motion correction (top middle). Increasing the value of the error term ez in the z-component of the cross-calibration degrades the final image quality, although for small values, such as <= 6 mm (top right, bottom left), this is barely noticeable. However, for larger values of ez, residual motion artifacts are easily visible (bottom middle, bottom right).
DISCUSSION AND CONCLUSIONS
There are many practical requirements for effective optical prospective motion correction in MRI. These include sufficient tracking precision and accuracy (24,25), robust marker fixation (26), high frame rate and low latency (24), good line of sight to the subject, a sufficiently accurate cross-calibration, and the ability to move the patient table as normal. The primary goal of this work was to address these final three requirements.
The combination of good line of sight, accurate cross-calibration, and the ability to move the patient table has previously posed a major challenge. Tracking systems mounted externally to the MRI scanner (12) or on the bore (14) have achieved good cross-calibration accuracy; however, line-of-sight issues are then problematic. Systems mounted on the head coil (16) have achieved better line of sight, but the time required for patient-specific cross-calibration has been a concern for clinical deployment. Table motion has been a major problem for all these systems, since it either risks blocking line of sight (for bore-mounted systems) or invalidating the cross-calibration (for coil-mounted systems).
In this work, we have addressed the line of sight issue by mounting the camera on the head coil. We believe that this is the most practical approach for clinical deployment, particularly given the advent of head coils with a high channel count and therefore an enclosed design that further inhibits line of sight. Additional advantages of mounting the camera on the head coil include use for eye tracking or physiological monitoring (27). We have addressed the cross-calibration challenge by developing a new calibration method, based on wireless active markers. This allows both accurate and fast calibration to be performed, with a one-time scan of less than 30 seconds. Finally, table motion effects have been addressed using the built-in table position encoder to update the cross-calibration transformation.
The methods presented here allow optical motion correction to be applied during routine scanning. The calibration step is done only once, after installation of the camera on the chosen head coil at each MRI scanner. A possible step-by-step workflow for using this system on patents is then as follows:
Mount head coil on table
Position patient in head coil, as normal
Attach marker and confirm good marker visibility in video
Landmark patient and move table to scanner isocenter, as normal (table encoder position used to automatically to adjust cross-calibration matrix)
Scan patient using motion-correction-enabled sequences
Remove patient, and remove and dispose of marker
The only steps requiring extra technologist input are thus (3) and (6): attaching and removing the marker. This is a relatively short procedure (< 30 s), so we do not consider this to be a barrier to clinical practicability. The relatively large tolerances in camera repositioning mean that the calibration need never be repeated at the same MR scanner, because the head coil can be removed and replaced without introducing errors above these tolerances. However, in our experience, it is necessary to repeat the calibration if the system is moved to a new MR scanner, because there are typically significant differences in the mechanical mounting configurations of head coils between different MR systems.
The secondary goal of this work was to gain a better understanding of the mechanical tolerance acceptable for repositioning the camera. The simulation results shown indicate that good motion correction performance can be obtained despite cross-calibration errors of several millimeters in all degrees of freedom. The discrepancy between this and the tighter tolerances given in Zahneisen et al. (20) occurs because here the threshold for ‘acceptable’ motion correction is a 90% reduction in voxel motion, whereas previous work attempts to keep residual artifacts below the noise floor, using motion of a worst-case voxel. Thus, our results complement, rather than contradict previous work. It is important to note that the MVD metric is highly specific to the analysis of calibration accuracy discussed in this work. The MVD metric should not be used to attempt to predict motion artifact levels between different sequences or even between different scans using the same sequence. In these cases, looking at the total voxel motion would be an oversimplification: the timing of motion relative to the k-space trajectory is also a critical factor, which would be ignored by the metric. However, using the MVD metric for the analysis here has two advantages: it specifically quantifies the reduction in ‘apparent motion’ in a prospectively corrected sequence, and a practical motion reduction threshold can be set to make a substantial difference to any given exam, which is the end goal of prospective motion correction.
A limitation of this work is the assumption of linearity of both the MR scanner coordinate frame and the camera coordinate frame. Both frames of reference have non-linear components: the camera coordinate system is affected by lens distortions and the MR coordinate system is distorted by gradient non-linearities. These distortions could lead to minor calibration errors. The effect of camera distortions is mitigated by the intrinsic camera calibration and calculation of radial and tangential distortion parameters, which seek to remove these distortions; however, the effect of MR coordinate system distortions is mitigated only by attempting to use the calibration tool as near as possible to the isocenter, where the gradients are relatively linear. To further improve this method, it might be advisable to apply gradient non-linearity correction to the active marker tracking sequence.
In conclusion, the calibration method presented here is substantially easier to use and more time efficient than existing methods. For practical applications, errors in camera repositioning of several millimeters do not prevent good optical motion correction results, which means that the table position encoder is accurate enough to perform recalibration. These advances may facilitate the more widespread adoption of optical prospective motion correction in the clinic.
Supplementary Material
Figure S1: Result of a single calibration experiment: (a) plot of raw data collected from optical system (red curves) and wireless markers (blue curves), relative to the first position; (b) extracted poses from both the optical system and wireless markers; the optical data have been transformed to the MRI scanner reference frame using the calculated cross-calibration matrix .
Acknowledgments
NIH (5R01 EB011654, 5R21 EB017616), the Center of Advanced MR Technology at Stanford (P41 RR009784), Lucas Foundation.
References
- 1.Zaitsev M, Maclaren J, Herbst M. Motion artifacts in MRI: A complex problem with many partial solutions. J Magn Reson Imaging [Internet] 2015:n/a–n/a. doi: 10.1002/jmri.24850. [DOI] [PMC free article] [PubMed] [Google Scholar]
- 2.Andre JB, Bresnahan BW, Mossa-Basha M, Hoff MN, Smith CP, Anzai Y, Cohen WA. Toward Quantifying the Prevalence, Severity, and Cost Associated With Patient Motion During Clinical MR Examinations. J Am Coll Radiol [Internet] 2015;12:689–95. doi: 10.1016/j.jacr.2015.03.007. [DOI] [PubMed] [Google Scholar]
- 3.Pipe JG. Motion correction with PROPELLER MRI: application to head motion and free-breathing cardiac imaging. Magn Reson Med [Internet] 1999;42:963–969. doi: 10.1002/(sici)1522-2594(199911)42:5<963::aid-mrm17>3.0.co;2-l. [DOI] [PubMed] [Google Scholar]
- 4.White N, Roddey C, Shankaranarayanan A, Han E, Rettmann D, Santos J, Kuperman J, Dale A. PROMO: Real-time prospective motion correction in MRI using image-based tracking. Magn Reson Med [Internet] 2010;63:91–105. doi: 10.1002/mrm.22176. [DOI] [PMC free article] [PubMed] [Google Scholar]
- 5.Maclaren J, Herbst M, Speck O, Zaitsev M. Prospective motion correction in brain imaging: A review. Magn Reson Med [Internet] 2013;69:621–636. doi: 10.1002/mrm.24314. [DOI] [PubMed] [Google Scholar]
- 6.Lange T, Maclaren J, Buechert M, Zaitsev M. Spectroscopic imaging with prospective motion correction and retrospective phase correction. Magn Reson Med [Internet] 2012;67:1506–1514. doi: 10.1002/mrm.23136. [DOI] [PMC free article] [PubMed] [Google Scholar]
- 7.Maclaren J, Schneider F, Herbst M, Aksoy M, Kopeinigg D, Hennig J, Bammer R, Zaitsev M, Wallrabe U. An adaptive MR-compatible lens. Proceedings 19th Scientific Meeting, International Society for Magnetic Resonance in Medicine; Montreal. 2011; p. 1812. [Google Scholar]
- 8.Herbst M, Maclaren J, Weigel M, Korvink J, Hennig J, Zaitsev M. Prospective motion correction with continuous gradient updates in diffusion weighted imaging. Magn Reson Med [Internet] 2012;67:326–338. doi: 10.1002/mrm.23230. [DOI] [PubMed] [Google Scholar]
- 9.Schulz J, Siegert T, Bazin PL, Maclaren J, Herbst M, Zaitsev M, Turner R. Prospective slice-by-slice motion correction reduces false positive activations in fMRI with task-correlated motion. Neuroimage [Internet] 2014;84:124–132. doi: 10.1016/j.neuroimage.2013.08.006. [DOI] [PubMed] [Google Scholar]
- 10.Todd N, Josephs O, Callaghan MF, Lutti A, Weiskopf N. Prospective motion correction of 3D echo-planar imaging data for functional MRI using optical tracking. Neuroimage [Internet] 2015;113:1–12. doi: 10.1016/j.neuroimage.2015.03.013. [DOI] [PMC free article] [PubMed] [Google Scholar]
- 11.Stucht D, Danishad KA, Schulze P, Godenschweger F, Zaitsev M, Speck O. Highest Resolution In Vivo Human Brain MRI Using Prospective Motion Correction. PLoS One [Internet] 2015;10:e0133921. doi: 10.1371/journal.pone.0133921. [DOI] [PMC free article] [PubMed] [Google Scholar]
- 12.Zaitsev M, Dold C, Sakas G, Hennig J, Speck O. Magnetic resonance imaging of freely moving objects: prospective real-time motion correction using an external optical motion tracking system. Neuroimage [Internet] 2006;31:1038–1050. doi: 10.1016/j.neuroimage.2006.01.039. [DOI] [PubMed] [Google Scholar]
- 13.Speck O, Hennig J, Zaitsev M. Prospective real-time slice-by-slice motion correction for fMRI in freely moving subjects. Magn Reson Mater Phy [Internet] 2006;19:55–61. doi: 10.1007/s10334-006-0027-1. [DOI] [PubMed] [Google Scholar]
- 14.Maclaren J, Armstrong BSR, Barrows RT, et al. Measurement and Correction of Microscopic Head Motion during Magnetic Resonance Imaging of the Brain. PLoS One. 2012:7. doi: 10.1371/journal.pone.0048088. doi: ARTN e48088DOI 10.1371/journal.pone.0048088. [DOI] [PMC free article] [PubMed] [Google Scholar]
- 15.Schulz J, Siegert T, Reimer E, Labadie C, Maclaren J, Herbst M, Zaitsev M, Turner R. An embedded optical tracking system for motion-corrected magnetic resonance imaging at 7T. Magn Reson Mater Phys Biol Med. 2012;25:443–453. doi: 10.1007/S10334-012-0320-0. [DOI] [PubMed] [Google Scholar]
- 16.Aksoy M, Forman C, Straka M, Skare S, Holdsworth S, Hornegger J, Bammer R. Real-time optical motion correction for diffusion tensor imaging. Magn Reson Med [Internet] 2011;66:366–378. doi: 10.1002/mrm.22787. [DOI] [PMC free article] [PubMed] [Google Scholar]
- 17.Qin L, van Gelderen P, Derbyshire JA, Jin F, Lee J, de Zwart JA, Tao Y, Duyn JH. Prospective head-movement correction for high-resolution MRI using an in-bore optical tracking system. Magn Reson Med [Internet] 2009;62:924–934. doi: 10.1002/mrm.22076. [DOI] [PMC free article] [PubMed] [Google Scholar]
- 18.Schulz J, Siegert T, Reimer E, Labadie C, Maclaren J, Herbst M, Zaitsev M, Turner R. An embedded optical tracking system for motion-corrected magnetic resonance imaging at 7T. Magn Reson Mater Physics, Biol Med [Internet] 2012:1–11. doi: 10.1007/s10334-012-0320-0. [DOI] [PubMed] [Google Scholar]
- 19.Zahneisen B, Lovell-Smith C, Herbst M, Zaitsev M, Speck O, Armstrong B, Ernst T. Fast noniterative calibration of an external motion tracking device. Magn Reson Med. 2014;71:1489–1500. doi: 10.1002/mrm.24806. [DOI] [PMC free article] [PubMed] [Google Scholar]
- 20.Zahneisen B, Keating B, Ernst T. Propagation of calibration errors in prospective motion correction using external tracking. Magn Reson Med. 2014;72:381–388. doi: 10.1002/mrm.24943. [DOI] [PMC free article] [PubMed] [Google Scholar]
- 21.Ooi MB, Aksoy M, MacLaren J, Watkins RD, Bammer R. Prospective motion correction using inductively coupled wireless RF coils. Magn Reson Med. 2013;70:639–647. doi: 10.1002/mrm.24845. [DOI] [PMC free article] [PubMed] [Google Scholar]
- 22.Forman C, Aksoy M, Hornegger J, Bammer R. Self-encoded marker for optical prospective head motion correction in MRI. Med Image Comput Comput Assist Interv [Internet] 2010;13:259–266. doi: 10.1007/978-3-642-15705-9_32. [DOI] [PubMed] [Google Scholar]
- 23.Tsai RY, Lenz RK. A New Technique for Fully Autonomous and Efficient 3d Robotics Hand Eye Calibration. Ieee Trans Robot Autom. 1989;5:345–358. doi: 10.1109/70.34770. [DOI] [Google Scholar]
- 24.Maclaren J, Speck O, Stucht D, Schulze P, Hennig J, Zaitsev M. Navigator accuracy requirements for prospective motion correction. Magn Reson Med [Internet] 2010;63:162–170. doi: 10.1002/mrm.22191. [DOI] [PMC free article] [PubMed] [Google Scholar]
- 25.Maclaren J, Lee KJ, Luengviriya C, Speck O, Zaitsev M. Combined prospective and retrospective motion correction to relax navigator requirements. Magn Reson Med [Internet] 2011;65:1724–1732. doi: 10.1002/mrm.22754. [DOI] [PubMed] [Google Scholar]
- 26.Pannetier NA, Stavrinos T, Ng P, Herbst M, Zaitsev M, Young K, Matson G, Schuff N. Quantitative framework for prospective motion correction evaluation. Magn Reson Med. 2016;75:810–816. doi: 10.1002/mrm.25580. [DOI] [PMC free article] [PubMed] [Google Scholar]
- 27.Maclaren J, Aksoy M, Bammer R. Contact-free physiological monitoring using a markerless optical system. Magn Reson Med. 2015;74:571–577. doi: 10.1002/mrm.25781. [DOI] [PMC free article] [PubMed] [Google Scholar]
Associated Data
This section collects any data citations, data availability statements, or supplementary materials included in this article.
Supplementary Materials
Figure S1: Result of a single calibration experiment: (a) plot of raw data collected from optical system (red curves) and wireless markers (blue curves), relative to the first position; (b) extracted poses from both the optical system and wireless markers; the optical data have been transformed to the MRI scanner reference frame using the calculated cross-calibration matrix .


