

Seike et al. show that HSC cellular niches express Ebf3 that is required to create HSC niches, to inhibit their osteoblast differentiation, and to maintain spaces for HSCs.
Keywords: Ebf3, stem cell niche, hematopoietic stem cell, mesenchymal stem cell, bone
Abstract
Bone marrow is the tissue filling the space between bone surfaces. Hematopoietic stem cells (HSCs) are maintained by special microenvironments known as niches within bone marrow cavities. Mesenchymal cells, termed CXC chemokine ligand 12 (CXCL12)-abundant reticular (CAR) cells or leptin receptor-positive (LepR+) cells, are a major cellular component of HSC niches that gives rise to osteoblasts in bone marrow. However, it remains unclear how osteogenesis is prevented in most CAR/LepR+ cells to maintain HSC niches and marrow cavities. Here, using lineage tracing, we found that the transcription factor early B-cell factor 3 (Ebf3) is preferentially expressed in CAR/LepR+ cells and that Ebf3-expressing cells are self-renewing mesenchymal stem cells in adult marrow. When Ebf3 is deleted in CAR/LepR+ cells, HSC niche function is severely impaired, and bone marrow is osteosclerotic with increased bone in aged mice. In mice lacking Ebf1 and Ebf3, CAR/LepR+ cells exhibiting a normal morphology are abundantly present, but their niche function is markedly impaired with depleted HSCs in infant marrow. Subsequently, the mutants become progressively more osteosclerotic, leading to the complete occlusion of marrow cavities in early adulthood. CAR/LepR+ cells differentiate into bone-producing cells with reduced HSC niche factor expression in the absence of Ebf1/Ebf3. Thus, HSC cellular niches express Ebf3 that is required to create HSC niches, to inhibit their osteoblast differentiation, and to maintain spaces for HSCs.
Bone marrow is the tissue filling the space between bone surfaces. Hematopoietic stem cells (HSCs), which give rise to all blood cells, including immune cells, are maintained and regulated by special microenvironments known as niches in the bone marrow cavity (Li and Clevers 2010; Ehninger and Trumpp 2011; Nagasawa et al. 2011; Mercier et al. 2012; Morrison and Scadden 2014; Boulais and Frenette 2015). The identity of HSC niches has been a subject of long-standing debate, and recent studies have identified diverse candidate cells that may constitute a niche for HSCs. Rare cell populations, including osteoblasts lining the bone surface (Calvi et al. 2003; Zhang et al. 2003), periarteriolar nestin+NG2+ mesenchymal stem cells (Méndez-Ferrer et al. 2010; Kunisaki et al. 2013; Itkin et al. 2016; Kusumbe et al. 2016), CD45− lineage marker-negative (Lin−)platelet-derived growth factor receptor α-positive (PDGFRα+)Sca-1+ (PαS) cells (Greenbaum et al. 2013), and nonmyelinating Schwann cells (Yamazaki et al. 2011) as well as macrophages expressing α-smooth muscle actin (α-SMA) (Ludin et al. 2012) and megakaryocytes (Bruns et al. 2014; Zhao et al. 2014; Nakamura-Ishizu et al. 2015) have been reported to create a niche for HSCs. On the other hand, more abundant populations of nonhematopoietic cells, including sinusoidal endothelial cells (Kiel et al. 2005; Butler et al. 2010; Ding et al. 2012; Ding and Morrison 2013) and the adipo–osteogenic progenitors, called CXC chemokine ligand 12 (CXCL12)-abundant reticular (CAR) cells, which strongly overlap with leptin receptor-positive (LepR+) cells (Sugiyama et al. 2006; Omatsu et al. 2010, 2014; Ding et al. 2012; Ding and Morrison 2013), have been shown to create a niche for HSCs. CAR cells express markedly higher levels of CXCL12, stem cell factor (SCF), Lepr, and the transcription factor Foxc1 as compared with other bone marrow cell populations (Sugiyama et al. 2006; Omatsu et al. 2010, 2014; Ding et al. 2012). Additionally, HSCs are significantly more likely to be close to CAR cells rather than placed randomly (Sugiyama et al. 2006; Acar et al. 2015; Shimoto et al. 2017), and the short-term ablation of CAR/LepR+ cells in vivo using a diphtheria toxin receptor-mediated cell knockout technique led to a severe reduction in the numbers of hematopoietic stem and progenitor cells (HSPCs) (Omatsu et al. 2010; Zhou et al. 2014). When SCF was conditionally deleted from CAR/LepR+ cells, the numbers of HSCs were markedly reduced in bone marrow (Ding et al. 2012). These results indicate that CAR/LepR+ cells are a major cellular component of niches for HSPCs.
CAR/LepR+ cells have the capacity to give rise to osteoblasts and adipocytes in vitro and in vivo (Omatsu et al. 2010; Mizoguchi et al. 2014; Zhou et al. 2014). Recent studies have shown that although osteoblasts in infant marrow are derived from Osterix+ cells in the fetal perichondrium (Maes et al. 2010; Mizoguchi et al. 2014; Ono et al. 2014) and skeletal stem/progenitor cells at the growth plate and metaphysis (Chan et al. 2015; Worthley et al. 2015), most osteoblasts as well as adipocytes in adult bone marrow are derived from CAR/LepR+ cells (Zhou et al. 2014). However, the majority of CAR/LepR+ cells might remain undifferentiated in the bone marrow cavity over the individual's lifetime, and it remains unclear how osteogenesis is prevented in most CAR/LepR+ cells to maintain the spaces available for HSCs and hematopoiesis.
In the present study, we found that the transcription factor early B-cell factor 3 (Ebf3) was preferentially expressed in CAR cells and that Ebf3-expressing CAR cells had the capacity to self-renew using lineage tracing strategies. When Ebf3 was deleted in CAR cells, aged marrow cavities were osteosclerotic with markedly increased bone and depleted HSCs. In mice lacking both Ebf1 and Ebf3, CAR cells exhibiting a normal morphology were present, but HSCs were depleted in the infant bone marrow. Subsequently, the mutant mice became progressively more osteosclerotic and reached the complete occlusion of marrow cavities in early adulthood. Thus, Ebf3, which is specifically expressed in HSC cellular niches, inhibits osteoblast differentiation, creates HSC niches, and maintains spaces available for HSCs and hematopoiesis.
Results
The transcription factor Ebf3 is preferentially expressed in CAR cells in bone marrow
To identify new transcriptional regulators of CAR cells, we focused on transcription factors of the Ebf family, which have a unique DNA-binding domain in addition to a dimerization domain with homology with the classical basic helix–loop–helix (bHLH) proteins (Dubois and Vincent 2001), since the Ebf Drosophila counterpart Collier is expressed in candidate cellular niches for blood cells and is essential for hematopoiesis (Crozatier et al. 2004). First, we examined relative mRNA expressions of Ebf family members Ebf1, Ebf2, Ebf3, and Ebf4 in sorted bone marrow nonhematopoietic populations, including CXCL12-green fluorescent protein high (GFPhi) CAR cells and Sca-1+CD31+ endothelial cells as well as hematopoietic cells, alkaline phosphatase high (ALPhi)CXCL12-GFP low (GFPlo) osteoblasts, and PαS cells in newborn and 15-wk-old mice with the GFP reporter gene knocked into the CXCL12 locus (CXCL12-GFP mice) by real-time quantitative RT–PCR (qRT–PCR). Ebf1, which is essential for B-cell development (Lin and Grosschedl 1995), was abundantly expressed in CAR cells and PαS cells as well as B-cell precursors, including c-kit+CD19+IgM− pro-B and c-kit−CD19+IgM− pre-B cells (Fig. 1A). Ebf1 mRNA was present at lower levels in osteoblasts and endothelial cells than in CAR cells. Ebf2, which inhibits the osteoblast-dependent differentiation of osteoclasts and is essential for the maintenance of bone and HSCs (Kieslinger et al. 2005, 2010), was abundantly expressed in both CAR cells and PαS cells (Fig. 1A). Interestingly, Ebf3, which is involved in olfactory receptor neuron projection (Wang et al. 2004), was abundantly expressed in CAR cells but to a much lesser extent in other bone marrow cell populations (Fig. 1A). In contrast to Ebf1, Ebf3 mRNA was absent or present at very low levels in hematopoietic cells (Fig. 1A). The mRNA expression of Ebf4 was absent or very low in bone marrow cell populations, including CAR cells (data not shown). Together, Ebf3 was specifically expressed in CAR cells in bone marrow after birth. Consistent with this, immunohistochemical analysis of 15-wk-old bone marrow with antibodies against Ebf3, the osteoblast marker osteocalcin (Ocn), and the panendothelial marker CD31 revealed that Ebf3 protein was detected in CXCL12-GFPhi CAR cells but not in Ocn+ osteoblasts, CD31+ endothelial cells, Sca-1+CD31− PαS cells, or hematopoietic cells (Fig. 1B–D). During embryogenesis, the expression of Ebf3 in CAR progenitors was comparable with other mesenchymal populations and much lower than in adult CAR cells (data not shown).
Figure 1.

Ebf3 is preferentially expressed in CAR cells in bone marrow. (A) Relative mRNA expression levels of Ebf1, Ebf2, and Ebf3 in CAR cells, osteoblasts (Ob), endothelial cells (EC), PαS cells, Lin−Sca-1+c-kit+ (LSK) cells, pro-B cells, pre-B cells, and F4/80+ macrophages in bone marrow of newborn and 15-wk-old CXCL12-GFP mice. n = 3. All error bars represent SD of the mean. (B–D) Histological analysis showing that Ebf3 protein is detected in CXCL12-GFPhi CAR cells (B,C; white arrows) but not in Ocn+ osteoblasts (B; white arrowheads), morphologically identifiable CD31+ endothelial cells (C,D; yellow arrowheads), or Sca-1+CD31− PαS cells (D; yellow arrows) in the bone marrow cavities of 15-wk-old CXCL12-GFP mice. Bars, 25 µm.
Ebf3-expressing CAR cells represent stem cells with the capacity to self-renew
To characterize Ebf3-expressing CAR cells, we generated knock-in mice expressing the CreERT2 transgene under the control of the endogenous Ebf3 locus, in which Cre recombinase can be transiently activated upon tamoxifen treatment (Ebf3-CreERT2 knock-in mice) (Supplemental Fig. S1A), and then crossed them with CXCL12-GFP mice and Cre-activatable Rosa26 tandem dimer Tomato (tdTomato) reporter mice (Madisen et al. 2010), in which Ebf3-expressing cells can be irreversibly marked, facilitating lineage tracing (Ebf3-CreERT2;Rosa26-tdTomato;CXCL12-GFP mice).
Ebf3-CreERT2;Rosa26-tdTomato;CXCL12-GFP mice were subjected to a tamoxifen pulse for 1 wk beginning at 10 wk of age. Flow cytometric analysis revealed that tdTomato was expressed in virtually all CXCL12-GFPhi CAR cells but not in other bone marrow cell populations, including Sca-1+CD31+ endothelial cells, 2 d after a tamoxifen pulse (Fig. 2A). Consistent with this, qRT–PCR analysis of sorted tdTomato+ cells revealed that CXCL12, SCF, PDGFRβ, Lepr, and Foxc1 were preferentially expressed in CAR cells (Omatsu et al. 2010, 2014) and Ebf3-expressing cells (Supplemental Fig. S1B). Immunohistochemical analysis of femurs with antibodies against CD31 and Ocn showed that virtually all CXCL12-GFPhi CAR cells expressed tdTomato (Fig. 2B), but other types of bone marrow cells, including morphologically identifiable CD31+ endothelial cells and Ocn+ osteoblasts lining the bone surface, did not 2 d after a tamoxifen pulse (Fig. 2C). It was reported previously that nestin-expressing periarteriolar cells create HSC niches and express α-SMA (Kunisaki et al. 2013; Asada et al. 2017). Immunohistochemical analysis with antibodies against α-SMA showed that α-SMA+ periarteriolar cells did not express tdTomato (Fig. 2D). Furthermore, almost all of the colony-forming mesenchymal cells (termed colony-forming unit fibroblasts [CFU-Fs]) in bone marrow expressed tdTomato (99% ± 1.8%) (Fig. 2E). These results indicate that Ebf3-expressing cells overlap strongly with CAR cells in bone marrow.
Figure 2.

Ebf3-expressing CAR cells are self-renewing stem cells. (A–D) Flow cytometric (A) and histological (B-D) analyses of bone marrow from 11-wk-old Ebf3-CreERT2;Rosa26-tdTomato;CXCL12-GFP mice 2 d after a tamoxifen pulse. n = 4. Virtually all tdTomato-expressing cells express CXCL12-GFP. All CXCL12-GFPhi CAR cells express tdTomato (A,B), but Ocn+ osteoblasts (C; arrowheads), morphologically identifiable CD31+ endothelial cells (C), and α-SMA+ cells surrounding a Sca-1+ artery (D) do not express tdTomato. Bars, 25 µm. (E) Frequencies of all CFU-Fs that express tdTomato formed by bone marrow cells from 11-wk-old Ebf3-CreERT2;Rosa26-tdTomato mice 2 d after a tamoxifen pulse. n = 3. (F) BrdU uptake of CAR cells of CXCL12-GFP mice fed BrdU for 10 d to 7 wk. The percentages of BrdU-labeling cells among total CAR cells are shown. n = 3. (G–J) Flow cytometric (G) and histological (H–J) analyses of bone marrow from Ebf3-CreERT2;Rosa26-tdTomato;CXCL12-GFP mice 13 mo after a tamoxifen pulse. n = 3. (G,H) All CXCL12-GFPhi CAR cells express tdTomato. All Ocn+ osteoblasts (I) and perilipin+ adipocytes (J) express tdTomato. Bars, 25 µm. (A,G) Gray histograms represent the isotype control antibodies, red histograms represent CXCL12-GFP or antibodies against the indicated antigens, and a green histogram represents tdTomato. All error bars represent SD of the mean.
The turnover of CAR cells was investigated by bromodeoxyuridine (BrdU) pulse-chase experiments in vivo. After BrdU administration, BrdU-positive CAR cells increased steadily over time, and 14% of CAR cells had entered cell cycle and incorporated BrdU by 7 wk (Fig. 2F), consistent with the previous study (Zhou et al. 2014). As Ebf3 is preferentially expressed in CAR cells in the bone marrow, we next examined whether Ebf3-expressing CAR cells have the ability to self-renew and persist in vivo using Ebf3-CreERT2;Rosa26-tdTomato;CXCL12-GFP mice. These mice were subjected to a tamoxifen pulse for 1 wk beginning at 10 wk of age and analyzed 13 mo after induction. Flow cytometric analysis revealed that all CXCL12-GFPhi CAR cells express tdTomato and that tdTomato was not expressed in other bone marrow cell populations, including Sca-1+CD31+ endothelial cells (Fig. 2G). Immunohistochemical analysis with antibodies against the adipocyte marker perilipin and Ocn showed that all CAR cells and perilipin+ adipocytes and most Ocn+ osteoblasts lining the bone surface express tdTomato (Fig. 2H–J). Thus, the result that the relative pool size of Ebf3-expressing CAR cells, which give rise to adipocytes and osteoblasts in the bone marrow cavities, remained stable over the course of 13 mo demonstrates that Ebf3-expressing CAR cells are self-renewing stem cells in the bone marrow.
Aged bone marrow is osteosclerotic with impaired HSC niches in the absence of Ebf3
We next generated conditional gene targeted mice for Ebf3 to analyze the role of Ebf3 in CAR cells because nonconditional Ebf3-deficient mice died shortly after birth with respiratory failure (Wang et al. 2004; Jin et al. 2014). These mice carry loxp sites flanking the third and fourth exons of the Ebf3 gene, which contain the DNA-binding domain (Ebf3f/f) (Supplemental Fig. S2A). We crossed the Ebf3f/f mice with Lepr-Cre knock-in mice (Lepr-Cre mice) or transgenic mice expressing Cre recombinase under the control of Prx1 regulatory elements (Prx1-Cre mice). Lepr-Cre mice express Cre recombinase in CAR cells but not in other bone marrow cell populations in adult mice (Ding et al. 2012; Omatsu et al. 2014). Prx1-Cre mice express Cre recombinase in all mesenchymal cells, including CAR cells, osteoblasts, and PαS cells, in developing limbs and parts of the skull (Logan et al. 2002; Greenbaum et al. 2013; Omatsu et al. 2014). Lepr-Cre;Ebf3f/f and Prx1-Cre;Ebf3f/f mice were born at the expected Mendelian ratio and remained viable. Data from bone marrow of Lepr-Cre;Ebf3f/f mice and Prx1-Cre;Ebf3f/f mice yielded similar results. Histological analysis revealed that the numbers of trabecular bones were slightly increased in the bone marrow of 26-wk-old Lepr-Cre;Ebf3f/f and Prx1-Cre;Ebf3f/f mice compared with control animals (Fig. 3A; Supplemental Fig. S2B). Flow cytometric analysis revealed that the total hematopoietic cell counts and numbers of the CD34−CD150+CD48− subset of Lin−Sca-1+ c-kit+ (LSK) cells, which are highly enriched for long-term repopulating HSCs (LT-HSCs), Lin−Sca-1−c-kit+CD34−FcγRII/IIIlo megakaryocyte/erythrocyte progenitors (MEPs), c-kit+CD71+Ter119lo proerythroblasts, Lin−IL-7Rα+Flt3+ common lymphoid progenitors (CLPs), and Lin−Sca-1− c-kit+CD34+FcγRII/IIIhi granulocyte/macrophage progenitors (GMPs) were reduced, but the numbers of pro-B and pre-B cells were unaltered in the bone marrow of 26-wk-old Lepr-Cre;Ebf3f/f and Prx1-Cre;Ebf3f/f mice compared with control animals (Fig. 3B,C; Supplemental Fig. S2C,D). In addition, the numbers of phenotypic LT-HSCs and proerythroblasts were increased in the spleens of the mutants (Fig. 3D), suggesting that impaired hematopoiesis in the marrow resulted in extramedullary hematopoiesis. qRT–PCR analysis revealed that PDGFRβ+Sca-1−CD31− CD45−Ter119− CAR cells in the mutants had lower levels of CXCL12 and SCF expression than control animals (Fig. 3E). These results suggest that the HSPC niche function of CAR cells was impaired in the absence of Ebf3.
Figure 3.

The bone marrow of aged mice is osteosclerotic with markedly increased bone and impaired HSC niches in the absence of Ebf3. (A–D) Histological analysis (A) and flow cytometric analysis (B–D) of 26-wk-old control and Lepr-Cre;Ebf3f/f mice. (A) von Kossa and toluidine blue staining of femurs. (B) Total hematopoietic cell counts and the numbers of LT-HSCs, MEPs, proerythroblasts (pro-E), CLPs, pro-B cells, pre-B cells, and GMPs. (C) The frequencies of LT-HSCs, MEPs, proerythroblasts, and GMPs in femurs and tibias. (D) The numbers of LT-HSCs and proerythroblasts in the spleen. n = 7–9. (E) Relative mRNA expression levels of CXCL12 and SCF in CAR cells from 26-wk-old control and Lepr-Cre;Ebf3f/f mice. n = 4–7. (F–I,K) Histological analysis of femurs (F,H,I,K) and microcomputed tomography (μCT) analysis of humeri (G) of 90-wk-old control and Lepr-Cre;Ebf3f/f mice. (F) von Kossa and toluidine blue staining. (G) Bone marrow area, bone volume per tissue volume (BV/TV), trabecular number (Tb. N), and trabecular thickness (Tb. Th) were measured by μCT. n = 5. (H) S100+Osterix (Osx)+ CAR cells. (I) ALP activity. (J) Relative mRNA expression levels of CXCL12, SCF, Runx2, Osx, Col1a1, and Ocn in CAR cells from 90-wk-old control and Lepr-Cre;Ebf3f/f mice. n = 3. (K) Tartrate-resistant acid phosphatase-positive (TRAP+) osteoclasts in the metaphysis of control mice and the diaphysis of mutants. Bars: A,F, 1 mm; G, 500 µm; H, 25 µm; I, 100 µm; K, 50 µm. (L,M) Serum C-terminal telopeptides of type I collagen (CTX) (L) and procollagen type I N-terminal propeptide (PINP) (M) in 90-wk-old control and Lepr-Cre;Ebf3f/f mice. n = 5–8. (N–Q) Total hematopoietic cell counts and flow cytometric analysis of the numbers of LT-HSCs, MEPs, proerythroblasts, CLPs, and GMPs (N) and the frequencies of LT-HSCs, MEPs, and GMPs (O) in the bone marrow and the numbers of LT-HSCs and proerythroblasts in the spleens (Q) from 90-wk-old control and Lepr-Cre;Ebf3f/f mice. (P) The numbers of functional HSCs estimated using repopulating units (RUs) in the bone marrow. n = 5–9. All error bars represent SD of the mean. (*) P < 0.05; (**) P < 0.01; (***) P < 0.001.
Surprisingly, histological and microcomputed tomography (μCT) analyses revealed that the trabecular bone mass was gradually increased with age and that the bone marrow was osteosclerotic with markedly increased bone without a cartilaginous structure in the long bones of 90-wk-old Lepr-Cre;Ebf3f/f and Prx1-Cre;Ebf3f/f mice (Fig. 3F,G; Supplemental Fig. S2E). Histological analysis of the residual bone marrow cavities of the mutants revealed that CAR cells exhibiting a normal morphology were identified as S100+ cells (Omatsu et al. 2014) and that the numbers of CAR cells expressing high levels of Osterix protein (Fig. 3H) and ALP activity (Fig. 3I) were markedly increased—although total CAR cell number per femur was unaltered (Supplemental Fig. S3A)—compared with control animals. qRT–PCR analysis revealed that residual PDGFRβ+Sca-1−CD31−CD45−Ter119− CAR cells in the mutants had much higher expression levels of osteoblast markers [including Osterix, α1(I)-collagen (Col1a1), and Ocn] and much lower levels of CXCL12 and SCF expression than control animals (Fig. 3J). The expression of Runx2, which is expressed highly in wild-type CAR cells and osteoblasts (Omatsu et al. 2010), was unaltered in the mutants (Fig. 3J). These results suggest that the majority of aged CAR cells was more differentiated into the osteoblast lineage in the absence of Ebf3. Tartrate-resistant acid phosphatase (TRAP), which is present in osteoclast precursors and differentiated osteoclasts, is a specific marker of osteoclast lineage cells. Histological analysis revealed that the numbers of TRAP+ osteoclasts and Ocn+ osteoblasts lining the surface of increased bone in the bone marrow of 90-wk-old Lepr-Cre;Ebf3f/f and Prx1-Cre;Ebf3f/f mice were comparable with those of trabecular bone in the metaphysis of control mice (Fig. 3K; Supplemental Figs. S2F, S3B). In addition, serum levels of bone resorption marker C-terminal telopeptides of type I collagen (CTX; which reflect the whole-body amount of cleaved type I collagen by osteoclasts) and bone formation marker the procollagen type I N-terminal propeptide (PINP; which reflect the whole-body amount of the N-terminal procollagen type I) were slightly increased (Fig. 3L,M; Supplemental Fig. S2G). These results indicate that occlusion of the marrow cavities in aged Lepr-Cre;Ebf3f/f and Prx1-Cre;Ebf3f/f mice does not result from defects in osteoclasts.
Flow cytometric analysis revealed that the numbers of hematopoietic cells, including phenotypic LT-HSCs, MEPs, proerythroblasts, CLPs, and GMPs, were severely reduced in the bone marrow of 90-wk-old Lepr-Cre;Ebf3f/f and Prx1-Cre;Ebf3f/f mice (Fig. 3N,O; Supplemental Fig. S2H,I). Cell cycle analysis and Annexin-V staining of LT-HSCs revealed that the frequencies of low Pyronin Y (PY) uptake or Ki67-negative quiescent (G0) cells, high PY uptake or Ki67-positive actively dividing (G1 + S/G2/M) cells, and Annexin-V-positive apoptotic cells were unaltered in the mutants (Supplemental Fig. S4). We estimated the numbers of functional HSCs using repopulating units (RUs), based on a competitive repopulation assay, and found that the numbers of RUs were markedly reduced in the marrow of 90-wk-old Lepr-Cre;Ebf3f/f mice (Fig. 3P). In addition, the numbers of phenotypic LT-HSCs and proerythroblasts were increased in the spleen but not in the peripheral blood of the mutants (Fig. 3Q; data not shown), suggesting that a reduction of HSPCs in the marrow resulted in extramedullary hematopoiesis. The decrease in HSPCs was much greater than the decrease in bone marrow area in the mutants (Fig. 3G,N,P). These results, together with the reduced CXCL12 and SCF expressions in CAR cells, indicate that the HSPC niche function of CAR cells was severely impaired in the absence of Ebf3.
CAR cells exhibiting a normal morphology are present, but HSCs are depleted in infant mice lacking both Ebf1 and Ebf3
The facts that Ebf1 and Ebf3 are the most closely related among the four mouse Ebf proteins (Dubois and Vincent 2001) and that Ebf1 was abundantly expressed in CAR cells from 26-wk-old conditional knockout mice for Ebf3 (data not shown) suggest that Ebf1 can partly compensate for the loss of Ebf3 in CAR cells. To address this, we generated mice deficient for both Ebf1 and Ebf3 in all mesenchymal cells (Prx1-Cre;Ebf1f/fEbf3f/f mice) or adult CAR cells (Lepr-Cre;Ebf1f/fEbf3f/f mice). Bone marrow from 18- and 90-wk-old Prx1-Cre;Ebf1f/f mice showed no gross hematopoietic or bone abnormalities (Supplemental Fig. S5A–E), consistent with previous studies of mice deficient for Ebf1 exhibiting a subtle or no skeletal phenotype (Hesslein et al. 2009; Zee et al. 2013). Histological analysis of femurs in newborn and 1-wk-old Prx1-Cre;Ebf1f/fEbf3f/f;CXCL12-GFP mice in which Ebf1 and Ebf3 were inactivated in mesenchymal cells, including CAR cells, revealed that although the trabecular bone mass was somewhat increased, bone marrow cavities were formed (Fig. 4A), and CXCL12-GFP+ CAR cells exhibited a normal morphology with long processes (Fig. 4B,C). The numbers of CXCL12-GFP+ CAR cells were unaltered in newborn mutants (Fig. 4B). However, ALP activity was markedly increased throughout the bone marrow cavities of the mutants, compared with control animals (Fig. 4D). Immunohistochemical analysis with antibodies against Osterix revealed that CAR cells expressing high levels of Osterix protein were almost absent in newborn mutants but markedly increased in 1-wk-old mutants (Fig. 4B,C) and that the numbers of Osterix+ osteoblasts lining the bone surface were unaltered in newborn mutants (Supplemental Fig. S6). qRT–PCR analysis of the newborn mutants revealed that CAR cells had relatively normal expressions of Runx2, Osterix, and Ocn but a higher expression of Col1a1 and much lower expressions of CXCL12, SCF, and C/EBPα than control animals (Fig. 4E). qRT–PCR analysis of the 1-wk-old mutants revealed that CAR cells had much higher expressions of osteoblast markers, including Osterix, Col1a1, and Ocn, and much lower expressions of CXCL12, SCF, and C/EBPα than control animals (Fig. 4F), although the expressions of these genes were unaltered in the mutant PαS mesenchymal progenitors (Supplemental Fig. S7). These results suggest that the majority of CAR cells was more differentiated into the osteoblast lineage in the mutants than wild-type CAR cells at the age of 1 wk.
Figure 4.

Impaired HSC niches in the absence of Ebf1 and Ebf3. (A–D) Histological analysis of femurs of newborn (B) and 1-wk-old (A,C,D) control and Prx1-Cre;Ebf1f/fEbf3f/f;CXCL12-GFP mice. A bone marrow cavity (A) and CXCL12-GFP+ CAR cells (B,C) are shown. (B) Relative numbers of total CXCL12-GFP+ CAR cells in the femur. n = 3. Osx+ CAR cells (B,C) and ALP activity (D) in the bone marrow cavities are shown. Dashed lines indicate the bone marrow–bone boundary. Bars: A, 500 µm; B,C, 10 µm; D, 100 µm. (E,F) Relative mRNA expression levels of CXCL12, SCF, C/EBPα, Runx2, Osx, Col1a1, and Ocn in CAR cells from newborn (E) and 1-wk-old (F) control and Prx1-Cre;Ebf1f/fEbf3f/f;CXCL12-GFP mice. Newborn mice: n = 3; 1-wk-old mice: n = 5. (G,H) Total hematopoietic cell counts and flow cytometric analysis of the numbers of LT-HSCs, MEPs, proerythroblasts (pro-E), CLPs, pro-B cells, pre-B cells, and GMPs in the bone marrow of newborn (G) and 1-wk-old (H) control and Prx1-Cre;Ebf1f/fEbf3f/f mice. Newborn mice: n = 3; 1-wk-old mice: n = 6. All error bars represent SD of the mean. (*) P < 0.05; (**) P < 0.01; (***) P < 0.001.
Flow cytometric analysis of newborn and 1-wk-old Prx1-Cre;Ebf1f/fEbf3f/f mice revealed that the total hematopoietic cell counts and numbers of LT-HSCs, MEPs, proerythroblasts, CLPs, pro-B cells, pre-B cells, and GMPs were markedly reduced in the bone marrow compared with control animals (Fig. 4G,H). These results indicate that the HSPC niche function of CAR cells was markedly impaired in the absence of Ebf1/Ebf3 relative to wild-type CAR cells.
Mice lacking both Ebf1 and Ebf3 showed the complete occlusion of marrow cavities in early adulthood
Histological analysis of femurs in 7- and 26-wk-old Prx1-Cre;Ebf1f/fEbf3f/f mice revealed that the bone marrow spaces were almost filled with bone without a cartilaginous structure and that the growth plate cartilage was normal in the mutants (Fig. 5A; Supplemental Fig. S8). Thus, S100+ CAR cell number per femur was reduced in the mutants, which might be due to enhanced differentiation of CAR cells into osteoblasts (Fig. 5B). The numbers of TRAP+ osteoclasts and Ocn+ osteoblasts lining the surface of increased bone in the mutant bone marrow were comparable with those of trabecular bone in the metaphysis of control mice (Fig. 5C; Supplemental Fig. S9A), and serum CTX and PINP levels were unaltered in the mutants (Fig. 5D; Supplemental Fig. S9B), indicating that the occlusion of marrow cavities in Prx1-Cre;Ebf1f/fEbf3f/f mice does not result from defects in osteoclasts. Consistent with the histologic features, the numbers of hematopoietic cells were severely reduced in the bone marrow of 7- and 26-wk-old Prx1-Cre;Ebf1f/fEbf3f/f mice (Fig. 5E). Adult Lepr-Cre;Ebf1f/fEbf3f/f mice showed phenotypes similar to those of Prx1-Cre;Ebf1f/fEbf3f/f mice (Fig. 5F). We subsequently analyzed the bone marrow of Col2.3-Cre;Ebf1f/f Ebf3f/f mice in which Ebf1 and Ebf3 were inactivated in osteoblasts (Ding et al. 2012). Analysis by μCT revealed that the bone marrow from Col2.3-Cre targeted mice did not have any gross bone abnormalities, although the bone marrow was almost filled with bone in Prx1-Cre targeted mice at the age of 3 wk (Fig. 5G), suggesting that Ebf1/Ebf3 do not play a major role in osteoblasts.
Figure 5.

An age-associated progression of occlusion of the marrow cavities in the absence of Ebf1 and Ebf3. (A–C) Histological analysis of femurs of 7-wk-old control and Prx1-Cre;Ebf1f/fEbf3f/f mice. (A) von Kossa and toluidine blue staining. (B) Relative numbers of total S100+ CAR cells in the femur. n = 4. (C) TRAP+ osteoclasts in the metaphysis of control mice and the diaphysis of mutants. Bars: A, 1 mm; C, 50 µm. (D) Serum CTX in 7-wk-old control and Prx1-Cre;Ebf1f/fEbf3f/f mice. n = 4. (E) Total hematopoietic cell counts in the bone marrow of 7- and 26-wk-old control and Prx1-Cre;Ebf1f/fEbf3f/f mice. n = 4. (F) Analysis of humeri of 34-wk-old control and Lepr-Cre;Ebf1f/fEbf3f/f mice by μCT. Bar, 1 mm. (G) Analysis of humeri of 3-wk-old control, Col2.3-Cre;Ebf1f/fEbf3f/f, and Prx1-Cre;Ebf1f/f Ebf3f/f mice by μCT. Bar, 250 µm. All error bars represent SD of the mean. (***) P < 0.001.
The greater contribution of Ebf3 to marrow niche and cavity maintenance compared with Ebf1
The result that the bone marrow was almost filled with bone with depleted HSCs in aged Prx1-Cre;Ebf3f/f mice but was largely unaltered in aged Prx1-Cre;Ebf1f/f mice suggests that the contribution of Ebf3 to marrow cavity and HSC maintenance is greater than that of Ebf1. To confirm this, we compared the skeletal and hematopoietic phenotypes of adult Ebf1 knockout Ebf3 heterozygous (Ebf1-KO-Ebf3-Het) and Ebf1 heterozygous Ebf3 knockout (Ebf1-Het-Ebf3-KO) mice. Histological analysis of femurs revealed that the trabecular bone mass was markedly increased without a cartilaginous structure in Lepr-Cre;Ebf1f/+Ebf3f/f (Ebf1-Het-Ebf3-KO) mice but not in Lepr-Cre;Ebf1f/fEbf3f/+ (Ebf1-KO-Ebf3-Het) mice at the age of 34 wk (Fig. 6A). In addition, Ocn+ osteoblast number per surface of increased bone in the marrow was increased in Ebf1-Het-Ebf3-KO mice compared with that of trabecular bone in the metaphysis of Ebf1-KO-Ebf3-Het mice (Fig. 6B). Serum CTX and PINP levels were unaltered in Ebf1-Het-Ebf3-KO mice (Supplemental Fig. S10; data not shown), indicating that occlusion of the marrow cavities in Ebf1-Het-Ebf3-KO mice does not result from defects in osteoclasts. qRT–PCR analysis revealed that CAR cells had much higher expressions of osteoblast markers, including Osterix, Col1a1, and Ocn, and much lower expressions of CXCL12, SCF, and C/EBPα in Ebf1-Het-Ebf3-KO mice than control animals; however, expressions of these genes were largely unaltered in CAR cells from Ebf1-KO-Ebf3-Het mice (Fig. 6C). Runx2 expression was unaltered in CAR cells from both mutants (Fig. 6C). Flow cytometric analysis revealed that the total hematopoietic cell counts and numbers of LT-HSCs, MEPs, proerythroblasts, CLPs, pro-B cells, pre-B cells, and GMPs were markedly reduced in the bone marrow (Fig. 6D) and that the numbers of phenotypic LT-HSCs and proerythroblasts were increased in the spleens of Ebf1-Het-Ebf3-KO mice (Fig. 6E), indicating a severe reduction of HSPCs in the marrow, resulting in extramedullary hematopoiesis. In contrast, Ebf1-KO-Ebf3-Het mice exhibited a subtle or no hematopoietic phenotype (Fig. 6D,E). Therefore, the activity of one functional Ebf3 allele is sufficient for marrow cavity and HSC maintenance, although one Ebf1 allele is not.
Figure 6.
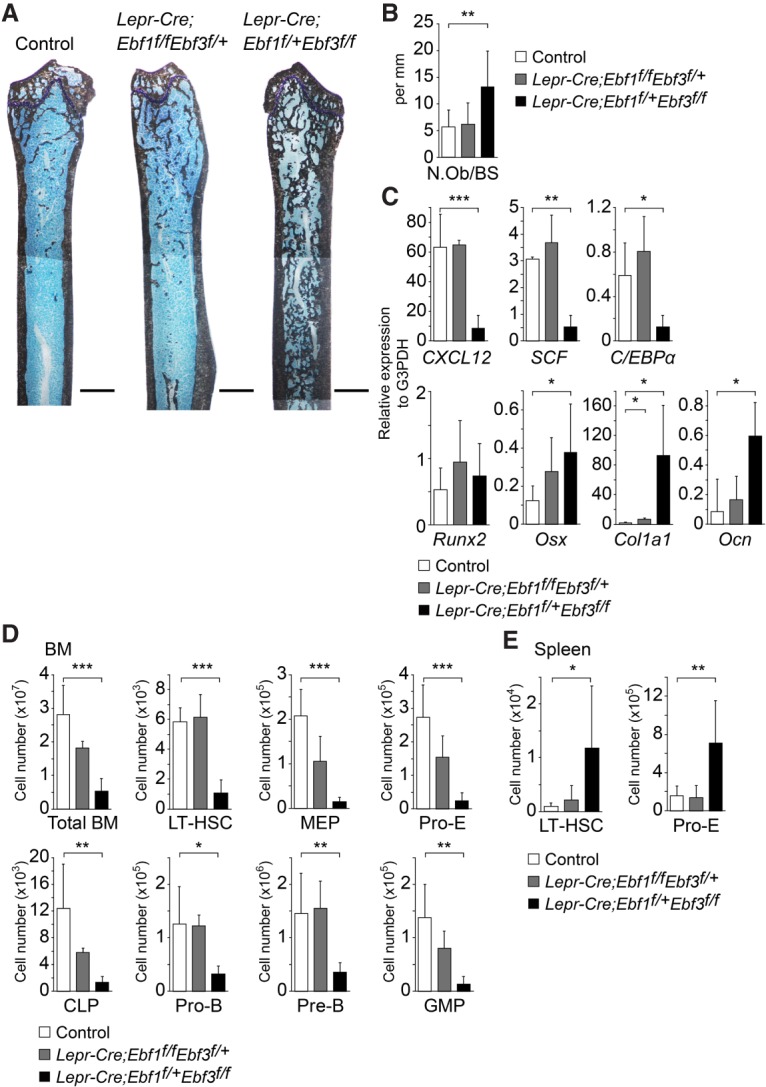
The contribution of Ebf3 to marrow niche and cavity maintenance is greater compared with Ebf1. (A) von Kossa and toluidine blue staining of femurs of 34-wk-old control, Lepr-Cre;Ebf1f/fEbf3f/+, and Lepr-Cre;Ebf1f/+Ebf3f/f mice. Bar, 1 mm. (B) The Ocn+ osteoblast number per bone surface was quantified in sections of the femur. n = 4–6. (C) Relative mRNA expression levels of CXCL12, SCF, C/EBPα, Runx2, Osx, Col1a1, and Ocn in CAR cells from 34-wk-old control, Lepr-Cre;Ebf1f/f Ebf3f/+, and Lepr-Cre;Ebf1f/+Ebf3f/f mice. n = 4. (D,E) Total hematopoietic cell counts and flow cytometric analysis of the numbers of LT-HSCs, MEPs, proerythroblasts (pro-E), CLPs, pro-B cells, pre-B cells, and GMPs in femurs and tibias (D) and the numbers of LT-HSCs and proerythroblasts in the spleens (E) of 34-wk-old control, Lepr-Cre;Ebf1f/fEbf3f/+, and Lepr-Cre;Ebf1f/+Ebf3f/f mice. n = 4–6. All error bars represent SD of the mean. (*) P < 0.05; (**) P < 0.01; (***) P < 0.001.
The enforced expression of Ebf1 or Ebf3 in CAR cells markedly decreased the osteogenic potential
To confirm the in vivo functions of Ebf1 and Ebf3 in CAR cell differentiation into osteoblasts, we infected sorted CAR cells with retroviruses expressing wild-type or truncated Ebf1 or Ebf3. The enforced expression of wild-type Ebf1 or Ebf3 in CAR cells increased mRNA expressions of CXCL12, SCF, and C/EBPα as assessed by qRT–PCR (Fig. 7A) and markedly decreased the osteogenic potential in the culture (Fig. 7B). A deletion of the region of the gene encoding the DNA-binding domain of Ebf1 (Ebf1-ΔDBD) or Ebf3 (Ebf3-ΔDBD) failed to increase expressions of CXCL12, SCF, and C/EBPα in sorted CAR cells (Fig. 7A) and did not decrease their osteogenic potential (Fig. 7B), indicating that Ebf1 or Ebf3 with its DNA-binding domain inhibits osteogenic processes in CAR cells. In addition, the enforced expression of C/EBPα by retroviral infection in sorted CAR cells led to a loss of osteogenic potential in the culture (Fig. 7B).
Figure 7.

Roles of Ebf1 or Ebf3 in CAR cells in vitro. (A,B) Analysis of adult CAR cells transduced with retroviruses expressing wild-type or truncated Ebf1 or Ebf3, C/EBPα, or empty vector. (A) Relative mRNA expression levels of CXCL12, SCF, C/EBPα, Ebf1, and Ebf3 in infected CAR cells cultured for 2 d. All error bars represent SD of the mean. (*) P < 0.05; (**) P < 0.01; (***) P < 0.001. (B) Infected CAR cells were cultured with BMP-2 for 6 d, and ALP activity was assayed by Fast Red staining. ALP activity is visible in the cultures of CAR cells transduced with control or truncated Ebf1 or Ebf3 retroviruses but not in the cultures of CAR cells transduced with wild-type Ebf1, Ebf3, or C/EBPα retroviruses. Bar, 100 µm. (C) Working model. CAR cells are specialized mesenchymal stem cells, which express the specific transcription factors Ebf1/3, inhibiting osteoblast differentiation to remain undifferentiated, maintain marrow cavities, enhance CXCL12 and SCF expression, and create HSC niches.
Discussion
We demonstrated that Ebf3 is preferentially expressed in CAR/LepR+ cells, which are an abundant population of marrow-specific self-renewing skeletal stem cells creating HSPC niches in bone marrow, and that the contribution of Ebf3 to HSPC niche and marrow cavity maintenance is greater than that of Ebf1. CAR/LepR+ cells and osteoblasts are thought to be generated from fetal perichondrial cells and skeletal stem/progenitor cells adjacent to the growth plate inside the developing bone (Chan et al. 2009, 2015; Maes et al. 2010; Liu et al. 2013; Mizoguchi et al. 2014; Ono et al. 2014; Worthley et al. 2015). The results that Ebf3 and Foxc1 are preferentially expressed in CXCL12-GFP+ cells in neonatal bone marrow (Fig. 1A; Omatsu et al. 2014) support the idea that these cells mature into adult CAR/LepR+ cells. Since mice lacking both Ebf1 and Ebf3 had comparable numbers of CAR cells exhibiting a normal morphology at birth and became progressively more osteosclerotic in early adulthood, Ebf1/Ebf3 do not define the CAR cell fate during embryogenesis but rather are required to inhibit the differentiation of CAR cells into the osteoblast lineage to maintain the marrow spaces. In addition, the numbers of HSPCs and expressions of CXCL12 and SCF in CAR cells were markedly decreased in the absence of Ebf1/Ebf3 in vivo, and enforced expression of Ebf1 or Ebf3 enhanced mRNA expression of CXCL12 and SCF in sorted CAR cells in vitro, indicating that Ebf1/Ebf3 are essential for HSPC niche formation, enhancing expressions of HSC maintenance factors—including CXCL12 and SCF, which might support HSC self-renewal and/or retention—in CAR cells. Since marrow spaces were affected in adult Ebf1/Ebf3 mutants but not in 1-wk-old mutants, Ebf1/Ebf3 may have different effects on CAR cells in neonatal and adult bone marrow. Together, a cellular component of HSC niches expresses Ebf1/Ebf3, which not only create microenvironments but also maintain spaces for HSCs and their progeny (Fig. 7C).
In contrast to CAR cells, expressions of osteogenic genes in another population of adipo–osteogenic progenitors, PαS cells, which abundantly express Ebf1 but not Ebf3, remained unaltered in the absence of Ebf1/Ebf3 at the age of 1 wk (Supplemental Fig. S7). In addition, although the bone marrow spaces were almost filled when Ebf1/Ebf3 were conditionally deleted in CAR cells and their progeny using Lepr-Cre mice, which express Cre recombinase in CAR cells but not in osteoblasts (Ding et al. 2012; Omatsu et al. 2014), the bone marrow spaces were unaltered when Ebf1/Ebf3 were conditionally deleted in osteoblasts using Col2.3-Cre transgenic mice. These results support a specific role for Ebf1/Ebf3 in CAR cells but not PαS cells or osteoblasts.
The transcription factor C/EBPα is known to be essential for adipogenesis and granulocyte development. It was shown previously that mice lacking C/EBPα display osteosclerosis (Chen et al. 2013). Since these mutants possessed markedly decreased osteoclasts in bone marrow, Chen et al. (2013) concluded that the osteosclerotic phenotype was due mainly to defective osteoclastogenesis. However, we showed that the enforced expression of Ebf1 or Ebf3 enhanced C/EBPα mRNA expression (Fig. 7A), and the enforced expression of C/EBPα inhibited osteogenic processes (Fig. 7B) in sorted CAR cells. In addition, C/EBPα is preferentially expressed in CAR cells in the bone marrow (Omatsu et al. 2010), and C/EBPα mRNA expression was markedly decreased in CAR cells in the absence of Ebf1/Ebf3 (Fig. 4E,F). These results raise the possibility that C/EBPα induced by Ebf1/Ebf3 in CAR cells inhibits their differentiation into osteoblasts in the bone marrow. The roles of C/EBPα in CAR cells in vivo and of other downstream target genes of Ebf1/Ebf3 that act to inhibit osteoblast differentiation of CAR cells require further investigation.
Most CAR cells remain undifferentiated; however, a small population of CAR cells probably near bone surfaces differentiates into osteoblasts, since most osteoblasts in bone marrow are derived from CAR cells (Fig. 2I; Zhou et al. 2014). In these CAR cells, Ebf1/Ebf3 functions would be inhibited to induce osteoblast differentiation of CAR cells by unidentified extracellular environmental cues, which are abundant near bone surfaces. Future studies are required to address the possibility and identify these factors.
The increased bone mass phenotype present in many other mutant mouse lines is the result of a reduced number or function of osteoclasts. However, it was shown previously that mice lacking Notch signaling in mesenchymal cells showed a markedly increased trabecular bone mass in adolescent marrow. These mice exhibited a prominent wedge-shaped extension of the growth plate cartilage and age-related marrow recovery and resolution of osteosclerosis in adulthood (Hilton et al. 2008), which were distinct from bones lacking Ebf1 and Ebf3. In addition, mice lacking Notch signaling in Osterix-expressing cells, including CAR cells, had relatively normal bone and bone marrow (Tu et al. 2012). These results suggest that Notch signaling functions in fetal perichondrial cells and/or earlier skeletal stem/progenitor cells adjacent to the growth plate but not in CAR cells.
On the other hand, it was shown previously that mice lacking the zinc finger adapter protein Schnurri-3 (Shn3) in mesenchymal cells exhibited adult-onset osteosclerosis with increased bone mass due to augmented osteoblast activity (Jones et al. 2006; Wein et al. 2012). Shn3 has been shown to promote degradation of the transcription factor Runx2, which is responsible for osteoblast development, through recruitment of the E3 ubiquitin ligase WWP1 to Runx2 (Jones et al. 2006). Together with the results showing that Shn3 and Runx2 are abundantly expressed in CAR cells as well as osteoblasts by qRT–PCR (Omatsu et al. 2010; data not shown), the similarities in skeletal phenotypes of Shn3 and Ebf1/Ebf3 mutants raise the question of whether HSC niche-specific Ebf3 inhibits the activity of Runx2 and/or other unidentified substrates of Shn3.
There are four mouse Ebf proteins. Our data demonstrate that Ebf1 and Ebf3 have roles distinct from those of Ebf2 in regulating bone and HSC niche formation because mice lacking Ebf2 displayed osteopenia with normal CXCL12 expression, indicating that Ebf2 is an osteogenic transcription factor (Kieslinger et al. 2005, 2010). Recently, mutations in Ebf3 has been shown to cause neurodevelopmental disorders in humans (Harms et al. 2017). Our study raises the possibility of Ebf3 dysfunction in other human diseases, including blood disorders and metabolic bone diseases.
The transcription factor Foxc1 is preferentially expressed in CAR cells and their progenitors and inhibits adipogenic processes in CAR cells (Omatsu et al. 2014). When Foxc1 was deleted, expressions of CXCL12 and SCF were reduced in CAR cells (Omatsu et al. 2014). Thus, Ebf1/Ebf3 and Foxc1 are preferentially expressed in CAR cells and have reciprocal functions in the differentiation of CAR cells; however, both enhance expressions of HSC maintenance factors, including CXCL12 and SCF.
Clinically, our results raise the possibility that inhibitors of an Ebf3 function increase the bone mass in bone diseases, including age-related osteoporosis, in vivo and that Ebf3 activators can enhance the formation of HSC niches from nonniche cells, including dermal fibroblasts or induced pluripotent stem cell (iPSC)-derived mesenchymal cells, in vitro. This study provides significant advances in our understanding of mesenchymal cells creating HSPC niches and bone and has clinical implications for therapeutic advances to treat diseases.
Materials and methods
Mice
Targeting vectors for making Ebf3-CreERT2, Ebf3f/f, and Ebf1f/f mice were constructed as shown in Supplemental Figures S1, S2, and S5. The FRT-flanked Neo cassette was removed by mating with Flpe mice (Rodríguez et al. 2000). These mice were backcrossed at least seven times onto a C57BL/6 background before analysis. CXCL12-GFP mice have been described previously (Ara et al. 2003). Osterix-GFP (Rodda and McMahon 2006), Prx1-Cre (Logan et al. 2002), Lepr-Cre (DeFalco et al. 2001), and Rosa26-tdTomato (Madisen et al. 2010) mice were obtained from the Jackson Laboratory. Col2.3-Cre (Liu et al. 2004) mice were obtained from the Mutant Mouse Regional Resource Centers. All mice were maintained on a C57BL/6 background. To induce CreERT2-mediated recombination, Ebf3-CreERT2;Rosa26-tdTomato;CXCL12-GFP mice were injected intraperitoneally with 2 mg of tamoxifen (Sigma) four times every other day and analyzed 2 d or 13 mo after the final tamoxifen injection. As a bone resorption marker, serum CTX was measured with the RatLaps ELISA kit (Immunodiagnostic Systems Ltd.) according to the manufacturer's instructions. As a bone formation marker, serum PINP was measured with the rat/mouse PINP EIA kit (Immunodiagnostic Systems Ltd.) according to the manufacturer's instructions. All animal experiments were performed in accordance with approved protocols of the Institutional Animal Care and Use Committees at Osaka University and Kyoto University.
Antibodies
The following monoclonal antibodies were purchased from BioLegend, BD Bioscience, or eBioscience, unless noted otherwise: α-SMA (1A4; Santa Cruz Biotechnology), B220 (RA3-6B2), CD3ε (145-2C11), CD11b (M1/70), CD19 (1D3), CD31 (MEC13.3), CD34 (RAM34), CD45 (30-F11), CD45.1 (A20), CD45.2 (104), CD48 (HM48-1), CD71 (C2), CD150 (TC15-12F12.2), c-Kit (2B8), FcγRII/III (2.4G2), Flt3 (A2F10), F4/80 (BM8), Gr-1 (RB6-8C5), IgM (II/41), IgD (11-26c.2a), IL-7Rα (A7R34), Ki67 (16A8), Sca-1 (E13-161.7), and Ter119 (Ter119). The following polyclonal antibodies were used: Ebf3 (Abcam, ab207705), Osterix (Abcam, ab22552), PDGFRα (R&D, BAF1062), PDGFRβ (R&D, BAF1042), perilipin (Abcam, ab3526), Ocn (Takara Bio, M173), S100 (Abcam, ab868), and TRAP (Abcam, ab185716).
Flow cytometric analysis and cell sorting
Bone marrow cells were isolated by flushing or crushing from femurs, tibias, and humeri. Bone marrow nonhematopoietic cells were isolated by flushing or crushing from femurs, tibias, and humeri and enzymatic digestion with collagenase type I (Sigma). Cells in bone fractions, including osteoblasts and PαS cells, were isolated by mechanical disruption and collagenase digestion of bones as described previously (Omatsu et al. 2010). Putative CAR progenitors were defined as Osterix-GFP+PDGFRβhi cells in embryonic day 16.5 (E16.5) mice, in which GFP reporter gene was placed under transcriptional regulation of the Osterix promoter (Omatsu et al. 2014). CAR cells were isolated as CXCL12-GFPhiSca-1−CD31−CD45−Ter119− cells from CXCL12-GFP mice or PDGFRβ+Sca-1−CD31−CD45−Ter119− cells. Endothelial cells were isolated as CD31+Sca-1+CD45−Ter119− cells. Newborn osteoblasts were isolated as Osterix-GFP+PDGFRβlo/−CD31− CD45−Ter119− cells from Osterix-GFP mice. Fifteen-week-old osteoblasts were isolated as ALPhiCXCL12-GFPloCD31−CD45− Ter119− cells from CXCL12-GFP mice using ELF-97 phosphatase substrate (Invitrogen). For BrdU incorporation assays, CXCL12-GFP mice were injected intraperitoneally with a single dose of 1 mg of BrdU (Roche) per mouse and maintained on 0.8 mg/mL BrdU in the drinking water for 10 d to 7 wk. The frequencies of BrdU+ CAR cells were then analyzed by flow cytometry using the APC BrdU flow kit (BD Biosciences). For cell cycle analysis using PY staining, bone marrow cells stained with surface makers were fixed with 4% paraformaldehyde and then stained with 10 µg/mL Hoechst 33342 (Sigma) and 0.5 µg/mL PY (Sigma). For cell cycle analysis using Ki67 staining, bone marrow cells stained with surface makers were fixed using the Cytofix/Cytoperm kit (BD Biosciences) and then stained with antibodies against Ki67 and 10 µg/mL Hoechst 33342 (Sigma). For the apoptosis assay, Annexin-V-FITC apoptosis detection kit (BD Biosciences) was used according to the manufacturer's instruction. All flow cytometric experiments and cell sorting were performed using a BD FACS Aria (BD Biosystems).
Histology
Bone marrow sections were analyzed by immunofluorescence as described previously (Sugiyama et al. 2006). In brief, bone samples were fixed in 4% paraformaldehyde and equilibrated in 30% sucrose/phosphate-buffered saline (PBS). Fixed samples were embedded in OCT medium (Sakura) and frozen in cooled hexane. Twelve-micrometer sections of undecalcified femoral or tibial bone were generated by Kawamoto's film method (Cryofilm transfer kit, Section-Lab). Sections were stained with von Kossa and toluidine blue. ALP staining was performed using Fast Red. For immunohistochemistry, sections were first blocked with 5% FCS and then stained with antibodies in blocking buffer. For the analysis of osteoblast number per bone surface (N.Ob/BS), femur sections were stained with antibodies against Ocn or Osterix. Osteoblasts were counted as Ocn+ or Osterix+ cells lining the bone surface. Counts of CXCL12-GFP+ or S100+ CAR cells were obtained from femur sections. Confocal microscopy was performed with a LSM 510 META (Carl Zeiss). Image analysis and cell quantification were performed using Zeiss ZEN and Bitplane Imaris software.
CFU-F assay
For CFU-F assays, 2.5 × 10⁵ bone marrow cells were plated into 10-cm dishes in DMEM (Sigma) supplemented with 20% FCS, 10 µM rock inhibitor Y-27632 (Sigma), and 1% penicillin/streptomycin (Nacalai Tesque). The cultures were incubated at 37°C in a humidified atmosphere with 5% O2 and 5% CO2. Colonies (>50 cells) were counted after 10–14 d of culture.
μCT analysis
The attached soft tissue in humeri was removed thoroughly and fixed in 4% paraformaldehyde. μCT scanning was performed using a ScanXmate-RX scanner (Comscantechno). Three-dimensional microstructural image data were reconstructed, and structural indices were calculated using TRI/3D-BON software (RATOC).
qRT–PCR
Relative mRNA expression was analyzed by qRT–PCR analysis performed with a Step One Plus (Applied Biosystems) using Thunderbird SYBR qPCR mix (Toyobo). Total RNA was isolated from sorted cells using Isogen (Nippon Gene) and treated with DNase I (Invitrogen), and cDNA was synthesized using SuperScript VILO (Invitrogen) following the manufacturer's instructions. Values for each gene were normalized to the relative quantity of G3PDH mRNA in each sample. The primers used for qRT–PCR are listed in Supplemental Table S1.
Competitive repopulation assays
Competitive repopulation assays were performed using the CD45.1/CD45.2 congenic system. Unfractionated 1/20 of bone marrow cells (CD45.2) was transplanted into lethally irradiated (8 Gy) recipient mice (CD45.1) with 5 × 10⁵ competitor cells (CD45.1/CD45.2). Myeloid, B, and T cells in peripheral blood of the recipient mice were analyzed by flow cytometry using antibodies against Gr-1, B220, and CD3 for 16 wk after transplantation. High turnover of myeloid cells provided a good measure of HSC activity, and repopulating units were calculated using Harrison's formula as described previously (Harrison et al. 1993).
Retroviral vectors
We generated cDNAs encoding truncated proteins by PCR from full-length mouse cDNA clones: Ebf1 ΔDBD (deletion of Ebf1 amino acids 35–251) and Ebf3 ΔDBD (deletion of Ebf3 amino acids 98–137). Ebf1 wild type, Ebf1 ΔDBD, Ebf3 wild type, Ebf3 ΔDBD, and C/EBPα were cloned into the retroviral vector MSCV-IRES-Kusabira Orange.
Cell cultures and retroviral infections
Bone marrow plugs from CXCL12-GFP mice were cultured in MF start medium (Toyobo) for 1 d. Next, CAR cells were isolated by flow cytometry, plated into 96-well plates at 300 cells per well in MF start medium supplemented with 10 µM Y-27632, and cultured with 5% O2 for 4 d. Retroviral transductions into cultured CAR cells were performed with plat-E cells as producers of viral supernatants as described (Morita et al. 2000). Forty-eight hours after infection, infected (Kusabira Orange+) CAR cells were sorted for qRT–PCR analysis. For osteogenic differentiation, infected (Kusabira Orange+) CAR cells were cultured in α-MEM supplemented with 300 ng/mL BMP-2 (R&D) and 10% FCS for 6 d. Osteoblastic phenotypes were evaluated by the activity of ALP using Fast Red staining.
Statistical analysis
The significance of the difference between groups in the experiments was evaluated by analysis of variance followed by a two-tailed Student's t-test.
Supplementary Material
Acknowledgments
We thank A. Okada for secretarial assistance. This work was supported by grants from the Japan Society for the Promotion of Science KAKENHI (grant nos. 17H05643 and 16H06232), the Uehara Memorial Foundation, and the Princess Takamatsu Cancer Research Fund.
Author contributions: M.S., Y.O., and T.N. designed and performed the experiments, analyzed the data, and prepared the manuscript. T.N. supervised the study. M.S., H.W., and G.K. contributed materials and tools. All authors discussed results and edited the manuscript.
Footnotes
Supplemental material is available for this article.
Article published online ahead of print. Article and publication date are online at http://www.genesdev.org/cgi/doi/10.1101/gad.311068.117.
References
- Acar M, Kocherlakota KS, Murphy MM, Peyer JG, Oguro H, Inra CN, Jaiyeola C, Zhao Z, Luby-Phelps K, Morrison SJ. 2015. Deep imaging of bone marrow shows non-dividing stem cells are mainly perisinusoidal. Nature 526: 126–130. [DOI] [PMC free article] [PubMed] [Google Scholar]
- Ara T, Tokoyoda K, Sugiyama T, Egawa T, Kawabata K, Nagasawa T. 2003. Long-term hematopoietic stem cells require stromal cell-derived factor-1 for colonizing bone marrow during ontogeny. Immunity 19: 257–267. [DOI] [PubMed] [Google Scholar]
- Asada N, Kunisaki Y, Pierce H, Wang Z, Fernandez NF, Birbrair A, Ma'ayan A, Frenette PS. 2017. Differential cytokine contributions of perivascular haematopoietic stem cell niches. Nat Cell Biol 19: 214–223. [DOI] [PMC free article] [PubMed] [Google Scholar]
- Boulais PE, Frenette PS. 2015. Making sense of hematopoietic stem cell niches. Blood 125: 2621–2629. [DOI] [PMC free article] [PubMed] [Google Scholar]
- Bruns I, Lucas D, Pinho S, Ahmed J, Lambert MP, Kunisaki Y, Scheiermann C, Schiff L, Poncz M, Bergman A, et al. 2014. Megakaryocytes regulate hematopoietic stem cell quiescence through CXCL4 secretion. Nat Med 20: 1315–1320. [DOI] [PMC free article] [PubMed] [Google Scholar]
- Butler JM, Nolan DJ, Vertes EL, Varnum-Finney B, Kobayashi H, Hooper AT, Seandel M, Shido K, White IA, Kobayashi M, et al. 2010. Endothelial cells are essential for the self-renewal and repopulation of Notch-dependent hematopoietic stem cells. Cell Stem Cell 6: 251–264. [DOI] [PMC free article] [PubMed] [Google Scholar]
- Calvi LM, Adams GB, Weibrecht KW, Weber JM, Olson DP, Knight MC, Martin RP, Schipani E, Divieti P, Bringhurst FR, et al. 2003. Osteoblastic cells regulate the haematopoietic stem cell niche. Nature 425: 841–846. [DOI] [PubMed] [Google Scholar]
- Chan CKF, Chen CC, Luppen CA, Kim JB, DeBoer AT, Wei K, Helms JA, Kuo CJ, Kraft DL, Weissman IL. 2009. Endochondral ossification is required for haematopoietic stem-cell niche formation. Nature 457: 490–494. [DOI] [PMC free article] [PubMed] [Google Scholar]
- Chan CKF, Seo EY, Chen JY, Lo D, McArdle A, Sinha R, Tevlin R, Seita J, Vincent-Tompkins J, Wearda T, et al. 2015. Identification and specification of the mouse skeletal stem cell. Cell 160: 285–298. [DOI] [PMC free article] [PubMed] [Google Scholar]
- Chen W, Zhu G, Hao L, Wu M, Ci H, Li YP. 2013. C/EBPα regulates osteoclast lineage commitment. Proc Natl Acad Sci 110: 7294–7299. [DOI] [PMC free article] [PubMed] [Google Scholar]
- Crozatier M, Ubeda JM, Vincent A, Meister M. 2004. Cellular immune response to parasitization in Drosophila requires the EBF orthologue collier. PLoS Biol 2: e196. [DOI] [PMC free article] [PubMed] [Google Scholar]
- DeFalco J, Tomishima M, Liu H, Zhao C, Cai X, Marth JD, Enquist L, Friedman JM. 2001. Virus-assisted mapping of neural inputs to a feeding center in the hypothalamus. Science 291: 2608–2613. [DOI] [PubMed] [Google Scholar]
- Ding L, Morrison SJ. 2013. Haematopoietic stem cells and early lymphoid progenitors occupy distinct bone marrow niches. Nature 495: 231–235. [DOI] [PMC free article] [PubMed] [Google Scholar]
- Ding L, Saunders TL, Enikolopov G, Morrison SJ. 2012. Endothelial and perivascular cells maintain haematopoietic stem cells. Nature 481: 457–462. [DOI] [PMC free article] [PubMed] [Google Scholar]
- Dubois L, Vincent A. 2001. The COE—Collier/Olf1/EBF—transcription factors: structural conservation and diversity of developmental functions. Mech Dev 108: 3–12. [DOI] [PubMed] [Google Scholar]
- Ehninger A, Trumpp A. 2011. The bone marrow stem cell niche grows up: mesenchymal stem cells and macrophages move in. J Exp Med 208: 421–428. [DOI] [PMC free article] [PubMed] [Google Scholar]
- Greenbaum A, Hsu YM, Day RB, Schuettpelz LG, Christopher MJ, Borgerding JN, Nagasawa T, Link DC. 2013. CXCL12 in early mesenchymal progenitors is required for haematopoietic stem-cell maintenance. Nature 495: 227–230. [DOI] [PMC free article] [PubMed] [Google Scholar]
- Harms FL, Girisha KM, Hardigan AA, Kortüm F, Shukla A, Alawi M, Dalal A, Brady L, Tarnopolsky M, Bird LM, et al. 2017. Mutations in EBF3 disturb transcriptional profiles and cause intellectual disability, ataxia, and facial dysmorphism. Am J Hum Genet 100: 117–127. [DOI] [PMC free article] [PubMed] [Google Scholar]
- Harrison DE, Jordan CT, Zhong RK, Astle CM. 1993. Primitive hemopoietic stem cells: direct assay of most productive populations by competitive repopulation with simple binomial, correlation and covariance calculations. Exp Hematol 21: 206–219. [PubMed] [Google Scholar]
- Hesslein DGT, Fretz JA, Xi Y, Nelson T, Zhou S, Lorenzo JA, Schatz DG, Horowitz MC. 2009. Ebf1-dependent control of the osteoblast and adipocyte lineages. Bone 44: 537–546. [DOI] [PMC free article] [PubMed] [Google Scholar]
- Hilton MJ, Tu X, Wu X, Bai S, Zhao H, Kobayashi T, Kronenberg HM, Teitelbaum SL, Ross FP, Kopan R, et al. 2008. Notch signaling maintains bone marrow mesenchymal progenitors by suppressing osteoblast differentiation. Nat Med 14: 306–314. [DOI] [PMC free article] [PubMed] [Google Scholar]
- Itkin T, Gur-Cohen S, Spencer JA, Schajnovitz A, Ramasamy SK, Kusumbe AP, Ledergor G, Jung Y, Milo I, Poulos MG, et al. 2016. Distinct bone marrow blood vessels differentially regulate haematopoiesis. Nature 532: 323–328. [DOI] [PMC free article] [PubMed] [Google Scholar]
- Jin S, Kim J, Willert T, Klein-Rodewald T, Garcia-Dominguez M, Mosqueira M, Fink R, Esposito I, Hofbauer LC, Charnay P, et al. 2014. Ebf factors and MyoD cooperate to regulate muscle relaxation via Atp2a1. Nat Commun 5: 3793. [DOI] [PubMed] [Google Scholar]
- Jones DC, Wein MN, Oukka M, Hofstaetter JG, Glimcher MJ, Glimcher LH. 2006. Regulation of adult bone mass by the zinc finger adapter protein Schnurri-3. Science 312: 1223–1227. [DOI] [PubMed] [Google Scholar]
- Kiel MJ, Yilmaz OH, Iwashita T, Yilmaz OH, Terhorst C, Morrison SJ. 2005. SLAM family receptors distinguish hematopoietic stem and progenitor cells and reveal endothelial niches for stem cells. Cell 121: 1109–1121. [DOI] [PubMed] [Google Scholar]
- Kieslinger M, Folberth S, Dobreva G, Dorn T, Croci L, Erben R, Consalez GG, Grosschedl R. 2005. EBF2 regulates osteoblast-dependent differentiation of osteoclasts. Dev Cell 9: 757–767. [DOI] [PubMed] [Google Scholar]
- Kieslinger M, Hiechinger S, Dobreva G, Consalez GG, Grosschedl R. 2010. Early B cell factor 2 regulates hematopoietic stem cell homeostasis in a cell-nonautonomous manner. Cell Stem Cell 7: 496–507. [DOI] [PubMed] [Google Scholar]
- Kunisaki Y, Bruns I, Scheiermann C, Ahmed J, Pinho S, Zhang D, Mizoguchi T, Wei Q, Lucas D, Ito K, et al. 2013. Arteriolar niches maintain haematopoietic stem cell quiescence. Nature 502: 637–643. [DOI] [PMC free article] [PubMed] [Google Scholar]
- Kusumbe AP, Ramasamy SK, Itkin T, Mäe MA, Langen UH, Betsholtz C, Lapidot T, Adams RH. 2016. Age-dependent modulation of vascular niches for haematopoietic stem cells. Nature 532: 380–384. [DOI] [PMC free article] [PubMed] [Google Scholar]
- Li L, Clevers H. 2010. Coexistence of quiescent and active adult stem cells in mammals. Science 327: 542–545. [DOI] [PMC free article] [PubMed] [Google Scholar]
- Lin H, Grosschedl R. 1995. Failure of B-cell differentiation in mice lacking the transcription factor EBF. Nature 376: 263–267. [DOI] [PubMed] [Google Scholar]
- Liu F, Woitge HW, Braut A, Kronenberg MS, Lichtler AC, Mina M, Kream BE. 2004. Expression and activity of osteoblast-targeted Cre recombinase transgenes in murine skeletal tissues. Int J Dev Biol 48: 645–653. [DOI] [PubMed] [Google Scholar]
- Liu Y, Strecker S, Wang L, Kronenberg MS, Wang W, Rowe DW, Maye P. 2013. Osterix-Cre labeled progenitor cells contribute to the formation and maintenance of the bone marrow stroma. PLoS One 8: e71318. [DOI] [PMC free article] [PubMed] [Google Scholar]
- Logan M, Martin JF, Nagy A, Lobe C, Olson EN, Tabin CJ. 2002. Expression of Cre Recombinase in the developing mouse limb bud driven by a Prxl enhancer. Genesis 33: 77–80. [DOI] [PubMed] [Google Scholar]
- Ludin A, Itkin T, Gur-Cohen S, Mildner A, Shezen E, Golan K, Kollet O, Kalinkovich A, Porat Z, D'Uva G, et al. 2012. Monocytes-macrophages that express α-smooth muscle actin preserve primitive hematopoietic cells in the bone marrow. Nat Immunol 13: 1072–1082. [DOI] [PubMed] [Google Scholar]
- Madisen L, Zwingman TA, Sunkin SM, Oh SW, Zariwala HA, Gu H, Ng LL, Palmiter RD, Hawrylycz MJ, Jones AR, et al. 2010. A robust and high-throughput Cre reporting and characterization system for the whole mouse brain. Nat Neurosci 13: 133–140. [DOI] [PMC free article] [PubMed] [Google Scholar]
- Maes C, Kobayashi T, Selig MK, Torrekens S, Roth SI, Mackem S, Carmeliet G, Kronenberg HM. 2010. Osteoblast precursors, but not mature osteoblasts, move into developing and fractured bones along with invading blood vessels. Dev Cell 19: 329–344. [DOI] [PMC free article] [PubMed] [Google Scholar]
- Méndez-Ferrer S, Michurina TV, Ferraro F, Mazloom AR, Macarthur BD, Lira SA, Scadden DT, Ma'ayan A, Enikolopov GN, Frenette PS. 2010. Mesenchymal and haematopoietic stem cells form a unique bone marrow niche. Nature 466: 829–834. [DOI] [PMC free article] [PubMed] [Google Scholar]
- Mercier FE, Ragu C, Scadden DT. 2012. The bone marrow at the crossroads of blood and immunity. Nat Rev Immunol 12: 49–60. [DOI] [PMC free article] [PubMed] [Google Scholar]
- Mizoguchi T, Pinho S, Ahmed J, Kunisaki Y, Hanoun M, Mendelson A, Ono N, Kronenberg HM, Frenette PS. 2014. Osterix marks distinct waves of primitive and definitive stromal progenitors during bone marrow development. Dev Cell 29: 340–349. [DOI] [PMC free article] [PubMed] [Google Scholar]
- Morita S, Kojima T, Kitamura T. 2000. Plat-E: an efficient and stable system for transient packaging of retroviruses. Gene Ther 7: 1063–1066. [DOI] [PubMed] [Google Scholar]
- Morrison SJ, Scadden DT. 2014. The bone marrow niche for haematopoietic stem cells. Nature 505: 327–334. [DOI] [PMC free article] [PubMed] [Google Scholar]
- Nagasawa T, Omatsu Y, Sugiyama T. 2011. Control of hematopoietic stem cells by the bone marrow stromal niche: the role of reticular cells. Trends Immunol 32: 315–320. [DOI] [PubMed] [Google Scholar]
- Nakamura-Ishizu A, Takubo K, Kobayashi H, Suzuki-Inoue K, Suda T. 2015. CLEC-2 in megakaryocytes is critical for maintenance of hematopoietic stem cells in the bone marrow. J Exp Med 212: 2133–2146. [DOI] [PMC free article] [PubMed] [Google Scholar]
- Omatsu Y, Sugiyama T, Kohara H, Kondoh G, Fujii N, Kohno K, Nagasawa T. 2010. The essential functions of adipo-osteogenic progenitors as the hematopoietic stem and progenitor cell niche. Immunity 33: 387–399. [DOI] [PubMed] [Google Scholar]
- Omatsu Y, Seike M, Sugiyama T, Kume T, Nagasawa T. 2014. Foxc1 is a critical regulator of haematopoietic stem/progenitor cell niche formation. Nature 508: 536–540. [DOI] [PubMed] [Google Scholar]
- Ono N, Ono W, Nagasawa T, Kronenberg HM. 2014. A subset of chondrogenic cells provides early mesenchymal progenitors in growing bones. Nat Cell Biol 16: 1157–1167. [DOI] [PMC free article] [PubMed] [Google Scholar]
- Rodda SJ, McMahon AP. 2006. Distinct roles for Hedgehog and canonical Wnt signaling in specification, differentiation and maintenance of osteoblast progenitors. Development 133: 3231–3244. [DOI] [PubMed] [Google Scholar]
- Rodríguez CI, Buchholz F, Galloway J, Sequerra R, Kasper J, Ayala R, Stewart AF, Dymecki SM. 2000. High-efficiency deleter mice show that FLPe is an alternative to Cre-loxP. Nat Genet 25: 139–140. [DOI] [PubMed] [Google Scholar]
- Shimoto M, Sugiyama T, Nagasawa T. 2017. Numerous niches for hematopoietic stem cells remain empty during homeostasis. Blood 129: 2124–2131. [DOI] [PubMed] [Google Scholar]
- Sugiyama T, Kohara H, Noda M, Nagasawa T. 2006. Maintenance of the hematopoietic stem cell pool by CXCL12-CXCR4 chemokine signaling in bone marrow stromal cell niches. Immunity 25: 977–988. [DOI] [PubMed] [Google Scholar]
- Tu X, Chen J, Lim J, Karner CM, Lee SY, Heisig J, Wiese C, Surendran K, Kopan R, Gessler M, et al. 2012. Physiological notch signaling maintains bone homeostasis via RBPjk and hey upstream of NFATc1. PLoS Genet 8: e1002577. [DOI] [PMC free article] [PubMed] [Google Scholar]
- Wang SS, Lewcock JW, Feinstein P, Mombaerts P, Reed RR. 2004. Genetic disruptions of O/E2 and O/E3 genes reveal involvement in olfactory receptor neuron projection. Development 131: 1377–1388. [DOI] [PubMed] [Google Scholar]
- Wein MN, Jones DC, Shim JH, Aliprantis AO, Sulyanto R, Lazarevic V, Poliachik SL, Gross TS, Glimcher LH. 2012. Control of bone resorption in mice by Schnurri-3. Proc Natl Acad Sci 109: 8173–8178. [DOI] [PMC free article] [PubMed] [Google Scholar]
- Worthley DL, Churchill M, Compton JT, Tailor Y, Rao M, Si Y, Levin D, Schwartz MG, Uygur A, Hayakawa Y, et al. 2015. Gremlin 1 identifies a skeletal stem cell with bone, cartilage, and reticular stromal potential. Cell 160: 269–284. [DOI] [PMC free article] [PubMed] [Google Scholar]
- Yamazaki S, Ema H, Karlsson G, Yamaguchi T, Miyoshi H, Shioda S, Taketo MM, Karlsson S, Iwama A, Nakauchi H. 2011. Nonmyelinating Schwann cells maintain hematopoietic stem cell hibernation in the bone marrow niche. Cell 147: 1146–1158. [DOI] [PubMed] [Google Scholar]
- Zee T, Boller S, Györy I, Makinistoglu MP, Tuckermann JP, Grosschedl R, Karsenty G. 2013. The transcription factor early B-cell factor 1 regulates bone formation in an osteoblast-nonautonomous manner. FEBS Lett 587: 711–716. [DOI] [PMC free article] [PubMed] [Google Scholar]
- Zhang J, Niu C, Ye L, Huang H, He X, Tong WG, Ross J, Haug J, Johnson T, Feng JQ, et al. 2003. Identification of the haematopoietic stem cell niche and control of the niche size. Nature 425: 836–841. [DOI] [PubMed] [Google Scholar]
- Zhao M, Perry JM, Marshall H, Venkatraman A, Qian P, He XC, Ahamed J, Li L. 2014. Megakaryocytes maintain homeostatic quiescence and promote post-injury regeneration of hematopoietic stem cells. Nat Med 20: 1321–1326. [DOI] [PubMed] [Google Scholar]
- Zhou BO, Yue R, Murphy MM, Peyer JG, Morrison SJ. 2014. Leptin-receptor-expressing mesenchymal stromal cells represent the main source of bone formed by adult bone marrow. Cell Stem Cell 15: 154–168. [DOI] [PMC free article] [PubMed] [Google Scholar]
Associated Data
This section collects any data citations, data availability statements, or supplementary materials included in this article.