Abstract
Improving lateral resolution for cross-sectional optical coherence tomography (OCT) imaging is difficult due to the rapid divergence of light once it is focused to a small spot. To overcome this obstacle, we introduce a fiber optics system that generates a coaxially focused multimode (CAFM) beam for depth of focus (DOF) extension. We fabricated a CAFM beam OCT probe and show that the DOF is more than fivefold that of a conventional Gaussian beam, enabling cross-sectional imaging of biological tissues with clearly resolved cellular and subcellular structures over more than a 400 μm depth range. The compact and straightforward design and high-resolution extended DOF imaging capabilities of this technique suggests that it will be very useful for endoscopic cross-sectional imaging of human internal organs in vivo.
1. INTRODUCTION
Optical coherence tomography (OCT) [1] has been a successful story in the field of biophotonics, owing to its capacity to obtain cross-sectional 10 μm resolution images of human tissues. One major advantage of OCT that has accelerated its adoption for many clinical applications is that it can be implemented using a simple, small-diameter, flexible probe that scans a focused beam along an organ inside the body. Application of OCT for in vivo pathology, however, has been hampered by the inability to improve the lateral resolution of these probes so that they are capable of distinguishing finer tissue structures. While beams can be readily focused to small spots using lenses with high numerical apertures, the divergence of tightly focused light prevents cross-sectional imaging at high resolution and over large depths. As such, there has been great interest in developing methods for significantly extending the depth of focus (DOF) of OCT probes without compromising size, simplicity, and image quality.
Various techniques have been proposed for DOF extension of microscopic imaging systems, which we divide into two broad categories: “active” and “passive”. Active methods use a conventionally diffracting beam to acquire one or more images, and then correct the out-of-focus data to reconstruct an in-focus image according to wave propagation theory [2–4]. These techniques are relatively complex to implement as millimeter-diameter endoscopic probes, and usually require intensive computation for image postprocessing, and can be challenged by acquisition stability [5,6]. Passive approaches introduce a nondiffracting (e.g., Bessel) beam (beam with a tight concentration of energy over an extended axial focal region) [7,8] to directly acquire an extended DOF image [9,10]. Such passive methods require unconventional optical elements (e.g., axicon) that are difficult to reliably manufacture [11] or phase/ amplitude modification of the imaging system’s pupil [12], similarly suffering from complexity, and challenging the alignment and fabrication [13]. Recently, we observed nearly an order of magnitude DOF extension [resolution characterized in terms of full width-at half-maximum (FWHM) of the point spread function (PSF)] in a scattering phantom image using a very simple optical system comprising a cylindrical waveguide in front of a lens that retains the small size and simplicity of conventional endoscopic OCT imaging probes [14]. This self-imaging wavefront division optical system generates a coaxially focused multimode (CAFM) beam to acquire a cross-sectional image. In this paper, we formulate the propagation properties of the CAFM beam as a generic solution for DOF extension of a point-scanning microscopic system. By comparison with conventional optical systems of similar numerical aperture (NA), we demonstrate the capability of the CAFM beam to acquire excellent quality high resolution OCT images of biological tissue with a significantly extended DOF and an improved penetration depth.
2. MATERIALS AND METHODS
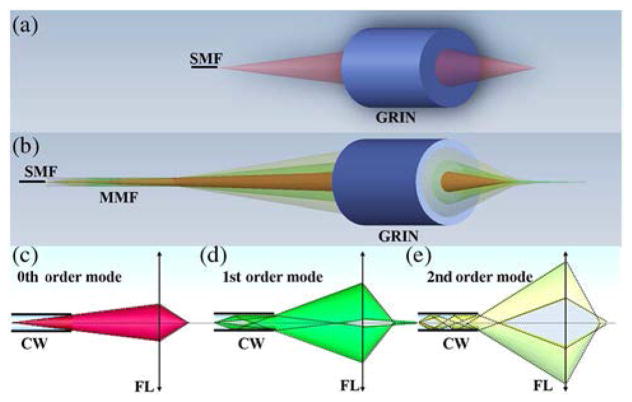
A conventional fiber-based point-scanning optical system for coherent imaging consists of a single-mode fiber that transmits light and a lens that focuses the light onto a sample [Fig. 1(a)]. For simplicity’s sake, for the optical configuration depicted in Fig. 1(a), we assume that the fiber propagates the fundamental transverse Gaussian mode with a resultant Gaussian beam focused on the sample. In the self-imaging wavefront division optical system shown in Fig. 1(b), light from the fiber is transmitted through a cylindrical waveguide (e.g., multimode optical fiber) before it propagates through the lens. The cylindrical waveguide generates multiple propagation modes with orders m corresponding to the number of reflections at the core-cladding interface [Figs. 1(c)–1(e)]; each high-order mode can be considered as being emitted by a ring-shaped mirror image created by a discrete range of angular k-vectors [Eq. (S1) in Supplement 1] from the field emitted from the fiber’s core [15]. According to Eq. (S8) in Supplement 1, in addition to a 0th-order Gaussian beam field (m = 0), multiple coaxially focused pseudo-Bessel [16] fields are also generated by the self-imaging wavefront division optical system. Hereafter, we term the summation of pseudo-Bessel fields a pseudo-Bessel focusing region, and the summation of the Gaussian and pseudo-Bessel focusing regions generated by the optical configuration of Fig. 1(b) a CAFM beam.
Fig. 1.
(a) Schematic of a conventional fiber-based point-scanning optical system, demonstrating a single spatial mode and focus. (b) The schematic of a self-imaging wavefront division optical system, showing multiple spatial modes focused at different distances from the lens. (c) The marginal ray tracing for the 0th-order mode of the CAFM beam. (d) The marginal ray tracing for the 1st-order mode of the CAFM beam. (e) The marginal ray tracing for the 2nd-order mode of the CAFM beam. SMF, single-mode fiber; MMF, Multimode fiber; GRIN, graded index lens; CW, circular waveguide; FL, focusing lens.
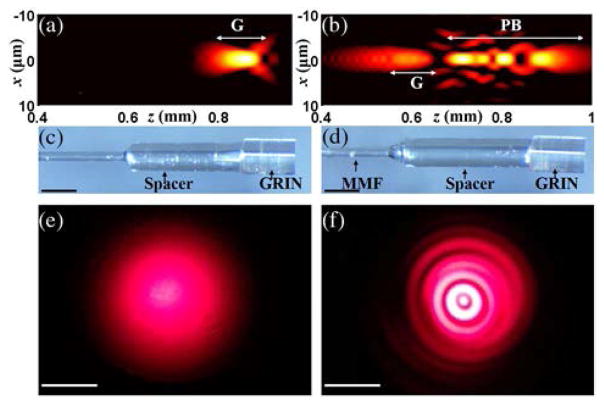
To understand the axial and lateral field distributions of the Gaussian and CAFM beams in the sample space, conventional [Fig. 1(a)] and self-imaging wavefront division [Fig. 1(b)] fiber optic probes were simulated by the beam propagation method (BPM) [17,18]. Simulations showed that the conventional fiber optic probe [Fig. 2(a)] should generate a focused Gaussian beam with a FWHM of about 2.5 μm in tissue spanning a depth range of 100 μm (a 3 dB on-axis intensity roll-off range of 50 μm). In comparison, the self-imaging wavefront division fiber optic probe [Fig. 2(b)] generates 4 propagation modes: the 0th-order mode provides a Gaussian focusing region like that of the conventional fiber optic probe, and higher-order modes generate a pseudo-Bessel focusing region that is comprised of multiple coaxially focused pseudo-Bessel fields with a finest FWHM of about 1.6 μm. The sum of all focused modes for the CAFM beam creates a focused beam field that spans approximately 450 μm (a 3 dB on-axis intensity roll-off range of 200 μm). The simulation suggests that the CAFM beam with a better average lateral resolution also maintains an in-focus beam profile over a depth range that is 4–5 times that of a conventional Gaussian beam. Small diameter optical probes corresponding to the simulations were then fabricated [Figs. 2(c) and 2(d)]. The far-field output beam profiles in the transverse plane for the two probes are shown in Figs. 2(e) and 2(f), demonstrating the Gaussian beam profile for the conventional fiber optic probe [Fig. 2(e)] and the ringed pattern for the self-imaging wavefront division fiber optic probe [Fig. 2(f)]. The conventional fiber optic probe consisted of a single-mode fiber (630 HP, Nufern, Connecticut, USA), a spacer of a length of 1.5 mm, and a 500 μm diameter graded-index (GRIN) lens (GT-LFRL-050, GRINTECH GmbH, Germany) with an NA of approximately 0.5. The self-imaging wavefront division fiber optic probe was comprised of a single-mode fiber, a segment of multimode fiber (FG050UGA, Thorlabs Inc., New Jersey, USA) of a length of 1.2 mm, a spacer of a length of 1.7 mm, and a GRIN lens with a similar NA to that of the GRIN lens used in the conventional fiber optic probe. The multimode fiber was directly spliced to the single-mode fiber using a laser fusion splicer (LZM-100, AFL, South Carolina, USA). A common-path interferometry configuration was realized for both probes by using the backreflection from the distal surface of the GRIN lens as reference light. The single-pass transmission loss for the two fiber optic probes was 1–1.5 dB, and the backreflection including the reference signal was −31 dB.
Fig. 2.
(a) Simulated, depth-dependent field intensity distribution of the Gaussian beam in a tissue medium (an aqueous environment, n = 1.34). The intensity was normalized by the peak intensity, and displayed in a log scale with a dynamic range of 15 dB. (b) The simulated, depth-dependent field intensity distribution of the CAFM beam in a tissue medium (an aqueous environment, n = 1.34). The intensity was normalized by the peak intensity, and displayed in a log scale with a dynamic range of 15 dB. (c) The conventional fiber optic probe. (d) The self-imaging wavefront division fiber optic probe. MMF, multimode fiber. (e) The transverse beam profile of the Gaussian beam with the probe ~5 cm from the surface. (f) The transverse beam profile of the CAFM beam with the probe ~5 cm from the surface, showing multiple rings corresponding to each spatial mode induced by the MMF wave-guide. The beam patterns were projected onto a screen and the images were acquired by a camera in the far field. x and z in (a) and (b) represent the lateral distance and depth, respectively; G and PB in (a) and (b) indicate the Gaussian focusing region and the pseudo-Bessel focusing region, respectively; the scale bars in (c) and (d): 500 μm; the scale bars in (e) and (f): 1 cm.
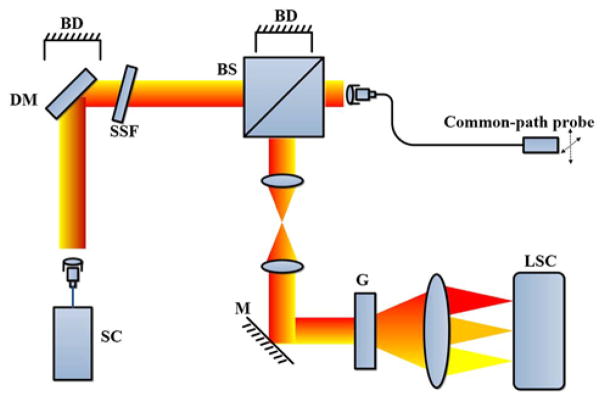
Fiber probes were connected to an OCT system (Fig. 3) with an axial resolution of approximately 1 μm (μOCT) [19] for imaging, and lateral scans were performed by moving the probes via translational stages. A supercontinuum laser (SuperK Extreme EXR-15, NKT Photonics, Denmark) was used as the light source for the system. After the light passed through a dichroic mirror and a spectral shaping filter, the beam was split by a 90/10 beam splitter, where 10% of the light was transmitted and coupled into the common-path fiber optic probe. The light backscattered from the sample was interfered with the reference light and coupled into a custom-designed spectrometer detection module consisting of a telescope system, grating, focusing lens set, and a line scan camera (SPL8192, Basler, Germany). The depth-resolved image was reconstructed from the interferogram using standard OCT image reconstruction methods [linear phase interpolation, fast Fourier transform (FFT) and fixed pattern noise removal] [20]. The OCT imaging system has an axial PSF with a FWHM of 1 μm in tissue medium, and a sensitivity of 105 dB with 40 mW sample arm power at a maximum A-scan (depth-resolved reflectivity profile) acquisition rate of 35 kHz (26 μs integration time for each A-scan). The 6 dB depth-dependent sensitivity roll-off was 1.5 mm.
Fig. 3.
μOCT system. The dashed arrows indicate the lateral scanning of the fiber probe. SC, supercontinuum laser; DM, dichroic mirror; BD, beam dump; SSF, spectral shape filter; BS, beam splitter; M, mirror; G, grating; LSC, line scan camera.
3. RESULTS
A. Lateral Resolution and DOF Characterization
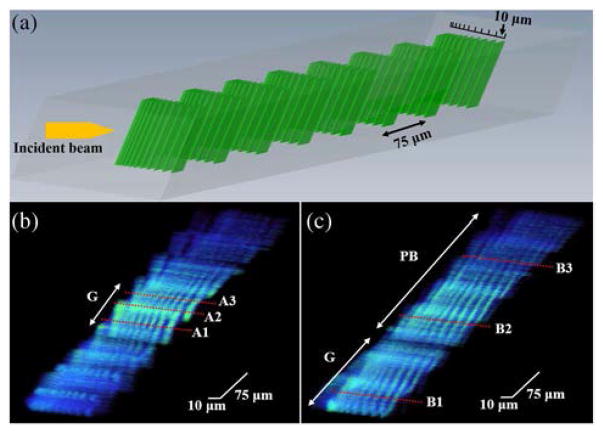
A commercially available OCT phantom (APL-OP01, Arden Photonics, UK) was used to characterize the lateral resolutions as a function of depth. The phantom consists of 8 resolution target pattern layers, where each layer was separated by 75 μm in depth. The bars in each target pattern layer had a spacing ranging from 1 to 10 μm laterally, as illustrated in Fig. 4(a). Using this phantom, within one single B-scan, the lateral resolution of the probe at different imaging depths can be determined. A volumetric scan was performed with the scanning direction slightly tilted (~10 deg) with respect to the orientation of the bars so that the resolution target pattern could be imaged over the entire depth range. The phantom was placed at an equal distance from the two fiber optic probes. Figures 4(b) and 4(c) are the three-dimensional (3D) images of the OCT phantom acquired by the Gaussian and the CAFM beams, respectively. To compensate for the signal degradation over depth caused by sensitivity roll-off and beam penetration loss, a depth normalization was applied to the images (the B-scan image signal intensity at each depth was normalized by the mean of the signal intensity at the corresponding depth). The images were displayed with the same brightness and contrast.
Fig. 4.
(a) 3D schematic drawing of the OCT phantom that has 8 resolution target pattern layers at different depths, spaced by 75 μm. The spacing between bars starts at 10 μm and decrements to 1 μm. (b) A 3D image of the OCT phantom acquired by the conventional fiber optic probe, showing clear resolution of bars over a narrow depth range. A1, A2, and A3 correspond to the depth of 273 μm, 314 μm, and 362 μm, respectively. (c) A 3D image of the OCT phantom acquired by the self-imaging wavefront division fiber optic probe, demonstrating a visualization of bars over the entire phantom. B1, B2, and B3 correspond to the depth of 38 μm, 288 μm, and 463 μm, respectively. G, Gaussian focusing region; PB, pseudo-Bessel focusing region.
The results from Fig. 4 show that the finest phantom spacing that the Gaussian beam could resolve unambiguously was 4 μm while the CAFM beam could resolve a spacing of 3 μm (the difference between the simulated and the measured resolution was mainly because the phantom characterizes resolution in integers). Taking the ability to resolve bars with a 5 μm spacing as the out-of-focus threshold, results from the phantom images demonstrate that the in-focus range for the CAFM beam was more than 420 μm, compared to about 90 μm for the Gaussian beam, approximately a fivefold DOF improvement. Thus, the resolution and the focusing range shown in Figs. 4(b) and 4(c) were in a good agreement with the simulated beam profile in Figs. 2(a) and 2(b). While it is possible that the CAFM beam could have had a superior resolution due to its incorporation of pseudo-Bessel beams, another factor that contributes to its slightly higher resolution was its larger effective NA due to beam expansion over a longer distance through the multimode waveguide, which suggests that when comparing the ratio of the DOF to the lateral resolution, the CAFM beam has a DOF extension of more than fivefold. The significantly extended DOF of the CAFM beam could be clearly observed throughout the 3D images, while the Gaussian beam image had higher signal intensity due in part to the higher energy density at its more depth-confined focus. A deeper penetration depth for the CAFM beam was also realized owing to the self-healing property of the pseudo-Bessel focusing region of the CAFM beam [21]. This phenomenon can be observed in Fig. 4(c); the bar structures in the last two layers of the resolution target pattern can be seen in images obtained by the CAFM beam, while they are significantly blurred in the Gaussian beam image of Fig. 4(b).
B. Extended DOF Cross-Sectional Biological Tissue Imaging
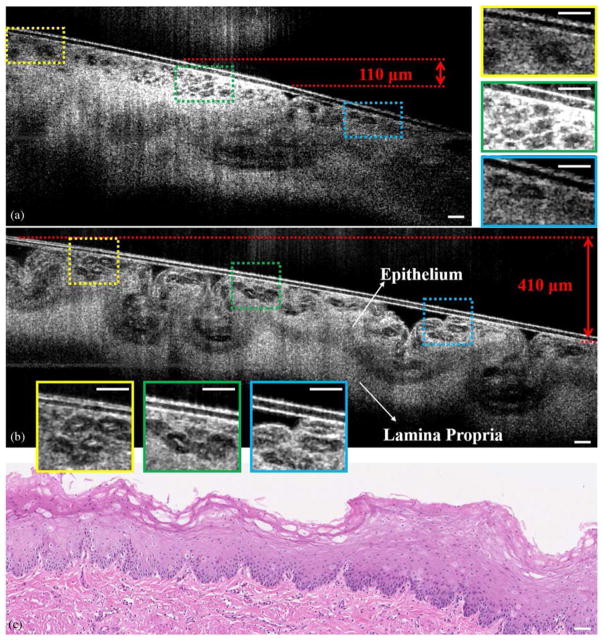
One unique feature of OCT is its capability to acquire cross-sectional images of internal organs in vivo through small-diameter, flexible scanning fiber optic probes [22,23]. Previously, in vivo endoscopic, cross-sectional OCT imaging at cellular-level resolution has been hindered by the limited DOF of conventional probe designs. The significantly extended DOF of the CAFM beam generated by the compact and miniaturized self-imaging wave-front division fiber optic probe guarantees a high-resolution OCT image over a much greater depth range. To demonstrate the potential of the CAFM beam to be utilized for endoscopic, cellular-level resolution imaging, images of a freshly excised swine esophagus were acquired. Figure 5 shows a comparison of the cross-sectional μOCT images of a swine esophagus specimen acquired by the conventional fiber optic probe and the self-imaging wavefront division fiber optic probe. The individual glycogenated squamous cells residing within the superficial epithelial layer can be clearly resolved by the CAFM beam over a slanted surface that spanned a depth of approximately 400 μm (in air) [Fig. 5(b)]. In contrast, the in-focus depth range for Gaussian beam [Fig. 5(a)] was approximately 100 μm (in air). Magnified portions of the images in Fig. 5(b) demonstrate a nearly non-degrading lateral resolution of the CAFM beam over the entire depth range. In addition to the extended DOF, the CAFM beam exhibited a more uniform axial intensity distribution attributed to the well-managed energy distribution between modes. The self-healing property of the CAFM beam also increased the penetration depth in tissue that contributed, for example, to a better-defined boundary between the epithelium and the lamina propria.
Fig. 5.
(a) Cross-sectional μOCT image of a swine esophagus, obtained with the conventional fiber optic probe ex vivo. The three insets on the right are the magnified images that correspond to the rectangular regions labeled in the image. These insets show that the cells can be clearly visualized in the infocus region, but when it is out of focus, images are consistent with cells but significantly blurred. (b) A cross-sectional μOCT image of the same swine esophagus specimen acquired by the self-imaging wavefront division fiber optic probe ex vivo. The specimen was tilted to introduce a more than 400 μm depth offset for demonstration of the extended DOF. The three insets on the bottom are the magnified images corresponding to the rectangular regions labeled in the image. The insets show that the cells are visualized with high contrast and resolution throughout the extended focal range. (c) The histology of the specimen (H&E). μOCT images were three-frame averaged and spatially filtered by a median filter with a radius of 1.5 μm. Scale bars: 50 μm.
C. 3D Biological Tissue Imaging
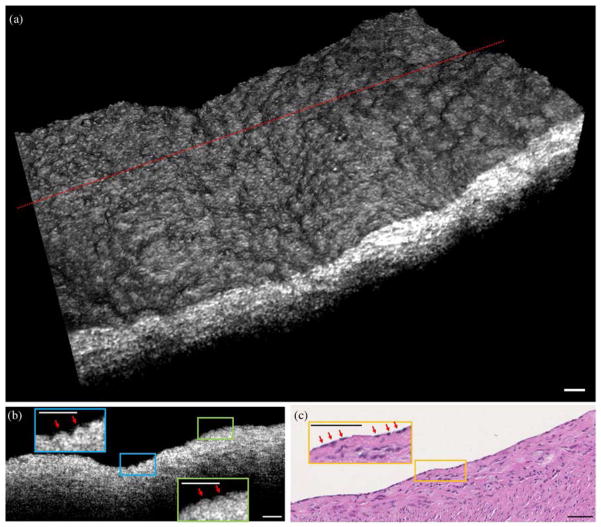
Volumetric images of biological tissue can be constructed by scanning the imaging probe in two dimensions. Figure 6(a) depicts a 3D image of a swine coronary artery acquired by the self-imaging wavefront division fiber optic probe ex vivo. The extended DOF provided by the CAFM beam enabled cellular-resolution imaging over a curved surface that varied by more than 150 μm in depth for the image shown here. The closely spaced bumps or elevations on the surface of the 3D rendering [Fig. 6(a)] are consistent with endothelial cells that one might observe using scanning electron microscopy [24]. Small, highly reflecting foci are seen on the surfaces of these cells that correspond to regions where the scattering from endothelial cell membranes were directed back toward the probing optics. Figure 6(b) is a cross-sectional image from the same specimen that also demonstrates elevations consistent with endothelial cells. Histology [Fig. 6(c)] confirms the presence of endothelial cells in this specimen.
Fig. 6.
(a) 3D μOCT image of a swine coronary artery acquired by the self-imaging wavefront division fiber optic probe, showing elevations or bumps that likely correspond to individual endothelial cells. (b) A cross-sectional image from the location delineated by the dotted line in (a). The red arrows highlight elevations that likely correspond to endothelial cells. (c) The histology of the specimen (H&E), demonstrating endothelial cells (red arrows). μOCT images were processed by a 3D median filter with a radius of 1.5 μm. Scale bar: 50 μm.
4. DISCUSSION AND CONCLUSION
Previously, endoscopic OCT has been limited by using conventional optics, and, as a result, the inherent trade-off between the lateral resolution and DOF has prohibited high-lateral-resolution imaging. With the self-imaging wavefront division configuration reported here, we demonstrate that a multimode propagation scheme with a properly managed pathlength delay and a well-controlled mode-field interaction can also be adopted for OCT imaging, producing a high lateral resolution with a greatly ex-tended DOF. By incorporating a rigid segment of multimode fiber of millimeter length into a conventional optical system, the focused beam field is dramatically modified, producing a CAFM beam that leads to a substantial improvement in the DOF while maintaining high quality imaging throughout. This advance was realized by: (1) the pathlength delay between modes introduced by the circular waveguide was minimized and stabilized to ensure a steady propagation of modes with minimal modal dispersion; (2) the focal zones of the modes were distributed uniformly in the axial direction for a smooth transition between modes; and (3) higher-order modes were designed to contain higher energy to compensate for the depth-dependent attenuation and signal roll-off. A longer penetration depth was also likely observed owing to the self-healing property of the CAFM beam. Like Bessel beams, the CAFM beam distributed energy into multiple propagation modes, and the high-order modes transported energy in discrete rings that contributed to a propagating field that was less disturbed by the scattering medium [21].
Modal dispersion is one important factor that prevents utilizing multimode fibers in conventional OCT systems, but in this study we demonstrate that with a properly designed single-mode-multimode transmission scheme, the multimode fiber could be utilized to enhance the image quality without causing perceptible imaging artifacts. Modal dispersion is noticed in Eq. (S7) in Supplement 1; the two terms preceding the Bessel function have phases with mode (m) dependence that are caused by additional optical pathlengths for the high-order modes. Since the series of foci are created by different modes, this extra pathlength will introduce a “gap” between the OCT images constructed by the foci of neighboring modes. But when the diameter (d), the length (L) of the multimode fiber, the length of the spacer (s), and the focal length of the objective (f) are designed carefully to ensure that this extra pathlength is close to or below the axial resolution of the OCT system, this “gap” is negligible in the image. As in the design presented, the pathlength differences between neighboring modes are on the same order of the system’s axial resolution; therefore, no imaging artifacts associated with modal dispersion are observed. Given the fact that conventional OCT has an axial PSF that is one order of magnitude broader than that of μOCT, we believe this technique could be applied for conventional 10 μm resolution OCT as well, with more relaxed constraints.
In conclusion, we have introduced a CAFM beam for depth-resolved point-scanning microscopic imaging with an extended DOF. The CAFM beam was generated by a self-imaging wave-front division optical system implemented as a fiber optic probe. The capability to miniaturize this optical design and its simplicity make it suitable for incorporation in endoscope/catheter devices for real-time in vivo 3D imaging, with applications that include intravascular imaging of coronary arteries [25], endomicroscopy of the gastrointestinal [26] and pulmonary tracts, among other luminal organs.
Supplementary Material
Acknowledgments
Funding. National Institutes of Health (NIH) (R01HL076398).
The authors thank Connor Dean for organizing the digital histology data. Dr. Tearney receives sponsored research funding from Ardea Biosciences, iLumen, Vertex, and Canon Inc. Massachusetts General Hospital has a licensing arrangements with Terumo Corporation and NinePoint Medical. Dr. Tearney has the rights to receive royalties from these licensing arrangements. Dr. Tearney also receives royalties from MIT. Dr. Tearney consults for NinePoint Medical.
Footnotes
OCIS codes: (110.4500) Optical coherence tomography; (060.2310) Fiber optics; (170.0110) Imaging systems; (170.3880) Medical and biological imaging.
See Supplement 1 for supporting content.
References
- 1.Huang D, Swanson EA, Lin CP, Schuman JS, Stinson WG, Chang W, Hee MR, Flotte T, Gregory K, Puliafito CA, Fujimoto JG. Optical coherence tomography. Science. 1991;254:1178–1181. doi: 10.1126/science.1957169. [DOI] [PMC free article] [PubMed] [Google Scholar]
- 2.Yasuno Y, Sugisaka J, Sando Y, Nakamura Y, Makita S, Itoh M, Yatagai T. Non-iterative numerical method for laterally superresolving Fourier domain optical coherence tomography. Opt Express. 2006;14:1006–1020. doi: 10.1364/oe.14.001006. [DOI] [PubMed] [Google Scholar]
- 3.Ralston TS, Marks DL, Carney PS, Boppart SA. Interferometric synthetic aperture microscopy. Nat Phys. 2007;3:129–134. doi: 10.1038/nphys514. [DOI] [PMC free article] [PubMed] [Google Scholar]
- 4.Kumar A, Drexler W, Leitgeb RA. Subaperture correlation based digital adaptive optics for full field optical coherence tomography. Opt Express. 2013;21:10850–10866. doi: 10.1364/OE.21.010850. [DOI] [PubMed] [Google Scholar]
- 5.Kumar A, Drexler W, Leitgeb RA. Numerical focusing methods for full field OCT: a comparison based on a common signal model. Opt Express. 2014;22:16061–16078. doi: 10.1364/OE.22.016061. [DOI] [PubMed] [Google Scholar]
- 6.Ahmad A, Shemonski ND, Adie SG, Kim HS, Hwu WMW, Carney PS, Boppart SA. Real-time in vivo computed optical interferometric tomography. Nat Photonics. 2013;7:444–448. doi: 10.1038/nphoton.2013.71. [DOI] [PMC free article] [PubMed] [Google Scholar]
- 7.Durnin J, Miceli JJ, Jr, Eberly JH. Diffraction-free beams. Phys Rev Lett. 1987;58:1499–1501. doi: 10.1103/PhysRevLett.58.1499. [DOI] [PubMed] [Google Scholar]
- 8.Durnin J. Exact solutions for nondiffracting beams. I. The scalar theory. J Opt Soc Am A. 1987;4:651–654. [Google Scholar]
- 9.Ding Z, Ren H, Zhao Y, Nelson JS, Chen Z. High-resolution optical coherence tomography over a large depth range with an axicon lens. Opt Lett. 2002;27:243–245. doi: 10.1364/ol.27.000243. [DOI] [PubMed] [Google Scholar]
- 10.Leitget RA, Villiger M, Bachmann AH, Steinmann L, Lasser T. Extended focus depth for Fourier domain optical coherence microscopy. Opt Lett. 2006;31:2450–2452. doi: 10.1364/ol.31.002450. [DOI] [PubMed] [Google Scholar]
- 11.Lit JWY, Tremblay R. Focal depth of a transmitting axicon. J Opt Soc Am. 1973;63:445–449. [Google Scholar]
- 12.Welford WT. Use of annular apertures to increase focal depth. J Opt Soc Am. 1960;50:749–752. [Google Scholar]
- 13.Tan KM, Mazilu M, Chow TH, Lee WM, Taguchi K, Ng BK, Sibbett W, Herrington CS, Brown CTA, Dholakia K. In-fiber common-path optical coherence tomography using a conical-tip fiber. Opt Express. 2009;17:2375–2384. doi: 10.1364/oe.17.002375. [DOI] [PubMed] [Google Scholar]
- 14.Yin B, Chu KK, Liang CP, Singh K, Reddy R, Tearney GJ. μOCT imaging using depth of focus extension by self-imaging wavefront division in a common-path fiber optic probe. Opt Express. 2016;24:5555–5564. doi: 10.1364/OE.24.005555. [DOI] [PMC free article] [PubMed] [Google Scholar]
- 15.Allison SW, Gillies GT. Observations of and applications for self-imaging in optical fibers. Appl Opt. 1994;33:1802–1805. doi: 10.1364/AO.33.001802. [DOI] [PubMed] [Google Scholar]
- 16.Zapata-Rodriguez CJ, Sanchez-Losa A. Three-dimensional field distribution in the focal region of low-Fresnel-number axicons. J Opt Soc Am A. 2006;23:3016–3026. doi: 10.1364/josaa.23.003016. [DOI] [PubMed] [Google Scholar]
- 17.Feit MD, Fleck JA., Jr Light propagation in graded-index optical fibers. Appl Opt. 1978;17:3990–3998. doi: 10.1364/AO.17.003990. [DOI] [PubMed] [Google Scholar]
- 18.Rohrbach A. Artifacts resulting from imaging in scattering media: a theoretical prediction. Opt Lett. 2009;34:3041–3043. doi: 10.1364/OL.34.003041. [DOI] [PubMed] [Google Scholar]
- 19.Liu L, Gardecki JA, Nadkarni SK, Toussaint JD, Yagi Y, Bouma BE, Tearney GJ. Imaging the subcellular structure of human coronary atherosclerosis using micro-optical coherence tomography. Nat Med. 2011;17:1010–1014. doi: 10.1038/nm.2409. [DOI] [PMC free article] [PubMed] [Google Scholar]
- 20.Wojtkowski M, Srinivasan VJ, Ko TH, Fujimoto JG, Kowalczyk A, Duker JS. Ultrahigh-resolution, high-speed, Fourier domain optical coherence tomography and methods for dispersion compensation. Opt Express. 2004;12:2404–2422. doi: 10.1364/opex.12.002404. [DOI] [PubMed] [Google Scholar]
- 21.Fahrbach FO, Simon P, Rohrbach A. Microscopy with self-reconstructing beams. Nat Photonics. 2010;4:780–785. [Google Scholar]
- 22.Tearney GJ, Brezinski ME, Bouma BE, Boppart SA, Pitris C, Southern JF, Fujimoto JG. In vivo endoscopic optical biopsy with optical coherence tomography. Science. 1997;276:2037–2039. doi: 10.1126/science.276.5321.2037. [DOI] [PubMed] [Google Scholar]
- 23.Adler DC, Chen Y, Huber R, Schmitt J, Connolly J, Fujimoto JG. Three-dimensional endomicroscopy using optical coherence tomography. Nat Photonics. 2007;1:709–716. [Google Scholar]
- 24.Pasternak RC, Baughman KL, Fallon JT, Block PC. Scanning electron microscopy after coronary transluminal angioplasty of normal canine coronary arteries. Am J Cardiol. 1980;45:591–598. doi: 10.1016/s0002-9149(80)80009-9. [DOI] [PubMed] [Google Scholar]
- 25.Jang IK, Bouma BE, Kang DH, Park SJ, Park SW, Seung KB, Choi KB, Shishkov M, Schlendorf K, Pomerantsev E, Houser SL, Aretz HT, Tearney GJ. Visualization of coronary atherosclerotic plaques in patients using optical coherence tomography: comparison with intravascular ultrasound. J Am Coll Cardiol. 2002;39:604–609. doi: 10.1016/s0735-1097(01)01799-5. [DOI] [PubMed] [Google Scholar]
- 26.Lee HC, Ahsen OO, Liang K, Wang Z, Cleveland C, Booth L, Potsaid B, Jayaraman V, Cable AE, Mashimo H, Langer R, Traverso G, Fujimoto JG. Circumferential optical coherence tomography angiography imaging of the swine esophagus using a micromotor balloon catheter. Biomed Opt Express. 2016;7:2927–2942. doi: 10.1364/BOE.7.002927. [DOI] [PMC free article] [PubMed] [Google Scholar]
Associated Data
This section collects any data citations, data availability statements, or supplementary materials included in this article.


