

Abstract
Tumour immunotherapy is dependent upon activation and expansion of tumour-targetting immune cells, known as cytotoxic T-lymphocytes (CTLs). Cancer vaccines developed in the past have had limited success and the mechanisms resulting in failure are not well characterized. To elucidate these mechanisms, we developed a human-parametrized, in silico, agent-based model of vaccination-driven CTL activation within a clinical short-peptide vaccination context. The simulations predict a sharp transition in the probability of CTL activation, which occurs with variation in the separation rate (or off-rate) of tumour-specific immune response-inducing peptides (cognate antigen) from the major histocompatibility class I (MHC-I) receptors of dendritic cells (DCs) originally at the vaccination site. For peptides with MHC-I off-rates beyond this transition, it is predicted that no vaccination strategy will lead to successful expansion of CTLs. For slower off-rates, below the transition, the probability of CTL activation becomes sensitive to the numbers of DCs and T cells that interact subsequent to DC migration to the draining lymph node of the vaccination site. Thus, the off-rate is a key determinant of vaccine design.
Keywords: lymph node, cancer vaccine, antigen presentation, modelling and simulation, T-cell dynamics, cytotoxic T-Lymphocyte activation
1. Introduction
Cancer vaccination aims to activate and expand population(s) of tumour peptide-specific CD8+ cytotoxic T-lymphocytes (CTLs) that recognize peptide sequences bound to major histocompatibility class I (MHC-I) receptors on human cells. (The definitions of all acronyms used in the text are given in table 1.) There is a wide range of vaccination strategies, including whole protein, dendritic cell (DC), DNA, RNA, and long- and short-peptide approaches. Short-peptide vaccination aims to induce CTL activation in part by injecting 8–9 amino acid long peptides derived from known tumour-associated peptides. Short peptides have very short intra- and extracellular half-lives [1,2], due to relatively high rates of intracellular breakdown (half-lives of seconds) and vascular clearance (half-lives of minutes in the dermis). As a result, the proportion of surface MHC-I receptor presentation may be suboptimal and thereby limit the probability of CTL activation.
Table 1.
A list of acronyms used in the text.
| (p)MHC(-I) | (peptide-) major histocompatibility complex (one) | ||
| LN | lymph node | HEV | high endothelial venule |
| CD4/CD8 | cluster of differentiation 4/8 | FAST | Fourier amplitude sensitivity testing |
| TCR | T-cell receptor | IL | interleukin |
| DC | dendritic cell | CTL(A) | cytotoxic T-lymphocyte(-associated protein) |
Vaccines contain both antigen and adjuvant, which drive localized DC activation. They can be delivered by a number of routes with dermal and/or subcutaneous delivery requiring the maturation and migration of DCs to draining lymph nodes (LNs). This process takes between 12 and 32 h [3–10]; thus temporal and spatial kinetics are key to understanding vaccine responses. When DCs contact CTLs within LNs, their peptide–MHC complexes (pMHC) ligate naive T-cell receptors (TCRs). For successful CTL activation, a threshold number of TCRs must be ligated by antigen with sufficient affinity to drive TCR clustering and subsequent CTL activation (i.e. cognate antigen) [11,12]. DCs and T cells have multiple interactions over several hours [7,13–15]; however, the majority of these do not lead to activation, due either to insufficient TCR affinity (non-cognate T-cell interactions) or suboptimal amounts of pMHC complexes. CTL activation thus depends on the probability that DCs with sufficient numbers of cognate antigen are able to meet and successfully activate CTLs. This is, for instance, influenced by both the properties of the antigen and the number of DCs that carry it. The combination of conditions under which these factors become limiting for CTL activation is not immediately clear, but may be clarified by modelling the key biological processes and associated spatial and temporal scales from the vaccination site to presentation within the draining LN(s). T cell–DC interactions in tissue-draining LNs has been extensively modelled [16–18]. One of the key parameters determining the development of effector function is the probability of interactions between T cells and professional antigen-presenting cells. To investigate this factor, previous studies have considered a combination of in vivo mouse experimental measurements and an off-lattice spherical model of the LN to estimate the minimum numbers of DCs and T cell required for CTL activation [19]. However, the focus of this model was limited to cell dynamics; to model a short-peptide-based vaccine, it is also necessary to consider the amount of administered peptide bound to DC MHC-I receptors and its dissociation rate. The main objective of this study is, therefore, to investigate how the events following short peptide administration drive CTL activation and how they depend on the number of cognate antigen-specific T cells and DCs, their dynamics, and biophysical peptide properties. Within the context of this scope, we define successful CTL activation as the expansion of one or more tumour peptide-specific CD8+ CTL populations. Our aim is to further understand early events in CTL activation together with the factors that limit the success of short-peptide DC-based vaccination, to better inform vaccine design methodologies (table 1).
2. Material and methods
2.1. Model overview
The fundamental methodology of this study is that of agent-based modelling. In contrast with modelling frameworks which consider population-level descriptions, for example, by considering mean-field equations, agent-based models track all individuals, for instance cells, whose behaviour in space and time is governed by a set of rules. In the current context one agent might be a T cell, which moves every time step according to its stored velocity. If this cell approaches within a certain distance of a DC agent, then it will become activated or not based on parameters stored in the DC agent. Agent-based modelling is ideal when the individuals under consideration are not identical, undergo complex dynamics and are not present in extensive numbers, rendering standard reductions to population-level equations inappropriate. For instance, one common technique, the Van Kampen expansion of the master equation [20], is impractical due to a combinatorial explosion in the dimension of the state space required to classify a system with numerous non-identical agents, and the absence of a thermodynamic limit. Hence, in the current context an agent-based model is ideal and previous work using this technique [19] has been extended, with the new developments summarized in the appendix in the electronic supplementary material. Ab initio C++ code is available from https://doi.org/10.5287/bodleian:dmpX0a42R.
In particular, the framework we have developed is that of a human parametrized, agent-based model of simulated T cells and DCs interacting within an off-lattice, spherical LN. The LN is assumed to be non-inflamed and thus focus is on the probability of a first successful encounter between naive cognate T cells and DCs. T cells in the model are present in the LN at the beginning of the simulation, but DCs carrying varying proportions of peptide antigen are assumed to arrive gradually from the vaccination site at physiological rates. DC antigen decays exponentially over time according to its off-rate with MHC-I (receptors on the DC surface) and an estimated physiological MHC-I receptor turnover rate. When a cognate T cell interacts with a DC, it is assumed to be activated with a probability that depends on the amount of cognate antigen presented by the DC. The output of the model is the overall probability of CTL activation as a function of time up to 48 h, the assumed lifetime of activated DCs within the LN [4,7,9,21–23]. We have systematically investigated the parameter regimes for which antigenic properties and/or cell interaction dynamics within the LN are important, and any ‘trade-off’ between them. Initial positioning of cells, direction and magnitude of cell velocities, and the probability of successful T-cell activation all depend on random numbers, as detailed in the following sections. The model is hence non-deterministic, and all presented results are an ensemble average over a number of replicates specified in each case, which are sufficient to ensure that the ensemble predictions used in this study are insensitive to including further replicates. A more detailed outline of key model assumptions and features follows, and are depicted in figure 1.
Figure 1.

Model overview. (1) Following short-peptide vaccination in the dermis, peptide binds to dendritic cell (DC) receptors (MHC-I). The DCs mature and then migrate to the lymph node via the lymphatics, which in total takes 20–28 h following vaccination. They are then placed at random locations in the simulated lymph node. (2) DCs in the paracortex may contact T cells within a radius b. (3) T cells move with velocity v and mean free path F. If they contact a DC, they are activated with probability p*(A), where A is the proportion of MHC-I receptors on the DC with cognate antigen bound. (4) A reduces over time due to unbinding and to MHC-I receptor turnover by the cell, depicted by the arrows indicating the removal of peptide and receptors. Cutout: A modified screenshot of the graphical output of the model (videos in the electronic supplementary material), which uses GLSC3D [24]. Yellow cells surrounded by translucent spheres represent DCs and their contact radii. Smaller, red cells are T cells, which turn green when activated. (Online version in colour.)
2.2. Peptide binding dynamics in the dermis and lymph node
Prior work [25] suggests that the rate-limiting processes for CTL activation following vaccination are diffusion, vascular clearance, binding of peptides to MHC-I receptors and the number of peptide-presenting DCs migrating to the draining LNs. Thus, we assumed that other vaccine components do not need to be explicitly modelled. We assumed that short peptides bind directly to MHC-I receptors, which typically present ‘self’-peptides produced within the DC. Self-peptides must dissociate before injected peptide may bind, thus high peptide concentrations are injected to ‘buy time’ before vascular clearance. The typical proportion of DC MHC-I receptors to which peptide can bind has been estimated to be 10%–15% [26,27]. DCs take time to mature, leave the dermis and migrate to the draining LN. In this time, peptide may unbind from MHC-I receptors and be cleared by the vasculature, or the entire peptide–MHC complex may be internalized and replaced. The sum of the rate constants of these processes, koff, is used to quantify the proportion of DC MHC-I receptors with cognate antigen bound, A, expected to remain after a time t,
| 2.1 |
Equation (2.1) is hereafter referred to as the off-rate of the cognate antigen from the DC.
2.3. T cell–DC interactions
We model the LN paracortex as a sphere with DCs and T cells at random locations throughout the volume, such that no cell is initially within a contact distance b from another. DCs are added to their assigned locations linearly over a finite period of time. A stochastic arrival distribution was also considered, but it made little quantitative difference to the results. Upon arrival in the draining LN, each DC presents a cognate antigen ratio Adermise−kofftarrival, where Adermis is the cognate antigen ratio presented by the cell in the dermis immediately following injection of vaccine components and tarrival is the time taken for the DC to reach the draining LN. This initial ratio decays according to equation (2.1). DCs are generally assumed to be stationary in the LN, though this assumptions is relaxed in some cases to confirm its validity. T cells draw random velocities and free path lengths from gamma and Gaussian distributions, to match experimental data [14] as detailed in the appendix in the electronic supplementary material. The free path represents the distance that a T cell moves before it stops for any reason and reorients, after which it draws a new free path value. If a T cell moves within a contact distance b from a DC, then its chance of activation is determined as detailed in §2.4 below. If activated, the T cell is removed from the simulation, otherwise; it stops and reorients in a direction away from the DC as outlined above. T cells do not collide with any other simulated cells, as this effect is already included in the free path distribution. However, T cells that reach the LN boundary stop and move in a new random direction. They continue to search the volume until one of three conditions becomes true:
2.4. Probability of T cell–DC interaction success
We assume that cognate peptide–MHC-I complexes, self-peptide–MHC-I complexes and TCRs are all expressed uniformly on the surface of DCs and T cells, and that any new MHC-I receptors upregulated during DC maturation are independent of the initial population of MHC-I receptors that could be bound to the short peptide. Suppose that the proportion of MHC-I receptors that are bound to cognate antigen is A and that N MHC-I receptors are sampled from this population, representing the sampling of the DC's receptors by a nearby T cell. Then the probability that x from this sample are cognate is (approximately) given by the binomial distribution,
Following this, the probability that the number of cognate receptors x within the sampled population N surpasses some threshold T ≤ N is given by
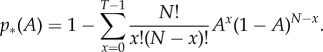 |
2.2 |
As a T cell is only activated when it is simultaneously in contact with a threshold number T of cognate pMHC [11,12], p*(A) represents the conditional probability of activation given that a cognate T cell has made contact with a DC, with N the total number of MHC-I receptors in the T cell–DC contact area that were expressed on the DC surface at the time of vaccination. This conditional probability of activation is plotted against the cognate antigen ratio A in figure 2 with other parameters taking the values in table 2. As the number of MHC-I receptors in the T cell–DC contact region N is large, there is a sharp transition in p*(A), which approaches unity rapidly for AN > T. This is because for large N, comparatively small changes in A lead to large changes in AN. For example, if T = 20 and N = 500, p*(AN = 32) = 0.9923.
Figure 2.
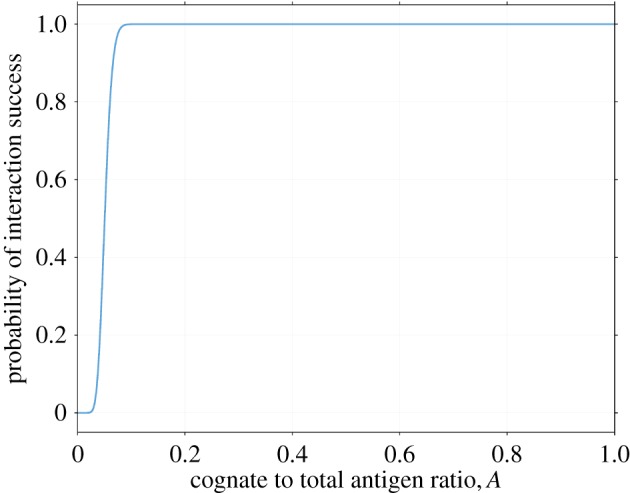
Probability of success for a single T cell–dendritic cell (DC) interaction in terms of the proportion of receptors A on the DC's surface that are bound to cognate antigen, as given by equation (2.2), with other parameters as listed in table 2, including a T-cell activation threshold of T = 20. There exists a transition value, A*, significantly below which there is almost zero probability of interaction success, and significantly beyond which success is essentially certain. The reason for this transition follows from properties of the binomial distribution, as explained in §2.4. (Online version in colour.)
Table 2.
Model parameters. References for each parameter are organized by species: MM, mouse; HS, human; CM, monkey.
| sym | parameter | typical value | reference |
|---|---|---|---|
| A | ratio of cognate to total antigen on DC surface | initially 10%–20% | HS [26] |
| b | contact radius | 20 µm | MM [37–41], HS [42], CM [18] |
| D | number of simulated DCs | 500–1000 | see §2.5 |
| F | T cell free path | 25 µm | MM calculated from Mempel et al. [14] and Miller et al. [43] |
| FDC | DC mean free path | 3–5 µm | MM calculated from Mempel et al. [14] |
| koff | antigen off-rate from MHC-I receptors | n.a. | |
| N | antigen in T cell–DC contact area | 500 | MM [5,9,23,43] |
| P | time of first DC arrival | 18 h | MM [3–6] |
| p | time between first and last DC arrival | 6 h | MM [4,7–9], HS [10] |
| ϕ | T cell precursor frequency | 10−4–10−6 | [19,44–46] |
| rtot | number of MHC-I receptors per DC | 100k | internal+MM [30–34] |
| R | LN (paracortex) radius | 500 µm | [19,37–41] HS [42], CM [18] |
| T | T-cell activation threshold | 20 | MM [11,12,47–50] |
| v | T-cell velocity |  |
MM [43,51]; [14] in particular |
| w | DC velocity | 2–
|
MM [7,9,14] |
| — | density of T cells in paracortex |  |
MM [4,7,23,52], CM [18] |
Note, however, that equation (2.2) ignores various complexities that influence the probability of CTL activation, such as when further DC–T cell interactions are required for activation [7,13,14,28]. After one CTL is activated, it is assumed that the LN becomes inflamed, affecting both cell densities and dynamics. We also ignore TCR affinity: we assume instead that there is a precursor frequency ϕ of T cells capable of recognizing the antigen with approximately equal affinity. In addition, the role of CD4+ T cells in licensing DCs for activation [13,29] is not considered and our model quantifies only the probability that CTL activation fails due to insufficient quantities of migrating DCs or cognate antigen. This is in accordance with our objective to find the regimes in which CTL activation is impossible, rather than the precise prediction of LN output. Note also that the binomial distribution represents sampling with replacement, so it would not be appropriate if the number of MHC-I receptors on DCs were not so large (105 [30–34]). For a comparison with the exact probability distribution, see the appendix, in the electronic supplementary material.
2.5. Dendritic cell dynamics
Following the estimates and assumptions of Karanikas et al. [25], we assume that the number of DCs per square millimetre of dermis is 600 [35] and that the initial injected vaccine solution dispersion area is 0.6 cm2. The number of these DCs that successfully reach the draining LN is small [36]; we assumed it to be of order 1% [36] and that they reach the LN at different times. We considered both linear and stochastic distributions of DC arrival times but found very little quantitative difference between them (data not shown), and hence proceeded with the simpler assumption that DCs arrive linearly between the times P and P + p.
Many models have neglected the movement of DCs. We, therefore, proceed to quantify the accuracy of this assumption in two cases: when DCs first enter the LN, and after they have settled into the paracortex. In the first scenario, DCs in vivo exhibit directed random motion to the high endothelial venule at the LN centre, then to the paracortex. This is modelled by allowing each DC to enter the LN from its outer surface, move linearly towards a random location and then halt. DCs drain from the afferent lymph vessel into the interstitial space surrounding the LN. They then enter the node at essentially any point, with points closest to the vessel more likely. For simplicity, we model entry with equal probability over one hemisphere of the LN. In the second scenario, after DCs have settled into the paracortex, they ‘run and tumble’ akin to T cells with lower motility, which we model by assigning velocity and mean free path distributions to DCs (as detailed in the appendix, in the electronic supplementary material). Most sources report DC velocities of around 2– (e.g. [7,9,14]), so we consider this range for both active migration and random motion.
2.6. Parameter selection
Model parameter values were selected and/or estimated from relevant literature, as summarized in table 2. We matched values to measurements in primary citations where possible; otherwise we have implemented a value within the reported range in the experimental literature. We have used mouse parameters where human data were absent and the parameter is not expected to change substantially between mouse and human (for example, cell velocities). T-cell numbers were chosen by multiplying observed T-cell densities with a precursor frequency ϕ, the proportion of T cells with an affinity for the modelled cognate antigen, and DC numbers were chosen as described in §2.5.
2.7. Sensitivity analyses
To identify important parameters and ensure that the model is well-behaved, we performed a sensitivity analysis. We used two techniques for this: the random forest model [53] and calculation of the variance of model outputs under variation of parameters. The former was implemented using the python package Scikit-learn [54], while the latter made use of extended FAST [55–57].
The random forest technique can yield relative importance factors for each parameter, whose sum adds up to one. eFAST yields two indices for each parameter. The first of these is the ‘sensitivity index’, which represents the proportion of an output's variance that is due solely to a given parameter, i.e. first-order contributions. The sum of these indices is usually less than one, due to missing higher-order terms, which involve combinations of parameters. The ‘total sensitivity index’ is calculated from the proportion of an output's variance due to all parameters except one. This index contains all of the contributions that involve a given parameter at any order. The higher-order terms are counted in multiple indices, so the sum of the indices is usually greater than one.
The difference between the total sensitivity and sensitivity indices is the contribution of a parameter's variance due only to higher-order terms, indicating the degree of ‘interaction’ that a parameter has with others. Total sensitivity indices can be large even for unimportant parameters, if its higher-order terms also include other, more important parameters.
3. Results
3.1. Cytotoxic T-lymphocyte activation probability against numbers of T cells or dendritic cells
The simulated effect on CTL activation probability (the fraction of simulated T cells that become activated) of the numbers of T cells or DCs in the LN is shown in figure 3a–b, which confirm previously reported results [19] (see the appendix in the electronic supplementary material for a description of the differences). In these results, peptide off-rate is set to be very low, so that all DC–T cell interactions lead to successful CTL activation in the simulated time period. This represents a ‘best-case’ scenario in which properties of the administered short peptide are not limiting for T-cell response and increasing the number of either cell type causes the activation probability to increase until saturation.
Figure 3.

The probability of cytotoxic T-lymphocyte (CTL) activation against numbers of dendritic cells or antigen off-rate, koff. In all plots, time t = 0 is defined as the time at which the first dendritic cell (DC) arrives in the lymph node. Where parameters are not specified, their values are as presented in table 2. (a, b) Probability of activation of at least one simulated T cell in (a) 48 h or (b) 24 h, against number of DCs. A very low antigen off-rate is used such that any interaction between cells results in successful CTL activation. Curves for T-cell precursor frequencies between 10−6 and 10−4 are shown. The greater the numbers of either kind of cell, the greater is the chance of successful CTL activation. Both plots are an ensemble average over 1000 replicates. (c, d) Probability of T-cell activation after the specified number of hours versus peptide off-rate after (c) 20% or (d) 100% of MHC-I receptors bind to cognate antigen at the site of vaccination. The probability is characterized by a sigmoidal increase followed by a saturation. Solid lines show the probability for 720 DCs and shaded regions show the probabilities between 500 and 1000 DCs. The dotted line in each plot indicates the turnover rate of MHC-I receptors [58]. Both plots are an ensemble average over 100 replicates.
3.2. Cytotoxic T-lymphocyte activation probability against antigen off-rate
The simulated effect of cognate antigen on the probability of CTL activation is shown by figure 3c–d as a function of the antigen off-rate. The probability is characterized by a sigmoidal increase followed by a saturation. The location of the sigmoidal region on the off-rate axis shifts to higher off-rates (‘left’ in the figure) if Adermis is increased, as shown between figure 3c and d. A decrease in P (the time taken for the first DC to migrate from the dermis to the LN) also shifts the region left, according to ALN entry = Adermise−koffP. Changes to the number of antigen in the T cell–DC contact region, N, or the threshold for response, T, also shift the region, due to the corresponding shift in the transition (figure 2) for the conditional probability of a T cell–DC interaction leading to CTL activation. Changing the number of DCs changes only the saturation height of the slope, as the shaded regions in figure 3c and d indicate.
3.3. Motion of dendritic cells
To approximate the error due to assuming DCs are stationary, we also considered a version of the model in which DCs are allowed to move. Figure 4a,c shows the change in probability of CTL activation when DCs are allowed to move at random throughout the sphere. The greater the DC velocity w, the greater is the increase in CTL activation probability. However, for velocities  , a relatively high DC velocity according to experimental estimates, much of the change in activation probability is within the standard error of the stationary model's output (for 100 statistical replicates per datum). When DC velocities are as high as
  , the difference is outside of these error bars, though the impact on modelling predictions is still weak. Figure 4b,d shows the difference in CTL activation probability when DC migration is explicitly modelled instead of adding simulated DCs directly to random positions. In general, ignoring migration causes an overestimate of activation probability at low velocities and an underestimate at high velocities. At low velocities, DCs are confined to the outer edges of the LN for long times and do not sample as much of the volume. At high velocities, DCs move rapidly through the LN and sample a larger volume than a stationary DC would for the migration period.
Figure 4.

The difference made to cytotoxic T-lymphocyte (CTL) activation probability by modelling dendritic cell (DC) motion (see §2.5). All plots represent an ensemble average over 100 replicates. Left plots (a,c) show the difference due to random DC motion, and right plots (b and d) show the difference made by explicitly modelling entry of DCs into the lymph node (LN) from its outer surface. The probability is plotted 24 h after the first DC arrival in the LN for a range of values of the peptide antigen off-rates and numbers of dendritic cells. The solid line shows the probability of activation for the basic model, in which stationary DCs are placed at random positions throughout the LN. The shaded region shows the probabilities for the altered model with velocities between 2 and  , and the dotted lines show it for velocities of
  and
and  , respectively. Standard error bars are included for the static model, to compare deviations due to DC movement with statistical noise. (Online version in colour.)
Ignoring migration causes an under-/over-estimate for small/large numbers of DCs compared to simulations with intermediate velocities (figure 4b). Moving DCs sample a greater volume of the LN than stationary ones, so the activation probability is increased for small numbers of DCs. However, if the number of DCs is large, then the volume surveyed by each arriving DC overlaps. Randomly scattering the DCs in this case increases the surveyed volume at early times and hence yields a higher activation probability.
Considering changes in antigen off-rate with 720 simulated DCs, as presented in figure 4d, there is essentially no difference in activation probability with changes in motility for very low or very high off-rates. In the transition region, the volume of the LN surveyed by DCs before losing their cognate antigen becomes important, so activation probability differs with velocity as described above. In figure 4a–d, the predictions by the stationary model lie between the predictions for  and
and  for the entire parameter region, indicating that the error due to ignoring this motion is no greater than the error in our uncertainty of the DC's true velocity.
3.4. Analysis of the sensitivity of cytotoxic T-lymphocyte activation probability
We performed a sensitivity analysis on the model, shown in figure 5. We used two techniques: random forest and eFAST. The former yields estimates of the importance of each parameter, while, the latter yields a ‘sensitivity’ and a ‘total sensitivity’ index for each.
Figure 5.

Sensitivity analysis of the model either ‘beyond’ the transition region shown in figure 3c–d or within it, with parameters varied as described in §3.4. All simulations are an ensemble average over 10 replicates. For each plot, the outer ring indicates the proportional size of sensitivity indices from eFAST, the middle ring indicates total sensitivity indices and the inner ring indicates importance factors extracted from the random forest technique. Parameters that occupy more than 5% of the arc length of a ring are labelled and listed below the plots. Bold parameters indicate those controllable by vaccination design (administration or composition). (Atg), (Trn) and (Dyn) indicate parameters related to properties of the antigen, transit of dendritic cells and T cell–dendritic cell interaction dynamics, respectively.
We varied each parameter between ±25% of their default values. R3 and b3 were altered in lieu of R and b, as cell counts and interaction volume are proportional to the cube of these respective parameters. We performed analyses with two ranges of koff: one within and one beyond the transition region described in §3.2.
As expected, only factors relating to cell interactions are important beyond the transition region, where antigen off-rate does not influence CTL activation at long times. Within the transition, CTL activation depends upon sufficient antigen being present, so factors relating to antigen and rapid transit of DCs are most important. Interestingly, total sensitivity indices for many parameters are of a similar size, indicating that there is a high degree of correlation between model parameters.
4. Discussion and conclusion
4.1. The role of peptide off-rate and DC/T-cell numbers in cytotoxic T-lymphocyte activation
The primary aim of this work was to determine the factors that influence the probability of CTL activation following short peptide vaccination. Figure 3 shows that the predicted probability increases with time, the number of DCs, T-cell precursor frequency and decreasing peptide–MHC (pMHC) off-rate. The fundamental factor is the off-rate, against which activation probability exhibits three characteristic behaviours (figure 3c,d): a region of zero probability for fast off-rates, a region of high probability for slow off-rates and a transition region between the other two that is highly sensitive to changes in off-rate. This behaviour is inherited from the sharp transition in the binomial equation (figure 2). Such transition-like behaviour has been observed in the amount of cytokine produced by CTLs as a function of pMHC density when the latter are immobilized on a surface [11,59], which is consistent with conclusions drawn from our model.
For sufficiently slow off-rates beyond the transition, the probability of CTL activation is sensitive to patient-specific factors such as the number of recruited DCs or the precursor frequency, as shown in figure 3a,b. In this region, activation probability is not sensitive to or limited by properties of the antigen.
Within the transition, small changes in off-rate are predicted to cause dramatic changes in CTL activation probability. Thus, vaccination with short peptides with off-rates in this range may show higher levels of inter-patient variability in T-cell activation response. Activation probability within the transition is insensitive to the number of recruited DCs, seen in the narrow thickness of the shaded regions in figure 3c,d. CTL activation probability in this parameter regime could be increased by shifting the transition region, by reducing the time taken for DCs to reach the LN or increasing the proportion of MHC-I receptors bound to cognate antigen in the dermis (by more efficiently loading peptides).
Below the transition, off-rates are too high and there is no prospect for improving the CTL activation probability without first reducing the off-rate. We conclude that the initial events in a short-peptide vaccination that determine CTL activation depends foremost on pMHC presentation and off-rate. To improve the probability of CTL activation, peptides should be optimized for slow off-rates, high presentation at the vaccination site and fast migration time to draining LNs. For example, performing multiple single vaccinations instead of a single multiple-peptide dose would reduce competition for MHC-I receptors and thus increase MHC-I receptor occupancy for each peptide. DC migration time could be improved with alternate delivery mechanisms, such as intranodal DC vaccination.
4.2. The sensitive parameters in our model support expectations
The factors that influence the probability of CTL activation were further studied with sensitivity analyses both within and beyond the transition. The parameters that were found to be important was as expected intuitively. Within the transition, where the pMHC off-rate is barely sufficient for CTL activation, the model is most sensitive to parameters relating to antigen-MHC-I receptor binding such as Adermis or the time taken for the first DC arrival, P. Beyond the transition, where activation probability is not limited by off-rate, only parameters relating to T cell–DC interactions such as the number of DCs are important. This supports the conclusions given in §4.1.
In most cases, the sensitivity indices and random forest importances described in §3.4 agree on which parameters are important. The differences likely stem from the details of each algorithm: the growth process for the random forest chooses parameters that are best able to split data into two groups, while eFAST compares how the variance of different parameters affects the variance of the output. For example, e−koffP determines the location of the transition and thus P can effectively split data that crosses the transition, but does not contribute greatly to output variance away from the transition. Additionally, the sensitivity index for P quantifies output variance due to changes in P alone, but P appears only as a product with the off-rate, koff, while koff is used alone to calculate decay of antigen within the LN (equation (2.1)).
Total sensitivity indices also disagree with the other two sets of indices, but we choose to discount these as they are heavily influenced by interactions between parameters. Sensitivity to other parameters is low, indicating that the model and its conclusions are robust.
4.3. Model observations are not sensitive to dendritic cell motion
Section 3.3 contains a description of the differences made to model predictions when DC movement into the LN is explicitly modelled, and when they are allowed to move randomly akin to T cells. Measurements of a typical DC velocity differ. For example, one measurement using two-photon microscopy [14] gave a median three-dimensional velocity of  , whereas another [15] gave a value corresponding to
  . This discrepancy could be due to the time of measurement; DCs in the LN are known to lose motility over time before stopping after 48 h [4,7,9,21–23]. This loss of motility could be due to changes in either velocity or mean free path, but either case improves the approximation of DCs as stationary.
We found that the difference made to model predictions by random motion of DCs is no greater than statistical fluctuations (for 100 replicates) for DC velocities  , and that ignoring DC migration gives a prediction equal to one in the range of migration velocities
  . These results indicate that it is valid within uncertainties to ignore motion of DCs. However, we modelled DC migration as straight-line movement from the perimeter, which is not true to the biology. It neglects collisions with cells in the node, and the fact that DCs move first to the high endothelial venules. However, as we do not model T cell ingress, HEV modelling is unnecessary. Straight-line movement represents a first approximation, which we expect to be of similar order to the true error. In light of these considerations, and that the differences made to prediction is within experimental uncertainty, we conclude that it is valid to neglect movement of DCs for the range of DC velocities reported in the literature and hence the other results presented here use the ‘basic’ model with no DC movement.
4.4. Conclusion and future work
We produced a model of the events leading to initiation of CTL activation within the LN and quantified various assumptions made by us and others. We analysed the sensitivity of parameters in our model to ensure that our model's conclusions are robust. By considering the properties of antigen bound to DCs and how this affects CTL activation probability, we found that peptide–MHC off-rates that are significantly faster than a certain transition value lead to zero probability of CTL activation. For slightly slower off-rates, there is a rapid transition to a probability that is independent of further decreases in off-rate. For these slower off-rates, the only factors naturally varying among individuals that CTL activation probability depends on are the numbers of interacting T cells and DCs. The transition off-rate depends upon factors such as the time taken by DCs to migrate to the draining LN.
This work could have significant impact on short-peptide cancer vaccine design. We predict that certain tumour-associated peptides used in vaccines may have zero probability of ever activating CTLs in patients, based only on properties of the peptide. This may explain the lack of success in many cancer vaccine clinical trials to date. Peptides should be selected first for a pMHC off-rate low enough to have a chance of CTL activation, and then patient-specific factors should be optimized to improve this chance. The vaccination site may be cooled to reduce peptide clearance multiple vaccination sites that drain to the same LN may be used to increase numbers of recruited DCs or reduce competition for MHC-I receptors in multi-peptide vaccinations, or intranodal DC vaccination may be considered.
There is considerable scope for further work from this study. We could consider additional complexities such as T-cell ingress, egress and receptor affinity to quantify CTL proliferation and compare to the work of others [17,18,60]. The model could be applicable to other types of vaccination such as mRNA or DC delivery, or to tumour-draining LNs, though these would all require consideration of cross-presentation. We showed that various simplifications and assumptions in the model are valid, thus a simpler first-passage model as previously reported [19] could be used in future, by comparing the expected interaction time with the antigen off-rate. However, such an approach should take into account complexities such as staggered arrival of DCs and a ‘run and tumble’ description of T-cell dynamics. As the objectives of this study were to quantify the requirements for driving CTL activation in response to short-peptide vaccinations, a more immediate extension is to simulate past clinical trials and attempt to estimate or replicate the probability of patient response within a cohort. We may then simulate possible alterations to trial design that improve response probability, which may lead to further insight into optimal design.
Supplementary Material
Data accessibility
In compliance with the EPSRC's open access initiative, the data in this paper are available from https://doi.org/10.5287/bodleian:dmpX0a42R [61].
Authors' contributions
J.W. formulated the initial research problem. L.V.B. developed and tested the model, and wrote the manuscript. E.A.G., J.W. and M.C.C. provided feedback and supervision on model development, and significant editing and guidance on the manuscript.
Competing interests
The authors declare no competing interests.
Funding
This research was supported by a Clarendon Scholarship and funding from the Engineering and Physical Sciences Research Council (EPSRC), grant number EP/L016044/1.
References
- 1.Reits E. et al. 2003. Peptide diffusion, protection, and degradation in nuclear and cytoplasmic compartments before antigen presentation by MHC Class I. Immunity 18, 97–108. ( 10.1016/S1074-7613(02)00511-3) [DOI] [PubMed] [Google Scholar]
- 2.Ruttekolk IR, Witsenburg JJ, Glauner H, Bovee-Geurts PHM, Ferro ES, Verdurmen WPR, Brock R. 2012. The intracellular pharmacokinetics of terminally capped peptides. Mol. Pharm. 9, 1077–1086. ( 10.1021/mp200331g) [DOI] [PubMed] [Google Scholar]
- 3.Olex AL, Hiltbold EM, Leng X, Fetrow JS. 2010. Dynamics of dendritic cell maturation are identified through a novel filtering strategy applied to biological time-course microarray replicates. BMC. Immunol. 11, 41 ( 10.1186/1471-2172-11-41) [DOI] [PMC free article] [PubMed] [Google Scholar]
- 4.Cavanagh LL, Weninger W. 2008. Dendritic cell behaviour in vivo: lessons learned from intravital two-photon microscopy. Immunol. Cell. Biol. 86, 428–438. ( 10.1038/icb.2008.25) [DOI] [PubMed] [Google Scholar]
- 5.Weber M, Hauschild R, Schwarz J, Moussion C, de Vries I, Legler DF, Luther SA, Bollenbach T, Sixt M. 2013. Interstitial dendritic cell guidance by haptotactic chemokine gradients. Science (New York, N.Y.) 339, 328–332. ( 10.1126/science.1228456) [DOI] [PubMed] [Google Scholar]
- 6.Clatworthy MR, Aronin CEP, Mathews RJ, Morgan NY, Smith KGC, Germain RN. 2014. Immune complexes stimulate CCR7-dependent dendritic cell migration to lymph nodes. Nat. Med. 20, 1458–1463. ( 10.1038/nm.3709) [DOI] [PMC free article] [PubMed] [Google Scholar]
- 7.Bousso P. 2008. T-cell activation by dendritic cells in the lymph node: lessons from the movies. Nat. Rev. Immunol. 8, 675–684. ( 10.1038/nri2379) [DOI] [PubMed] [Google Scholar]
- 8.Tomura M. et al. 2014. Tracking and quantification of dendritic cell migration and antigen trafficking between the skin and lymph nodes. Sci. Rep. 4, 6030 ( 10.1038/srep06030) [DOI] [PMC free article] [PubMed] [Google Scholar]
- 9.Cahalan MD, Parker I. 2008. Choreography of cell motility and interaction dynamics imaged by two-photon microscopy in lymphoid organs. Annu. Rev. Immunol. 26, 585–626. ( 10.1146/annurev.immunol.24.021605.090620) [DOI] [PMC free article] [PubMed] [Google Scholar]
- 10.Kim PS, Lee PP, Levy D. 2007. Modeling regulation mechanisms in the immune system. J. Theor. Biol. 246, 33–69. ( 10.1016/j.jtbi.2006.12.012) [DOI] [PubMed] [Google Scholar]
- 11.Deeg J, Axmann M, Matic J, Liapis A, Depoil D, Afrose J, Curado S, Dustin ML, Spatz JP. 2013. T cell activation is determined by the number of presented antigens. Nano. Lett. 13, 5619–5626. ( 10.1021/nl403266t) [DOI] [PMC free article] [PubMed] [Google Scholar]
- 12.Fooksman DR. et al. 2010. Functional anatomy of T cell activation and synapse formation. Annu. Rev. Immunol. 28, 79–105. ( 10.1146/annurev-immunol-030409-101308) [DOI] [PMC free article] [PubMed] [Google Scholar]
- 13.Moreau HD, Bousso P. 2014. Visualizing how T cells collect activation signals in vivo. Curr. Opin. Immunol. 26, 56–62. ( 10.1016/j.coi.2013.10.013) [DOI] [PubMed] [Google Scholar]
- 14.Mempel TR, Henrickson SE, Von Andrian UH. 2004. T-cell priming by dendritic cells in lymph nodes occurs in three distinct phases. Nature 427, 154–159. ( 10.1038/nature02238) [DOI] [PubMed] [Google Scholar]
- 15.Cahalan MD, Parker I. 2005. Close encounters of the first and second kind: T-DC and T-B interactions in the lymph node. Semin. Immunol. 17, 442–451. ( 10.1016/j.smim.2005.09.001) [DOI] [PMC free article] [PubMed] [Google Scholar]
- 16.Bogle G, Dunbar PR. 2010. Agent-based simulation of T-cell activation and proliferation within a lymph node. Immunol. Cell. Biol. 88, 172–179. ( 10.1038/icb.2009.78) [DOI] [PubMed] [Google Scholar]
- 17.Moreau HD, Bogle G, Bousso P. 2016. A virtual lymph node model to dissect the requirements for T cell activation by synapses and kinapses. Immunol. Cell. Biol. 94, 680–688. ( 10.1038/icb.2016.36) [DOI] [PMC free article] [PubMed] [Google Scholar]
- 18.Gong C, Mattila JT, Miller M, Flynn JL, Linderman JJ, Kirschner D. 2013. Predicting lymph node output efficiency using systems biology. J. Theor. Biol. 335, 169–184. ( 10.1016/j.jtbi.2013.06.016) [DOI] [PMC free article] [PubMed] [Google Scholar]
- 19.Celli S, Day M, Mu AJ, Molina-paris C, Lythe G, Bousso P. 2012. Brief report: How many dendritic cells are required to initiate a T-cell response? Blood 120, 3945–3948. ( 10.1182/blood-2012-01-408260) [DOI] [PubMed] [Google Scholar]
- 20.Van Kampen NG. 2007. Stochastic processes in physics and chemistry, 3rd edn Amsterdam, The Netherlands: North Holland; ISBN 978–0444529657. [Google Scholar]
- 21.Young AJ. 1999. The physiology of lymphocyte migration through the single lymph node in vivo. Semin. Immunol. 11, 73–83. ( 10.1006/smim.1999.0163) [DOI] [PubMed] [Google Scholar]
- 22.Martin-Fontecha A, Martin-Fontecha A, Lanzavecchia A, Lanzavecchia A, Sallusto F, Sallusto F. 2009. Dendritic cell migration to peripheral lymph nodes. Handb. Exp. Pharmacol. 188, 31–49. ( 10.1007/978-3-540-71029-5_2) [DOI] [PubMed] [Google Scholar]
- 23.Miller MJ, Hejazi AS, Wei SH, Cahalan MD, Parker I. 2004. T cell repertoire scanning is promoted by dynamic dendritic cell behavior and random T cell motility in the lymph node. Proc. Natl Acad. Sci. USA 101, 998–1003. ( 10.1073/pnas.0306407101) [DOI] [PMC free article] [PubMed] [Google Scholar]
- 24.Akiyama M, Tateiri K, Sushida T, Kobayashi R, Hirayoshi Y, Okamoto M. 2017. GLSC3D v3.0.0. URLs https://github.com/GLSC3DProject/GLSC3D and http://www-mmc.es.hokudai.ac.jp/masakazu/. Accessed Dec 2017. Japanese language source. [Google Scholar]
- 25.Karanikas V, Teichgräber V, Phipps A, Charoin JE, Kootsey JM, Wagg J. 2015. Optimizing delivery of cancer vaccines: short peptides. In Increasing drug development success: understanding drug-disease interactions through quantitative systems pharmacology, New York, NY, 2–3 November. [Google Scholar]
- 26.Linette G. 2016. Passenger mutations as target antigens for immuno-oncology. In ESMO Symp. on Immuno-Oncology, Lausanne, Switzerland, 4–6 November. Lugano, Switzerland: European Society for Medical Oncology. [Google Scholar]
- 27.Zehn D, Cohen CJ, Reiter Y, Walden P. 2006. Efficiency of peptide presentation by dendritic cells compared with other cell types: implications for cross-priming. Int. Immunol. 18, 1647–1654. [DOI] [PubMed] [Google Scholar]
- 28.Bogle G, Rod Dunbar P. 2010. T cell responses in lymph nodes. Wiley Interdiscip. Rev.: Syst. Biol. Med. 2, 107–116. ( 10.1002/wsbm.47) [DOI] [PubMed] [Google Scholar]
- 29.Beuneu H, Garcia Z, Bousso P. 2006. Cutting edge: cognate CD4 help promotes recruitment of antigen-specific CD8 T cells around dendritic cells. J. Immunol. 177, 1406–1410. (Baltimore, Md.: 1950) ( 10.4049/jimmunol.177.3.1406) [DOI] [PubMed] [Google Scholar]
- 30.Delaney JR, Sykulev Y, Eisen HN, Tonegawa S. 1998. Differences in the level of expression of class I major histocompatibility complex proteins on thymic epithelial and dendritic cells influence the decision of immature thymocytes between positive and negative selection. Proc. Natl Acad. Sci. USA 95, 5235–5240. ( 10.1073/pnas.95.9.5235) [DOI] [PMC free article] [PubMed] [Google Scholar]
- 31.Hunt DF, Shabanowitz J, Sakaguchi K, Michel H, Sevilir N, Cox AL, Appella E, Henderson RA, Engelhard VH. 1992. Characterization of peptides bound to the class I MHC molecule HLA-A2.1 by mass spectrometry. Science 255, 1261–1263. ( 10.1126/science.1546328) [DOI] [PubMed] [Google Scholar]
- 32.Stevanović S, Schild H. 1999. Quantitative aspects of T cell activation–peptide generation and editing by MHC class I molecules. Semin. Immunol. 11, 375–384. ( 10.1006/smim.1999.0195) [DOI] [PubMed] [Google Scholar]
- 33.Tsomides TJ, Walker BD, Eisen HN, Walkert BD. 1991. An optimal viral peptide recognized by CD8+ T cells binds very tightly to the restricting class I major histocompatibility complex protein on intact cells but not to the purified class I protein. Proc. Natl Acad. Sci. USA 88, 11 276–11 280. ( 10.1073/pnas.88.24.11276) [DOI] [PMC free article] [PubMed] [Google Scholar]
- 34.Yewdell JW, Reits E, Neefjes J. 2003. Making sense of mass destruction: quantitating MHC class I antigen presentation. Nat. Rev. Immunol. 3, 952–961. ( 10.1038/nri1250) [DOI] [PubMed] [Google Scholar]
- 35.Rattanapak T, Birchall JC, Young K, Kubo A, Fujimori S, Ishii M, Hook S. 2014. Dynamic visualization of dendritic cell-antigen interactions in the skin following transcutaneous immunization. PLoS ONE 9, 1–12. ( 10.1371/journal.pone.0089503) [DOI] [PMC free article] [PubMed] [Google Scholar]
- 36.Aarntzen EHJG. et al. 2013. Targeting of 111in-labeled dendritic cell human vaccines improved by reducing number of cells. Clin. Cancer. Res. 19, 1525–1533. ( 10.1158/1078-0432.CCR-12-1879) [DOI] [PubMed] [Google Scholar]
- 37.Li L, Mori S, Sakamoto M, Takahashi S, Kodama T. 2013. Mouse model of lymph node metastasis via afferent lymphatic vessels for development of imaging modalities. PLoS ONE 8, e55797 ( 10.1371/journal.pone.0055797) [DOI] [PMC free article] [PubMed] [Google Scholar]
- 38.Kodama T, Hatakeyama Y, Kato S, Mori S. 2015. Visualization of fluid drainage pathways in lymphatic vessels and lymph nodes using a mouse model to test a lymphatic drug delivery system. Biomed. Opt. Express 6, 124 ( 10.1364/BOE.6.000124) [DOI] [PMC free article] [PubMed] [Google Scholar]
- 39.Economopoulos V, Noad JC, Krishnamoorthy S, Rutt BK, Foster PJ. 2011. Comparing the MRI appearance of the lymph nodes and spleen in wild-type and immuno-deficient mouse strains. PLoS ONE 6, 2–9. ( 10.1371/journal.pone.0027508) [DOI] [PMC free article] [PubMed] [Google Scholar]
- 40.Bajénoff M, Breart B, Huang AYC, Qi H, Cazareth J, Braud VM, Germain RN, Glaichenhaus N. 2006. Natural killer cell behavior in lymph nodes revealed by static and real-time imaging. J. Exp. Med. 203, 619–631. ( 10.1084/jem.20051474) [DOI] [PMC free article] [PubMed] [Google Scholar]
- 41.Willard-Mack CL. 2006. Normal structure, function, and histology of lymph nodes. Toxicol. Pathol. 34, 409–424. ( 10.1080/01926230600867727) [DOI] [PubMed] [Google Scholar]
- 42.Beltman JB, Marée AFM, Lynch JN, Miller MJ, deBoer RJ. 2007. Lymph node topology dictates T cell migration behavior. J. Exp. Med. 204, 771–780. ( 10.1084/jem.20061278) [DOI] [PMC free article] [PubMed] [Google Scholar]
- 43.Miller MJ, Safrina O, Parker I, Cahalan MD. 2004. Imaging the single cell dynamics of CD4+ T cell activation by dendritic cells in lymph nodes. J. Exp. Med. 200, 847–856. See also other data from same author ( 10.1084/jem.20041236) [DOI] [PMC free article] [PubMed] [Google Scholar]
- 44.Garcia Z, Pradelli E, Celli S, Beuneu H, Simon A, Bousso P. 2007. Competition for antigen determines the stability of T cell-dendritic cell interactions during clonal expansion. Proc. Natl Acad. Sci. USA 104, 4553–4558. ( 10.1073/pnas.0610019104) [DOI] [PMC free article] [PubMed] [Google Scholar]
- 45.Blattman JN. 2002. Estimating the precursor frequency of naive antigen-specific CD8 T Cells. J. Exp. Med. 195, 657–664. ( 10.1084/jem.20001021) [DOI] [PMC free article] [PubMed] [Google Scholar]
- 46.Lemaitre F, Law HKW, Hasan M, Albert ML. 2010. Enumeration of human antigen—specific naive CD8+ T cells reveals conserved precursor frequencies. Blood 115, 3718–3725. ( 10.1182/blood-2009-10-251124) [DOI] [PubMed] [Google Scholar]
- 47.Grakoui A, Bromley SK, Sumen C, Davis MM, Shaw AS, Allen PM, Dustin ML. 1999. The immunological synapse: a molecular machine controlling T cell activation. Science (New York, N.Y.) 285, 221–227. ( 10.1126/science.285.5425.221) [DOI] [PubMed] [Google Scholar]
- 48.RosemaryChristinck E, Luscher MA, Barber BH, Williams DB. 1991. Peptide binding to class I MHC on living ells and quantitation of complexes required for CTL lysis. Nature 352, 67–70. ( 10.1038/352067a0) [DOI] [PubMed] [Google Scholar]
- 49.Irvine DJ, Purbhoo MA, Krogsgaard M, Davis MM. 2002. Direct observation of ligand recognition by T cells. Nature 419, 845–849. ( 10.1038/nature01076) [DOI] [PubMed] [Google Scholar]
- 50.Viola A, Lanzavecchia A. 1996. T cell activation determined by T cell receptor number and tunable thresholds. Science (New York, N.Y.) 273, 104–106. ( 10.1126/science.273.5271.104) [DOI] [PubMed] [Google Scholar]
- 51.Benechet AP, Menon M, Khanna KM. 2014. Visualizing T cell migration in situ. Front. Immunol. 5, 1–12. ( 10.3389/fimmu.2014.00363) [DOI] [PMC free article] [PubMed] [Google Scholar]
- 52.Riggs T, Walts A, Perry N, Bickle L, Lynch JN, Flynn J, Linderman JJ, Miller MJ, Denise E. 2009. A comparison of random versus chemotaxis driven contacts of T cells with dendritic cells during repetoire scanning. J. Theor. Biol. 250, 732–751. ( 10.1016/j.jtbi.2007.10.015.A) [DOI] [PMC free article] [PubMed] [Google Scholar]
- 53.Breiman L. 2001. Random Forests. Mach. Learn. 45, 5–32. ( 10.1023/A:1010933404324) [DOI] [Google Scholar]
- 54.Pedregosa F. et al. 2011. Scikit-learn: machine learning in Python. J. Mach. Learn. Res. 12, 2825–2830. [Google Scholar]
- 55.Makowski D, Naud C, Jeuffroy M-H, Barbottin A, Monod H. 2006. Global sensitivity analysis for calculating the contribution of genetic parameters to the variance of crop model prediction. Reliab. Eng. Syst. Safety 91, 1142–1147. ( 10.1016/j.ress.2005.11.015) [DOI] [Google Scholar]
- 56.Saltelli A, Tarantola S, Chan KP-S. 1999. A quantitative model-independent method for global sensitivity analysis of model output. Technometrics 41, 39–56. ( 10.1080/00401706.1999.10485594) [DOI] [Google Scholar]
- 57.Saltelli A, Tarantola S, Campolongo F. 2000. Sensitivity analysis as an ingredient of modeling. Stat. Sci. 15, 377–395. [Google Scholar]
- 58.Milner E, Barnea E, Beer I, Admon A. 2006. The turnover kinetics of major histocompatibility complex peptides of human cancer cells. Mol. Cell. Proteomics: MCP 5, 357–365. ( 10.1074/mcp.M500241-MCP200) [DOI] [PubMed] [Google Scholar]
- 59.Lever M, Lim H-S, Kruger P, Nguyen J, Trendel N, Abu-Shah E, Maini PK, van der Merwe PA, Dushek O. 2016. A minimal signalling architecture explains the T cell response to a 1 000 000-fold variation in antigen affinity and dose. Proc. Natl Acad. Sci. USA 113, E6630–E6638. ( 10.1101/071878) [DOI] [PMC free article] [PubMed] [Google Scholar]
- 60.Bogle G, Rod Dunbar P. 2012. On-lattice simulation of T cell motility, chemotaxis, and trafficking in the lymph node paracortex. PLoS ONE 7, e45258 ( 10.1371/journal.pone.0045258) [DOI] [PMC free article] [PubMed] [Google Scholar]
- 61.Brown LV, Gaffney EA, Wagg J, Coles MC. 2018. An in silico model of cytotoxic T-lymphocyte activation in the lymph node following short peptide vaccination Oxford University Research Archive. 10.5287/bodleian:dmpX0a42R. [DOI] [PMC free article] [PubMed]
Associated Data
This section collects any data citations, data availability statements, or supplementary materials included in this article.
Data Citations
- Brown LV, Gaffney EA, Wagg J, Coles MC. 2018. An in silico model of cytotoxic T-lymphocyte activation in the lymph node following short peptide vaccination Oxford University Research Archive. 10.5287/bodleian:dmpX0a42R. [DOI] [PMC free article] [PubMed]
Supplementary Materials
Data Availability Statement
In compliance with the EPSRC's open access initiative, the data in this paper are available from https://doi.org/10.5287/bodleian:dmpX0a42R [61].