Abstract
One method extensively used for the quantification of gene expression changes and transcript abundances is reverse-transcription quantitative real-time PCR (RT-qPCR). It provides accurate, sensitive, reliable, and reproducible results. Several factors can affect the sensitivity and specificity of RT-qPCR. Residual genomic DNA (gDNA) contaminating RNA samples is one of them. In gene expression analysis, non-specific amplification due to gDNA contamination will overestimate the abundance of transcript levels and can affect the RT-qPCR results. Generally, gDNA is detected by qRT-PCR using primer pairs annealing to intergenic regions or an intron of the gene of interest. Unfortunately, intron/exon annotations are not yet known for all genes from vertebrate, bacteria, protist, fungi, plant, and invertebrate metazoan species.
Here we present a protocol for detection of gDNA contamination in RNA samples by using ribosomal DNA (rDNA)-based primers. The method is based on the unique features of rDNA: their multigene nature, highly conserved sequences, and high frequency in the genome. Also as a case study, a unique set of primers were designed based on the conserved region of ribosomal DNA (rDNA) in the Poaceae family. The universality of these primer pairs was tested by melt curve analysis and agarose gel electrophoresis. Although our method explains how rDNA-based primers can be applied for the gDNA contamination assay in the Poaceae family, it could be easily used to other prokaryote and eukaryote species
Keywords: Genetics, Issue 131, qPCR, RT-qPCR, gene expression analysis, DNA contamination assay, ribosomal DNA (rDNA), ribosomal RNA (rRNA), Poaceae, prokaryote, eukaryote, universal primer
Introduction
Exploring transcriptional regulation of interesting gene sets or signaling networks is essential to understand the complex molecular mechanisms involved in biological events1. Currently, qPCR analysis is the most widely used approach for gene expression studies that can target either DNA (the genome) or RNA (the transcriptome) which permit methylome and transcriptome analysis, respectively. Reverse transcription (RT) followed by qPCR is widely used for transcriptome analysis that measure gene expression levels in various areas of biological research2. Compared to other methods such as the traditional Northern hybridization, tissue specific detection via in situ hybridization, ribonuclease protection assays (RPA), and semi-RT-PCR, the accuracy, convenience, speed, and wide dynamic range of qPCR-based assays are highly remarkable3,4. There are several important factors that have to be considered for a reliable quantification of messenger RNA (mRNA), including the quality and quantity of RNA starting material. Furthermore, non-specific amplification, the efficiency of RT-qPCR, and PCR efficiency have to be considered5,6.
The presence of gDNA is an inherent problem during RNA extraction due, in part, to the similar physical and chemical properties of DNA and RNA7. Because of the sequence identity of gDNA and complementary DNA (cDNA) derived from the mRNA samples, non-specific amplification can occur, which will influence the accuracy of RT-qPCR results. The remaining gDNA will lead to overestimation of the abundance of target mRNA in gene expression analysis8.
Basically, the non-specific amplicon mostly arises from primer-dimer formation or unspecific background amplification due to gDNA, both of which can be assessed by using appropriate control samples. Such samples are no template control (NTC) and no reverse transcriptase control (NRT), respectively. Since the levels of gDNA contamination in the samples being studied are different and the sensitivity toward gDNA differs greatly between the genes analyzed, the NRT controls are required for each sample/assay pair. Although this substantially increases cost and labor in RT-qPCR profiling studies, these controls are required7,9.
Alternative methods dealing with gDNA contamination include the use of primer pairs annealing to intergenic regions or an intron of the gene of interest10, and the use of primers that either flank a large intron or span an exon-exon junction, i.e. the annealing sites are absent in the mature mRNA sequence1,4. However, intron/exon annotations for all genes from many vertebrate, bacteria, protist, fungi, plant, and invertebrate metazoan species are known yet. In addition, many eukaryotic organisms have pseudogenes derived from duplication events. Further, primer design across introns does not guarantee non-amplification of gDNA. As the chromatin accessibility of genomic regions to DNase I varies, it is recommended to design different primer pairs targeting different chromosomes10.
The genomes of eukaryotic organisms can encompass up to a thousand copies of rDNA genes encoding ribosomal subunits necessary for ribosomes formation. These rDNA genes are often organized in single or tandem repeat arrays11. Polycistronic rRNAs (Figure 1) including the large subunit (LSU) and small subunit (SSU) are transcribed by RNA polymerase I (RNA pol I). The resulting pre-rRNAs are further processed by eliminating the two internal transcribed spacer regions ITS1 and ITS2. As final products, three mature rRNAs, 17-18S rRNA (SSU), 5.8S, and 25-28S rRNA (LSU) are generated12. rDNA genes are typical representatives of a multigene family with highly conserved sequences. They occur with a high frequency in the genome and are potentially present at more than one chromosomal location13. The processing of the rRNA and the degradation of the transcribed spacers is a fast process in the nucleolus. Due to the high degree of repetitiveness, the ratio of genomic copy number and detectable unprocessed RNA premolecules is lower compared to the low-copy intron sequences and unspliced precursors. These features make rDNA genes well suited for reliable and highly sensitive detection of gDNA contamination in most eukaryotes and prokaryotes3.

Here a novel procedure for detecting gDNA contamination in RNA samples is described. A set of universal primers based on the rDNA conserved sequence is presented for gDNA assays in several Poaceae species. The specificity and universality of the proposed primers were tested by melt curve analysis using DNA as a template. Our protocol is not only applicable for Poaceae, but could also easily be adapted to other eukaryotic and prokaryotic species.
Protocol
NOTE: Any tissue can be used.
1. Nucleic Acid Extraction
Put 100 mg of tissue samples in a 2.0 mL tube, add two 5 mm stainless steel beads and homogenize the tissue at 25 - 30 Hz for 30 s (homogenization duration and frequency depending on tissue type) for both RNA and DNA.
Isolate total RNA according to the manufacturer's instructions.
Isolate total DNA according to the manufacturer's instructions.
Control the purity and quantity of the RNA samples by measuring absorbance at 260 and 280 nm.
Control the purity and quantity of the DNA samples by measuring absorbance at 260 and 280 nm. NOTE: While nucleic acids absorb light with a wavelength of 260 nm (A260), the absorbance of light at the wavelength 280 (A280) can be used to quantify the amount of proteins and phenols present in the sample. Therefore, the ratio of A260/A280 nm can be used to evaluate the purity of DNA and RNA extracted from a sample. A260/280 values in the range of ≥1.8 and >2.0 are generally considered to be "pure" for DNA and RNA, respectively. Lower A260/280 values may indicate contamination by protein or organic chemicals.
Test the quality of DNA by running a 0.7% agarose gel electrophoresis. Prepare the gel and run in 1x TRIS-boric EDTA-buffer (TBE: 89 mM Tris, 89 mM boric acid, and 2 mM EDTA) at 100 V for 30 min. High quality gDNA appears as a sharp, high-molecular-weight (HMW) band with no smears in the range of low molecular weight (LMW) molecules.
- Check isolated RNA for quantity, purity, and integrity under denaturing conditions by a guanidine thiocyanate (GTC) agarose gel electrophoresis or by capillary electrophoresis chip, according to the manufacturer's instructions.
- Prepare the GTC gel by adding 5 mM GTC to a standard 1x TBE 1% agarose gel after cooling the agar to 60 °C. NOTE: GTC is toxic, so dispense it in a fume hood, and wear appropriate personal protective equipment.
- Prepare RNA denaturing loading buffer: 95% formamide, 10 mM EDTA pH 8.0, 0.1% bromophenol blue, 0.1% xylene cyanole, and 10 µL ethidium bromide. NOTE: Formamide and ethidium bromide are toxic, and should be dispensed in a fume hood.
- Load 1 - 5 µg of total RNA in RNA denaturing loading buffer, heat the mixture for 5 min at 70 °C, place it on ice before loading it onto a gel, and then separate RNA on GTC gel at 100 V for 45 min. Load DNA or RNA molecular weight marker as a standard alongside the RNA sample.
- Stain the gels with ethidium bromide and visualize the bands using image capture systems under ultraviolet light. In eukaryotes, intact total RNA run at denaturing conditions will show at least two sharp and clear rRNA bands (28S and 18S) with a 2:1 intensity ratio.
Remove traces of gDNA by treatment with DNase (DNase I RNase-free). Add to an RNase-free tube in 10 µL total volume: 0.1 - 1 µg of total RNA, one unit of DNase I, and 1 µL of 10x reaction buffer with MgCl2. Incubate the mixture for 30 min at 37 °C. Terminate the reaction by adding 1 µL of 50 mM EDTA and incubating at 65 °C for 10 min.
Remove traces of RNA from gDNA extracts using DNase free RNase A, according to the manufacturer's protocol. Add 5 µL of RNase 10 mg/mL to the total DNA and incubate at 37 °C for 1 h. Store RNA and DNA extracts at -80 °C.
2. Primer Design from rDNA Region for gDNA Assay
NOTE: The rDNA full-length sequence contains two regions (ITS1 and ITS2), which are removed in the mature rRNA molecule by a series of endonucleolytic cleavages and then degraded (Figure 1).
Retrieve the rDNA nucleotide sequence from NCBI (http://www.ncbi.nlm.nih.gov) for the species of interest. The best keyword for searching the database is “internal transcribed spacer.”
Input the target nucleotide sequence into a BLASTn search for finding internal transcribed spacer regions (ITSs), SSU, and LSU conserved regions.
- Select primers that either flank an ITSs sequence or that amplify ITSs sequences that are not present in the mature rRNA.
- Designing primers flanking the ITS1 or ITS2 sequences: Align the conserved regions from various species by ClustalW. Design primers specific for ITS flanking region after taxa specific/cross-species analysis with AlleleID software. The two primer pairs amplifying SSU-5.8S and 5.8S-LSU amplicons can be designed based on the flanking regions of ITS1 and ITS2, respectively. Because these amplicons are spanning across the ITS region, the amplicon length will be increased for at least 300 bp in amplicons from gDNA. This increase reduces the sensitivity.
- Flanking ITS1: Select SSU and 5.8S rRNA sequence. Selected primers for Poaceae are: SSU, SF: CGTAACAAGGTTTCCGTAGGTG, R: GGTTCACGGGATTCTGCAAT. This primer pair (SF: forward and R: reverse) amplifies the partial region of SSU, the full-length of ITS1, and the partial region of 5.8S rDNA.
- Flanking ITS2: Select 5.8S and LSU sequence. Selected primers for Poaceae are: F: ATTGCAGAATCCCGTGAACC LSU consensus sequence, LR: TGCTTAAAYTCAGCGGGTAGYC. This primer pair amplifies the partial region of 5.8S, the full-length of ITS2, and the partial region of LSU (Figure 1). NOTE: In the case of primer design based on ITSs flanking region, the highly conserved areas of SSU, 5.8S, and LSU were identified. The forward and reverse primers of 5.8S rRNA were designed based on a conserved motif in flowering plants14. The forward and reverse primers were designed based on SSU and LSU conserved regions in Poaceae, respectively. The divergence of SSU and LSU primers for each species is given in Table 1.
- Primers amplifying an ITSs sequence: In this protocol, design ITS1 primers based on Aeluropus ITS sequence (NCBI taxid number: 110873). For primers, use: Forward: GGTATGGCGTCAAGGAACACT, Reverse: ATAGCATCGCTGCAAGAGGT. According to the amplicons generated by the primer pairs in silico, the size should range from 60 to 200 bp. This is also the recommended size for qPCR analysis.
Pick the primers while considering these recommendations: GC content: 40 - 60%, primer length: 18 - 23 base, PCR product length: 60 - 160 bp (specially for ITS primer), melting temperature (Tm): 60 °C, the final Tm for both primers do not differ more than 5 °C, and the primers are not complementary to themselves or partner primers.
- Check primer specificity and copy number. Perform in-silico analysis of the selected primer sequence by primer-blast program (https://www.ncbi.nlm.nih.gov/tools/primer-blast/).
- Open the Primer-BLAST submission page. Enter both primer sequences in the primer parameters section of the form. In the primer pair specificity checking parameters section, enter an organism name (or organism group name) and select the genome Database. These settings give the specificity information about target sequence and primer parameters including product length, position on chromosome, and copy number.
3. Perform qPCR Step for Validation of rDNA-based Primers with DNA Templates
NOTE: The functionality of the designed primers should be validated by performing qPCR using gDNA as a template. To perform several parallel reactions and reduce pipetting errors, the preparation of a master mix is recommended. For a master mix, prepare a volume equivalent to the total number of reaction mix plus ~10%.
Prepare a master mix by mixing all reaction components except the DNA template in a PCR-reaction tube. Upscale as needed from one reaction to prepare the Master mix: 5 µL SYBR green (SYBR) master mix (2x), 0.3 µL primer (0.3 µM each of forward and reverse primer), and adjust the final volume to 10 µL with RNase-free water. Use approximately ≤200 ng in 1 µL of template gDNA for analysis. NOTE: Thaw, assemble, and keep all reagents, components, and reaction mixes on ice.
Aliquot the Master mix into an optical 96-well plate. Pipette 1 µL of gDNA to each well, and then cover it with optical plate sealing film. Spin and place in cycler.
Run the qPCR assay on a real-time thermal cycler under the following conditions: 10 min at 95 °C followed by 40 cycles of 95 °C for 15 s and 60 °C for 1 min. Perform data acquisition at the 60 °C annealing/extension step.
After the amplification procedure, subject all PCR reactions to a melting curve analysis with continuous fluorescence measurement from 55 °C to 95 °C. Typically, collect one data point each cycle by a stepwise increase of the temperature by 0.5 °C per cycle. NOTE: Include at least 2 non-template controls (NTC) for each primer pair master mix. Perform all assays in at least three replications.
Confirm the primer specificity via the melt curve analysis. Analyze curves with the single threshold cycle and subtracted curve fit method. NOTE: The appearance of a sharp individual peak indicates a uniform individual amplicon. Primer dimer products can appear as individual peaks at lower temperatures.
- Validate the size of each amplicon by agarose gel electrophoresis.
- Prepare a 3% agarose gel by mixing 3 g agarose with 100 mL of TBE buffer (TBE: 89 mM Tris, 89 mM boric acid, and 2 mM EDTA).
- Mix 5 - 10 µL of PCR product with DNA and 1 - 2 µL of 6x loading buffer. Load PCR product alongside a DNA ladder on 3% agarose gel. Perform an electrophoretic separation in 1x TRIS-boric EDTA-buffer at 100 V for 45 min.
- Stain the gels with ethidium bromide or any other intercalating agent and visualize the bands using image capture systems under ultraviolet light. NOTE: DNA intercalating agents (e.g., ethidium bromide) are cancerogenic and should be handled with care and separately dispensed. The appearance of a unique sharp band (with respect to size and without primer-dimer or artificial background amplification) confirms the specificity of the amplicon.
4. gDNA Contamination Assay Procedure with RNA Templates
NOTE: After treatment with DNase, the purified RNA sample is tested by rDNA-specific primers. Due to the processing of the intron-like feature of ITSs when these regions are used for amplification, no amplification signal should be detected in DNA-free RNA samples. Based on this, if an amplification signal in qPCR is detected or a band in the agarose gel observed with the expected size (estimated by in silico analysis), this should be due to gDNA contamination. The steps performed in this section, are similar to section 3, except that cDNA of all samples is used as template instead of gDNA.
Prepare a master mix by mixing all reaction components except RNA template in a PCR-reaction tube. Master mix combination for one reaction: 5 µL SYBR master mix (2x), 0.3 µL primer (0.3 µM each of forward and reverse primer mix), and adjust the final volume to 10 µL with RNase-free water. Use approximately 500 ng template RNA in 1 µL volume for analysis.
Aliquot the master mix into an optical 96-well plate. Pipette 1 µL RNA to each well, and then cover it by optical plate sealing film. Centrifuge and place in cycler. NOTE: Include at least two NTC controls and two positive gDNA controls for each assay. Perform all assays in three technical replications.
Run the qPCR assay on a Real-time thermal cycler under the following conditions: 10 min at 95 °C followed by 40 cycles of 95 °C for 15 s and 60 °C for 1 min. Perform data acquisition at the 60 °C annealing/extension step.
After the amplification procedure, subject all PCR reactions to a melting curve analysis with continuous fluorescence measurement from 55 °C to 95 °C. Usually, collect one data point each cycle by a stepwise increase of the temperature by 0.5 °C per cycle.
Check all PCR products by running on 3% agarose gel electrophoresis. NOTE: The appearance of any band or peak in the NTC reaction is probably related to primer-dimer formation that is usually seen at low temperatures in the melting curve, while the presence of any band or peak in RNA samples is the result of gDNA contamination. It is recommended to first test all RNA samples by rDNA-based primers, and then non-DNA contaminated samples are used for downstream applications such as cDNA synthesis, gene expression analysis, etc.
5. RT-PCR Step for cDNA Synthesis and qPCR Analysis
Thaw DNase-treated RNA and the cDNA synthesis reagents at room temperature. After thawing, spin down the reagents. Add 1 µg of RNA and 1 µL of Oligo (dT)18 primer into a nuclease-free tube. Adjust the total volume of 12 µL with RNase-free water, mix gently, and then store on ice.
Melt secondary structures of RNA template by incubating the reaction at 65 °C for 5 min. Spin down and cool the vial on ice.
Prepare the reaction master mix (final volume 20 µL for each reaction) as follows: 1 µL of reverse transcriptase (200 U/µL), 4 µL of reaction buffer (5x), 1 µL of RNase inhibitor (20 U/µL), and 2 µL of dNTP Mix (10 mM). Mix gently and cool the vial on ice. Add 19 µL into the prepared tube containing the RNA.
Incubate the reaction for 60 min at 42 °C, and then incubate at 70 °C for 5 min to terminate reverse transcriptase activity. Place the RT reactions on ice and proceed to gene expression analysis by routine qPCR procedure (as explained in section 3 and 4).
Representative Results
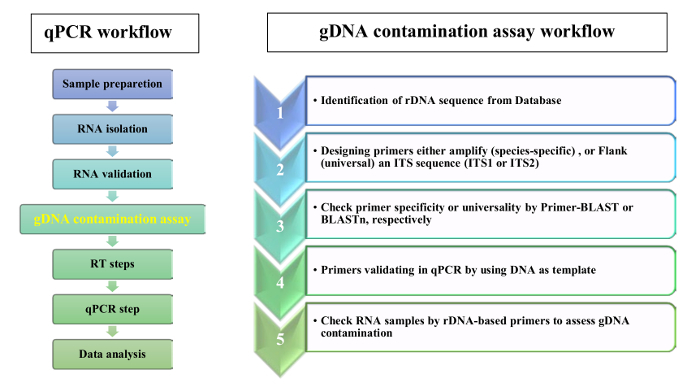
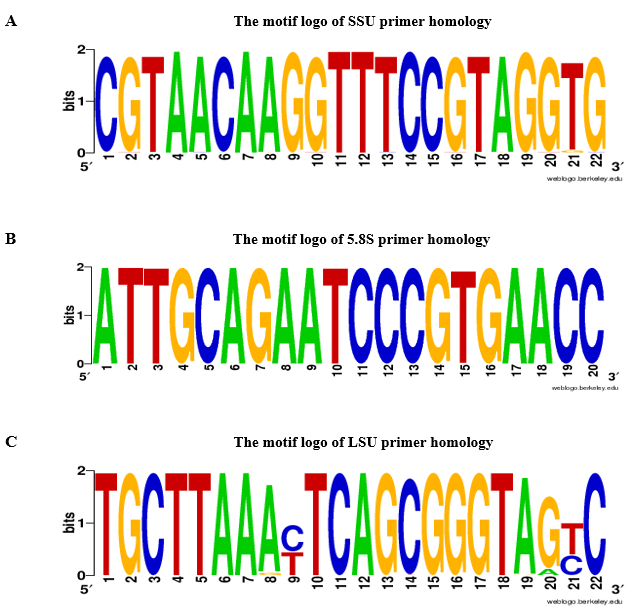
We propose the use of rDNA-based primers to validate the absence of gDNA contamination in RNA samples of leaf tissue. The flowchart of qPCR analysis and gDNA contamination assay is shown in Figure 2. In the presented protocol, two complementary strategies were used for rDNA-based primer design: 1) species-specific primers were selected from ITSs sequences and 2) universal primers were selected from ITSs flanking regions. For proof-of-concept, we designed primers specific for Aeluropus littoralis, and universal primers based on Poaceae species, as given in the protocol. The 5.8S forward and reverse primers were selected based on a conserved 14 base pair (bp) motif that shows similarity between flowering plants, bryophytes, and several orders of algae and fungi14. The features of designed primers are given in Table 2. The universality of SSU, 5.8S, and LSU primer were checked by BLASTn, and primer homology results are presented in Figure 3 as a motif logo. The list of species included in the homology analysis as well as the divergent primers for each species are given in Table 1. Primer specificity was check by Primer-BLAST. For species where the whole genome sequence is available, the chromosomal location of rDNA genes was estimated. For instance, in Oryza sativa and Arabidopsis thaliana, rDNA genes are located on two different chromosomes, and in Zea mays on three different chromosomes.
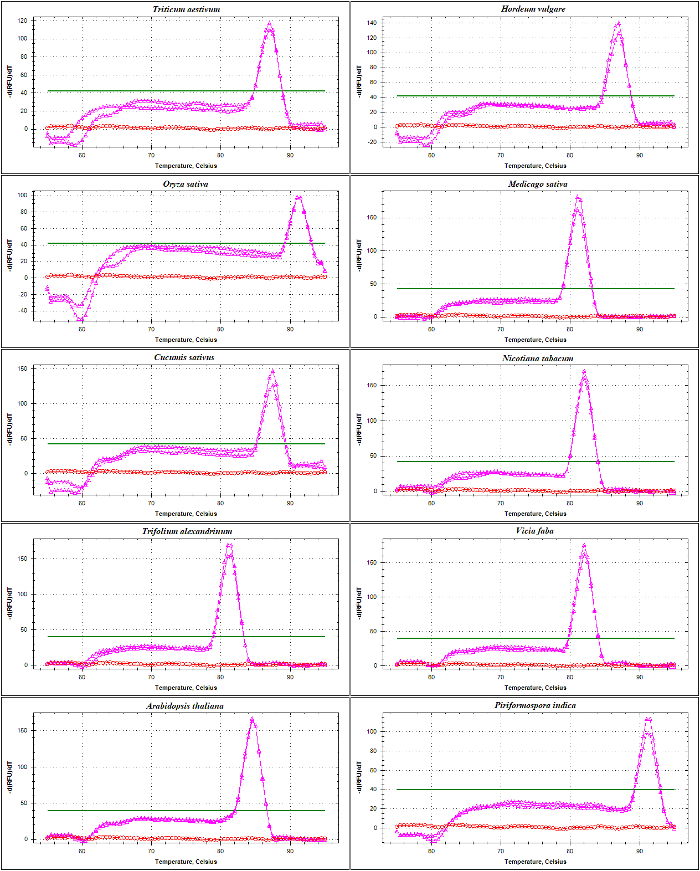
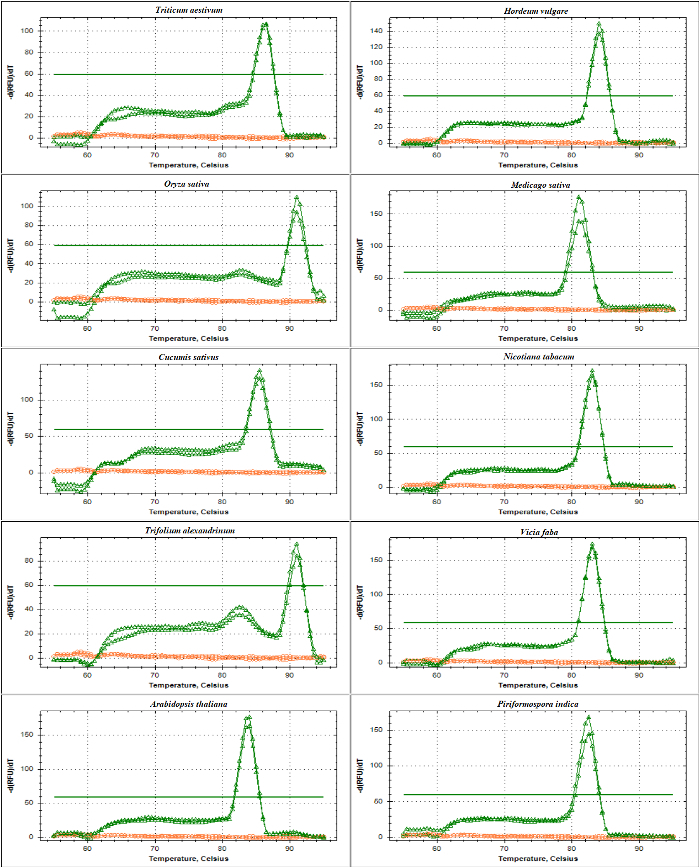
qPCR validation of rDNA-based primers was performed with melting curve analysis of ITS1 and ITS2-flank amplicons using DNA as a template. As presented inFigure 4 andFigure 5,primer specificity was confirmed experimentally by the observation of a single sharp peak with no primer-dimer formation in different Poaceae species including Triticum aestivum, Hordeum vulgare, Oryza sativa, and in the dicots Medicago sativa, Cucumis sativus, Nicotiana tabacum, Trifolium alexandrinum, Vicia faba, and Arabidopsis thaliana. The further test of the amplification products by electrophoretic size separation showed a unique band. As expected, the bands derived from samples of different species varied in size (Figure 6A and 6B). Interestingly, the use of the universal primers specifically designed for the three Poaceae species are not only useful for other Poaceae species, but also for other plant species such as A. thaliana, and for an endophytic fungus viz. Piriformospora indica.
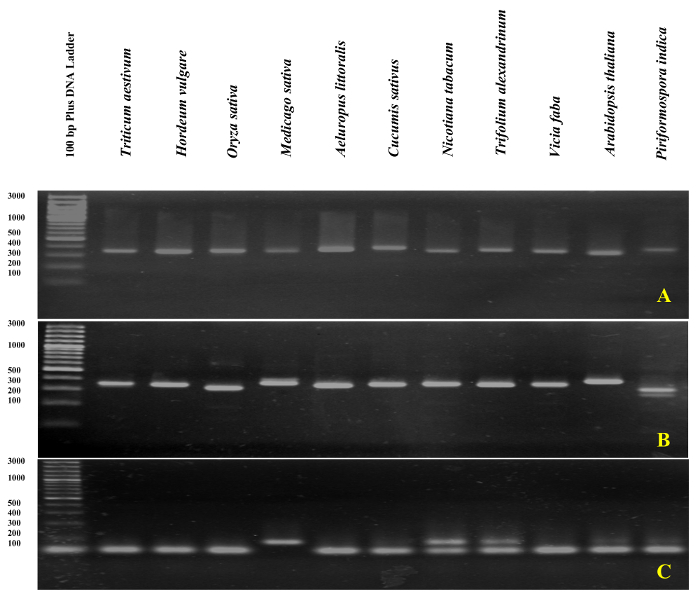
The validity of the designed specific primer (ITS1) was also confirmed by qPCR in A. littoralis using gDNA as template. A single peak with no primer-dimer formation was observed. Surprisingly, the A. littoralis ITS1 primer (as the specific primer) generated a single sharp band not only in A. littoralis, but also for all other species tested except for Nicotiana tabacum and Trifolium alexandrinum, which produced two bands (Figure 6C). The gDNA contamination assay was performed by either ITS or ITS-flanking primers in all RNA samples. A schematic representation of the amplification plate in the gDNA contamination assay, and the interpretation of results is presented in Figure 7.
Figure 1: The general pattern of eukaryotic rDNA sequence organization. The eukaryotic rDNA segment contains 17-18S (red), 5.8S (blue), and 25-28S rRNA (pink). The internal transcribed spacers (ITS) are indicated as black lines. 5´and 3´ indicate the orientation of the DNA molecule. Please click here to view a larger version of this figure.
Figure 2: Workflow for a RT-qPCR and gDNA contamination assay. Please click here to view a larger version of this figure.
Figure 3: Motif logo of A. SSU, B. 5.8S and C. LSU primer homology. For SSU, 5.8S, and LSU primers, the motif logo was constructed by BLASTn based on 2,000 green plant records (NCBI taxid number: 33090) with a cut-off e-value ≤10-10. A-Adenine, T-Thymine, G-Guanine, C-Cytosine. Please click here to view a larger version of this figure.
Figure 4: The melt curve analysis of ITS1-flanking amplicon in different species. This amplicon, amplified by SSU and 5.8S-R primers, contains part of the sequence from the 17-18S encoding region, the whole sequence of ITS1 and partial sequence of 5.8S. Shown are the melting curves of amplicons generated (pink) and NTC (red) from Triticum aestivum, Hordeum vulgare, Oryza sativa, Medicago truncatula, Cucumis sativus, Nicotiana tabacum, Trifolium alexandrinum, Vicia faba, Arabidopsis thaliana, and Piriformospora indica. The flat bold line indicates the baseline threshold. Please click here to view a larger version of this figure.
Figure 5: The melt curve analysis of ITS2-flanking amplicon in different species. This amplicon is generated by the use of 5.8S-F and LSU primers. The described amplicon contains sequences of part of 5.8 S, the whole sequence of ITS2, and a partial sequence of 25-28S. Shown are the melting curves of amplicons (green) and NTC (red) generated from Triticum aestivum, Hordeum vulgare, Oryza sativa, Medicago truncatula, Cucumis sativus, Nicotiana tabacum, Trifolium alexandrinum, Vicia faba, Arabidopsis thaliana and Piriformospora indica. Please click here to view a larger version of this figure.
Figure 6: Agarose gel analysis of rDNA-based PCR product. The amplicon of ITS1-flanks (A), ITS2-flanks (B), and ITS1 (C) were run on 3% agarose gel. Please click here to view a larger version of this figure.
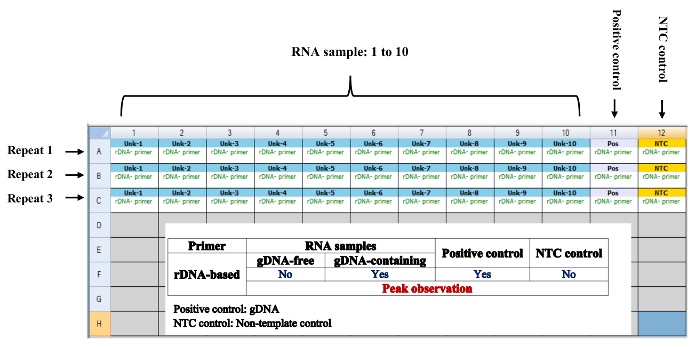
Figure 7: Intron-like features of ITSs can be considered to design primers which can detect gDNA contamination. Any peak or band with the expected size in qPCR analysis indicate gDNA contamination in the RNA sample. Unk: unknown sample, pos: positive control, NTC: non-template control. Please click here to view a larger version of this figure.
| Primer | Genus | Taxid ID | Species | Divergent primer |
| SSU | Arabidopsis | 3701 | kamchatica, thaliana and lyrata | - |
| Vicia | 3904 | villosa, americana, unijuga, amoenane, amurensis, craccamal, pseudo-orobus, multicaulis, japonica, ramuliflora and faba | ||
| Trifolium | 3898 | alexandrinum, montanum, resupinatum and repens | - | |
| Nicotiana | 4085 | tabacum, benthamiana, otophora, picilla, bigelovii, palmeri, tomentosiformis, tomentosa, digluta, kawakamii, clevelandii, nesophila , solanifolia, cordifolia, debneyi, arentsii, thyrsiflora, wigandioides, undulata, glutinosa, noctiflora, petunioides, obtusifolia, miersii, pauciflora, attenuate, acuminata , linearis, alata, sylvestris , rustica and suaveolens | - | |
| Cucumis | 3655 | anguria, melo and sativus | CGTAACAAGGTTTCCGTAGGKG | |
| Aeluropus | 110873 | - | No primer found | |
| Medicago | 3877 | sativa, lupulina, pamphylica, lunata, rostrate, plicata and truncatula | - | |
| Oryza | 4597 | sativa, glumipatula, rufipogon barthii glaberrima punctate, longistaminata, meridionalis, nivara, meridionalis and longistaminata | - | |
| Triticum | 4564 | aestivum, urartu and monococcum | - | |
| Hordeum | 4512 | vulgare, bulbosum, marinum, brevisubulatum and bogdanii | - | |
| LSU | Arabidopsis | 3701 | petraea, thaliana and lyrata | TGCTTAAACTCAGCGGGTAATC |
| Vicia | 3904 | sylvatica, tetrasperma, sativa,hirsute, sepium, parviflora, cracca, lathyroides, orobus, orobus,bithynica and faba | TGCTTAAATTCAGCGGGTAGCC | |
| Trifolium | 3898 | pretense, nigrescens, resupinatum, occidentale,subterraneum,strictum,ochroleucon, glomeratum,squamosum, ornithopodioides and repens | TGCTTAAATTCAGCGGGTAGCC | |
| Nicotiana | 4085 | tabacum, benthamiana, otophora, picilla, bigelovii, palmeri, tomentosiformis, tomentosa, digluta, kawakamii, clevelandii, nesophila , solanifolia, cordifolia, debneyi, arentsii, thyrsiflora, wigandioides, undulata, glutinosa, noctiflora, petunioides, obtusifolia, miersii, pauciflora, attenuate, acuminata , linearis, alata, sylvestris and suaveolens | TGCTTAAACTCAGCGGGTAGTC | |
| Cucumis | 3655 | melo, ritchiei and javanica | TGCTTAAACTCAGCGGGTAGTC | |
| Aeluropus | 110873 | lagopoide, pungens and littoralis | TGCTTAAATTCAGCGGGTAATC | |
| Medicago | 3877 | ruthenica, sativa, lupulina, arabica, polymorpha and minima | TGCTTAAATTCAGCGGGTAGCC | |
| pamphylica, lunata, rostrate and plicata | TGCTTAAACTCAGCGGGTAGTC | |||
| Oryza | 4597 | sativa,glumipatula, rufipogon,barthiial, glaberrima,australiensis,officinalis, australiensis, ridleyi, malampuzhaensis , alta, nivara, rufipogon, meridionalis and longistaminata | TGCTTAAACTCAGCGGGTAGTC | |
| Triticum | 4564 | aestivum,spelta, turgidum,dicoccoides, petropavlovskyi, urartu and monococcum | TGCTTAAACTCAGCGGGTAGTC | |
| Hordeum | 4512 | vulgare, bulbosum, murinum,secalinum, brevisubulatum and bogdanii | TGCTTAAACTCAGCGGGTAGTC | |
| A degenerate primer is defined as IUPAC system for nucleotide nomenclature |
Table 1: The list of species considered for picking rDNA-based primers. SSU binding site in comparison to LSU binding site showed higher sequence homology over given genus.
| Amplicon length | Amplification area | Sequence | Primer name | Amplicon |
| 332 - 405 bp | Partial sequence of SSU, whole sequence of ITS1 and partial sequence of 5.8S | CGTAACAAGGTTTCCGTAGGTG | SSU | ITS1-flanks |
| GGTTCACGGGATTCTGCAAT | 5.8S-R | |||
| 318 - 361 bp | Partial sequence of 5.8S, whole sequence of ITS2 and partial sequence of LSU | ATTGCAGAATCCCGTGAACC | 5.8S-F | ITS2-flanks |
| TGCTTAAAYTCAGCGGGTAGYC | LSU | |||
| 100 - 200 bp | ITS1 | GGTATGGCGTCAAGGAACACT | ITS1-F | ITS1 |
| ATAGCATCGCTGCAAGAGGT | ITS1-R |
Table 2: Primer sequences.
Discussion
Gene expression analysis by quantitative PCR has been widely applied in recent years. The main benefit of this rapid, cost-effective, and automated method is its precise and accurate result. However, gaining optimal benefits from these advantages requires a clear understanding of the setup of the parameters used for the qPCR experiment. To receive a reliable result in qPCR gene expression analysis, it is necessary to avoid the nonspecific amplification that arises from primer-dimer or gDNA contamination in the RNA sample3,15. It is expected that the RNA transcript levels will be overestimated under gDNA contamination8. Here, the unique features of an rDNA gene was considered for a gDNA contamination assay in RNA samples.
Basic properties of the rDNA used in this protocol: Ribosomal genes consist of the two ITSs, namely ITS1 and ITS2, and the three rRNA encoding genes, 17-18S, 5.8S, and 25-28S subunit12. The two ITS regions are not part of the coding sequence of the ribosomal subunits. They are removed by at least three enzymatic activities to process the precursor to mature rRNA: an endonuclease, helicase, and exonuclease activity. As the ribosomal RNA is transcribed as a polycistronic transcript, a primary product containing the ITSs is certainly present. The processing is very fast and takes place in the nucleolus, and the amount of detectable precursor molecules containing the ITS is below the detection limit of the qPCR method. Therefore, when ITS1 or ITS2 are amplified by ITS flanking primers, no amplification can be detected in RNA samples unless gDNA contamination is present. The number of rDNA genes in the genome of eukaryotic organisms was estimated to include up to a thousand copies, which are arranged in single or tandem arrays on the chromosomes11. In this protocol, we propose an alternative way, instead of NRT, to detect gDNA contamination, which is used in each reaction/assay.
Benefits and limitations with respect to existing methods: NRT is typically used to test whether the prepared RNA sample is clean or contaminated by gDNA. Since gDNA contamination is not distributed uniformly between different RNA samples, and the reaction sensitivity to gDNA is significantly affected by the genes analyzed, NRT controls are required for each sample/assay pair7,15. This will substantially add cost and labor when handling many samples simultaneously3,9. Other alternative methods documented in the literature include the use of intron specific primers for the detection of gDNA, or designing primers that either flank an intron or span an exon-exon junction. The limitations of these methods stem from the unavailability of intron sequence information, incomplete annotation of intron/exon structure, and the absence of introns in genes or pseudogenes of interest1,4,10. Due to evolution, rDNA genes exist as multigene and highly conserved gene families. They are highly abundant in the genome and present on different chromosomes13. Compared to other coding or nonconding genes, the rDNA genes show the best fit for detection of gDNA contamination. In comparative transcriptomic analyses, the normalization of qPCR data by rRNA calibrator is not recommended for some issues, such as differences in cDNA preparation (polyA priming vs. random hexamer priming), large differences in abundance between rRNA and mRNA, and different biogenesis which may generate misleading results10,16. However, the problems we have just mentioned are an advantage for the gDNA contamination assay. For example, with respect to higher targeting site abundance in the genome, and localization on different chromosomes, rDNA-based primers significantly improve the detection sensitivity of gDNA in comparison to existing methods.
Versality of rDNA-based to other organism: rDNA genes are a well-studied gene family identified in most organisms. The proposed rDNA-based method represents a simple, highly sensitive, and economic system for gDNA contamination assays that may be easily adapted to other eukaryotic and prokaryotic organisms (Protocol 2 - 5). As a case study, we have demonstrated here the utility of this method in some Poceae species (Figure 4 and Figure 5). The used primers show a high rate of transferability to other Poceae species due to the highly conserved structure of rDNA subunits among species. This issue becomes even more important when sufficient genomic sequence information is not available for primer design. Thus, ITS-flanking primers designed for one species can be used in a related species. Also, the 5.8S-F/R primers were picked based on a conserved motif that shows high similarity in most flowering plants14. Although high throughput sequencing techniques permanently increase the number of known genomes, the exon-intron annotation of most organisms is not completed, and so it is often not possible to design primers to span an exon-exon border. Our method explains how rDNA-based primers can be applied for the gDNA contamination assay in qPCR analysis of prokaryotes and eukaryotes with the goal of eliminating expensive NRT controls in each assay/primer combination.
Disclosures
The authors have no competing financial interests.
Acknowledgments
This research was supported by the Genetic and Agricultural Biotechnology Institute of Tabarestan (GABIT), Sari Agricultural Sciences and Natural Resources University (SANRU). The junior research group Abiotic Stress Genomics was funded by IZN (Interdisciplinary Centre for Crop Plant Research, Halle (Saale), Germany. We thank Rhonda Meyer for critical reading of the manuscript.
References
- Bustin SA, Nolan T. Pitfalls of quantitative real-time reverse-transcription polymerase chain reaction. J Biomol Tech. 2004;15(3):155–166. [PMC free article] [PubMed] [Google Scholar]
- Gutierrez L, Mauriat M, Pelloux J, Bellini C, Van Wuytswinkel O. Towards a systematic validation of references in real-time RT-PCR. Plant Cell. 2008;20(7):1734–1735. doi: 10.1105/tpc.108.059774. [DOI] [PMC free article] [PubMed] [Google Scholar]
- Hashemi SH, Nematzadeh G, Ahmadian G, Yamchi A, Kuhlmann M. Identification and validation of Aeluropus littoralis reference genes for Quantitative Real-Time PCR Normalization. J Biol Res (Thessalon) 2016;23(1):18. doi: 10.1186/s40709-016-0053-8. [DOI] [PMC free article] [PubMed] [Google Scholar]
- Bustin SA. Absolute quantification of mRNA using real-time reverse transcription polymerase chain reaction assays. J. Mol. Endocrinol. 2000;25(2):169–193. doi: 10.1677/jme.0.0250169. [DOI] [PubMed] [Google Scholar]
- Andersen CL, Jensen JL, Orntoft TF. Normalization of real-time quantitative reverse transcription-PCR data: a model-based variance estimation approach to identify genes suited for normalization, applied to bladder and colon cancer data sets. Cancer Res. 2004;64(15):5245–5250. doi: 10.1158/0008-5472.CAN-04-0496. [DOI] [PubMed] [Google Scholar]
- Bustin SA, et al. The MIQE guidelines: minimum information for publication of quantitative real-time PCR experiments. Clin Chem. 2009;55(4):611–622. doi: 10.1373/clinchem.2008.112797. [DOI] [PubMed] [Google Scholar]
- Laurell H, et al. Correction of RT-qPCR data for genomic DNA-derived signals with ValidPrime. Nucleic Acids Res. 2012;40(7):e51. doi: 10.1093/nar/gkr1259. [DOI] [PMC free article] [PubMed] [Google Scholar]
- Galiveti CR, Rozhdestvensky TS, Brosius J, Lehrach H, Konthur Z. Application of housekeeping npcRNAs for quantitative expression analysis of human transcriptome by real-time PCR. RNA. 2010;16(2):450–461. doi: 10.1261/rna.1755810. [DOI] [PMC free article] [PubMed] [Google Scholar]
- Laurell H, et al. Correction of RT-qPCR data for genomic DNA-derived signals with ValidPrime. Nucleic Acids Res. 2012;40:e51. doi: 10.1093/nar/gkr1259. [DOI] [PMC free article] [PubMed] [Google Scholar]
- Caldana C, Scheible WR, Mueller-Roeber B, Ruzicic S. A quantitative RT-PCR platform for high-throughput expression profiling of 2500 rice transcription factors. Plant Methods. 2007;3(1):7. doi: 10.1186/1746-4811-3-7. [DOI] [PMC free article] [PubMed] [Google Scholar]
- Lawrence RJ, Pikaard CS. Perspectives Chromatin Turn Ons and Turn Offs of Ribosomal RNA Genes. Cell Cycle. 2004;3(7):880. [PubMed] [Google Scholar]
- Boisvert FM, van Koningsbruggen S, Navascues J, Lamond AI. The multifunctional nucleolus. Nat Rev Mol Cell Biol. 2007;8(7):574–585. doi: 10.1038/nrm2184. [DOI] [PubMed] [Google Scholar]
- Alvarez I, Wendel JF. Ribosomal ITS sequences and plant phylogenetic inference. Mol Phylogenet Evol. 2003;29(3):417–434. doi: 10.1016/s1055-7903(03)00208-2. [DOI] [PubMed] [Google Scholar]
- Jobes DV, Thien LB. A conserved motif in the 5.8 S ribosomal RNA (rRNA) gene is a useful diagnostic marker for plant internal transcribed spacer (ITS) sequences. Plant Mol Biol Report. 1997;15(4):326–334. [Google Scholar]
- Padhi BK, Singh M, Huang N, Pelletier G. A PCR-based approach to assess genomic DNA contamination in RNA: Application to rat RNA samples. Anal Biochem. 2016;494:49–51. doi: 10.1016/j.ab.2015.10.012. [DOI] [PubMed] [Google Scholar]
- Dheda K, et al. Validation of housekeeping genes for normalizing RNA expression in real-time PCR. Biotechniques. 2004;37(1):112–114. 116, 118–119. doi: 10.2144/04371RR03. [DOI] [PubMed] [Google Scholar]


