

Summary
Parenting is essential for the survival and wellbeing of mammalian offspring but we lack a circuit-level understanding of how distinct components of this behaviour are orchestrated. Here we investigate how Galanin-expressing neurons in the medial preoptic area (MPOAGal) coordinate motor, motivational, hormonal and social aspects of parenting. These neurons integrate inputs from a large number of brain areas, whose activation depends on the animal’s sex and reproductive state. Subsets of MPOAGal neurons form discrete pools defined by their projection sites. While the MPOAGal population is active during all episodes of parental behaviour, individual pools are tuned to characteristic aspects of parenting. Optogenetic manipulation of MPOAGal projections mirrors this specificity, affecting discrete parenting components. This functional organization, reminiscent of the control of motor sequences by pools of spinal cord neurons, provides a new model for how discrete elements of a social behaviour are generated at the circuit level.
Main text
Although essential for survival at a multigenerational time scale, parental care entails sacrifices without immediate benefit for the caregiver, suggesting that this behaviour is driven by evolutionarily shaped, hard-wired neural circuits1,2. Parenting, like other naturalistic behaviours, comprises multiple coordinated components, such as specific motor patterns, an enhanced motivation to interact with infants, distinct hormonal states and often the suppression of other social activities such as mating. We aimed to exploit the recent identification of MPOAGal neurons as a key node in the control of parenting in mice3 to uncover organizational principles of associated neural circuits. We hypothesized that the function of MPOAGal neurons in parental behaviour requires integration of external signals, such as pup- and other environmental stimuli, with internal hormonal and metabolic information, as well as the ability to orchestrate motor, motivational, hormonal and social components of parenting.
Identity and activity of MPOAGal inputs
To determine brain-wide inputs into MPOAGal neurons, we used rabies virus-mediated retrograde trans-synaptic tracing4 (Fig. 1a), and found that MPOAGal neurons receive direct inputs from >20 areas in both sexes (Fig. 1b, c, Extended Data Fig. 1a and Extended Data Table 1). Presynaptic neurons within the MPOA itself provided the highest fractional input (~20%), while hypothalamic inputs accounted for ~60% of presynaptic neurons, suggesting extensive local processing (Fig. 1c). MPOAGal neurons also receive inputs from monoaminergic and neuropeptidergic modulatory areas, the mesolimbic reward system, pathways associated with pheromone-processing, and hypothalamic as well as septal areas involved in emotional states (Fig. 1c and Extended Data Fig. 1a). Inputs from the paraventricular hypothalamic nucleus (PVN), a key area for homeostatic and neuroendocrine control, were particularly abundant. Surprisingly, MPOAGal neurons did not receive direct inputs from oxytocin (OXT)-secreting PVN neurons (PVNOXT) implicated in parturition, lactation and maternal behaviour1,2,5, but rather from vasopressin-expressing PVN neurons (PVNAVP), associated with the modulation of many social behaviours6 and nest building7 (Fig. 1d). MPOAGal neurons also received inputs from AVP+, but not OXT+, neurons of the supraoptic nucleus (SON, Extended Data Fig. 1d). Input fractions were similar in males and females, with few exceptions (Fig. 1e, f and Extended Data Fig. 1a). MPOAGal neurons therefore appear anatomically poised to integrate external (sensory) as well as internal (modulatory) signals relevant to parenting in both sexes.
Figure 1. MPOAGal inputs are activated during parental behaviour in a sex- and reproductive state-specific manner.

a, Monosynaptic retrograde tracing from MPOAGal neurons. b, Input areas with rabies+ neurons. c, Overview of inputs into MPOAGal neurons. Hypothalamic input areas in bold. d, MPOAGal neurons receive monosynaptic inputs from magnocellular PVNAVP (37.6 ± 4.1% overlap, n = 3) but rarely PVNOXT (2.6 ± 0.6%, n = 3) neurons. e, Presynaptic neurons in AVPe are TH− in males (1.9% TH+, n = 2) and females (1.8% TH+, n = 3). f, Presynaptic neurons in AHPM. g, Identification of activated MPOAGal inputs and example of c-Fos+ presynaptic neurons. h–j, Activated input fractions in mothers (h), virgin females (i) and fathers (j) (each n = 6, controls n = 6). Green boxes, parent-specific activation, blue boxes, father- and virgin female-specific activation. Two-tailed t-tests (corrected for multiple comparisons, Methods), h: ***P < 0.0001, **P = 0.0267, *P = 0.0196, i: ***P < 0.0001, j: ***P < 0.0001, **P = 0.0035, *P = 0.0104. Data in h–j are mean ± s.e.m. n = number of animals in all figures. Scale bars, b, left, 500 μm, inset, 250 μm; d–g, 50 μm. Abbreviations, see Extended Data Table 1.
Next, we investigated MPOAGal input activation during parenting according to the animal’s sex and reproductive state. In laboratory mice, virgin females and sexually experienced males and females are parental, whereas virgin males typically attack and kill pups3,8,9. We combined rabies tracing with immunostainings for the activity marker c-Fos after parenting in primiparous females (‘mothers’), virgin females, and fathers (Fig. 1g) and compared the c-Fos+ fraction of input neurons between parental animals and non-pup-exposed controls (Fig. 1h–j). Local MPOA inputs were specifically activated during parenting in all groups (Fig. 1h–j), while activation of other inputs was sex- and state-dependent: in parents, but not virgin females, a subset of reward-associated and modulatory inputs were activated (Fig. 1h–j). Presynaptic neurons in pheromone processing pathways (medial amygdala, MeA; bed nucleus of the stria terminalis, BNST) were selectively activated in fathers and virgin females, but not in mothers (Fig. 1h–j). Since pup-directed aggression in virgin mice is pheromone-dependent3,8, the MeA-BNST pathway might remain partially active in sexually experienced males and parental virgin females, while fully silenced only in mothers. Intriguingly, the largest number of inputs was activated in fathers (Fig. 1j), and non-overlapping subsets of inputs were activated in mothers and virgin females (Fig. 1h, i). These results suggest that MPOAGal neurons perform different computations of inputs according to the animal’s sex and reproductive state.
Input-output logic of MPOAGal circuit
To identify MPOAGal projections and synaptic targets, we infected MPOAGal neurons with adeno-associated viruses (AAVs) encoding the fluorophore tdTomato as well as the presynaptic marker Syn-GFP (Fig. 2a and Extended Data Fig. 2a). MPOAGal neurons project to ~20 areas in males and females (Fig. 2b, c and Extended Data Fig. 2b). Many of these regions were previously shown to be involved in maternal behaviour by pharmacological manipulations and lesions, mainly in rats10 (Extended Data Table 2). Strikingly, this projection map largely overlaps with the input map defined above (Fig. 1c), revealing extensive reciprocal connectivity in parental circuits.
Figure 2. Identification of parenting-activated MPOAGal projections and input-output logic of the MPOAGal circuit.

a, Visualisation of MPOAGal projections. b, MPOAGal projections identified by tdTomato fluorescence. c, Relative synaptic density in MPOAGal projection targets (n = 4, Methods). Grey regions could not be quantified due to tissue autofluorescence. Hypothalamic target areas in bold. d, Monosynaptic retrograde tracing from PVN. e–g, MPOAGal neurons presynaptic to (e) PVNAVP (female 15/364 Gal+, n = 3; male 46/180 Gal+, n = 3) to (f) PVNOXT (female 26/71 Gal+, n = 3; male 7/51 Gal+, n = 3) and to (g) PVNCRH neurons (female 19/72 Gal+, n = 3; male 22/45 Gal+, n = 3). Significantly more MPOA neurons presynaptic to PVNAVP and PVNCRH were Gal+ in males than in females (P < 0.0001, P = 0.0170, two-tailed Fisher’s exact test) whereas more MPOA neurons presynaptic to PVNOXT were Gal+ in females than in males (P = 0.0068). h, Labelling strategy for MPOAGal projections; example of retrogradely labelled c-Fos+ neuron in the MPOA. i, Activated fraction of MPOAGal neurons projecting to parenting-relevant brain areas (n = 7, 4, 3, 4, 3, 4, 3, 4, 3, 4, 4, 4, from top). Data are mean ± s.e.m. Red line, population average (ref. 3). Projections chosen for further functional studies are highlighted. j, Strategy for monosynaptic retrograde tracing from projection-defined MPOAGal subpopulations. k, l, Map of monosynaptic inputs into VTA-projecting MPOAGal neurons (k) and matrix displaying inputs into projection-defined MPOAGal subpopulations (l, Methods; n = 5, 3, 4, 4, 4, 4, 5, 5, 4, 4, 3, from top). Tukey post-hoc test assessed whether candidate projections (blue) receive quantitatively different inputs; VTA vs. PAG: *P = 0.0205, PAG vs. PVN: ***P = 0.0002, all other comparisons: ***P < 0.0001. Scale bars, b, left, 500 and inset, 250 μm; e–g, h, 50 μm.
Among the areas most intensely labelled by Syn-GFP were PVN and anteroventral periventricular nucleus (AVPe) (Fig. 2c), both implicated in the control of parenting6,11. Using rabies tracing from molecularly defined PVN cell types (Fig. 2d), we found that MPOAGal neurons project to PVNAVP, PVNOXT and corticotropin-releasing hormone (CRH)-expressing PVN neurons (PVNCRH) in both sexes (Fig. 2e–g). Furthermore, MPOAGal→PVN connectivity appears sexually dimorphic, with more MPOAGal neurons projecting to PVNAVP and PVNCRH neurons in males and more MPOAGal neurons projecting to PVNOXT neurons in females (Fig. 2e–g). MPOAGal neurons might therefore exert control over parenting-promoting hormonal release in a sex-specific fashion.
Tyrosine-hydroxylase (TH)-expressing neurons in the AVPe were recently found to influence parenting in females via monosynaptic AVPeTH→PVNOXT connections11. Rabies tracing from MPOAGal or AVPeTH neurons showed that while MPOAGal neurons do not receive monosynaptic inputs from AVPeTH neurons (Fig. 1e), AVPeTH neurons do receive direct inputs from MPOAGal neurons in both sexes (Extended Data Fig. 2e, f). Thus, MPOAGal neurons might also influence OXT secretion via a disynaptic MPOAGal→AVPeTH→PVNOXT circuit (Extended Data Fig. 2g).
We next investigated the organization of MPOAGal projections, and their activity during parenting. Pairwise injections of the retrograde tracer cholera toxin subunit B (CTB) into MPOAGal projection targets revealed few double-labelled MPOAGal neurons (Extended Data Fig. 3a–c). Moreover, retrogradely labelled cell bodies from individual projections occupied characteristic, mostly non-overlapping zones in the MPOA (Extended Data Fig. 3f, g) and conditional tracing from individual projection areas identified only minor collaterals (Extended Data Fig. 4). These results suggest that MPOAGal neurons are organized in distinct pools, each projecting to largely non-overlapping target areas. To assess whether different MPOAGal pools, as defined by their projection sites, were equally activated during parenting, we used Cre-dependent, retrograde canine adenovirus (CAV) to label MPOAGal subpopulations projecting to regions previously implicated in parenting (12/22 projections, Extended Data Table 2) and quantified their activation in parental females (Fig. 2h). Fractions of c-Fos+ neurons differed widely between projections, ranging from >50% (PAG-projecting pool) to <10% (VMH-projecting pool, Fig. 2i). A similar distribution was found in parental fathers (Extended Data Fig. 2d).
Based on their high projection density (Fig. 2c), high activity during parenting (Fig. 2i) and potentially diverse contributions to this behaviour (Extended Data Table 2), we selected MPOAGal subpopulations projecting to PAG, MeA, VTA and PVN for further characterization. Gal+ neurons were ~2× more likely to project to most of these candidate areas than expected from their frequency in the MPOA (Extended Data Fig. 3d, e), supporting the hypothesis that these projections play prominent roles in the control of parenting.
We next aimed to determine whether projection-defined MPOAGal subpopulations receive selected inputs out of the ~20 identified upstream areas (Fig. 1c) or whether they uniformly integrate all inputs. We used a double-conditional approach in which rabies virus can only infect starter neurons projecting to an area of choice (Fig. 2j and Extended Data Fig. 5b–d)12. We found that MPOAGal projections integrate broad input combinations, with characteristic sets of enriched or depleted inputs (Fig. 2k, l). This is seen for PAG-, MeA-, PVN- and VTA projections, which receive similar, though quantitatively different, inputs (Fig. 2l). Notably, inputs from nucleus accumbens (NAc) and lateral septum (LS), areas involved in reward and emotional responses, respectively, were specifically enriched in VTA-projecting MPOAGal neurons (Fig. 2k, l). Together, these findings suggest a circuit architecture in which broad input combinations converge onto largely non-overlapping, projection-defined MPOAGal subpopulations. These subpopulations may in turn be differentially activated during parenting by integrating across quantitatively different sets of activated inputs.
Specific activity of MPOAGal pools
We next used fibre photometry (Fig. 3a, b)13,14 to investigate whether individual MPOAGal subpopulations are active during specific parenting steps. Conditional expression of the calcium reporter GCaMP6m in MPOAGal neurons was obtained by viral injection (Extended Data Fig. 6a) and an optical fibre implanted above the injection site (Extended Data Fig. 6b–d). The entire (‘pan-MPOAGal’) population displayed high activity during all pup-directed parenting episodes in mothers, virgin females and fathers (Fig. 3c–g and Supplementary Video 1), but not during non-pup-directed (nest building) or passive (crouching) parenting episodes (Fig. 3h, i). MPOAGal activation was stimulus-specific: interactions with adults resulted in minimal activity (Extended Data Fig. 6k, l). Moreover, orofacial motor actions similar to pup interactions did not activate MPOAGal neurons, confirming that the observed signals were not motion-related. The tuning of MPOAGal neurons during parenting was similar in all three groups (Fig. 3q) – highlighting their common role in the control of parental interactions. Activation during pup sniffing was higher in mothers than in virgin females and fathers (Fig. 3c), possibly reflecting the extraordinary sensitivity of postpartum females to pup stimuli (Extended Data Fig. 7)15. Further, activity decreased in mothers – but not in fathers – during eating, self-grooming and sniffing of food (Fig. 3j–l). MPOAGal neurons receive their second-largest fractional input from the arcuate nucleus (Arc), a feeding control centre16 (Fig. 1c and Extended Data Figure 1a), suggesting that inhibition from circuits controlling mutually exclusive motor patterns, such as eating and pup grooming, might cause this decrease in activity.
Figure 3. Distinct projection-defined MPOAGal neuronal pools are tuned to specific aspects of parental behaviour.

a, b, Fibre photometry recording strategy (a) and setup (b). c–i, Averaged recording traces from MPOAGal population activity during pup sniffing (c), -grooming (d), -retrieval (e), entering nest with pups (f), entering empty nest (g), nest building (h) and crouching (i). Mean peak activity (Z-scores) shown in mothers (n = 4), virgin females (n = 3) and fathers (n = 5). j–l, Averaged recording traces and mean peak activity during control behaviours. m, Strategy for recording projection-defined MPOAGal subpopulations. n–p, Mean peak activation for PAG- (n, n = 10), VTA- (o, n = 12) and MeA- (p, n = 8) projections during parenting. q, Tuning matrix for pan-MPOAGal (upper) and projection-specific (lower) recordings. Two-tailed t-tests (Methods), c: ***P < 0.0001, ***P < 0.0001, P = 0.0001, d: ***P < 0.0001, e: ***P < 0.0001, ***P = 0.0008, 0.0004, f: ***P < 0.0001, *P = 0.0247, g: *P = 0.0185, 0.0365, 0.0105, j: ***P = 0.0002, ***P < 0.0001, k: **P = 0.0059, n: *P = 0.0362, p: *P = 0.0102, ***P < 0.0001, ***P = 0.0001. Data are mean ± s.e.m.
To record the activity of projection-defined MPOAGal subpopulations, we injected MPOAGal target areas with a Cre-dependent, GCaMP6-expressing herpes simplex virus (HSV) and implanted an optical fibre above the retrogradely labelled cell bodies (Fig. 3m and Extended Data Fig. 6e–h). PAG-projecting MPOAGal neurons were specifically activated during pup grooming (Fig. 3n and Extended Data Fig. 6m–q), while MeA-projecting MPOAGal neurons were active during most episodes of parental behaviour (Fig. 3p and Extended Data Fig. 6m–q), indicating a more general role in parenting. Consistent with their weak c-Fos activation after parenting (Fig. 2i), no significant activity changes were detected in VTA-projecting MPOAGal neurons (Fig. 3o and Extended Data Fig. 6m–p). Nevertheless, MPOAGal→VTA neurons were weakly responsive during nest entering in a subset of animals (Fig. 3o and Extended Data Fig. 6q; 4/12 mice), potentially reflecting the expectation or drive to interact with pups. Altogether, these findings support the notion that MPOAGal neurons form functionally distinct modules tuned to specific parenting episodes.
Functionally distinct MPOAGal pools
We tested this hypothesis by optogenetically activating PAG-, VTA- and MeA projections during pup interactions (Fig. 4a). We virally expressed channelrhodopsin-2 (ChR2) in MPOAGal neurons (Extended Data Fig. 8a), and implanted optical fibres above MPOAGal projection targets. Optogenetic activation of PAG projections did not affect the fraction of parental virgin females but suppressed pup attacks in infanticidal virgin males (Fig. 4b), and – consistent with MPOAGal→PAG activity during parenting (Fig. 3n) – increased pup grooming and pup-directed sniffing bouts in both sexes (Fig. 4c and Extended Data Fig. 8c). Next, we assessed the motivation to interact with pups by inserting a climbable barrier in the home cage between the test animal and pups (Fig. 4d). MPOAGal→PAG activation had no effect on the number of barrier crosses (Fig. 4d). Importantly, the effects of MPOAGal→PAG activation were specific to pup interactions, and did not affect interactions with adult conspecifics (Fig. 4e, f).
Figure 4. MPOAGal projections mediate discrete aspects of parental behaviour.

a, Setup for optogenetic manipulations. b, g, l, Activation of MPOAGal projections (left); pup-directed behaviour in virgin females and males without (‘OFF’) or with (‘ON’) activation of PAG- (b), VTA- (g) and MeA- (l) projections. c, h, m, Effect of activating PAG- (c), VTA- (h) or MeA- (m) projections on pup grooming (virgin females, n = 13, 9, 10; males, n = 9, 10, 10). d, i, n, Motivation assay (d) and effect of activating PAG- (d), VTA- (i) or MeA- (n) projections on barrier crossing (virgin females, n = 13, 10, 10; males, n = 13, 10). e, j, o, Intruder assay (e) and effect of activating PAG- (e), VTA- (j) or MeA- (o) projections on male-male aggression. f, k, Effect of MPOAGal→PAG (f) or MPOAGal→VTA (k) activation on male- (n = 12, 9) or female-directed (n = 10, 10) behaviour. p, Effect of MPOAGal→MeA activation on male-directed attack latency (n = 10) and chemoinvestigation (n = 10). q, t, w, Inhibition of MPOAGal projections. r, u, x, Pup-directed behaviour in virgin females without (‘OFF’) or with (‘ON’) inhibition of PAG- (r, n = 10), VTA- (u, n = 10) and MeA- (x, n = 11) projections. s, Effect of MPOAGal→PAG inhibition on pup grooming (n = 10). v, Effect of MPOAGal→VTA inhibition on barrier crossing (n = 10). y, Effect of MPOAGal→MeA inhibition male-directed chemoinvestigation (n = 11). Chi-square (b, e, g, j, l, o, r, u, x) or two-tailed paired t-tests (c, d, f, h, i, k, m, n, p, s, v, y), b: **P = 0.0034, c: *P = 0.0273, 0.0374, i: **P = 0.0089, 0.0056, o: *P = 0.0246, p: *P = 0.033, 0.0109, s: *P = 0.0396, v: **P = 0.0038.
By contrast, activation of MPOAGal→VTA projections did not affect pup interactions (Fig. 4g, h), but increased barrier crossing in both sexes (Fig. 4i and Supplementary Video 2), indicating an increase in the motivation to interact with pups. Interestingly, virgin males still exhibited pup-directed aggression after crossing the barrier, suggesting that this effect is not contingent upon the display of parenting. Nevertheless, in naturalistic situations, MPOAGal neurons and associated VTA projections are activated exclusively during parental interactions, thus specifically mediating parental drive. MPOAGal→VTA activation did not increase locomotion (Extended Data Fig. 8j, k) and did not affect interactions with intruders of either sex (Fig. 4j, k).
Finally, activation of MPOAGal→MeA projections neither affected pup-directed behaviours (Fig. 4l, m and Extended Data Figure 7f, g) – except for a decrease in females in time spent in nest (Extended Data Fig. 8f) – nor the motivation to interact with pups (Fig. 4n). However, this manipulation significantly inhibited male-male aggression and chemoinvestigation of a male intruder in females (Fig. 4o, p). Thus, rather than directly influencing parental behaviour, MPOAGal→MeA activation inhibits social interactions with adult conspecifics.
We tested the necessity of these subpopulations for discrete behaviours by expressing the inhibitory opsin eNpHR3.0 in MPOAGal neurons and stimulating their projections in virgin females (Fig. 4q, t, w). In accordance with ChR2 data, optogenetic inhibition of MPOAGal→PAG projections significantly reduced pup grooming and pup-directed sniffing bouts (Fig. 4s and Extended Data Fig. 8n), without affecting other behaviours (Fig. 4r and Extended Data Fig. 8n–p, u). In contrast, inhibition of MPOAGal→VTA projections specifically reduced barrier crossing frequency (Fig. 4v, u and Extended Data Fig. 8q, r, v), except for a reduction in time spent in nest (Extended Data Fig. 8q). Finally, inhibition of MPOAGal→MeA projections did not affect interactions with an intruder (Fig. 4y) or other behaviours (Fig. 4× and Extended Data Fig. 8s, t, w). Recent findings indicate that representations of social stimuli in MeA and hypothalamic centres change significantly after sexual experience17,18. Thus, low basal activity in this circuit branch in virgin females compared to mothers may preclude further inhibition. Alternatively, or additionally, this lack of effect may result from a more complex role of MPOAGal→MeA connectivity.
Concluding remarks
Altogether, our data suggest that distinct MPOAGal pools control discrete aspects of parental behaviour in both sexes (Fig. 5): (1) Consistent with a role of the PAG in motor aspects of maternal behaviour2, MPOAGal→PAG projections promote pup grooming. Retrograde tracing from PAG showed that MPOAGal neurons synapse with GABAergic (inhibitory), but not glutamatergic (excitatory) PAG neurons (Extended Data Fig. 2h–j). Since the vast majority (~90%) of MPOAGal neurons are GABAergic3, pup grooming is likely elicited by disinhibition in the PAG. Indeed, PAG infusion of the GABAA receptor antagonist bicuculline increases pup licking and grooming19. (2) In contrast, MPOAGal→PAG projections specifically influence the motivation to interact with pups without affecting the quality of adult-infant interactions. This is consistent with the postulated role of the VTA in motivation20 and social reinforcement21, and complements previous findings in rats2,22. Nearby Gal+ neurons in the lateral hypothalamus promote food-seeking behaviour, despite lacking VTA-projections23, further highlighting the specific role of MPOAGal neurons in parenting. (3) Finally, we found that MPOAGal→MeA projections do not directly influence pup-directed behaviour but rather inhibit potentially competing adult social interactions. Interestingly, MPOAGal→MeA neurons are active during most episodes of parenting (Fig. 3p, q), suggesting that the entire behaviour, rather than specific parenting components, are broadcast by this projection to influence the vomeronasal pathway24–26. Specific inhibitory feedback from MPOAGal neurons to MeA might impair the detection, or alter the valence, of non-pup-related social stimuli. Indeed, optogenetic stimulation of glutamatergic neurons in the posteriodorsal MeA – the MeA compartment most densely innervated by MPOAGal fibres (Fig. 2b) – has been shown to suppress interactions with adult conspecifics27. The projections investigated here mediate crucial, non-overlapping aspects of parental behaviour and the sum of their activity profiles matches that of the entire MPOAGal population (Fig. 3q). Thus, combined with the finding that MPOAGal neurons contact AVP-, OXT- and CRH-expressing PVN neurons (Fig. 2e–g), we have dissected circuit branches for four major – motor, motivational, social and neuromodulatory – aspects of parenting control. Other MPOAGal projections not included here may play additional roles in parenting. Lastly, our tracing data suggest extensive connectivity within the MPOA (Fig. 1c), hinting at interactions between functionally specialized MPOAGal subpopulations.
Figure 5. Functional architecture of the MPOAGal circuit.
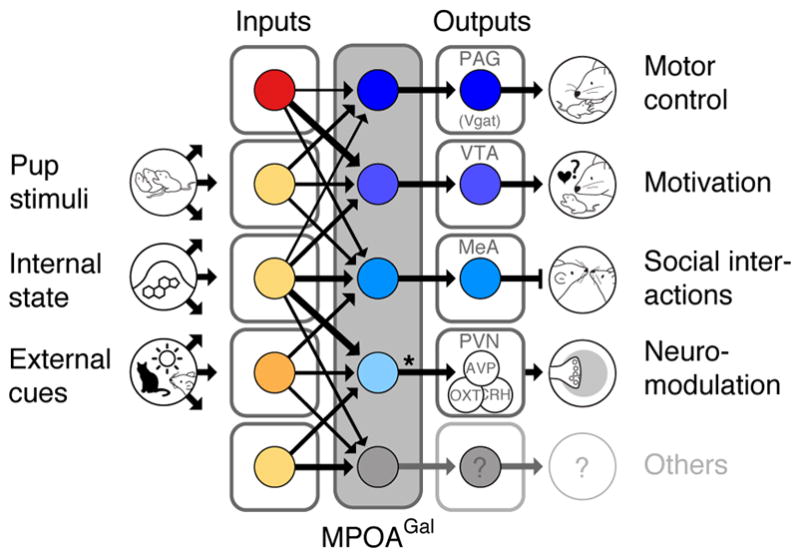
Broad, state- and sex-specifically activated inputs converge onto largely non-overlapping, projection-defined MPOAGal subpopulations that elicit specific aspects of parental behaviour. Asterisk, MPOAGal→PVN connections are sexually dimorphic (see Fig. 2e–g).
Considerable progress has recently been made in identifying neuronal populations controlling specific social behaviours or homeostatic functions10,16,28–31. However, little is known about how these multi-component behaviours or functions are orchestrated at the circuit level. Intriguingly, the modular architecture uncovered here for the control of parenting is reminiscent of the motor circuit motif identified in the mammalian spinal cord, where discrete phases of locomotor sequences are controlled by functionally distinct neuronal pools with highly specific connectivity patterns32. Whether other social behaviours rely on similar circuit architecture remains to be determined.
Methods
Animals
The Gal::Cre BAC transgenic line (STOCK Tg(Gal-cre)KI87Gsat/Mmucd, 031060-UCD) was imported from the Mutant Mouse Regional Resource Center and is described in ref. 3. Cre-dependent tdTomato reporter mice (Gt(ROSA)26Sortm9(CAGtdTomato)Hze)33, C57BL/6J, Oxt-ires-Cre, Vgat-ires-Cre and TH-ires-Cre mice were obtained from Jackson Laboratories. Vglut2-ires-Cre mice were provided by B. Lowell. The Avp-ires-Cre line is described in ref. 7. Crh-ires-Cre mice were obtained from B. Lowell, J. Majzoub and Jackson Laboratories. Animals were maintained on 12 h:12 h light/dark cycle (lighted hours: 02:00 – 14:00) with food and water available ad libitum. Animal care and experiments were carried out in accordance with the NIH guidelines and approved by the Harvard University Institutional Animal Care and Use Committee (IACUC).
Histology and immunostaining
Animals were perfused transcardially with phosphate buffered saline (PBS) followed by 4% paraformaldehyde (PFA) in PBS. Brains were dissected and post-fixed in 4% PFA for 16 h, then washed in PBS for 6 h. After embedding in 4% low melting point agarose (Thermo Fisher Scientific, 16520-050) in PBS, 60 μm coronal sections were cut on a vibratome (Leica) and mounted on Superfrost Plus slides (VWR, 48311-703) with DAPI-containing Vectashield mounting medium (Vector Laboratories, H-1200). For immunostaining in 48-well culture plates, sections were permeabilized for 30 min in PBS-T (0.3% Triton X-100 in PBS), post-fixed with PFA for 10 min, and washed in PBS-T (3 × 20 min). Blocking was o/n in blocking buffer (0.3 Triton X-100, 1% BSA, 2% normal donkey serum in PBS). Incubation with primary antibodies was performed for 24 – 48 h on a nutator at 4°C. After washing in PBS-T (5 × 60 min), secondary antibodies were added for 48 h at 4°C. After final washes in PBS-T (5 × 60 min), sections were mounted. Primary antibodies: goat anti-c-Fos (Santa Cruz, sc-52) 1:500, chicken anti-GFP (Abcam, ab13970) 1:1,000, rabbit anti-AVP (Immunostar, 20069) 1:6,000, rabbit anti-OXT (Immunostar, 20068) 1:6,000. Secondary antibodies (all from Thermo Fisher): Alexa-568 anti-goat (A-11057) 1:1,500, Alexa-555 anti-goat (A-21432) 1:1,500, and Alexa-647 anti-goat (A-21447) 1:1,500. All antibodies were incubated in PBS-T, with the exception of c-Fos antibody, which was incubated in PBS.
RNA in situ hybridization
Freshly dissected brains were embedded in OCT (Tissue-Tek, 4583) and frozen with dry ice. 16 μm cryosections were collected on Superfrost Plus slides (VWR, 48311-703) and used for mRNA in situ hybridization. Fluorescent mRNA in situ hybridization was performed largely as described24. Complementary DNA (cDNA) of Gal or EYFP mRNA was cloned in approximately 800-base-pair segments into pCRII-TOPO vector (Thermo Fisher, K465040). Antisense complementary RNA (cRNA) probes were synthesized with T7 (Promega, P2075) or Sp6 polymerases (Promega, P1085) and labelled with digoxigenin (DIG, Roche 11175025910) or fluorescein (FITC, Roche 11685619910). Hybridization was performed with 0.5 – 1.0 ng ml−1 cRNA probes at 68°C. Probes were detected using horseradish peroxidase (POD)-conjugated antibodies (anti-FITC-POD, Roche 11426346910, 1:250; anti-DIG-POD, Roche 11207733910, 1:500). Signals were amplified using biotin-conjugated tyramide (Perkin Elmer NEL749A001KT) and subsequently visualized with Alexa Fluor 488-conjugated streptavidin (Thermo Fisher, S11223), or the TSA-plus Cy3 system (Perkin Elmer, NEL744001KT).
Viruses
Recombinant AAV vectors were produced by the UNC Vector Core. AAV titres ranged from 1.3 to 2.6 × 10¹² viral particles ml−1, based on quantitative PCR analysis. Pseudotyped, G-deleted rabies virus4 was obtained from the Salk vector core at a titre of 4.3 × 10⁸ viral particles ml−1. The pAAV-CAG-FLEx-Syn-GFP plasmid was kindly provided by Silvia Arber (Friedrich Miescher Institute, Basel) and AAV1/CAG-FLEx-Syn-GFP was produced by the UNC Vector Core. The pAAV-CAG-FLEx-TCB, pAAV-CAG-FLEx-RG34, pAAV-CAG-FLExFRT-TC and pAAV-CAG-FLExFRT-RG plasmids were provided by Liqun Luo (Stanford University), and AAV5/DJ-hSyn1-FLExFRT-mGFP35; AAV1/CAG-FLExFRT-TC and AAV1/CAG-FLExFRT-RG were packaged by the UNC Vector core. Liqun Luo and Eric Kremer (IGMM, Montpellier) provided CAV2-FLExloxP-Flp. Larry S. Zweifel (University of Washington) provided CAV2-FLEx-ZsGreen. AAV1/CAG-FLEx-tdTomato, AAV1/Syn-FLEx-GCaMP6m, AAV5/EF1α-DIO-hChR2(H134R)-EYFP and AAV5/EF1α-DIO-EYFP were purchased from UPenn Vector core. HSV-hEF1α-LSL1-GCaMP6m (HT) was obtained from MIT Vector Core.
Anterograde tracing
Anterograde tracing experiments were performed in Gal::Cre mice (or in C57BL/6J for control experiments) at ~8–12 weeks of age. All surgeries were performed under aseptic conditions in animals anesthetized with 100 mg kg−1 ketamine (KetaVed, Vedco) and 10 mg kg−1 xylazine (AnaSed) via intra-peritoneal (i.p.) injection. Using a Nanoject II injector (Drummond Scientific), 300 nl of a 1:1 mixture of AAV1/CAG-FLEx-tdTomato and AAV1/CAG-FLEx-Syn-GFP36 (Synaptophysin-GFP) was injected into the MPOA (coordinates: AP: 0.0, ML: −0.5, DV: −5.05 mm) to visualize presynaptic terminals of MPOAGal neurons. Syn-GFP was chosen to distinguish presynaptic sites from fibres of passage. Analgesia (buprenorphine, 0.1 mg kg−1, i.p.) was administered for 2 d following each surgery. Two weeks later mice were sacrificed and dissected. In some experiments, a 1:1 mixture of AAV1/CAG-FLEx-tdTomato and AAV1/CAG-FLEx-Syn-GFP was injected to visualize presynaptic terminals of MPOAGal neurons. For quantification of synaptic density, the average pixel intensity in a target region containing presynaptic GFP+ punctae was calculated and background-subtracted. Since injections were unilateral and no labelling was observed in most cases contralaterally, the equivalent region on the contralateral hemisphere was chosen for background subtraction; in cases where contralateral GFP+ punctae were present, an adjacent unlabelled region was chosen. Background-corrected intensities were normalized to the average pixel intensity at the MPOA injection site for each brain.
Trans-synaptic retrograde tracing
Input tracing experiments were performed in Gal::Cre mice (or C57BL/6J in control experiments) at ~8–12 weeks of age. We injected 150 – 200 nl of a 1:1 mixture of AAV1/CAG-FLEx-TCB and AAV1/CAG-FLEx-RG unilaterally into the MPOA. Two weeks later, 450 – 600 nl EnvA-pseudotyped, RG-deleted, GFP-expressing rabies virus (EnvA-ΔG-rabies) was injected into the MPOA. After recovery, mice were housed in a biosafety-level-2 (BL2) facility for 4 d before sacrificing. Relative input strength was quantified as follows from brain sections: every second 60 μm section was imaged and cells were counted using the ImageJ CellCounter plugin. GFP+ cells on the injected hemisphere were counted and assigned to brain areas based on classifications of the Paxinos Mouse Brain Atlas (3rd edition), using anatomical landmarks in the sections visualized by DAPI staining and tissue autofluorescence. In addition, all contralateral and non-assigned GFP+ cells were counted to obtain the total number of GFP+ cells. We then quantified the number of ipsilateral mCherry+ starter neurons per brain area and the total number of starter neurons. Since starter neurons are both GFP+ and mCherry+, while presynaptic neurons are only GFP+, the total number of starter neurons was subtracted from the total number of GFP+ neurons to obtain the total number of presynaptic neurons within the MPOA. Finally, the relative input fraction for each area was determined by dividing the number of presynaptic neurons detected in that brain area by the total number of presynaptic neurons in a given brain. Injection of starter AAVs and EnvA-ΔG-rabies into the MPOA of C57BL/6J mice did not result in detectable background labelling (Extended Data Fig. 5a). Inputs from PAG were detected only in a subset of animals. Presynaptic AVP+ neurons in the PVN were identified as predominantly magnocellular based on cell body size37,38 and -position39. Presynaptic neurons in the MPOA (Fig. 2d–g and Extended Data Fig. 2e–j) were identified as Gal+ by in situ hybridization.
Lateralisation effects
Retrograde and anterograde tracing experiments were performed in the right hemisphere. However, a recent study found that OXT receptor is more highly expressed in the left auditory cortex of females and that OXT binding there is crucial for pup retrieval5. We therefore investigated potential lateralisation effects by tracing from MPOAGal neurons in the left hemisphere. Resulting presynaptic neuron numbers and projection patterns (Extended Data Figs. 1b, 2c) were indistinguishable from those obtained after right-hemispheric tracing, suggesting that anatomical lateralisation is not a dominant feature of the subcortical circuits described here.
Projection-specific trans-synaptic retrograde tracing
For projection-specific trans-synaptic retrograde tracing (cTRIO)12, 300 – 500 nl of CAV2-FLExloxP-Flp was injected into identified target areas of MPOAGal neurons (coordinates, see Extended Data Table 1) in 8 – 12 week old Gal::Cre animals. During the same surgery, 300 – 600 nl of a 1:1 mixture of AAV1/CAG-FLExFRT-TC and AAV1/CAG-FLExFRT-RG12 (starter AAVs) was injected into the MPOA. This combination of Cre-dependent, Flp-expressing CAV and Flp-dependent starter AAVs renders MPOAGal neurons projecting to a specific target area susceptible to subsequent infection with G-deleted, EnvA-pseudotyped rabies virus. Two weeks later, 450 – 500 nl of EnvA-ΔG-rabies was injected into the same MPOA coordinate. After recovery, mice were housed in a biosafety-level-2 (BL2) facility for 4 d before sacrificing. Injection of starter AAVs without CAV did not result in expression (Extended Data Fig. 5b, c). However, since injection of all cTRIO tracing viruses into C57BL/6J mice resulted in background expression near the injection site (Extended Data Fig. 5d), the following areas were excluded from analysis: MPOA, BNST, AH, PVN and SON. This background labelling is likely due to low levels of Cre- or Flp-independent expression of TVA-mCherry and RG12.
We quantified the connectivity of each MPOAGal projection to its inputs using a multinomial regression model (response: neuron counts in each input area, factors: MPOAGal projections). The baseline category in the model was represented by the mean input fraction across all experiments. Reported effects are therefore relative to a randomly chosen projection and the P values reported in Fig. 2k, l are obtained from a normal distribution where the Z-scores are the effects of the multinomial regression divided by their corresponding standard errors. In order to test for differences in the multinomial distribution of input to target region projections, the least-square means from the multinomial regression model was computed using the lsmeans package in R and used to run all pairwise comparisons.
MPOAGal input activity screen
To determine which fraction of MPOAGal inputs is activated during parental behaviour, viral injections were performed as described in ‘Trans-synaptic retrograde tracing’. Animals were single-housed until behavioural testing 4 d later with two pups (see ‘Parental behaviour assay’). For the equivalent experiments in mothers and fathers, 8 – 12 week old Gal::Cre males and females were paired up 10 d before injection of starter viruses and returned to their home cage where they remained until 3 d after injection of EnvA-ΔG-rabies when either the father and litter (for testing of mothers) or the mother and litter (for testing of fathers) were removed from the home cage. Parents underwent behavioural testing on the following day, i.e. 4 d after injection of EnvA-ΔG-rabies. Typically ~80% of virgin females and >90% of mothers and fathers were parental. 90 min after onset of retrieval, mice were deeply anesthetized with isoflurane and rapidly perfused transcardially with 30 ml of ice-cold PBS, followed by 30 ml of ice-cold PFA (4% in PBS). Brains were dissected and post-fixed in PFA (4% in PBS) at 4 °C for 16 h. On the next day, brains were rinsed with cold PBS and 60 μm coronal sections were prepared with a vibratome (Leica VT1000 S). Sections were further post-fixed in PFA (4% in PBS) at room temperature for 10 min and immunostainings against c-Fos were performed (see ‘Histology and immunostaining’). Only brains from mice that performed all steps of pup-directed parental behaviour (sniffing, retrieval, grooming, licking, crouching) were processed. Animals that were habituated in the test arena but not exposed to pups served as negative controls. Unpaired t-tests were used to assess activation of input areas between parental and control animals and P values were adjusted for multiple comparisons using the Benjamini-Hochberg method (false-discovery rate, FDR < 0.05).
Previous studies have reported that the basic properties of ΔG-rabies –infected neurons are not altered until 7 d post-infection40,41 and likewise, effects of rabies on (transgene) expression levels have only been reported 7 d after infection42. Since animals were tested and perfused 4 d after rabies infection in our study, neuronal physiology and c-Fos activation should be largely unaffected. Because we reliably observed c-Fos immunostaining in rabies+ neurons (Fig. 1g–j), rabies infection per se does not preclude activity-dependent c-Fos expression after 4 d. However, rabies infection could theoretically upregulate c-Fos expression in infected neurons, resulting in an overestimation of activated input neurons in our data set. In order to address this possibility, we compared c-Fos+ cell numbers in the MPOA of unilaterally rabies-injected mothers between the injected (ipsilateral) and the non-injected (contralateral) hemisphere (Extended Data Fig. 1c, upper). We found that numbers of c-Fos+ neurons were not significantly different between hemispheres (Extended Data Fig. 1c, lower; P = 0.43; paired t-test; n = 6). Therefore, rabies infection is unlikely to strongly affect c-Fos+ expression in our experimental paradigm.
MPOAGal projection activity screen
In order to determine the activation of individual MPOAGal projections during parental behaviour, 300 – 500 nl of CAV2-FLEx-ZsGreen was injected into identified MPOAGal target areas in 8 – 12 week old Gal::Cre females. Animals were single-housed one week after injection. Behavioural testing with two pups (see Parental behaviour assay’) was performed three weeks after injection to allow for efficient retrograde transport of the virus. For the equivalent experiments in fathers, 8 – 10 week old Gal::Cre virgin males were individually paired up with females for 4 d, injected and subsequently returned to the female. 2 – 3 d after pups were born (~3 weeks after injection), and 1 d before testing, the female and pups were removed from the cage. Testing, brain collection and immunostaining was performed as described in ‘MPOAGal input activity screen’. Since MPOAGal neurons are not activated in non-pup-exposed mice3, negative controls were not performed in these experiments.
Axon collateralization experiments
In order to assess axon collateralization of MPOAGal neurons (Extended Data Figure 4), Gal::Cre mice received injections of 300 – 500 nl of CAV-FLExloxP-Flp into an MPOAGal target site (coordinates, see Extended Data Table 1), and of 600 nl of AAV5/hSyn1-FLExFRT-mGFP into the MPOA. Mice were sacrificed 8 weeks later and the signal was amplified by anti-GFP immunostaining.
CTB tracing
Mice expressing tdTomato in Gal+ neurons (Gal::Cre+/−; loxP-Stop-loxP-tdTomato+/−) received pairwise injections of 50 – 100 nl of 0.5% (wt/vol) fluorescently labelled cholera toxin B subunit (CTB-488, Thermo Fisher C22841, CTB-647, Thermo Fisher C34778). After 7 d, brains were collected, fixed and 60 μm sections prepared. Individual sections were fixed again in 4% PFA for 10 min. The fraction of double-labelled, tdTomato+, Gal+ neurons in the MPOA was quantified. In control experiments, a 1:1 mixture of CTB-488 and CTB-647 was injected into MeA or PAG.
Imaging and image analysis
Samples were imaged using an Axio Scan.Z1 slide scanner (Zeiss), and confocal stacks were acquired on an LSM 880 confocal microscope (Zeiss). Image processing was performed using custom routines for the Fiji distribution of ImageJ. For most tracing experiments, every second section was imaged, with the exception of MPOAGal projection activity and CTB tracing experiments, where every MPOA-containing section was imaged and analyzed.
Parental behaviour assay
Before behavioural testing animals were housed individually for 5 – 7 d unless otherwise specified. Experiments started at the beginning of the dark phase and were performed under dim red light. Testing was performed in the home cage (with the exception of locomotion assays, see below) and preceded by a 30 min habituation period. Two 1 – 4 d old C57BL/6J pups were placed in different corners opposite the nest. Once retrieval occurred, a timer was started. Each test was recorded using a multi-camera surveillance system (GeoVision GV-1480) and behaviours were scored by an individual blind to the genotype using the Observer 5.0 or XT 8 software (Noldus Information Technology).
Fibre photometry
Fibre photometry (fluorometry) was performed as previously described43. For photometry recordings, 8 – 12 week old Gal::Cre+/−; loxP-Stop-loxP-tdTomato+/− mice were used. For pan-MPOAGal recordings, 400 – 500 nl of AAV1/Syn-FLEx-GCaMP6m (Upenn Vector Core) was injected into the MPOA; for projection-specific recordings, 600 – 700 nl of hEF1α-LS1L-GCaMP6m, a Cre-dependent, retrograde, long-term Herpes Simplex Virus (LT-HSV) was bilaterally injected into MPOAGal target areas. During the same surgery, a custom 400 μm fibre-optic cannula (Doric Lenses) was implanted into the MPOA (for coordinates, see Extended Data Table 1). For recordings in mothers and fathers, animals were paired up 5 d before surgery, to ensure that pups were born ~3 weeks after virus injection. One day after surgery, animals were returned to their mating partner. The implanted animal’s mating partner and offspring were removed 3 – 5 h prior to recordings. Virgin female mice were single-housed 7 d before the first recording session and thereafter between experiments. Recordings were made 2 – 4 weeks after the surgery under IR illumination in the mouse’s home cage. Mice were briefly (~10 min) habituated in the recording setup before 8 – 10 pups (1 – 4 d old) were introduced into the cage. Recording sessions typically lasted 10 – 20 min, with at least 2 d between sequential recordings. The implant was coupled to a custom patch cord (Doric Lenses) to simultaneously deliver 473 nm excitation light from a DPSS laser (Opto Engine LLC, UT, USA), passed through a neutral density filter (4.0 optical density, Thorlabs, NJ, USA), and to collect fluorescence emission. Activity-dependent fluorescence emitted by cells in the vicinity of the implanted fibre tip was collected by a 0.65 NA microscope objective (Olympus), spectrally separated from the excitation light using a dichroic mirror (Chroma, NY, USA), passed through a band pass filter (ET500/50, Chroma) and focused onto a photodetector (FDS10×10, Thorlabs) connected to a current preamplifier (SR570, Stanford Research Systems). Another band pass filter (ET600/20) in front of a second photodetector/preamplifier was used to collect tdTomato fluorescence. Due to considerable bleed-through of the GCaMP signal into the tdTomato channel, we chose not to use the tdTomato recording trace to normalize our data, instead opting for a set of behavioural controls for motion artifacts (see below). The preamplifier output voltage signal was collected by a NIDAQ board (PCI-e6321, National Instruments) connected to a computer running LabVIEW (National Instruments) for signal acquisition. Video recordings were acquired at 15 frames per second and the signal from the optical fibre was sampled at 1 kHz. A TTL-triggered photodiode next to the cage was used to align videos and voltage recording traces.
Analysis was performed using custom Matlab (MathWorks) routines. Only recordings with a stable baseline were included in our analysis. The raw signal over each entire recording session was divided by the mean of a Gaussian fit to the distribution of GCaMP to normalize the baseline over the recording session. Since the increase in GCaMP signal preceded even detection in some cases (e.g. see Fig. 3c), Z-scores were calculated using the period −5 to −2 s prior to event detections as baseline and 0 to 3 s from event detection as signal. Statistical analyses (i.e. t-tests, ANOVA) considered a value of p ≤ 0.05 significant. Behaviours were scored manually off-line by an experimenter blind to the photometry recording data. The responses to a stimulus type within a session (typically 5 – 10 trials per behaviour type) were averaged, and these session averages across mice were used as data displayed in Figures 3 and Extended Data Figure 6.
We performed a set of behavioural controls in order to address the possible contribution of motion artifacts to the recorded signal. In all of the following cases, (orofacial) motor actions highly identical to pup interactions did not result in detectable increases in GCaMP fluorescence intensity: (1) No increase in signal was observed when animals retrieved or sniffed a pup-sized cracker (Fig. 3j), during eating (Fig. 3k) or during self-grooming (Fig. 3l). In addition, (2) No increase in signal was detectable when animals retrieved bedding material to the nest (Fig. 3h), and (3) chemoinvestigation of accessible vs inaccessible pups resulted in different GCaMP responses (-5 to 0 s period before sniffing, Extended Data Fig. 6i, j). Therefore, the increases in signal intensity observed during pup interactions very likely represent actual activity changes rather than motion artifacts.
Optogenetics
Gal::Cre mice 8 – 12 weeks of age were used in these experiments. Since potential increases in parental behaviour would be difficult to detect in already highly parental mothers and fathers, we performed these experiments in virgin animals, in which a higher dynamic range of parental interactions can be assessed. Animals were exposed to two pups in their home cage (see ‘Parental behaviour assay’) and those that attacked (virgin males) or initiated parental behaviour (virgin females) within 15 min were selected for surgery. We injected 700 nl of AAV5/EF1α-DIO-hChR2(H134R)-EYFP (activation) or AAV5/EF1α-DIO-eNpHR3.0-EYFP (inhibition) bilaterally into the MPOA and in the same surgery a dual fibre – cannula (300 μm, 0.22 NA, Doric Lenses) was implanted 0.4 – 0.5 mm above the respective MPOAGal projection target (Extended Data Table 1) and affixed to the skull with dental cement. Mice were tested 3 – 5 weeks after injection to allow for efficient expression of ChR2 or eNpHR3.0 into axon terminals. On testing day, the implant was connected to an optical fibre attached to either a 473 nm laser (150 mW, Laserglow Technologies) or a 460 nm LED (~50 W, Prizmatix) for optogenetic activation, or a 589 nm laser (300 mW, Opto Engine LLC) for inhibition, via a commutator. Animals were tested in either stimulation or non-stimulation trials in randomized order, with 2 d between trials. In addition, the order in which animals were tested during each experimental session was randomized. In pup exposure experiments, two C57BL/6J pups 1 – 3 d of age were introduced to the test animal’s home cage in each corner furthest from the nest after 10 min of habituation. For activation experiments, blue light (473 nm) was delivered in 20-ms pulses at 20 Hz for 1 – 4 s whenever the animal contacted a pup with its snout. The light power exiting the fibre tip was 5 mW, which we calculated as providing an irradiance of 5 – 10 mW/mm−2 at the target region (using the brain tissue light transmission calculator provided by the Deisseroth laboratory, http://www.stanford.edu/group/dlab/cgi-bin/graph/chart.php). For loss-of-function experiments, constant yellow light (589 nm) was delivered at 8 – 10 mW at the fibre tip, amounting to an estimated irradiance of 15 – 20 mW/mm−2 at the target. Each trial lasted up to 10 min but when virgin males attacked and wounded a pup, the trial was ended and the pup was euthanized.
The following behaviours were scored and quantified: pup sniffing, -grooming and -licking, pup retrieval to the nest, aggression (animal grabs the pup violently and attempts to bite), crouching (animal hovers above the pup in the nest), nest building and time spent in the nest. For the motivation assay, following a 10 min habituation period a transparent barrier was inserted into the home cage, dividing the cage into a nest and a pup compartment. Next, 4 – 5 pups were introduced into the pup compartment and 473 nm light was delivered in 20-ms pulses at 20 Hz for 4 s every 10 s for a total of 6 min. Locomotion was assessed in a 36 × 25 cm arena over a period of 5 min. In stimulation trials, 473 nm light (20 ms, 20 Hz) was delivered to the implant for 4 s every 20 s, equivalent to the stimulation administered during a typical pup interaction trial. The position of the animal was tracked and analyzed by Ethovision XT 8 software (Noldus) to calculate the average velocity and moved distance. For intruder assays, an 8 – 12 week old C57BL/6J intruder of the opposite sex (receptive virgin female, as determined by vaginal smear, or sexually experienced male) was introduced into the resident mouse cage and 473 nm light was delivered in 20 ms pulses at 20 Hz for 1 – 4 s whenever the animal contacted the intruder with its snout. Sniffing and grooming duration were scored over a period of 5 min, aggression was scored during a 10 min period. After behavioural testing, animals were transfused transcardially and fibre placement as well as efficient light transmission were verified.
Statistics and Reproducibility
Data were analysed either by two-tailed, unpaired or paired Student’s t-test, by two-tailed Fisher’s exact test or by Chi-square test if not indicated otherwise, using Graph Pad Prism 7 for Mac OS, Matlab or R. Statistical details are given in the respective figure legends. Experiments were independently performed twice (Fig. 1b–f, Fig. 2e–g, k, l, Fig. 3c–l, Fig. 4, Extended Data Fig. 1, Extended Data Fig. 2a–d, i, j, Extended Data Fig. 3d, e, Extended Data Fig. 4b–f, Extended Data Fig. 7, 8), three (Fig. 1g–j, Fig. 2b, c, h, I, Fig. 3n–p, Extended Data Fig. 6b–d) or four times (Extended Data Fig. 6f–h).
Data and code availability
The data and code that support the findings of this study are available from the corresponding author upon request.
Extended Data
Extended Data Figure 1. Putative functional roles of brain areas providing monosynaptic inputs into MPOAGal neurons.

a, Comparison between MPOAGal input fractions in virgin males (n = 3) and females (n = 3) after rabies tracing (see Fig. 2d). Sexually dimorphic inputs are highlighted. Two-tailed t-tests, SON: **P = 0.0041, AHPM: ***P = 0.0007, MS: *P = 0.0133. b, Comparison between MPOAGal input fractions after rabies tracing was initiated from the right (n = 3) or left (n = 3) hemisphere in virgin females. No significant differences were found (P > 0.05; two-tailed paired t-test). c, Comparison between rabies-injected (ipsilateral, ipsi) and non-injected (contralateral, contra) MPOA of a mother after parental behaviour. Activated (c-Fos+) rabies+ neurons are shown (upper, arrowheads). c-Fos+ neuron numbers are not significantly different between hemispheres (lower, P = 0.43, 95% CI [−4.176, 1.843]; two-tailed paired t-test; n = 6). d, MPOAGal neurons receive monosynaptic inputs from magnocellular SONAVP neurons (mothers, 72.7 ± 9.3% overlap, n = 3; virgin females, 77.4 ± 4.3%, n = 3; fathers, 83.3 ± 3.3%, n = 3) but rarely from SONOXT neurons (mothers, 4.6 ± 4.2% overlap, n = 2; virgin females, 4.5 ± 1.0%, n = 2; fathers, 2.8 ± 1.8%, n = 2). Scale bars, c, 100 μm; d, 50 μm. Data are mean ± s.e.m.
Extended Data Figure 2. MPOAGal projections in males and downstream connectivity.

a, Synaptophysin-GFP (Syn-GFP) labelling of presynaptic sites in MPOAGal projections. b, Representative MPOAGal projections from a virgin male, identified by tdTomato fluorescence. c, Representative MPOAGal projections, identified by tdTomato fluorescence, after viral injection into the left MPOA. d, c-Fos+ fractions of virally labelled MPOAGal projections in fathers (n = 6, 3, 4, 3, 3, respectively, from top). Red line depicts the population average (see ref. 3). Data are mean ± s.e.m. e, Trans-synaptic retrograde rabies tracing from AVPeTH neurons. f, MPOAGal neurons presynaptic to AVPeTH neurons in females (left, arrowheads, 21.4% Gal+, 47/220 neurons, n = 3) and males (right, 16.7% Gal+, 4/24 neurons, n = 2). g, Direct and indirect MPOAGal→PVNOXT connectivity. Asterisk, AVPeTH neurons form excitatory synapses with PVNOXT in females11. h, Conditional monosynaptic retrograde tracing initiated from PAG. i, j, Injection sites with mCherry+ starter neurons in PAG of Vgat-ires-Cre (i, left) or Vglut2-ires-Cre (j, left) mice. Presynaptic, rabies+/Gal+ neurons are detected in MPOA when tracing is initiated from PAGVgat (i, right, arrowheads), but not PAGVglut2 (j, right), neurons. Scale bars, a, 50 μm; b, 250 μm; c, left, 500 and inset, 250 μm; f, 50 μm; i, j, left, 200 μm and right, 250 μm; i, insert, 50 μm.
Extended Data Figure 3. MPOAGal projections correspond to largely non-overlapping neuronal subpopulations.

a, Control injection of a 1:1 mixture of CTB-488 and CTB-647 into PAG results in highly overlapping neuron populations in the MPOA (quantification, see c). b, Strategy to determine collaterals between pairwise injected MPOAGal projections in Gal::Cre+/−; loxP-Stop-loxP-tdTomato+/− mice. An example with two double-labelled MPOAGal neurons is shown after injection of CTB-488 into PAG and CTB-647 into VTA (right, arrowheads). c, Quantification of data in a, b. Data are mean ± s.e.m. (n = 6, 6, 3, 3, 3, 3, 3, respectively, from top). d, Representative image from MPOA of Gal::Cre+/−; loxP-Stop-loxP-tdTomato+/− mouse after injection of CTB-647 into PAG. Note high overlap between Gal+ and CTB+ neurons. e, Frequency of Gal+ neurons in individual, CTB-labelled MPOA projections (n = 4, 6, 4, 3, 3, 3, respectively, from top). Red line depicts expected labelling frequency, based on proportion of Gal+ MPOA neurons (~20%, ref. 3). Data in c, e are mean ± s.e.m. f, Distribution of cell bodies corresponding to specific MPOAGal projections. Individual MPOAGal projection areas in Gal::Cre virgin females were injected with Cre-dependent CAV2-FLEx-ZsGreen (see Fig. 2h). Only labelling patterns on the ipsilateral, injected side are shown and only two projection-specific subpopulations per side are displayed for clarity. Distance from Bregma is shown in mm. Mouse brain images in this figure have been reproduced with permission from Elsevier64. g, Zones occupied by MPOAGal cell bodies projecting to MeA, PAG, VTA and PVN in anterior (left), central (middle) and posterior (right) MPOA. Distance from Bregma is shown in mm. Scale bars, a, b, 50 μm; d, 250 μm and inset, 50 μm.
Extended Data Figure 4. MPOAGal projections barely collateralize.

a, Strategy to detect brain-wide axon collaterals of specific MPOAGal projections. b, Dense labelling of MPOAGal neurons after injection of retrograde tracer CAV into PAG and reporter AAV into MPOA. c, Absence of MPOAGal labelling in negative control without injection of CAV. d–f, Only minor axon collaterals are detectable from MPOAGal neurons projecting to PAG (n = 2) (d), VTA (n = 3) (e) or MeA (n = 2) (f). Note MPOA→MeA fibre tract in BNST in (f). Signal was enhanced using anti-GFP immunostaining (Methods). Scale bars, b, c, 400 μm and insets, 100 μm; d–f, 150 μm.
Extended Data Figure 5. Negative controls for monosynaptic retrograde tracing.

a, Absence of rabies+ background labelling in the MPOA of AAV- and rabies-injected C57BL/6 control mice (n = 2). b, Labelling of MPOAGal neurons after injection of CAV into PAG and starter AAVs into MPOA of Gal::Cre mice (261 ± 19 neurons, n = 4). c, Near-absence of labelling in AAV-only negative control (11 ± 2 neurons, n = 2). d, Background rabies+ neurons were present in the following brain areas of CAV-, AAV- and rabies-injected C57BL/6 control mice (n = 3): MPOA, BNST, AH, PVN and SON. These areas were therefore excluded from analysis (see Figure 2k, l and Methods). Scale bars, a–d, 400 μm and insets, 150 μm.
Extended Data Figure 6. Histology of photometry recording experiments and tuning of MPOAGal neurons in other behavioural contexts.

a, Specific GCaMP6m expression in MPOAGal neurons (90.9 ± 4.3% overlap, n = 3, mothers). b–d, Implantation sites of optical fibres in the MPOA of Gal::Cre+/−; loxP-Stop-loxP-tdTomato+/− mother (b), virgin female (c) and father (d). e, Quantification of GCaMP+ neuron numbers in MPOA after AAV injection (‘Total’, n = 4) and after injection of HSV into individual projections (n = 5 each). Data for mothers are shown. Data are mean ± s.e.m. Two-tailed t-tests, Total vs. PAG, VTA, MeA: ***P < 0.001, PAG vs. MeA: **P = 0.0033. f–h, Expression of GCaMP6m in MPOAGal neurons after bilateral infection of axon terminals in PAG (f), VTA (g) or MeA (h) with Cre-dependent, GCaMP6m-expressing HSV. Insets show fibre implantation sites. i, j, Averaged recording traces from MPOAGal neuron activity during sniffing of accessible pups (i) or inaccessible pups enclosed in a wire mesh tea ball (j) in mothers (n = 4), virgin females (n = 3) and fathers (n = 5). k, l, Averaged recording traces from MPOAGal neuron activity during sniffing of female (k) or male (l) intruder in mothers (n = 4), virgin females (n = 3) and fathers (n = 5). Two-tailed t-tests, i: ***P < 0.0001, ***P < 0.0001, P = 0.0001, j: *P = 0.0380, k: *P = 0.0219, l: *P = 0.0272. m–q, Averaged recording traces from MPOAGal neurons projecting to PAG (left, n = 10), VTA (middle, n = 12) or MeA (right, n = 8) during episodes of maternal behaviour. All traces and bar plots are mean ± s.e.m. Scale bars, a, 50 μm; b–d, 400 μm; f–h, 1 mm and insets, 500 μm.
Extended Data Figure 7. Distribution of parental behaviours in mothers and virgin females.

Distribution of parental behaviours during 10 min pup interaction assays in mothers (a, n = 23) and virgin females (b, n = 20). In a, individuals exhibiting high pup sniffing are indicated in blue across plots, and individuals exhibiting high pup grooming are indicated in orange. In b, individuals exhibiting high pup sniffing are indicated in green. Note that y axis ranges are identical between a and b. Lines depict mean.
Extended Data Figure 8. Behavioural specificity of MPOAGal projection stimulation.

a, Channelrhodopsin-2 (ChR2) expression in MPOAGal neurons (97.7 ± 0.2% overlap, virgin female, n = 2). b–g, Effect of activating PAG- (b, c), VTA- (d, e) or MeA- (f, g) projections on time spent in nest in females and males (b, n = 13, 10; d, n = 9, 10; f, n = 10, 10) and number of pup-directed sniffing bouts (c, n = 13, 10; e, n = 9, 10; g, n = 10, 10). h–m, Effect of activating PAG- (h, i), VTA- (j, k) or MeA- (l, m) projections on locomotion velocity (h, n = 13, 10; j, n = 8, 10; l, n = 10, 10) and moved distance (i, k, m). n, q, s, Effect of inhibiting PAG- (n, n = 10), VTA- (q, n = 10) or MeA- (s, n = 11) projections on pup interactions. o, t, Effect of inhibiting PAG- (o, n = 10) or MeA- (t, n = 11) projections on number of barrier crosses. p, r, Effect of inhibiting PAG- (p, n = 10) or MeA- (r, n = 11) projections on chemoinvestigation of a male intruder. u–w, Effect of inhibiting PAG- (u), VTA- (v) or MeA- (w) projections on locomotion velocity and moved distance (n = 10, 10, 11, respectively). Two-tailed paired t-tests, c: *P = 0.0135, f: *P = 0.03, n: *P = 0.0413, q: *P = 0.0264. Scale bar in a, 50 μm.
Extended Data Table 1. List of brain areas and coordinates (Note: no table legend).
| Abbreviation | Brain area | Injection coord. (AP/ML/DV) | Stimulation coord. (AP/ML/DV) | Recording coord. (AP/ML/DV) |
|---|---|---|---|---|
| AH | anterior hypothalamus | – | – | – |
| AHPM | posteriomedial amygdalohippocampal area | – | – | – |
| Arc | arcuate nucleus | – | – | – |
| AVPe | anteroventral periventricular nucleus | 0.25/0.15/−5.45 | – | – |
| BMA | basomedial amygdala | – | – | – |
| BNST | bed nucleus of the stria terminalis | – | – | – |
| DM | dorsomedial hypothalamus | – | – | – |
| IL | infralimbic cortex | – | – | – |
| LC | locus coeruleus | −5.4/0.88/−2.65 | – | – |
| LS | lateral septum | 0.4/0.3/−2.5 | – | – |
| MeA | medial amygdala | −1.6/2.25/−4.95 | −1.6/±2.25/−4.5 | – |
| MnPO | median preoptic nucleus | – | – | – |
| MPOA | medial preoptic area | 0/0.5/−5.05 | – | 0/0.5/−4.9 |
| MS | medial septum | – | – | – |
| NAc | nucleus accumbens - core | 1.0/0.7/−3.8 | – | – |
| NAsh | nucleus accumbens - shell | – | – | – |
| PAG | (rostral) periaqueductal grey | −3.28/0.2/−2.5 | −3.28/±0.2/−2.2 | – |
| PeFA | perifornical area | −0.6/0.3/−4.2 | – | – |
| PMV | ventral premammillary nucleus | – | – | – |
| PVN | periventricular hypothalamic nucleus | −0.82/0.25/−4.6 | – | – |
| PVT | periventricular thalamic nucleus | −0.94/0/−2.7 | – | – |
| RM | retromammillary nucleus | – | – | – |
| RRF | retrorubral field | −4.04/1.0/−3.4 | – | – |
| RMg | raphe magnus nucleus | −5.2/0/−4.55 | – | – |
| SFO | subfornical organ | – | – | – |
| SNpc | substantia nigra pars compacta | −3.1/1.25/−4.0 | – | – |
| SON | supraoptic nucleus | – | – | – |
| VMH | ventromedial hypothalamus | −1.5/0.4/−5.7 | – | – |
| VOLT | vascular organ of the lamina terminalis | – | – | – |
| VTA | ventral tegmental area | −3.0/0.6/−4.2 | −3.1/±0.5/−4.1 | – |
Extended Data Table 2. Summary of parenting-affecting manipulations in MPOAGal target areas.
From those brain areas targeted by MPOAGal projections (Fig. 2c), manipulation of the following has been shown to affect maternal behaviour in rats (or mice where indicated). For a more comprehensive review see ref. 10.
| Brain area | Manipulation | Effect | Reference |
|---|---|---|---|
| PAG | Lesion | Facilitates maternal responses | 44 |
| GABAA receptor antagonist | Decreases maternal aggression, Increases pup licking/grooming | 19 | |
| MeA | Lesion | Accelerates onset of maternal behaviour | 45–47 |
| PVN | Lesion | Disrupts onset of maternal behaviour | 48 (but see 49) |
| LS | GABAA receptor antagonist | Decreases maternal aggression | 50 |
| Corticotropin releasing factor | Decreases maternal aggression | 51 | |
| LC | Disruption of 5-HT production | Disrupts maternal behaviour (mice) | 51 |
| AVPe | Ablation of TH+ neurons | Impairs maternal behaviour (mice) | 11 |
| Optogenetic stimulation of TH+ neurons | Enhances maternal behaviour (mice) | ||
| VTA | Lesion | Impairs pup retrieval | 2,52 |
| Inactivation | Impairs pup-paired conditioned place preference | 22 | |
| NAc | Lesion | Impairs pup retrieval | 53,54 |
| DA receptor antagonist | Inhibits retrieval and licking; enhances nursing | 55,56 | |
| SNpc | Lesion | Disrupts maternal behaviour | 57 |
| VMH | Lesion | Accelerates onset of maternal behaviour | 58 |
| BNST | Lesion (ventral BNST) | Disrupts maternal behaviour | 59 |
| Estrogen injection | Facilitates maternal responses | 60 | |
| Prolactin injection | Facilitates maternal responses | 61 | |
| RRF | n/a | RRF-projecting l\/IPOA neurons activated during maternal behaviour | 62 |
| PVT | n/a | Activated during maternal behaviour | 63 |
Supplementary Material
Pan-MPOAGal fibre photometry recording in a mother. While (1) no change in signal is visible during interactions with a food object (sniffing, retrieving of cracker), (2) sniffing pups in a wire mesh cage results in modest, and (3) sniffing and grooming of pups in the nest in strong increase in MPOAGal population activity.
Optogenetic activation of MPOAGal→VTA projections in a virgin Gal::Cre female evokes barrier crossing in a task assessing motivation to interact with pups. Photostimulation period indicated by white dot.
Acknowledgments
We thank S. Sullivan for help with behaviour and mouse husbandry. E. Kremer (Montpellier) and R. Neve (MIT) provided viral vectors. E. Soucy and J. Greenwood helped design motivation assay. R. Hellmiss and K. Wilbur helped with illustrations. H.S. Knobloch-Bollmann provided advice on PVN cell types. We thank members of the Dulac lab for comments on the manuscript. This work was supported by a Human Frontier Long-Term Fellowship, an EMBO Long-Term Fellowship and a Sir Henry Wellcome Fellowship to J.K., Fondation pour la Recherche Médicale grant SPE20150331860 to B.M.B., a NIH K99 Award and a NARSAD Young Investigator Award to A.E.A., a Howard Hughes Gilliam Fellowship to B.M.B., a Harvard Mind Brain and Behavior faculty grant to N.U. and NIH grant 1R01HD082131-01A1 to C.D. C.D. and L.L. are investigators of the Howard Hughes Medical Institute.
Footnotes
Author Contributions
J.K. and C.D. conceived and designed the study. J.K performed and analyzed tracing and optogenetics experiments. J.K. and B.M.B. performed and analyzed photometry recordings. A.E.A. helped with in situ hybridizations, B.M-R. with CTB tracing, N.D.R. with analyzing cTRIO data, and V.K. with optogenetics. L.S.Z., K.M. and L.L. shared unpublished viral reagents. N.U. provided fibre photometry setup. J.K., B.M.B., N.D.R., A.E.A. and C.D. analyzed and interpreted results. J.K. and C.D. wrote the manuscript with input from all authors.
Author Information
The authors declare no competing financial interests.
Main text references
- 1.Dulac C, O’Connell LA, Wu Z. Neural control of maternal and paternal behaviors. Science. 2014;345:765–770. doi: 10.1126/science.1253291. [DOI] [PMC free article] [PubMed] [Google Scholar]
- 2.Numan M, Insel TR. The neurobiology of parental behavior. Springer; 2011. [Google Scholar]
- 3.Wu Z, Autry AE, Bergan JF, Watabe-Uchida M, Dulac CG. Galanin neurons in the medial preoptic area govern parental behaviour. Nature. 2014;509:325–330. doi: 10.1038/nature13307. [DOI] [PMC free article] [PubMed] [Google Scholar]
- 4.Wickersham IR, et al. Monosynaptic restriction of transsynaptic tracing from single, genetically targeted neurons. Neuron. 2007;53:639–647. doi: 10.1016/j.neuron.2007.01.033. [DOI] [PMC free article] [PubMed] [Google Scholar]
- 5.Marlin BJ, Mitre M, D’Amour JA, Chao MV, Froemke RC. Oxytocin enables maternal behaviour by balancing cortical inhibition. Nature. 2015;520:499–504. doi: 10.1038/nature14402. [DOI] [PMC free article] [PubMed] [Google Scholar]
- 6.Johnson ZV, Young LJ. Oxytocin and vasopressin neural networks: Implications for social behavioral diversity and translational neuroscience. Neurosci Biobehav Rev. 2017;76:87–98. doi: 10.1016/j.neubiorev.2017.01.034. [DOI] [PMC free article] [PubMed] [Google Scholar]
- 7.Bendesky A, et al. The genetic basis of parental care evolution in monogamous mice. Nature. 2017 doi: 10.1038/nature22074. [DOI] [PMC free article] [PubMed] [Google Scholar]
- 8.Tachikawa KS, Yoshihara Y, Kuroda KO. Behavioral transition from attack to parenting in male mice: a crucial role of the vomeronasal system. J Neurosci. 2013;33:5120–5126. doi: 10.1523/JNEUROSCI.2364-12.2013. [DOI] [PMC free article] [PubMed] [Google Scholar]
- 9.vom Saal FS. Time-contingent change in infanticide and parental behavior induced by ejaculation in male mice. Physiol Behav. 1985;34:7–15. doi: 10.1016/0031-9384(85)90069-1. [DOI] [PubMed] [Google Scholar]
- 10.Kohl J, Autry AE, Dulac C. The neurobiology of parenting: A neural circuit perspective. Bioessays. 2017;39:1–11. doi: 10.1002/bies.201600159. [DOI] [PMC free article] [PubMed] [Google Scholar]
- 11.Scott N, Prigge M, Yizhar O, Kimchi T. A sexually dimorphic hypothalamic circuit controls maternal care and oxytocin secretion. Nature. 2015;525:519–522. doi: 10.1038/nature15378. [DOI] [PubMed] [Google Scholar]
- 12.Schwarz LA, et al. Viral-genetic tracing of the input-output organization of a central noradrenaline circuit. Nature. 2015;524:88–92. doi: 10.1038/nature14600. [DOI] [PMC free article] [PubMed] [Google Scholar]
- 13.Gunaydin LA, et al. Natural neural projection dynamics underlying social behavior. Cell. 2014;157:1535–1551. doi: 10.1016/j.cell.2014.05.017. [DOI] [PMC free article] [PubMed] [Google Scholar]
- 14.Kudo Y, et al. A single optical fiber fluorometric device for measurement of intracellular Ca2+ concentration: its application to hippocampal neurons in vitro and in vivo. Neuroscience. 1992;50:619–625. doi: 10.1016/0306-4522(92)90451-7. [DOI] [PubMed] [Google Scholar]
- 15.Elyada YM, Mizrahi A. Becoming a mother-circuit plasticity underlying maternal behavior. Curr Opin Neurobiol. 2015;35:49–56. doi: 10.1016/j.conb.2015.06.007. [DOI] [PubMed] [Google Scholar]
- 16.Andermann ML, Lowell BB. Toward a Wiring Diagram Understanding of Appetite Control. Neuron. 2017;95:757–778. doi: 10.1016/j.neuron.2017.06.014. [DOI] [PMC free article] [PubMed] [Google Scholar]
- 17.Li Y, et al. Neuronal Representation of Social Information in the Medial Amygdala of Awake Behaving Mice. Cell. 2017;171:1176–1190 e1117. doi: 10.1016/j.cell.2017.10.015. [DOI] [PMC free article] [PubMed] [Google Scholar]
- 18.Remedios R, et al. Social behaviour shapes hypothalamic neural ensemble representations of conspecific sex. Nature. 2017;550:388–392. doi: 10.1038/nature23885. [DOI] [PMC free article] [PubMed] [Google Scholar]
- 19.Lee G, Gammie SC. GABAA receptor signaling in caudal periaqueductal gray regulates maternal aggression and maternal care in mice. Behav Brain Res. 2010;213:230–237. doi: 10.1016/j.bbr.2010.05.001. [DOI] [PMC free article] [PubMed] [Google Scholar]
- 20.Salamone JD, Correa M. The mysterious motivational functions of mesolimbic dopamine. Neuron. 2012;76:470–485. doi: 10.1016/j.neuron.2012.10.021. [DOI] [PMC free article] [PubMed] [Google Scholar]
- 21.McHenry JA, et al. Hormonal gain control of a medial preoptic area social reward circuit. Nat Neurosci. 2017;20:449–458. doi: 10.1038/nn.4487. [DOI] [PMC free article] [PubMed] [Google Scholar]
- 22.Seip KM, Morrell JI. Transient inactivation of the ventral tegmental area selectively disrupts the expression of conditioned place preference for pup- but not cocaine-paired contexts. Behav Neurosci. 2009;123:1325–1338. doi: 10.1037/a0017666. [DOI] [PMC free article] [PubMed] [Google Scholar]
- 23.Qualls-Creekmore E, et al. Galanin-Expressing GABA Neurons in the Lateral Hypothalamus Modulate Food Reward and Noncompulsive Locomotion. J Neurosci. 2017;37:6053–6065. doi: 10.1523/JNEUROSCI.0155-17.2017. [DOI] [PMC free article] [PubMed] [Google Scholar]
- 24.Isogai Y, et al. Molecular organization of vomeronasal chemoreception. Nature. 2011;478:241–245. doi: 10.1038/nature10437. [DOI] [PMC free article] [PubMed] [Google Scholar]
- 25.Bergan JF, Ben-Shaul Y, Dulac C. Sex-specific processing of social cues in the medial amygdala. Elife. 2014;3:e02743. doi: 10.7554/eLife.02743. [DOI] [PMC free article] [PubMed] [Google Scholar]
- 26.Yao S, Bergan J, Lanjuin A, Dulac C. Oxytocin signaling in the medial amygdala is required for sex discrimination of social cues. Elife. 2017;6 doi: 10.7554/eLife.31373. [DOI] [PMC free article] [PubMed] [Google Scholar]
- 27.Hong W, Kim DW, Anderson DJ. Antagonistic control of social versus repetitive self-grooming behaviors by separable amygdala neuronal subsets. Cell. 2014;158:1348–1361. doi: 10.1016/j.cell.2014.07.049. [DOI] [PMC free article] [PubMed] [Google Scholar]
- 28.Anderson DJ. Circuit modules linking internal states and social behaviour in flies and mice. Nat Rev Neurosci. 2016;17:692–704. doi: 10.1038/nrn.2016.125. [DOI] [PubMed] [Google Scholar]
- 29.Yang T, Shah NM. Molecular and neural control of sexually dimorphic social behaviors. Curr Opin Neurobiol. 2016;38:89–95. doi: 10.1016/j.conb.2016.04.015. [DOI] [PMC free article] [PubMed] [Google Scholar]
- 30.Zimmerman CA, Leib DE, Knight ZA. Neural circuits underlying thirst and fluid homeostasis. Nat Rev Neurosci. 2017;18:459–469. doi: 10.1038/nrn.2017.71. [DOI] [PMC free article] [PubMed] [Google Scholar]
- 31.Weber F, Dan Y. Circuit-based interrogation of sleep control. Nature. 2016;538:51–59. doi: 10.1038/nature19773. [DOI] [PubMed] [Google Scholar]
- 32.Arber S. Motor circuits in action: specification, connectivity, and function. Neuron. 2012;74:975–989. doi: 10.1016/j.neuron.2012.05.011. [DOI] [PubMed] [Google Scholar]
- 33.Madisen L, et al. A robust and high-throughput Cre reporting and characterization system for the whole mouse brain. Nat Neurosci. 2010;13:133–140. doi: 10.1038/nn.2467. [DOI] [PMC free article] [PubMed] [Google Scholar]
- 34.Miyamichi K, et al. Dissecting local circuits: parvalbumin interneurons underlie broad feedback control of olfactory bulb output. Neuron. 2013;80:1232–1245. doi: 10.1016/j.neuron.2013.08.027. [DOI] [PMC free article] [PubMed] [Google Scholar]
- 35.Beier KT, et al. Circuit Architecture of VTA Dopamine Neurons Revealed by Systematic Input-Output Mapping. Cell. 2015;162:622–634. doi: 10.1016/j.cell.2015.07.015. [DOI] [PMC free article] [PubMed] [Google Scholar]
- 36.Esposito MS, Capelli P, Arber S. Brainstem nucleus MdV mediates skilled forelimb motor tasks. Nature. 2014;508:351–356. doi: 10.1038/nature13023. [DOI] [PubMed] [Google Scholar]
- 37.Eliava M, et al. A New Population of Parvocellular Oxytocin Neurons Controlling Magnocellular Neuron Activity and Inflammatory Pain Processing. Neuron. 2016;89:1291–1304. doi: 10.1016/j.neuron.2016.01.041. [DOI] [PMC free article] [PubMed] [Google Scholar]
- 38.Xiao L, Priest MF, Nasenbeny J, Lu T, Kozorovitskiy Y. Biased Oxytocinergic Modulation of Midbrain Dopamine Systems. Neuron. 2017;95:368–384 e365. doi: 10.1016/j.neuron.2017.06.003. [DOI] [PMC free article] [PubMed] [Google Scholar]
- 39.Swanson LW, Sawchenko PE. Hypothalamic integration: organization of the paraventricular and supraoptic nuclei. Annu Rev Neurosci. 1983;6:269–324. doi: 10.1146/annurev.ne.06.030183.001413. [DOI] [PubMed] [Google Scholar]
- 40.Wickersham IR, Finke S, Conzelmann KK, Callaway EM. Retrograde neuronal tracing with a deletion-mutant rabies virus. Nat Methods. 2007;4:47–49. doi: 10.1038/nmeth999. [DOI] [PMC free article] [PubMed] [Google Scholar]
- 41.Osakada F, et al. New rabies virus variants for monitoring and manipulating activity and gene expression in defined neural circuits. Neuron. 2011;71:617–631. doi: 10.1016/j.neuron.2011.07.005. [DOI] [PMC free article] [PubMed] [Google Scholar]
- 42.Weible AP, et al. Transgenic targeting of recombinant rabies virus reveals monosynaptic connectivity of specific neurons. J Neurosci. 2010;30:16509–16513. doi: 10.1523/JNEUROSCI.2442-10.2010. [DOI] [PMC free article] [PubMed] [Google Scholar]
- 43.Menegas W, Babayan BM, Uchida N, Watabe-Uchida M. Opposite initialization to novel cues in dopamine signaling in ventral and posterior striatum in mice. Elife. 2017;6 doi: 10.7554/eLife.21886. [DOI] [PMC free article] [PubMed] [Google Scholar]
- 44.Sukikara MH, Mota-Ortiz SR, Baldo MV, Felicio LF, Canteras NS. The periaqueductal gray and its potential role in maternal behavior inhibition in response to predatory threats. Behav Brain Res. 2010;209:226–233. doi: 10.1016/j.bbr.2010.01.048. [DOI] [PubMed] [Google Scholar]
- 45.Fleming AS, Vaccarino F, Luebke C. Amygdaloid inhibition of maternal behavior in the nulliparous female rat. Physiol Behav. 1980;25:731–743. doi: 10.1016/0031-9384(80)90377-7. [DOI] [PubMed] [Google Scholar]
- 46.Numan M, Numan MJ, English JB. Excitotoxic amino acid injections into the medial amygdala facilitate maternal behavior in virgin female rats. Horm Behav. 1993;27:56–81. doi: 10.1006/hbeh.1993.1005. [DOI] [PubMed] [Google Scholar]
- 47.Sheehan T, Paul M, Amaral E, Numan MJ, Numan M. Evidence that the medial amygdala projects to the anterior/ventromedial hypothalamic nuclei to inhibit maternal behavior in rats. Neuroscience. 2001;106:341–356. doi: 10.1016/s0306-4522(01)00286-x. [DOI] [PubMed] [Google Scholar]
- 48.Insel TR, Harbaugh CR. Lesions of the hypothalamic paraventricular nucleus disrupt the initiation of maternal behavior. Physiol Behav. 1989;45:1033–1041. doi: 10.1016/0031-9384(89)90234-5. [DOI] [PubMed] [Google Scholar]
- 49.Numan M, Corodimas KP. The effects of paraventricular hypothalamic lesions on maternal behavior in rats. Physiol Behav. 1985;35:417–425. doi: 10.1016/0031-9384(85)90318-x. [DOI] [PubMed] [Google Scholar]
- 50.Lee G, Gammie SC. GABA(A) receptor signaling in the lateral septum regulates maternal aggression in mice. Behav Neurosci. 2009;123:1169–1177. doi: 10.1037/a0017535. [DOI] [PMC free article] [PubMed] [Google Scholar]
- 51.D’Anna KL, Gammie SC. Activation of corticotropin-releasing factor receptor 2 in lateral septum negatively regulates maternal defense. Behav Neurosci. 2009;123:356–368. doi: 10.1037/a0014987. [DOI] [PubMed] [Google Scholar]
- 52.Hansen S, Harthon C, Wallin E, Lofberg L, Svensson K. Mesotelencephalic dopamine system and reproductive behavior in the female rat: effects of ventral tegmental 6-hydroxydopamine lesions on maternal and sexual responsiveness. Behav Neurosci. 1991;105:588–598. doi: 10.1037//0735-7044.105.4.588. [DOI] [PubMed] [Google Scholar]
- 53.Hansen S. Maternal behavior of female rats with 6-OHDA lesions in the ventral striatum: characterization of the pup retrieval deficit. Physiol Behav. 1994;55:615–620. doi: 10.1016/0031-9384(94)90034-5. [DOI] [PubMed] [Google Scholar]
- 54.Li M, Fleming AS. The nucleus accumbens shell is critical for normal expression of pup-retrieval in postpartum female rats. Behav Brain Res. 2003;145:99–111. doi: 10.1016/s0166-4328(03)00135-9. [DOI] [PubMed] [Google Scholar]
- 55.Keer SE, Stern JM. Dopamine receptor blockade in the nucleus accumbens inhibits maternal retrieval and licking, but enhances nursing behavior in lactating rats. Physiol Behav. 1999;67:659–669. doi: 10.1016/s0031-9384(99)00116-x. [DOI] [PubMed] [Google Scholar]
- 56.Numan M, et al. The effects of D1 or D2 dopamine receptor antagonism in the medial preoptic area, ventral pallidum, or nucleus accumbens on the maternal retrieval response and other aspects of maternal behavior in rats. Behav Neurosci. 2005;119:1588–1604. doi: 10.1037/0735-7044.119.6.1588. [DOI] [PubMed] [Google Scholar]
- 57.Numan M, Nagle DS. Preoptic area and substantia nigra interact in the control of maternal behavior in the rat. Behav Neurosci. 1983;97:120–139. doi: 10.1037//0735-7044.97.1.120. [DOI] [PubMed] [Google Scholar]
- 58.Bridges RS, Mann PE, Coppeta JS. Hypothalamic involvement in the regulation of maternal behaviour in the rat: inhibitory roles for the ventromedial hypothalamus and the dorsal/anterior hypothalamic areas. J Neuroendocrinol. 1999;11:259–266. doi: 10.1046/j.1365-2826.1999.00322.x. [DOI] [PubMed] [Google Scholar]
- 59.Numan M, Numan M. A lesion and neuroanatomical tract-tracing analysis of the role of the bed nucleus of the stria terminalis in retrieval behavior and other aspects of maternal responsiveness in rats. Dev Psychobiol. 1996;29:23–51. doi: 10.1002/(SICI)1098-2302(199601)29:1<23::AID-DEV2>3.0.CO;2-O. [DOI] [PubMed] [Google Scholar]
- 60.Numan M, Rosenblatt JS, Komisaruk BR. Medial preoptic area and onset of maternal behavior in the rat. J Comp Physiol Psychol. 1977;91:146–164. doi: 10.1037/h0077304. [DOI] [PubMed] [Google Scholar]
- 61.Bridges RS, Numan M, Ronsheim PM, Mann PE, Lupini CE. Central prolactin infusions stimulate maternal behavior in steroid-treated, nulliparous female rats. Proc Natl Acad Sci U S A. 1990;87:8003–8007. doi: 10.1073/pnas.87.20.8003. [DOI] [PMC free article] [PubMed] [Google Scholar]
- 62.Numan M, Numan MJ. Projection sites of medial preoptic area and ventral bed nucleus of the stria terminalis neurons that express Fos during maternal behavior in female rats. J Neuroendocrinol. 1997;9:369–384. doi: 10.1046/j.1365-2826.1997.t01-1-00597.x. [DOI] [PubMed] [Google Scholar]
- 63.Lonstein JS, Simmons DA, Swann JM, Stern JM. Forebrain expression of c-fos due to active maternal behaviour in lactating rats. Neuroscience. 1998;82:267–281. doi: 10.1016/s0306-4522(97)00283-2. [DOI] [PubMed] [Google Scholar]
- 64.Franklin KBJ, Paxinos G. The Mouse Brain in Stereotaxic Coordinates. 3. Academic Press; 2007. [Google Scholar]
Associated Data
This section collects any data citations, data availability statements, or supplementary materials included in this article.
Supplementary Materials
Pan-MPOAGal fibre photometry recording in a mother. While (1) no change in signal is visible during interactions with a food object (sniffing, retrieving of cracker), (2) sniffing pups in a wire mesh cage results in modest, and (3) sniffing and grooming of pups in the nest in strong increase in MPOAGal population activity.
Optogenetic activation of MPOAGal→VTA projections in a virgin Gal::Cre female evokes barrier crossing in a task assessing motivation to interact with pups. Photostimulation period indicated by white dot.
Data Availability Statement
The data and code that support the findings of this study are available from the corresponding author upon request.