Abstract
Purpose
To present a post-processing approach in optical coherence tomography angiography (OCTA) to facilitate the visualization and interpretation of lesions in age-related macular degeneration with co-existing atrophy and choroidal neovascularization (CNV).
Methods
This retrospective study included thirty-two eyes of 26 patients with atrophy and treated CNV, and eight eyes with treatment-naïve geographic atrophy. En face OCT slabs highlighting atrophy were pseudo-colored and merged with the corresponding OCTA. Cross-sectional OCT and post-processed OCTA were analyzed to identify CNV and normal choroidal vessels in relationship to the atrophy. We correlate the OCTA findings to those in a donor eye with treatment-naïve geographic atrophy studied with transmission electronic microscopy (TEM).
Results
Medium-sized choroidal vessels were displaced anteriorly in areas of atrophy in all 40 eyes (100%), visualized in the choriocapillaris slab in all eyes, and in the outer retinal slab in 30 of 40 eyes (75.0%). Cross-sectional OCTA was used to confirm the presence of CNV. Post-processing successfully highlighted the CNV and distinguished it from choroidal vessels in atrophy. Donor eye TEM confirmed the anterior displacement of medium-sized choroidal vessels in geographic atrophy.
Conclusions
The anterior displacement of larger choroidal vessels in atrophy requires clinician vigilance to avoid misinterpreting these vessels as CNV on en face OCTA. Our proposed post-processing approach offers a potential solution to facilitate the interpretation of en face OCTA in these cases. In absence of other tools, clinicians are encouraged to rely on the location of flow relative to Bruch’s membrane on cross-sectional OCTA flow images.
Keywords: Age-Related Macular Degeneration, Choriocapillaris, Choroidal Neovascularization, Geographic Atrophy, OCT, Optical Coherence Tomography Angiography
Introduction
Age-related macular degeneration (AMD) is the leading cause of severe vision loss in people over 65 years old in the United States. While early AMD has little impact on visual function, late AMD, defined as the development of neovascular AMD or geographic atrophy (GA), is associated with significant visual impairment.1
Neovascular AMD is currently treated with intravitreal anti-vascular endothelial growth factor (VEGF) agents with excellent visual outcome.2–4 However, eyes undergoing anti-VEGF therapy develop retinal pigment epithelium (RPE) and choriocapillaris atrophy, clinically similar to de novo GA, with slowly progressive decay of visual acuity (VA).5–7 Specifically, of patients with choroidal neovascularization (CNV) but no GA at baseline, 38% developed RPE atrophy within a five-year follow-up period in the Comparison of Age-related Macular Degeneration Treatments Trials (CATT).8 Furthermore, a number of studies have reported the development of new onset CNV in eyes with a baseline diagnosis of GA.9–12 Therefore, overlap between atrophy and CNV in late AMD presents a complex scenario for retinal specialists, and poses important diagnostic and therapeutic challenges.
Optical coherence tomography angiography (OCTA) provides a non-invasive way to visualize the retinal and choroidal vasculature, and is increasingly used by clinicians to supplement conventional diagnostic imaging modalities. Previous studies have demonstrated the ability of OCTA to detect CNV lesions in a range of ocular diseases, including AMD.13, 14 Recent OCTA studies have demonstrated the technique’s utility for detecting preclinical, non-exudative CNV in AMD15, 16, automated quantification of CNV lesions17, and the development of OCTA parameters for clinical trial endpoints in eyes with CNV.18 In the current study, we discuss the approach to lesions where OCTA interpretation can be particularly challenging in eyes suspected to have CNV, especially in the presence of concomitant GA, atrophy and/or subretinal hyper-reflective material (SHRM).
Histologic studies have shown a loss of photoreceptors, RPE and choriocapillaris in areas of GA, but have not explored the choroidal vascular remodeling beyond the choriocapillaris.19, 20 Therefore, details of choroidal remodeling during GA and the fate of the other vascular and stromal layers of the choroid are not well documented. In GA, we have found that distinguishing between normal (residual) choroidal vessels and pathological CNV on en face OCTA can be challenging, as they can appear strikingly similar. In fact, CNV formations that have not yet infiltrated through Bruch’s membrane have recently been documented on histopathology in eyes with AMD,21 and could potentially be visualized in OCTA.
To address these issues, we propose a novel post-processing approach that highlights GA and facilitates en face OCTA image interpretation by incorporating structural and flow information within a single image. In addition, we propose a pseudo-color scheme to enhance the visualization of CNV in the outer retinal slab. In a series of eyes with various stages of GA, atrophy and CNV, we examine the utility of this approach and highlight the importance of using cross-sectional OCTA flow images when interpreting en face OCTA in advanced AMD.
Methods
This was a retrospective analysis of patients with AMD recruited in the Department of Ophthalmology at Northwestern University in Chicago, Illinois between May 2015 and April 2016. This study was approved by the Institutional Review Board of Northwestern University, followed the tenets of the Declaration of Helsinki, and was performed in accordance with the Health Insurance Portability and Accountability Act regulations. Written informed consent was obtained from all participants.
Study Sample
Inclusion criteria included a diagnosis of GA secondary to AMD, equivalent to grade 4 on the Age-Related Eye Disease Study scale (AREDS) scale,22 based on the grading of color fundus photographs, spectral-domain (SD-OCT), and fundus autofluorescence analyzed by an experienced retina specialist (A.A.F.). We included both treatment-naïve eyes with GA and eyes with atrophy in the setting of anti-VEGF treatment for CNV. Only eyes that had OCTA images without movement or shadow artifacts in the area of interest were considered eligible.
Exclusion criteria included eyes that have undergone surgical retinal repair or those with other retinal diseases that may confound our results such as high myopia (over -7 D). In order to avoid optical artifacts that may potentially compromise OCTA image quality, we also excluded patients with evidence of significant cataracts, graded above nuclear opalescence grade 3 or nuclear color grade 3. Electronic medical records were reviewed to extract demographic and clinical information. Monocular VA was determined for all subjects using Snellen eye charts and converted to the logarithm of the minimum angle of resolution (logMAR) as previously described.23
Angiographic Imaging and Image Processing
OCTA images were obtained using the RTVue-XR Avanti system (Optovue Inc., Fremont, California, USA) with split-spectrum amplitude-decorrelation angiography (SSADA) software.24 This instrument has an A-scan rate of 70,000 scans per second and uses a light source centered on 840 nm with a full-width at half maximum bandwidth of 45 nm. Each OCTA volume contained 304 X 304 A-scans, with two consecutive B-scans (M-B frames) captured at each sampling location. SSADA was then used to extract OCTA information, resulting in an OCTA volume containing 304 B-scans. We obtained 3 X 3 mm2 scans centered on the fovea or the area of the posterior pole containing GA. OCTA scans with a signal strength index score below 50 were not included for further analysis.
En face OCT angiograms were automatically segmented using the built-in software to define the outer retina and choriocapillaris. The outer retina slab was ~40 μm thick, from 71 μm below the inner plexiform layer to 31 μm below the RPE reference line. The choriocapillaris slab was ~28 μm thick, from 31 to 59 μm below the RPE reference line. The RPE reference line, when the RPE is present, is located at the middle of the hyper-reflective RPE band on OCT.
The Optovue software includes an algorithm for the outer retinal slab, which automatically removes projection artifacts related to overlying retinal vessels. This algorithm can fail when the anatomy of the retina is pathologically distorted, leading to segmentation errors and failure to remove projection artifacts of retinal vessels on the outer retinal slab. For each OCTA volume, we assessed cross-sectional OCT to identify errors in the segmentation, defined as areas where the segmentation did not follow the pre-set anatomical location. We then used cross-sectional OCT to determine the location of blood vessels in the outer retinal slab, in order to appreciate retinal projection artifacts. Another error in this slab occurs with loss of the RPE, where the outer boundary becomes noticeably displaced into the anterior choroid. When there were failures of the algorithm, we examined the OCT B-scan to confirm the location of the vessels shown in that slab. We took the most superficial layer in which we could appreciate the red flow signal on the OCTA B-scan as the anatomical location of that vessel. We made no attempts to rectify these segmentation artifacts but noted them in our figures.
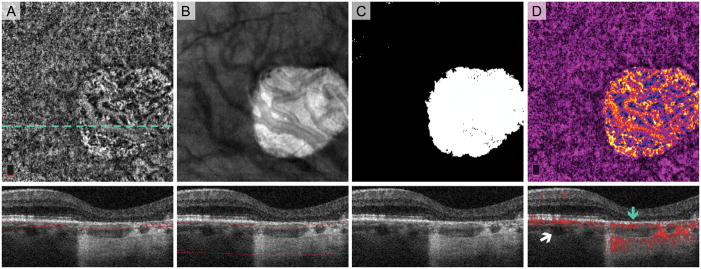
To identify the zone of geographic atrophy, we used an OCT sub-RPE slab from the upper border of the choriocapillaris (31 μm below RPE reference) extending down 300 μm into the choroid, the approach developed by Lujan et al.25 The choroidal slab was exported into ImageJ (developed by Wayne Rasband, National Institutes of Health, Bethesda, MD; available at http://rsb.info.nih.gov/ij/index.html) and converted it to a binary GA mask that outlined the GA area. From this image, the borders of the GA were copied onto an en face OCTA of the choriocapillaris, and any blood vessels within the area of GA were pseudo-colored on a spectrum from blue to yellow, while those outside of the GA were pseudo-colored magenta (Figure 1). If the outer retina OCTA slab showed blood vessels, these vessels were pseudo-colored green and overlaid onto the composite OCTA en face image.
Fig. 1.
Post-Processing Algorithm for Highlighting Areas of Geographic Atrophy (GA) on OCT Angiography (OCTA). Treatment-naïve Eye with GA. A. OCTA of choriocapillaris and cross-sectional OCT with red segmentation boundary lines. The dotted line shows location of B-scans. Normal choroidal vessels are displaced anteriorly in the area of GA and seen in choriocapillaris slab. B. En face structural OCT slab of the choroid with cross-section below. Extra signal penetrating the choroid in GA appears bright on the en face image. C. Binary rendition of OCT slab of the choroid used to select the area of GA (white). Choroidal illumination is seen in area of GA on the cross-section. D. Pseudo-colored OCTA of choriocapillaris highlights GA boundaries. Blood vessels in GA are pseudo-colored on a spectrum from blue to yellow and vessels in areas with relatively intact retinal pigment epithelium vessels are magenta. Red flow overlay on cross-sectional OCTA demonstrates a choroidal vessel abutting Bruch’s membrane in GA (blue arrow). White arrow points to a choroidal vessel located more posteriorly outside GA..
Analysis
The composite pseudo-color images and en face angiograms of the choriocapillaris and outer retina were analyzed to identify CNV and normal choroidal vascular networks by two independent graders (A.A.F. and P.L.N.). We used the pseudo-colored images to grade the CNV and normal choroidal vessels as either inside or outside the area of GA. We also compared the en face appearance of anteriorly displaced normal choroidal vessels in treatment-naïve GA eyes to GA eyes following anti-VEGF for CNV. To do this, we analyzed the en face pseudo-colored images for qualitative differences, including vessel caliber, branching patterns, tortuosity, and spacing between vessels. Cross-sectional OCT with overlaid flow was used as the final arbitrator for the presence of CNV, which we defined as flow signal located above Bruch’s membrane that was not due to retinal projection artifacts.
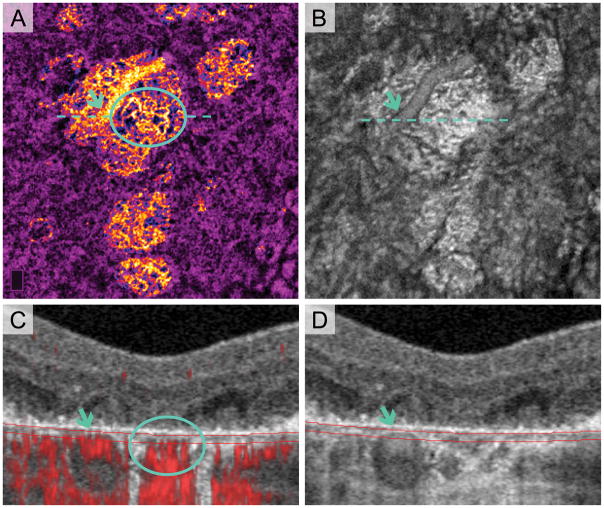
To validate the location of normal choroidal vessels within GA and confirm the absence of image artifacts, we manually segmented a ~16 μm thick en face slab on the OCTA (31–47 μm below RPE reference) to incorporate the anatomical choriocapillaris, seen in Figure 2. En face structural OCT of this slab and OCT B-scans were compared with the angiogram to assess the location of large choroidal vessels in areas of atrophy (Figure 2). We also used cross-sectional OCT to compare the location of major choroidal vessels outside areas of atrophy with respect to the RPE.
Fig. 2.
Anterior Displacement of Choroidal Vessels in Areas of Multi-Lobular Geographic Atrophy (GA). Treatment-naïve Eye with GA. A. Pseudo-colored OCT angiography (OCTA) of manually segmented slab at the anatomical choriocapillaris. Blue arrows indicate a large choroidal blood vessel displaced anteriorly, making it visible in choriocapillaris slab. Blue circle shows choroidal vessels with morphology suspicious for choroidal neovascularization (CNV). B. En face structural OCT with same segmentation as (A) clearly visualizes the large choroidal vessel (blue arrow). C. Cross-sectional OCT with red flow signal overlay. Red flow signal from large vessel (blue arrow) is entirely contained within the blood vessel structure on OCT in (D) (blue arrow), suggesting anterior displacement and not artifact. Location of red flow signal from possible CNV formation (circle) in (C) is below Bruch’s membrane and could represent CNV that has not infiltrated above Bruch’s membrane. It is also possible that these are residual (not neovascular) vessels that are part of the Sattler’s layer and have moved anteriorly into the area of atrophy.
Histology and Electron Microscopy
Donor eye tissue from an 87-year-old Caucasian male with clinically diagnosed late-stage AMD with GA (without CNV) was obtained in accordance with the Declaration of Helsinki and processed for transmission electronic microscopy (TEM) (Figures 3–5) with methods similar to those previously described.26 After the tissue was fixed, ultrathin sections were cut with a microtome (Ultramicrotome UCT; Leica Microsystems, Wetzlar, Germany), stained with uranyl acetate and lead citrate, and analyzed by TEM (H7600; Hitachi, Tokyo, Japan).
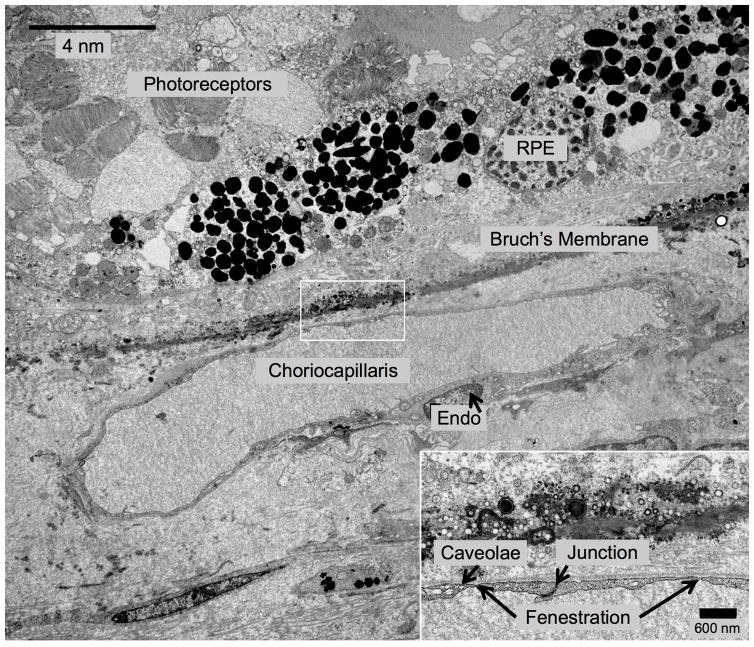
Fig. 3.
Transmission Electron Microscopy (TEM) of Inferior Choroid Outside the Area of Geographic Atrophy (GA). Treatment-Naïve Donor Eye with GA from 87-year-old Caucasian Male. In this area outside of GA, the retinal pigment epithelium and photoreceptors are present, but the photoreceptors appear disorganized. This blood vessel appears to be choriocapillaris because it lacks pericytes and the endothelial cells have very thin processes, as well as numerous fenestrations and tight junctions.
Fig. 5.
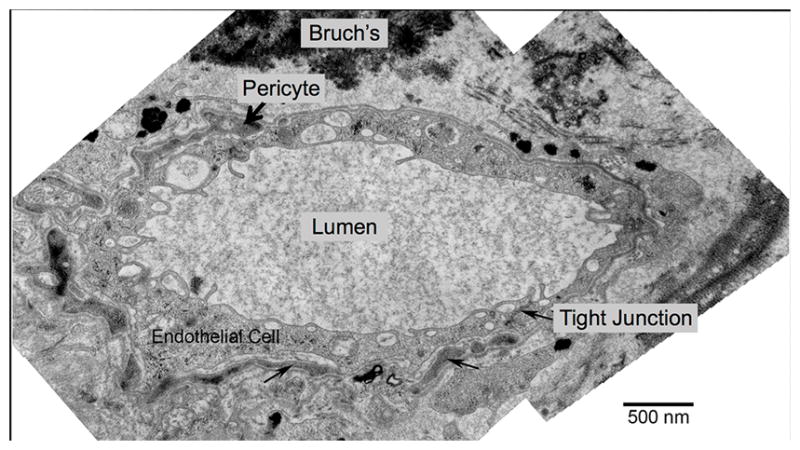
Transmission Electron Microscopy (TEM) Example of Choroidal Blood Vessel Abutting Bruch’s Membrane in Geography Atrophy (GA). Same Treatment-Naïve Donor Eye with GA shown Figures 3 and 4. This large blood vessel located within the area of atrophy (absent retinal pigment epithelium cells and photoreceptors and has a thin scar), abuts Bruch’s membrane (top), lacks fenestrations, and is surrounded by pericyte processes (black arrow, top).
Results
Demographic and Clinical Data
A total of 40 eyes from 33 patients with GA were included for this analysis. Of these, eight eyes of seven patients (3 female [42.9%]; mean age, 81.0 ± 7.02 years; range 72–90 years) had treatment-naïve GA, without prior history of anti-VEGF therapy (Figures 1–7: treatment-naïve). Thirty-two eyes of 26 patients (21 female [80.8%]; mean age, 83.5 ± 6.33 years; range 70–95 years) had been treated for CNV with intravitreal injections of anti-VEGF (mean 22.25 ± 21.64 injections; range 1–92 injections) (Figures 8+9: treated). Differences in age and VA were not significant between groups (P = 0.37 and P = 0.99, respectively) (Supplemental Table 1).
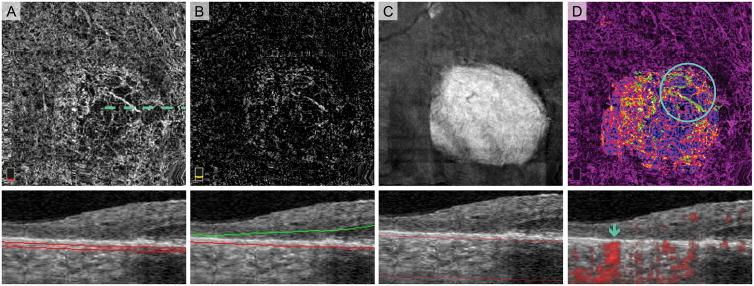
Fig. 7.
Normal Choroidal Vessels Artifactually Appearing in the Outer Retinal Slab of a Treatment-Naïve Eye with Geographic Atrophy (GA). A. OCT angiography (OCTA) of choriocapillaris and cross-sectional OCT with segmentation boundary lines. B. OCTA of outer retina and cross-section. Segmentation error (outer segmentation boundary displaced posteriorly in GA) as well as the anterior displacement of normal choroidal vessels cause vessels to appear in outer retina slab. C. En face structural OCT slab of the choroid used to select area of GA. D. Pseudo-colored OCTA of choriocapillaris and cross-sectional OCT with red flow overlay. In this figure, we added an extra post-processing step where blood vessels appearing in the outer retinal slab are pseudo-colored green and overlaid onto the choriocapillaris. Vessels with morphology suspicious for choroidal neovascularization (CNV) are highlighted by the circle. Blue arrow on the cross-sectional OCTA confirms that these vessels are below Bruch’s membrane and therefore not CNV.
Fig. 8.
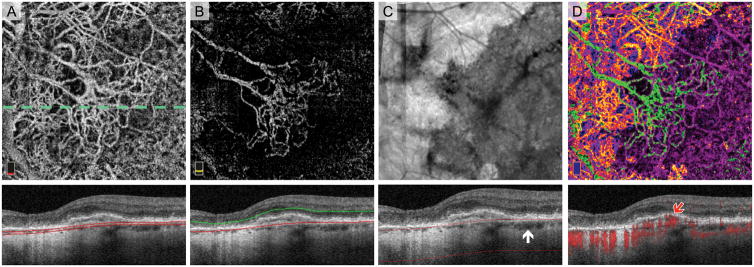
Choroidal neovascularization (CNV) along the Border of Geographic Atrophy (GA). A. OCT angiography (OCTA) of choriocapillaris and cross-sectional OCT with segmentation boundary lines. Choroidal vessels in GA (top and left quadrants) complicate angiogram interpretation. B. OCTA of outer retina with cross-section. The outer retina slab highlights the large CNV membrane outside GA (center) with large caliber feeder vessels extending into the GA (top left quadrant). C. En face structural OCT slab of the choroid used to select retinal pigment epithelium (RPE) atrophy. White arrow on cross-section shows the more posterior location of major choroidal vessels in areas without RPE atrophy. D. Pseudo-colored OCTA of choriocapillaris and cross-sectional OCT with red flow overlay. Blood vessels appearing in the outer retina are pseudo-colored green. Cross-sectional OCTA shows flow signal related to the CNV (red arrow) located below the intact elevated RPE (Type 1 CNV).
OCT Angiography Findings (Pre-Processing)
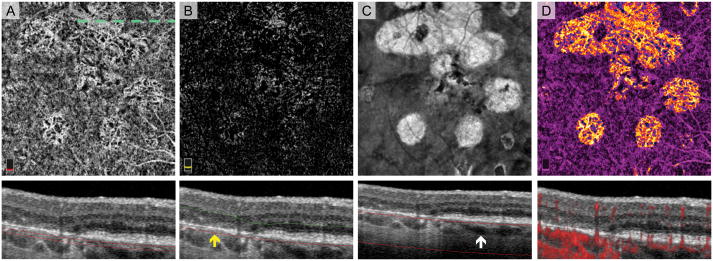
All 40 eyes (100%) had distinct networks of larger sized vessels visible on the choriocapillaris angiogram (Figure 1: treatment-naïve and Figure 9: treated). On cross-sectional OCT, these vessels were consistent with normal choroidal vessels that have been displaced anteriorly in the areas of GA and were closely abutting, but not infiltrating or above, Bruch’s membrane (Figure 2: treatment-naïve). Using a thin slab on OCTA and correlating with en face structural OCT and cross-sectional OCT, we found that the appearance of large choroidal vessels in the choriocapillaris slab was not due to any OCTA image artifacts (Figure 2: treatment-naïve). Major choroidal vessels in areas outside of GA were located more posteriorly and were not closely abutting Bruch’s membrane (Figure 6: treatment-naïve). In a majority of eyes (30 of 40 eyes: 75.0%), normal choroidal vascular networks in areas of GA were visualized in the outer retinal OCTA slab, due to failure of the segmentation algorithm. This occurred in five of the eight treatment-naïve eyes with GA (62.5%) (Figure 7: treatment-naïve). We found no apparent difference in the en face OCTA choroidal vascular appearance in GA comparing anti-VEGF treated to treatment-naïve eyes.
Fig. 9.
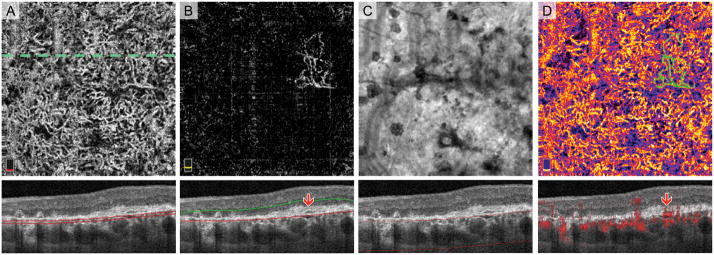
Choroidal Neovascularization (CNV) within the Area of Geographic Atrophy (GA). A. OCT angiography (OCTA) of choriocapillaris and cross-sectional OCT with segmentation boundary lines. The diffuse network choroidal vessels visible throughout the scan could either be normal choroidal vessels or CNV. B. En face OCTA of outer retina reveals flow signal suspicious for CNV. Cross-sectional OCT shows subretinal hyper-reflective material (SHRM) above the retinal pigment epithelium (RPE) also suggestive of CNV (red arrow). C. En face structural OCT slab of the choroid used to select area of RPE atrophy. D. Pseudo-colored OCTA of choriocapillaris and cross-sectional OCT with red flow overlay. Vessels in area of GA (entire scan) are pseudo-colored on a spectrum from blue to yellow. Vessels appearing in the outer retina are pseudo-colored green. This image illustrates that the CNV is entangled within the normal choroid. Cross-sectional OCTA reveals a subtle CNV lesion with red flow signal within the SHRM lesion (red arrow).
Fig. 6.
Choroidal Vessels Displaced toward Bruch’s Membrane in a Treatment-Naïve Eye with Multi-lobular Geographic Atrophy (GA). A. OCT angiography (OCTA) of choriocapillaris and cross-sectional OCT with segmentation boundary lines. In the area of GA, choroidal vessels are located in the same plane as is the choriocapillaris in areas outside GA. B. OCTA of outer retina (with suppression of projection artifact) and cross-sectional OCT. En face outer retina image shows flow signal that could be misinterpreted as choroidal neovascularization. The outer segmentation boundary on cross-section (red line) is artifactually displaced deeper into the superficial choroid in areas of retinal pigment epithelium (RPE) loss (yellow arrow). C. En face structural OCT slab of the choroid used to select the area of RPE atrophy. White arrow on cross-section shows the more posterior location of choroidal vessels in areas with no RPE atrophy. D. Pseudo-colored OCTA of choriocapillaris and cross-sectional OCT with red flow overlay. Pseudo-coloring confirms that flow signal related to outer retinal flow abnormalities is due normal choroidal vessels displaced anteriorly in GA.
Transmission Electron Microscopy of the Choroid in a Donor Eye with Treatment-Naïve Geographic Atrophy (Figures 3–5)
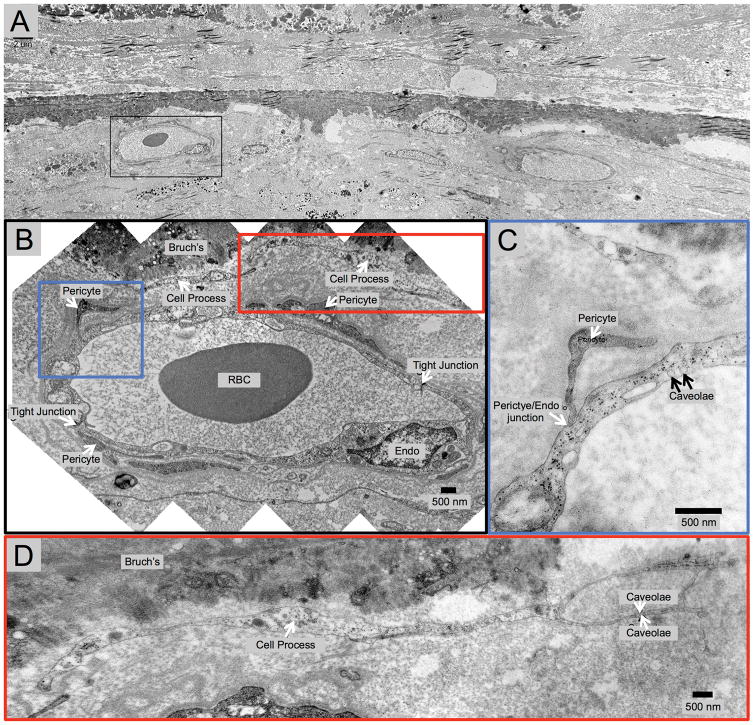
In a donor eye with treatment-naïve GA, Figure 3 shows TEM findings in a region where the RPE and photoreceptors are intact, outside the zone of GA. The overlying photoreceptors appear disorganized. A choriocapillaris blood vessel abuts Bruch’s membrane, as evidenced by an endothelial cell lining with very thin processes, tight junctions and numerous fenestrations, as well as an absence of pericytes.27, 28 Figure 4 ( same eye as Figure 3) shows TEM images within the area of GA, which illustrate anteriorly displaced intermediate choroidal blood vessels into the zone where choriocapillaris was once present. Figure 4 highlights a choroidal venule closely abutting (about 1–2 μm from) Bruch’s membrane in an area of GA. The blood vessel appeared to be a venule because it had pericytes enwrapping the entire blood vessel and it lacked fenestration of choriocapillaris. Additionally, there was a degenerate cell process between Bruch’s membrane and the vessel wall, perhaps a remnant of past choriocapillaris. Figure 5 (same eye) highlights another larger choroidal blood vessel closely abutting Bruch’s membrane within the area of GA.
Fig. 4.
Transmission Electron Microscopy (TEM) Demonstrating a Choroidal Venule Abutting Bruch’s Membrane in Geography Atrophy (GA). Same treatment-Naïve Donor Eye with GA shown in Figure 3. A. Low magnification TEM of area absent retinal pigment epithelium and photoreceptors, with several choriocapillaris lumens missing, thickening of Bruch’s membrane and a thin scar. The viable blood vessel (black box) is shown in B–D. B. Montage of higher magnification images reveals that the vessel is a venule, which closely abuts Bruch’s membrane in an area of GA. The venule lacks fenestrations and has pericyte processes surrounding the entire vessel. C. High magnification TEM from left box in (B) shows a pericyte on the venule in close proximity to Bruch’s membrane. D. High magnification TEM from right box in (B) highlights the proximity of the venule to Bruch’s membrane (~1–2 μm). The image also reveals degenerative cell processes between venule and Bruch’s membrane, which may represent remnants of choriocapillaris.
OCT Angiography Findings (Post-Processing)
Image post-processing successfully highlighted the choroidal vasculature within areas of atrophy compared to areas with intact RPE, where choroidal vasculature was less visible (Figure 1: treatment-naïve). This was useful for illustrating the extent and location of GA when interpreting en face OCTA, and prompted a careful exam of the cross-sectional OCTA to further assess the exact location of the vascular networks within the area of GA in relationship to Bruch’s membrane. Cross-sectional OCTA was needed to confirm the presence of CNV in all cases, as the distinction between CNV and normal choroidal vessels was not possible using en face OCTA alone (Figure 2: treatment-naïve and Figure 9: treated). In many cases, we found CNV and normal choroidal vascular networks to be similar in morphology (Figures 2,6+7: treatment-naïve and Figure 9: treated). Figure 2 shows a choroidal vascular network located below Bruch’s membrane that has a similar appearance to a CNV membrane, and may represent a neovascular formation that has not yet infiltrated above Bruch’s membrane.21
We also found that the loss of RPE within atrophy can lead to failure of the segmentation algorithm on OCTA, particularly of the outer retinal slab (with projection artifact removal), which is routinely used to identify the presence CNV. In general, the OCTA segmentation boundaries of the outer retinal slab were misplaced into the choroid in areas of atrophy, causing the normal choroidal vascular networks to be artifactually displayed in this slab. This simulated appearance of a tangled vascular network, which could be misinterpreted as CNV on en face OCTA (Figures 6+7: treatment-naïve). Twenty-eight of the treated eyes (87.5%) in our cohort contained some degree of fibrosis, SHRM, CNV, or blood in the outer retina which further complicated interpretation of en face OCTA, while only 1 treatment-naïve eye (12.5%) had these findings.
Of the 32 eyes with previous anti-VEGF treatment, 23 eyes (71.9%) had residual evidence of CNV (Figures 8+9: treated) while 9 eyes (28.1%) did not show evidence of residual pathological blood vessels on OCTA and had a similar appearance to angiograms of the treatment-naïve group. All 23 eyes with CNV on en face OCTA were confirmed by the presence of flow signal between Bruch’s membrane and the RPE, or above the RPE, on cross-sectional OCTA. Of these 23 eyes, 8 eyes (34.8%) showed CNV along the borders of atrophy (Figure 8: treated), and 15 eyes (65.2%) showed CNV primarily within the area of atrophy (Figure 9: treated). We were not able to identify residual RPE signature on cross sectional OCT in these CNV lesions that were located within the area of atrophy (Figure 9: treated).
Discussion
In the present study, we demonstrate a novel post-processing approach to highlight areas of atrophy on en face OCTA in order to facilitate the detection of CNV in eyes with complex AMD pathology. Our algorithm incorporates structural (OCT) and flow information (OCTA) from both the choriocapillaris and outer retina in a single image, which has not been demonstrated previously. We found that en face OCT angiograms in eyes with atrophy were difficult to interpret due to the presence of anteriorly displaced normal choroidal blood vessels that closely abut Bruch’s membrane. In this series of 40 eyes with atrophy and CNV, we found that cross-sectional OCTA was necessary for accurate interpretation of en face OCTA, especially in eyes with suspicion of combined atrophy/CNV phenotype in AMD.
GA and CNV, the two forms of advanced AMD, have classically been considered as two distinct entities. However, many studies have reported GA and CNV occurring in the same eye, simultaneously.9–12, 29–31 Sarks and colleagues were the first to describe the development of CNV on fluorescein angiography in 3.4% of patients clinically diagnosed with GA during a six month follow-up.9 Clinical and histological evidence of CNV outside the area of atrophy in patients with baseline GA suggest that new vessel growth could be dependent on the angiogenic factors secreted from viable RPE.9, 11, 20 Indeed, choriocapillaris loss is known to extend beyond the area of CNV into a zone with viable overlying RPE cells, which are presumed to be hypoxic.32 It has been suggested that angiogenic factors such as VEGF, released by these hypoxic RPE cells, may stimulate the formation of new vessels, which, in turn, may provide oxygen and nutrients to the RPE. More recent reports have characterized RPE and choriocapillaris atrophy, clinically similar to de novo GA, in patients undergoing intravitreal anti-VEGF therapy for CNV.6, 7, 33, 34 It remains to be confirmed whether RPE atrophy is the ultimate final evolution of treated neovascular AMD, regardless of the frequency or type of anti-VEGF.
While our study design does not allow us to gain insights into the pathogenesis of AMD or the order in which concurrent GA and CNV occurs, OCTA and the proposed algorithm provide a useful tool to improve the distinction of these lesions. The interpretation of en face OCTA in areas of RPE atrophy was complicated by the anterior displacement of residual medium-sized choroidal vessels. We confirmed this finding by using a thin segmentation slab and correlating the flow signal on en face OCTA with the location of choroidal vessels on en face structural OCT and cross-sectional OCT (Figure 2). Furthermore, we add evidence from electron microscopy in a donor eye showing anterior displacement of an intermediate sized choroidal venule, lying ~1–2 μm from Bruch’s membrane, much closer than would be expected in a healthy eye (Figures 4+5). We compared the region of atrophy in the donor eye (Figures 4+5) to an area with viable RPE and intact choriocapillaris (Figure 3). McLeod and colleagues have also previously provided histopathology examples of atrophic versus non-atrophic areas.20 Histopathologic studies have shown a wider zone of choriocapillary loss around CNV underneath viable RPE, whereas disruption of choriocapillaris is constrained within the borders of RPE loss in GA. In general, these studies and other similar ones have focused on the choriocapillaris have not characterized the remodeling of the remaining choroid in these eyes.20 In the current study we extend these findings to show that choroidal remodeling occurs in these areas of choriocapillaris atrophy with larger choroidal vessels moving anteriorly into the space originally occupied by choriocapillaris. Using structural OCT, we previously suggested this finding of anterior displacement of larger choroidal vessels to replace the atrophic choriocapillaris in eyes with AMD and reticular pseudodrusen.35
The complexity of interpreting OCTA in eyes with atrophy and anterior displacement of choroidal vessels was further exacerbated by software artifacts leading to displacement of the segmentation lines deeper into the choroid, due to thinning of the RPE-Bruch’s membrane boundary. It appears that when the RPE is absent or disrupted, the algorithm artifactually uses Bruch’s membrane as a surrogate for the RPE reference line. This is especially pertinent in eyes with pure GA without evidence of CNV where this artifact caused normal choroidal vessels to be artifactually detected in the outer retina slab on OCTA, masquerading as CNV (Figure 7). Even as segmentation and projection removal algorithms improve, the anterior displacement of choroidal vessels in areas of atrophy will likely still present a challenge for interpreting OCTA in eyes with CNV and atrophy. For example, using manual segmentation of the choriocapillaris slab just below the RPE, large choroidal vessels can still be visualized in areas of atrophy (Figure 2). Furthermore, we found that the segmentation algorithm and the process of projection artifact removal can fail in eyes with significant structural changes from pathology, such as SHRM, pigment epithelial detachments, subretinal fibrosis, or subretinal fluid (Figure 9). In our cohort, the majority of the treated eyes in our cohort contained some degree of fibrosis, SHRM, CNV, or blood in the outer retina, while only 1 treatment-naïve case had such findings. These software failures can be most disruptive in eyes with GA and suspected CNV, where we believe clinicians should use caution when interpreting en face OCTA. The presence of cross-sectional OCTA flow signal above Bruch’s membrane should be used in these eyes as the sine qua non for the presence of CNV.
Determining the anatomical location of flow signal becomes even more critical with the possibility of neovascular buds or formations in the choriocapillaris, which may be precursors of CNV, yet lie below Bruch’s membrane. In a recent histopathological study, Seddon et al found that neovascular formations (below Bruch’s membrane) were present in 40% of eyes with intermediate AMD. These neovascular formations were not yet visible clinically, leading the authors to speculate that they may be the choroidal precursors to clinically discerned CNV.21 Due to the distinct CNV morphology, we believe that we could visualize such choroidal neovascular precursors in our OCTA study. Figure 2 (circle) represents one of these potential CNV precursors, which could be discerned below Bruch’s membrane.
In the current study, we found eight CNV lesions located outside of, or closely abutting the borders of GA, consistent with histological studies.20, 32 In contrast, we also found 15 CNV lesions (undergoing anti-VEGF therapy) that were primarily located within the zone of atrophy. This finding is consistent with the findings in CATT study participants, where most of the incident atrophy developed within or in close proximity to the original CNV lesions.6 In these eyes, we could not identify the signature of RPE overlying the CNV lesions on OCT. This does not necessarily preclude the possibility that isolated microscopic islands of RPE cells, beyond the resolution of OCT, were still present. Future studies using polarization-sensitive OCT could be helpful to further examine RPE alteration overlying these CNV lesions.36 Using histological methods, McLeod et al have shown that viable RPE cells overlie CNV lesions in combined GA/CNV phenotypes, but these studies predated anti-VEGF therapy.20 To our knowledge, there have not been histological studies in eyes that developed atrophy in the setting of anti-VEGF therapy for CNV.
Limitations in this study include the cross sectional nature making it impossible to determine which phenotype (atrophy or CNV) occurred first in eyes demonstrating the combined phenotype. We were also limited by a small number of eyes in this study, which may reflect the small percentage of eyes in our practice that develop the combined atrophy/CNV phenotype. Similarly, the number of treated and treatment-naïve eyes was not balanced and the two groups were not sex-matched. Furthermore, SD-OCTA has limited depth penetration in the choroid due to inherent signal attenuation, precluding high-resolution visualization of the choriocapillaris underneath healthy RPE. Future studies using swept-source OCTA may be useful in this regard. It is important to note that failures of the segmentation algorithm described in this study may not extend to other commercial OCTA devices, since each uses its own specific parameters for segmentation. Finally, due to anatomical variance between individuals, additional donor eyes are needed to confirm our findings
In conclusion, using an OCTA post-processing approach, we have successfully highlighted atrophy and improved the interpretation of the OCT angiograms in complex AMD cases where CNV and atrophy co-exist. We found the algorithm particularly useful when normal choroidal blood vessels are displaced anteriorly in areas of pure atrophy, simulating CNV, which would complicate interpretation of OCTA in these eyes. We also found that cross-sectional OCTA, used in conjunction with en face OCTA was necessary for confirming the presence of CNV, especially given the potential for segmentation artifacts in these cases. Future longitudinal studies using our hybrid algorithm may allow clinicians to document the development of new CNV or GA in eyes with baseline pure phenotype and will be critical in elucidating the pathogenesis and course of the combined atrophy and CNV phenotype in AMD.
Supplementary Material
Summary Statement.
Anterior displacement of residual choroidal vessels underlying RPE atrophy can simulate choroidal neovascularization on en face OCT angiography, complicating the interpretation of these angiograms. We demonstrate a clinical and software approach to distinguish between neovascularization and residual (displaced) choroidal vasculature. This manuscript highlights important considerations when using OCT angiography in eyes with co-existing atrophy and neovascularization in age-related macular degeneration.
Acknowledgments
This work was funded in part by NIH grants EY021470 (AAF), EY016151 (GL), and EY01765 (Wilmer) and research instrument support by OptoVue, Inc. The funders had no role in study design, data collection and analysis, decision to publish, or preparation of the manuscript. The authors wish to acknowledge Dr. Gregory Hageman, Ph.D, University of Utah School of Medicine, for providing donor eye tissue, and Rhonda Grebe, BS, Johns Hopkins School of Medicine, for performing the histological methods.
Footnotes
Conflict of Interest: No conflicting relationship exists for any author.
Proprietary Interest: The authors have no proprietary interest in the subject of this manuscript.
References
- 1.Lamoureux EL, Mitchell P, Rees G, et al. Impact of Early and Late Age-Related Macular Degeneration on Vision-Specific Functioning. Br J Ophthalmol. 2010 doi: 10.1136/bjo.2010.185207. bjo. 2010.185207. [DOI] [PubMed] [Google Scholar]
- 2.Rosenfeld PJ, Brown DM, Heier JS, et al. Ranibizumab for Neovascular Age-Related Macular Degeneration. N Engl J Med. 2006;355:1419–31. doi: 10.1056/NEJMoa054481. [DOI] [PubMed] [Google Scholar]
- 3.Avery RL, Pieramici DJ, Rabena MD, et al. Intravitreal Bevacizumab (Avastin) for Neovascular Age-Related Macular Degeneration. Ophthalmology. 2006;113:363–72. e5. doi: 10.1016/j.ophtha.2005.11.019. [DOI] [PubMed] [Google Scholar]
- 4.Group CR. Ranibizumab and Bevacizumab for Neovascular Age-Related Macular Degeneration. N Engl J Med. 2011;364:1897. doi: 10.1056/NEJMoa1102673. [DOI] [PMC free article] [PubMed] [Google Scholar]
- 5.Rosenfeld PJ, Shapiro H, Tuomi L, et al. Characteristics of Patients Losing Vision after 2 Years of Monthly Dosing in the Phase Iii Ranibizumab Clinical Trials. Ophthalmology. 2011;118:523–30. doi: 10.1016/j.ophtha.2010.07.011. [DOI] [PubMed] [Google Scholar]
- 6.Grunwald JE, Daniel E, Huang J, et al. Risk of Geographic Atrophy in the Comparison of Age-Related Macular Degeneration Treatments Trials. Ophthalmology. 2014;121:150–61. doi: 10.1016/j.ophtha.2013.08.015. [DOI] [PMC free article] [PubMed] [Google Scholar]
- 7.Grunwald JE, Pistilli M, Ying G-s, et al. Growth of Geographic Atrophy in the Comparison of Age-Related Macular Degeneration Treatments Trials. Ophthalmology. 2015;122:809–16. doi: 10.1016/j.ophtha.2014.11.007. [DOI] [PMC free article] [PubMed] [Google Scholar]
- 8.Grunwald JE, Pistilli M, Daniel E, et al. Incidence and Growth of Geographic Atrophy During 5 Years of Comparison of Age-Related Macular Degeneration Treatments Trials. Ophthalmology. 2017;124:97–104. doi: 10.1016/j.ophtha.2016.09.012. [DOI] [PMC free article] [PubMed] [Google Scholar]
- 9.Sarks J, Sarks S, Killingsworth M. Evolution of Geographic Atrophy of the Retinal Pigment Epithelium. Eye. 1988;2:552–77. doi: 10.1038/eye.1988.106. [DOI] [PubMed] [Google Scholar]
- 10.Schatz H, McDonald HR. Atrophic Macular Degeneration: Rate of Spread of Geographic Atrophy Anti Visual Loss. Ophthalmology. 1989;96:1541–51. doi: 10.1016/s0161-6420(89)32694-7. [DOI] [PubMed] [Google Scholar]
- 11.Sunness JS, Gonzalez-Baron J, Bressler NM, et al. The Development of Choroidal Neovascularization in Eyes with the Geographic Atrophy Form of Age-Related Macular Degeneration. Ophthalmology. 1999;106:910–9. doi: 10.1016/S0161-6420(99)00509-6. [DOI] [PubMed] [Google Scholar]
- 12.Klein R, Meuer SM, Knudtson MD, Klein BE. The Epidemiology of Progression of Pure Geographic Atrophy: The Beaver Dam Eye Study. Am J Ophthalmol. 2008;146:692–9. e1. doi: 10.1016/j.ajo.2008.05.050. [DOI] [PMC free article] [PubMed] [Google Scholar]
- 13.Talisa E, Bonini Filho MA, Chin AT, et al. Spectral-Domain Optical Coherence Tomography Angiography of Choroidal Neovascularization. Ophthalmology. 2015;122:1228–38. doi: 10.1016/j.ophtha.2015.01.029. [DOI] [PubMed] [Google Scholar]
- 14.Kuehlewein L, Bansal M, Lenis TL, et al. Optical Coherence Tomography Angiography of Type 1 Neovascularization in Age-Related Macular Degeneration. Am J Ophthalmol. 2015;160:739–48. e2. doi: 10.1016/j.ajo.2015.06.030. [DOI] [PubMed] [Google Scholar]
- 15.Palejwala NV, Jia Y, Gao SS, et al. Detection of Non-Exudative Choroidal Neovascularization in Age-Related Macular Degeneration with Optical Coherence Tomography Angiography. Retina. 2015;35:2204. doi: 10.1097/IAE.0000000000000867. [DOI] [PMC free article] [PubMed] [Google Scholar]
- 16.Roisman L, Zhang Q, Wang RK, et al. Optical Coherence Tomography Angiography of Asymptomatic Neovascularization in Intermediate Age-Related Macular Degeneration. Ophthalmology. 2016;123:1309–19. doi: 10.1016/j.ophtha.2016.01.044. [DOI] [PMC free article] [PubMed] [Google Scholar]
- 17.Zhang Q, Chen C-L, Chu Z, et al. Automated Quantitation of Choroidal Neovascularization: A Comparison Study between Spectral-Domain and Swept-Source Oct Angiogramsautomated Cnv Quantitation Using Octa. Invest Ophthalmol Vis Sci. 2017;58:1506–13. doi: 10.1167/iovs.16-20977. [DOI] [PMC free article] [PubMed] [Google Scholar]
- 18.Cole ED, Ferrara D, Novais EA, et al. Clinical Trial Endpoints for Optical Coherence Tomography Angiography in Neovascular Age-Related Macular Degeneration. Retina. 2016;36:S83–S92. doi: 10.1097/IAE.0000000000001338. [DOI] [PubMed] [Google Scholar]
- 19.Sarks S, Sarks J. Age-Related Maculopathy: Nonneovascular Age-Related Macular Degeneration and the Evolution of Geographic Atrophy. Retina. 2001;2:1064–99. [Google Scholar]
- 20.McLeod DS, Taomoto M, Otsuji T, et al. Quantifying Changes in Rpe and Choroidal Vasculature in Eyes with Age-Related Macular Degeneration. Invest Ophthalmol Vis Sci. 2002;43:1986–93. [PubMed] [Google Scholar]
- 21.Seddon JM, McLeod DS, Bhutto IA, et al. Histopathological Insights into Choroidal Vascular Loss in Clinically Documented Cases of Age-Related Macular Degeneration. JAMA Ophthalmol. 2016 doi: 10.1001/jamaophthalmol.2016.3519. [DOI] [PMC free article] [PubMed] [Google Scholar]
- 22.Group A-REDSR. The Age-Related Eye Disease Study System for Classifying Age-Related Macular Degeneration from Stereoscopic Color Fundus Photographs: The Age-Related Eye Disease Study Report Number 6. Am J Ophthalmol. 2001;132:668–81. doi: 10.1016/s0002-9394(01)01218-1. [DOI] [PubMed] [Google Scholar]
- 23.Holladay JT. Proper Method for Calculating Average Visual Acuity. J Refract Surg. 1997;13:388–91. doi: 10.3928/1081-597X-19970701-16. [DOI] [PubMed] [Google Scholar]
- 24.Jia Y, Tan O, Tokayer J, et al. Split-Spectrum Amplitude-Decorrelation Angiography with Optical Coherence Tomography. Opt Express. 2012;20:4710–25. doi: 10.1364/OE.20.004710. [DOI] [PMC free article] [PubMed] [Google Scholar]
- 25.Lujan BJ, Rosenfeld PJ, Gregori G, et al. Spectral Domain Optical Coherence Tomographic Imaging of Geographic Atrophy. Ophthalmic Surg Lasers Imaging Retina. 2009;40:96–101. doi: 10.3928/15428877-20090301-16. [DOI] [PubMed] [Google Scholar]
- 26.Baba T, Grebe R, Hasegawa T, et al. Maturation of the Fetal Human Choriocapillaris. Invest Ophthalmol Vis Sci. 2009;50:3503–11. doi: 10.1167/iovs.08-2614. [DOI] [PMC free article] [PubMed] [Google Scholar]
- 27.Hogan J. Choroid. Histology of the Human Eye. 1971:320–92. [Google Scholar]
- 28.Garron LK. The Ultrastructure of the Retinal Pigment Epithelium with Observations on the Choriocapillaris and Bruch’s Membrane. Trans Am Ophthalmol Soc. 1963;61:545. [PMC free article] [PubMed] [Google Scholar]
- 29.Group MPS. Five-Year Follow-up of Fellow Eyes of Patients with Age-Related Macular Degeneration and Unilateral Extrafoveal Choroidal Neovascularization. Arch Ophthalmol. 1993;111:1189. doi: 10.1001/archopht.1993.01090090041018. [DOI] [PubMed] [Google Scholar]
- 30.Maguire MG, Bressler SB, Bresskr NM, et al. Risk Factors for Choroidal Neovascularization in the Second Eye of Patients with Juxtafoveal or Subfoveal Choroidal Neovascularization Secondary to Age-Related Macular Degeneration. Arch Ophthalmol. 1997;115:741–7. doi: 10.1001/archopht.1997.01100150743009. [DOI] [PubMed] [Google Scholar]
- 31.Group A-REDSR. The Age-Related Eye Disease Study Severity Scale for Age-Related Macular Degeneration: Areds Report No. 17. Arch Ophthalmol. 2005;123:1484. doi: 10.1001/archopht.123.11.1484. [DOI] [PMC free article] [PubMed] [Google Scholar]
- 32.McLeod DS, Grebe R, Bhutto I, et al. Relationship between Rpe and Choriocapillaris in Age-Related Macular Degeneration. Invest Ophthalmol Vis Sci. 2009;50:4982–91. doi: 10.1167/iovs.09-3639. [DOI] [PMC free article] [PubMed] [Google Scholar]
- 33.Martin DF, Maguire MG, Fine SL, et al. Ranibizumab and Bevacizumab for Treatment of Neovascular Age-Related Macular Degeneration: Two-Year Results. Ophthalmology. 2012;119:1388–98. doi: 10.1016/j.ophtha.2012.03.053. [DOI] [PMC free article] [PubMed] [Google Scholar]
- 34.Chakravarthy U, Harding SP, Rogers CA, et al. Alternative Treatments to Inhibit Vegf in Age-Related Choroidal Neovascularisation: 2-Year Findings of the Ivan Randomised Controlled Trial. The Lancet. 2013;382:1258–67. doi: 10.1016/S0140-6736(13)61501-9. [DOI] [PubMed] [Google Scholar]
- 35.Sohrab M, Wu K, Fawzi AA. A Pilot Study of Morphometric Analysis of Choroidal Vasculature in Vivo, Using En Face Optical Coherence Tomography. PLoS One. 2012;7:e48631. doi: 10.1371/journal.pone.0048631. [DOI] [PMC free article] [PubMed] [Google Scholar]
- 36.Roberts P, Sugita M, Deák G, et al. Automated Identification and Quantification of Subretinal Fibrosis in Neovascular Age-Related Macular Degeneration Using Polarization-Sensitive Octfibrosis in Ps-Oct. Invest Ophthalmol Vis Sci. 2016;57:1699–705. doi: 10.1167/iovs.15-18694. [DOI] [PubMed] [Google Scholar]
Associated Data
This section collects any data citations, data availability statements, or supplementary materials included in this article.


