Abstract
Layer-by-layer cell printing is useful in mimicking layered tissue structures inside the human body and has great potential for being a promising tool in the field of tissue engineering, regenerative medicine, and drug discovery. However, imaging human cells cultured in multiple hydrogel layers in 3D-printed tissue constructs is challenging as the cells are not in a single focal plane. Although confocal microscopy could be a potential solution for this issue, it compromises the throughput which is a key factor in rapidly screening drug efficacy and toxicity in pharmaceutical industries. With epifluorescence microscopy, the throughput can be maintained at a cost of blurred cell images from printed tissue constructs. To rapidly acquire in-focus cell images from bioprinted tissues using an epifluorescence microscope, we created two layers of Hep3B human hepatoma cells by printing green and red fluorescently labeled Hep3B cells encapsulated in two alginate layers in a microwell chip. In-focus fluorescent cell images were obtained in high throughput using an automated epifluorescence microscopy coupled with image analysis algorithms, including three deconvolution methods in combination with three kernel estimation methods, generating a total of nine deconvolution paths. As a result, a combination of Inter-Level Intra-Level Deconvolution (ILILD) algorithm and Richardson-Lucy (RL) kernel estimation proved to be highly useful in bringing out-of-focus cell images into focus, thus rapidly yielding more sensitive and accurate fluorescence reading from the cells in different layers.
Keywords: Image deconvolution, microarray 3D bioprinting, layered cell printing, fluorescent cell imaging
Introduction
Three-dimensional (3D) bioprinting offers tremendous advantage for developing 3D tissue constructs with various applications in research areas including tissue engineering, regenerative medicine, disease modeling, cancer research, and drug discovery. Bioprinting allows high control over the microenvironments of bioprinted tissue constructs and thus enables more accurate representations of in vivo tissue structure.1,2 This technology further facilitates the use of bioprinted tumor/tissue models for preclinical drug testing with potential for replacing the use of inaccurate animal models for drug testing. For example, a 3D co-culture of primary hepatocytes with non-parenchymal cells such as Kupffer cells have already been shown to predict in vivo response more accurately than two-dimensional (2D) cell monolayer cultures, reaffirming the idea that the interaction between hepatocytes and surrounding cells plays an important role in hepatocyte function.3 The ability to form tissue-like structures is highly inhibited in 2D, and cells cultured in 2D rapidly lose some of their phenotypic properties when compared to 3D cultures aimed to mimic tissues in vivo.4,5 Nonetheless, imaging human cells cultured in 3D poses an inherent challenge because of opaque bioprinted tissue constructs in relatively large dimensions (typically 1 cm3 or larger). In addition, imaging human cells printed in multiple hydrogel layers using conventional 3D bioprinters have been problematic and cumbersome due to cells spread in X and Y directions as well as the Z direction, completely lacking a single focal plane. This may lead to inaccurate measurement and analysis of target specific signals, cellular morphologies, reporter signals, and phenotype profiling.6
One way to address these issues is to culture human cells in miniature 3D spheroids on a chip via microarray bioprinting. The microarray bioprinting technology refers to printing an array of human cells in biomimetic hydrogels rapidly either on functionalized glass slides or on microarray chip platforms such as a micropillar chip and a 384-pillar plate.7,8 For example, miniaturized 3D culture of human liver cells encapsulated in Matrigel has been demonstrated on the micropillar chip by printing nanoscale volume of cell samples (typically 30 – 60 nL) using an automated microarray spotter.9 The micropillar chip with printed cells was then sandwiched with a complementary microwell chip that contained typically 950 nL of growth media, recombinant viruses, test compounds, and fluorescent dyes. Microarray bioprinting offers clear advantages, which include extremely small amounts of cells, natural and synthetic hydrogels, extracellular matrices (ECMs), growth factors (GFs), compounds, and reagents required for creating and evaluating 3D cultured cells.10 Ultrahigh-throughput printing allows to test a variety of 3D cell culture conditions and individual drugs/mixtures of drugs in combinations, which makes it well suited for early stage, high-throughput screening (HTS) in pharmaceutical industries. Cell encapsulation protocols developed on the microarray chip platforms are flexible and allow for culturing multiple cell types from different tissues in hydrogels on the chip, consequently providing more insight into potential tissue-specific toxicity of compounds. Finally, acquiring images of cell spheroids from small, transparent spots in approximately 600 μm diameter and 100 μm thickness is easy and straightforward because the whole sample depth fits within the focus depth of a normal objective. As a result, this technology has found a niche in wide range of studies from metabolism-induced toxicity9,11–13 and anticancer drug screening2,14 to immunofluorescent cell imaging15 and RNAi16 in a relatively short period of time.
Nonetheless, human cell printing on the micropillar chip and the 384-pillar plate has been limited to a single cell spot per pillar for 3D spheroid cultures due to the small area of the pillar tip, and the spheroid cultures may not represent tissue structures in vivo. To better mimic in vivo microenvironments for tissue regeneration and disease modeling, human cell types can be printed directly into the microwell chip at higher volume (typically 300 – 1000 nL) by layer-by-layer approaches.8 As compared to conventional 3D bioprinting as well as mixed cell co-culture, layered cell printing in the microwell chip is still advantageous in creating mini-tissues due to its small dimensions. However, acquiring cell images from transparent hydrogel layers in approximately 1200 μm diameter and up to 1000 μm thickness is now challenging because the whole sample depth in the Z direction does not fit within the focus depth of a normal objective.8
Imaging technologies such as confocal microscopy and light-sheet microscopy are highly desired for 3D image acquisition due to their ability to obtain high resolution images at different optical sections.17–20 However when it comes to cost effectiveness, versatility, and high throughput, epifluorescent microscopes are still an imaging system of choice. Rapid image acquisition which is important for high-throughput compound screening can be achieved with epifluorescent microscopes. However, the resolution of cell images obtained might be compromised when the cells are on multiple focal planes due to the spatial distribution of cells in 3D, resulting in out-of-focus images. To obtain better focused images while maintaining high throughput and low cost, several deconvolution algorithms have been developed to reverse the effect of blurring from the images and yield more accurate information.21–23 Deconvolution aims to deblur the images by virtually bringing the subjects into the same plane, leading to yielding more accurate fluorescence data.24
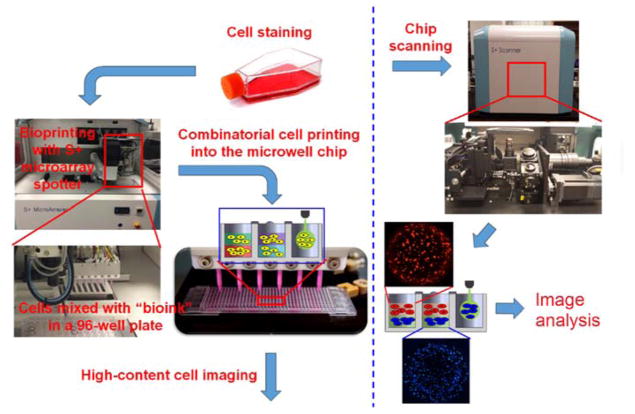
In the present study, we have established an optimum deconvolution pathway using fluorescent images acquired from miniaturized tissue constructs in the microwell chip and enhanced the quality of out-of-focus cell images by comparing a combination of three kernel estimation methods and three deconvolution methods (Fig. 1). Our approach may enable better understanding of tissue regeneration at cellular and molecular levels and mechanistic assessment of drug toxicity and efficacy on 3D printed tissues.
Figure 1. Schematics of the microarray 3D bioprinting process.
Cultured Hep3B cells at varying concentrations were printed in 6 blocks in two layers into a microwell chip using a microarray spotter (S+ Microarrayer). The microwell chip was scanned with an automated epifluorescent microscope (S+ Scanner), and then the images obtained were processed, deconvoluted, and quantified for analysis.
Methods
Cell Culture
Hep3B cells were cultured in RPMI-1640 medium (Sigma Aldrich, R8757) supplemented with 10% fetal bovine serum (FBS) (Corning, 35-010-CV), 1% penicillin/streptomycin, and 0.1% gentamicin in T-75 flasks in a 5 % CO2 incubator at 37°C. The cells were sub-cultured when they reached 80 – 90% confluency, and 1 million cells were seeded in 15 mL of the growth medium in a new T-75 flask.
Cell Staining
To test the efficiency of various deconvolution methods, Hep3B cells in T-75 flasks were stained with Hoechst 33342 (Thermo Fisher Scientific, H1399), a blue nucleus dye and tetramethylrhodamine methyl ester (TMRM) (Thermo Fisher Scientific, T-668), a red-orange mitochondrial dye separately. Briefly, Hep3B cells in T-75 flasks were incubated with 25 μM of Hoechst 33342 and 0.5 μM of TMRM for 30 minutes at 37°C and then detached with 1 mL of 0.05% Trypsin-EDTA. Both the Hoechst-stained and TMRM-stained Hep3B cells were suspended in 10 mL of RPMI-1640 containing 10% FBS and centrifuged at 220g for 4 minutes (1200 rpm in A-4-38 Eppendorf 5702) each. After removing the supernatant, the cell pellets were re-suspended in complete RPMI, and the number of cells were counted to prepare Hep3B cell suspension at 3 million cells/mL. Cells in RPMI were 2-fold serially diluted with 3% (w/v) alginate to prepare cell samples at seeding density ranging from 1.5 million cells/mL to 0.094 million cells/mL in 0.75% (w/v) alginate for printing.
Cell Printing
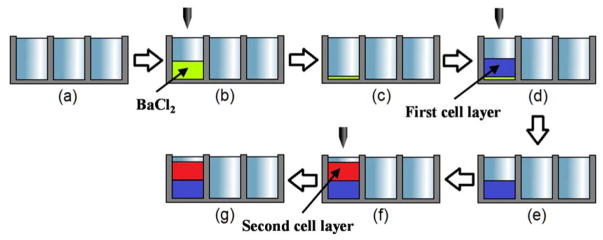
Cell printing was done in a microwell chip made of polystyrene, which is manufactured via plastic injection molding technology (SODIC PLUSTECH injection molder from Samsung Electro-Mechanics Co., Suwon, Republic of Korea). The microwell chip contains 532 microwells in 1.2 mm diameter and 1.5 mm microwell-to-microwell distance. The Hoechst-stained cells and the TMRM-stained cells were printed alternately in two layers to create two test conditions. The cell printing process is outlined in Fig. 2. For in situ gelation of alginate, a solution of barium chloride (BaCl2) (Sigma Aldrich, 529591) was prepared in sterile deionized water at a concentration of 20 mM and printed at 320 nL volume in the microwell chip using a microarray spotter (S+ Microarrayer, Samsung Electro-Mechanics Co.). The microwell chip containing 320 nL of BaCl2 was left to dry for 24 hours, followed by printing 320 nL of either the Hoechst-stained or the TMRM-stained Hep3B cells in 0.75% (w/v) alginate at five different cell concentrations (1.5, 0.75, 0.375, 0.188, 0.094 million cells/mL) and a control region with no cells. The microwell chip was then placed in a humid chamber for 15 minutes to ensure complete gelation of alginate after cell printing. Once the gelation was achieved, another layer of 320 nL of either the TMRM-stained or the Hoechst-stained Hep3B cells in 0.75% alginate were printed at the same cell concentration ranges as the first layer. The microwell chip was then placed in the humid chamber for 15 minutes to ensure complete gelation. The viability of Hep3B cells in 0.75% alginate printed in the microwell chip was measured by staining the cells with calcein AM (Thermo Fisher Scientific), and their viability found to be greater than 90%.
Figure 2. Experimental procedures for microarray 3D bioprinting.
(a) treat a microwell chip with plasma, (b) print 320 nL of 20 mM BaCl2 for the gelation of the alginate layers printed, (c) dry the BaCl2 solution for 24 hours, (d) print 320 nL of the Hoechst-stained or the TMRM-stained Hep3B cells in alginate, (e) incubate the microwell chip in a humid chamber for 15 minutes for complete gelation, (f) print 320 nL of the Hoechst-stained or the TMRM-stained Hep3B cells in alginate, and (g) incubate the chip in a humid chamber for 15 minutes for gelation.
Cell Image Acquisition
Immediately after cell printing, the microwell chip was sealed with a semi-permeable membrane (Sigma Aldrich, Z380059 Breathe-Easy sealing membrane) to prevent evaporation, and then loaded in a chip scanner (S+ Scanner, Samsung Electro-Mechanics Co.), which is an automated epifluorescence microscope developed for rapid image acquisition at 15 frames per second (FPS). Images were obtained at 4X magnification with Olympus UPLFLN 4X (Numerical aperture (NA) 0.13, f-number 26.5, and depth of field (DOF) ~ 32.3 μm) (Olympus, Tokyo, Japan) which was illuminated by a mercury lamp. A blue filter (Semrock DAPI-506C-000) and a red filter (Semrock TxRed-4040C-000) was used to separate the color channels from the Hoechst-stained and the TMRM-stained Hep3B cells in the microwell chip at 80 ms and 100 ms exposure time, respectively. Cell images were obtained at a fixed focus plane of 300 μm Z-height from the bottom of each well for both the Hoechst-stained and the TMRM-stained Hep3B cell layers. As the height of two cell layers (i.e., 640 nL) in a microwell with a radius of 600 μm was approximately 560 μm, the Z-height of 300 μm was used to acquire cell images from the top layer and to check for the interference from the fluorescently labelled cells in the bottom layer. With this Z-height setting of the focus planes and the DOF of 32.3 μm, we acquired both in-focus as well as out-of-focus cell images from the top layer.
Deconvolution
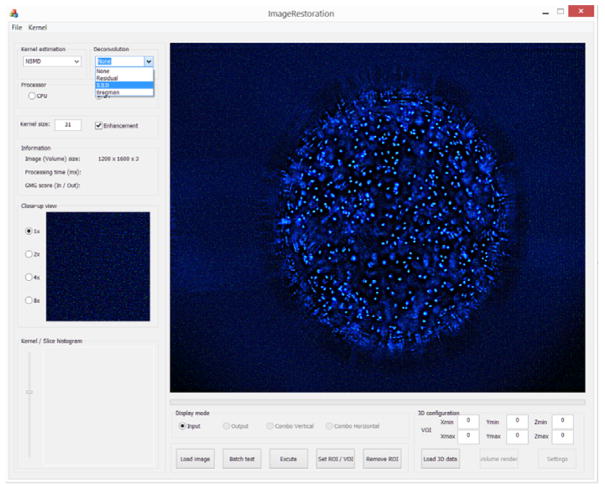
Blue and red fluorescent images obtained from S+ Scanner were processed with Image Restoration software from Advanced Technology Incorporated (ATI, Incheon, Republic of Korea) as shown in Fig. 3. Three kernel estimation methods including Richardson-Lucy (RL),25 Selective Stable Edge Blind Deconvolution (SSEBD),26 and Normalized Sparsity Deconvolution (NMSD)27 as well as three deconvolution methods including Bregman,28 Residual,29 and Inter-Level Intra-Level Deconvolution (ILILD),30 were used to process the images in a total of nine different combinations of deconvolution processes.
Figure 3. Picture of ATI’s Image Restoration software.
Kernel estimation and deconvolution methods can be selected from the drop-down lists in Kernel estimation and Deconvolution tabs.
The algorithms used are briefly described as follows. RL is a traditional deconvolution algorithm developed independently by William Richardson and Leon Lucy in 1972 and 1974 respectively. The algorithm was derived from Bayes’ theorem, and is an iterative process, the blind form of which alternates between estimating the point spread function (kernel) and the object (deblurred image), and converges on the maximum likelihood solution for the kernel.25 SSEBD determines the kernel using the estimated edges, or stable edges, in the image. The solution is closed form, which does not necessitate the iterative optimization needed in other traditional/common deconvolution algorithms.26 NMSD utilizes a regularization method based on a normalized sparsity measure which allows for a simple cost formulation, resulting in a fast and robust kernel estimation method.27 Goldstein and Osher repurposed Bregman’s algorithm for finding common point of convex sets to form the split-Bregman algorithm, which was used to denoise MRI images.31 The split-Bregman algorithm was repurposed as part of the Total Variation regularization used to balance between recovering high-frequency information and suppressing noise as part of the deconvolution process.28 Residual deconvolution refers to the use of residual images, which are the lost detail layers from traditional Richardson-Lucy deconvolution, to reduce ringing artifacts that are common in such traditional deconvolution techniques.29 ILILD is a pyramid structured (multi-layered) algorithm where inter-level deconvolution is performed at multiple levels of resolution, from coarse to fine. In addition, at each level, residual deconvolution (intra-level deconvolution) is performed to recover edge features and details.30
Image Processing and Data Analysis
After deconvolution, image processing was performed with ImageJ (an open source image processing software) followed by data analysis with R (an open source statistical analysis program). An ImageJ plugin was created to process the deconvoluted images. Background noise was subtracted from the images using the ImageJ-native rolling ball background subtraction method along with a brightness threshold filter. A circular region of interest was selected to measure fluorescence only from the area where the cells were located and exclude the extraneous regions. The plugin also statistically evaluated if a spot was detached (cell-containing alginate detached from microwells resulting in no fluorescence) or if an imaging artifact or dust greatly impacted the fluorescence of a spot, and omitted those exceptions from the final dataset. Fluorescence was measured, and the resulting data were stored in a tsv format. The data file was then imported into R and plotted via an R script written for this experiment. For each deconvolution combination, R and MS-excel were both used to gather noteworthy statistical terms such as slope, intercept, R2, normalized Root Mean Squared Error (nRMSE), F-statistic, and the standard errors (SEs) of slope, intercept, and regression. Slope and the standard error of slope was intended as a measure of sensitivity of fluorescence to the number of cells in the microwell chip while R2, nRMSE, F-statistic, and SEs of intercept and regression were intended as a measure of wellness of fit. The intercept was intended to diagnose extraneous problems with the protocol such as background noise.
Results
The blue and red fluorescent images were processed in two parts: kernel estimation and deconvolution. Kernel estimation determines the blurring factor, also known as the point spread function (PSF), and deconvolution uses the estimated PSF to deblur the image.32 A total of nine deconvolution paths formed from the combination of three kernel estimation methods (NMSD, RL, and SSEBD) and three deconvolution methods (Bregman, Residual, and ILILD) were compared.
Blue images from Hoechst-stained Hep3B cells
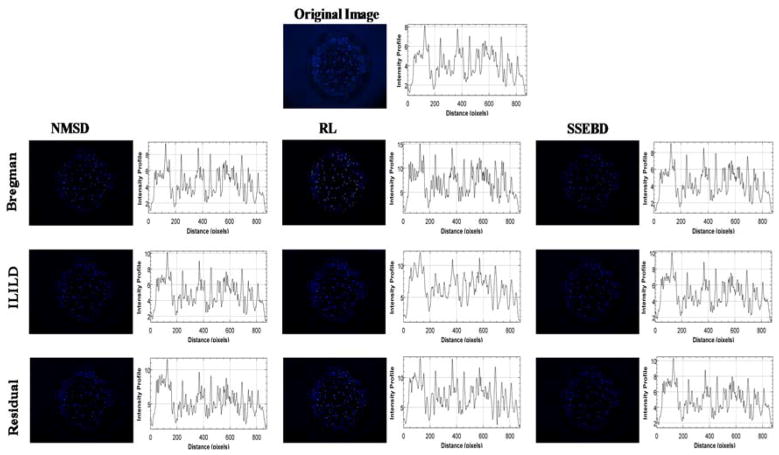
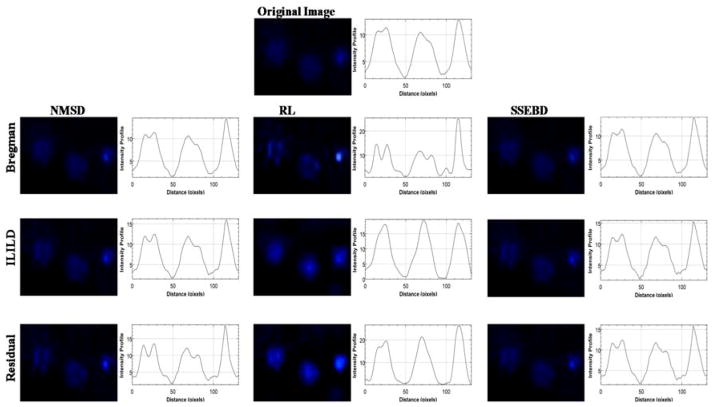
The original unprocessed blue fluorescent image is displayed at the top, which is compared with a grid of processed/deconvoluted images below along with graphs depicting the intensity profile on their side (Fig. 4) and the histogram of pixel intensity (Supplementary Fig. 1). Horizontal axis represents different kernel estimation methods, and vertical axis represents different deconvolution methods. These images represent suspension of the Hoechst-stained Hep3B cells in alginate gel in one microwell processed by indicated kernel estimation and deconvolution methods. In the unprocessed image, some cells are in clear focus, while others appear blurred or smeared, indicating that they are either above or below the focal plane. All processed images display significantly lower background fluorescence than the original image where a noticeable blue hue can be observed even outside the circular microwell region. Moreover, differing deconvolution pathways affected the image in visually identifiable ways. RL-Bregman image demonstrates the infamous ringing artifacts of Richardson-Lucy algorithm.33 Various combinations of aforementioned deconvolution algorithms were tested. Deconvolution combination such as NMSD-Residual strongly highlights already in-focus cells, which is not the desired characteristic for deblurring out-of-focus cells. Fig. 5 shows a region of the fluorescent image from Fig. 4 where three out-of-focus cells can be observed. As mentioned, RL-Bregman (as well as NMSD-Residual) tends to deblur or highlight cells that were already focused to some degree while having less impact on more significantly blurred cells. RL-ILILD and RL-Residual, however, can deblur significantly the blurred cells and improve their fluorescence while avoiding over-amplification of fluorescence of already focused cells. This deblurring effect can also be observed in the graph of intensity profiles where smooth peaks appear for the deblurred object from RL-ILILD and RL-Residual. The rest of the deconvolution pathways seem to have a much more subdued effect.
Figure 4.
Comparison of the original Hoechst-stained Hep3B cell image with nine processed images obtained from three kernel estimation methods and three deconvolution methods. Graphs depicting the intensity profiles are shown adjacent to the fluorescent images.
Figure 5.
Comparison of the original out-of-focus Hep3B cell image with nine processed images obtained from three kernel estimation methods and three deconvolution methods. Graphs depicting the intensity profiles are shown adjacent to the fluorescent images.
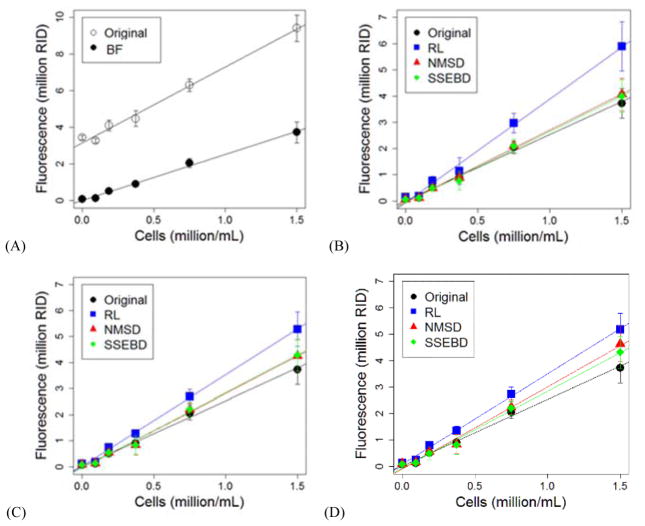
Fluorescence reading from the images were quantified, aggregated, and plotted against the cell seeding density as shown in Fig. 6. The Y-axes in all four plots represent raw integrated density (RID), which is the summation of pixel brightness values in an image, measured using ImageJ’s Measure function. The error bars represent standard deviation and the top left plot demonstrates the effect of brightness filter (BF) on the calibration curve. The intercept is notably lower and closer to 0 while the slope remains relatively similar. The other plots demonstrate the effect of deconvolution, grouped by deconvolution methods: Bregman, ILILD, and Residual. These plots also include a calibration curve for the brightness filter but not deconvoluted images for comparison. In all the nine combination of deconvolution algorithms, slope of the calibration curve was found to be raised because of deconvolution. Kernel estimation method seems to have a consistent effect on the calibration curve – RL tends to raise the slope most significantly. NMSD and SSEBD also demonstrated an increase of slope, but the increase is not as significant. RL-Bregman resulted in the highest slope, but also with the highest deviation and error.
Figure 6.
The changes of mean fluorescence as a function of Hoechst-stained Hep3B cell density (million/mL): (A) the effect of brightness filter (BF) and the effect of the three deconvolution methods including (B) Bregman, (C) ILILD, and (D) Residual.
The relevant statistical terms from the analysis, including slope, were tabulated in Table 1. The vertical axis indicates various deconvolution combination pathways as well as the non-deconvoluted but brightness-filtered control. The horizontal axis indicates various statistical terms that were compared. The values were color coded by value per statistical term in ascending, descending, or some other logic depending on the nature of the statistical term. Slope, intercept, R2, nRMSE, F-statistic, as well as the SEs of slope, intercept, and regression. As seen in the calibration curve plots, the slope was increased by the application of any of the tested combinations of deconvolution pathways. Using RL as the kernel estimation method resulted in the highest slopes with RL-Bregman having the highest of ~74,000 RID per million cells. RL-Residual and RL-ILID increased the slope by a factor of ~1.19 and ~1.28 respectively. Deconvolution increased the absolute value of intercept. R2 value was improved most with RL-ILILD and RL-Residual. However, R2 value decreased with certain deconvolution pathways such as RL-Bregman and SSEBD-Residual. F-statistic is highest with RL-ILILD and RL-Residual while other deconvolution pathways lead to a decreased F-statistic. RMSE was normalized by the mean of the measured values to yield nRMSE – this was done to account for the significant increase in range of measured values because of deconvolution as indicated by the significant increase in slope. Like R2 values, RL-ILILD and RL-Residual most improved nRMSE while other deconvolution pathways increased the nRMSE. The standard error columns demonstrate the non-normalized error values of the slope, intercept, and regression – if normalized, RL-ILILD and RL-Residual would again have the lowest standard error terms.
Table 1.
Comparison of statistical terms of curve fitting for Hoechst-stained cell images.
| Heat map for the calibration curves: | |||||||||
|---|---|---|---|---|---|---|---|---|---|
|
| |||||||||
| Kernel Estimation Method | Deconvolution Method | Slope (RID per cells/mL) | Intercept (RID per cells/mL) | R2 | nRMSE | F-statistic | SE | ||
| Slope | Intercept | Estimate | |||||||
| Original w/Brightness Filter | 2.52 | 1.04 × 10⁻² | 0.956 | 0.225 | 11.00 × 10² | 2.40 × 10⁻² | 1.70 × 10⁻² | 2.77 × 10⁻¹ | |
| NMSD | Bregman | 2.74 | 3.46 × 10⁻² | 0.958 | 0.230 | 11.32 × 10² | 2.57 × 10⁻² | 1.82 × 10⁻² | 2.97 × 10⁻¹ |
| NMSD | ILILD | 2.87 | 4.45 × 10⁻² | 0.952 | 0.247 | 9.89 × 10² | 2.88 × 10⁻² | 2.04 × 10⁻² | 3.33 × 10⁻¹ |
| NMSD | Residual | 3.10 | 8.52 × 10⁻² | 0.952 | 0.252 | 10.04 × 10² | 3.09 × 10⁻² | 2.19 × 10⁻² | 3.57 × 10⁻¹ |
| RL | Bregman | 3.95 | 5.62 × 10⁻² | 0.944 | 0.266 | 8.52 × 10² | 4.28 × 10⁻² | 3.02 × 10⁻² | 4.94 × 10⁻¹ |
| RL | ILILD | 3.51 | 1.91 × 10⁻² | 0.970 | 0.186 | 15.98 × 10² | 2.78 × 10⁻² | 1.96 × 10⁻² | 3.21 × 10⁻¹ |
| RL | Residual | 3.42 | 8.79 × 10⁻² | 0.971 | 0.173 | 17.03 × 10² | 2.62 × 10⁻² | 1.85 × 10⁻² | 3.02 × 10⁻¹ |
| SSEBD | Bregman | 2.71 | 5.08 × 10⁻² | 0.947 | 0.262 | 8.92 × 10² | 2.87 × 10⁻² | 2.03 × 10⁻² | 3.31 × 10⁻¹ |
| SSEBD | ILILD | 2.89 | 4.85 × 10⁻² | 0.952 | 0.247 | 9.96 × 10² | 2.89 × 10⁻² | 2.04 × 10⁻² | 3.34 × 10⁻¹ |
| SSEBD | Residual | 2.91 | 6.64 × 10⁻² | 0.951 | 0.252 | 9.81 × 10² | 2.94 × 10⁻² | 2.08 × 10⁻² | 3.40 × 10⁻¹ |
Red images from TMRM-stained Hep3B cells
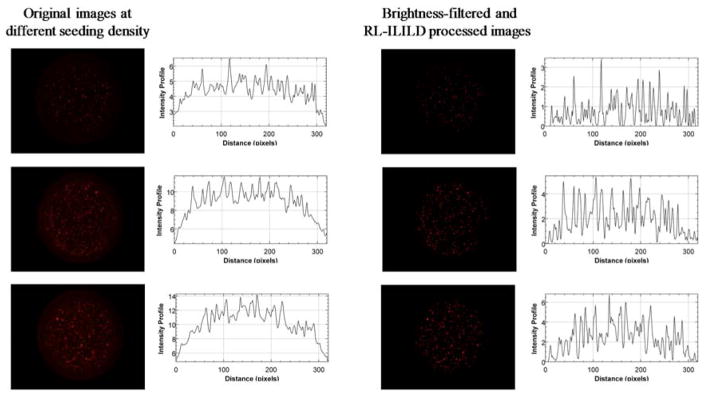
Fig. 7 shows the original, non-deconvoluted, non-brightness-filtered images along with the graph of intensity profiles on the left column and the corresponding RL-ILILD deconvoluted, brightness-filtered images along with the graph of intensity profiles on the right column. A variety of cells can be found in the image: some are sharp and focused whereas others are large and diffused, indicating that cells are indeed suspended in 3D and distributed along the Z-axis. As with Hoechst, the original images display some non-specific background fluorescence, which appears as a single block with small peaks emanating from it on the adjacent graph of intensity profiles. Visually, the deconvoluted images present with significantly less background fluorescence, and the cells’ fluorescence are sharper and more like one another, which appears as sharp and separated peaks in the graphs. Since, the images are brightness-filtered, the peak intensity was slightly decreased when compared to original images. Fig. 8 compares the calibration curve of the original brightness-filtered images and the deconvoluted, brightness-filtered images, and the calibration curve derived from the deconvoluted, brightness-filtered images has a significantly higher slope, indicating a greater sensitivity to change in cell count/concentration. Table 2 contains the relevant statistical terms comparing the two TMRM calibration curves, in which the RL-ILILD deconvoluted calibration curve has more than double the slope of the non-deconvoluted calibration curve. Due to deconvolution, the intercept was brought closer to zero as it should be since zero cells should result in zero fluorescence. R2 value, F-statistic, and nRMSE, all improved with deconvolution. R2 value increased from ~0.708 to ~0.907, the F-statistic increased from ~1220 to ~4940, and nRMSE decreased from ~0.770 to ~0.377. The SEs for the slope, intercept, and regression, all increased with deconvolution, however, due to the notable change in slope, normalization would bring them below the standard errors of the calibration curve of the original non-deconvoluted images.
Figure 7.
Comparison of original TMRM-stained Hep3B cell images at three different cell seeding density with brightness-filtered and deconvoluted (RL-ILILD) images. Graphs depicting the intensity profile are shown adjacent to the fluorescent images.
Figure 8.
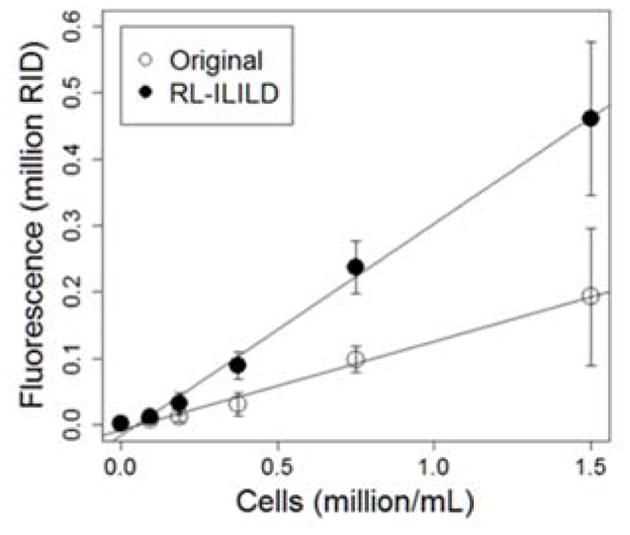
The changes of mean fluorescence as function of TMRM-stained Hep3B cell density (million/mL).
Table 2.
Comparison of statistical terms of curve fitting for TMRM-stained cell images.
| Heat map for the calibration curves: | |||||||||
|---|---|---|---|---|---|---|---|---|---|
|
| |||||||||
| Kernel estimation method | Deconvolution method | Slope (RID per cells/mL) | Intercept (RID per cells/mL) | R2 | nRMSE | F-statistic | SE | ||
| Slope | Intercept | Regression | |||||||
| Original w/brightness filter | 0.133 | −0.739 × 10⁻² | 0.708 | 0.770 | 1.22 × 10³ | 3.81 × 10⁻³ | 2.70 × 10⁻³ | 4.41 × 10⁻² | |
| RL | ILILD | 0.319 | −1.56 × 10⁻² | 0.908 | 0.377 | 4.94 × 10³ | 4.54 × 10⁻³ | 3.21 × 10⁻³ | 5.24 10−2 |
Discussion
Since its inception in 1983, deconvolution has been widely used to improve or restore images of biological specimens in three-dimensions.34 Deconvolution algorithm not only improves the resolution of images, but also enhances the contrast and reduces noise, thereby overcoming the inherent limitations of the widefield microscopes.21,23,35 Since the introduction of traditional deconvolution techniques, i.e. Weiner or Richardson-Lucy deconvolution, a wide variety of kernel (PSF) estimation and deconvolution algorithms have been developed, focusing on not only efficacy but also optimizing speed and minimizing artifacts.21,34 In this paper, a few kernel estimation methods and deconvolution methods, ranging from the old to the cutting edge, are tested in a combinatorial fashion using images from a modern cell culturing platform, 3D bioprinting in the microwell chip.
The deconvolution pathway, RL-ILILD, was found to most improve the sensitivity and the wellness-of-fit of the cell fluorescence calibration curve compared to other pathways for Hoechst-stained Hep3B cell images. Qualitatively, the RL-Residual and RL-ILILD processed images did not display problematic deconvolution artifacts such as ringing as in the case of RL-Bregman. Interestingly, although the slope was significantly improved with RL-Bregman, the wellness of fit was found to be significantly decreased, suggesting that the ringing artifacts may have significantly impacted the fit of the curve, and that suppressing those artifacts through further modification might make RL-Bregman method the ideal deconvolution pathway. As shown in Fig. 4, RL-Residual and RL-ILILD are capable of deblurring out-of-focus cells while avoiding amplified fluorescence of already-focused cells as in the case of NMSD-Residual. The F-statistic and the related R2 value indicate that RL-Residual and RL-ILILD marginally improved the wellness of fit. More importantly, those two deconvolution methods did not significantly decrease the wellness of fit. The non-normalized errors were increased with RL-Residual and RL-ILILD, however, normalized RMSE in fact decreased with RL-Residual and RL-ILILD, which indicates that the significantly increased slope accounts for the slight increase in error. In fact, RL-Residual and RL-ILILD reduced nRMSE by 23.1% and 17.3% respectively.
Lastly, RL-Residual has the highest absolute value of the intercept, which indicates theoretical fluorescence at zero cells. However, it only contributes ~1.1% of the total fluorescence at 8 million cells, which indicates that none of the tested deconvolution pathways significantly increased the absolute value of the intercept. Nonetheless, as previously mentioned, it would be ideal to have the calibration curve naturally result in an intercept of zero. In short, RL-ILILD was found to most improve the calibration curve for the purposes of estimating cell count based on fluorescence. To test the impact of deconvolution on images of non-Hoechst stained cells, images of TMRM-stained Hep3B cells were deconvoluted and compared. The deconvolution pathway RL-ILILD was again found to improve the sensitivity (slope) and the wellness-of-fit (R2, F-statistic, and nRMSE). This result suggests that this deconvolution process could be generalized to various stains of differing spectra.
Conclusion
Deconvolution paths established in this study could be highly useful for improving the resolution of 3D cell images obtained from epifluorescent/widefield microscopes, which are widely used for cost-effective, versatile, and high-throughput cell imaging. With careful evaluation and selection of various kernel estimation methods, deconvolution algorithms, and associated parameters, we concluded that deconvolution can improve the sensitivity of fluorescence to cell count as well as wellness-of-fit. In the future, spheroid analysis can be used in conjunction with deconvolution to better capture not only the number of cells, but also other characteristics such as cell size and cell morphology in various 3D culture platforms without compromising the throughput of image acquisition.
Supplementary Material
Acknowledgments
This work is supported by a R01 grant from National Institutes of Health (NIEHS R01ES025779) and institutional grants from Cleveland State University (Faculty Research Development and Faculty Innovation Fund). The authors declare a potential conflict of interest with Advanced Technology Incorporated (ATI) as Image Restoration software developed by Mr. Yi Ju Park at ATI is used in this study.
Contributor Information
Sean Yu, Department of Chemical and Biomedical Engineering, Cleveland State University, 455 Fenn Hall, 1960 East 24th Street, Cleveland, Ohio 44115-2214, USA.
Pranav Joshi, Department of Chemical and Biomedical Engineering, Cleveland State University, 455 Fenn Hall, 1960 East 24th Street, Cleveland, Ohio 44115-2214, USA.
Yi Ju Park, Advanced Technology Inc. (ATI), 112 Gaetbeol-ro, Yeonsu-gu, Incheon, Republic of Korea.
Kyeong-Nam Yu, Department of Chemical and Biomedical Engineering, Cleveland State University, 455 Fenn Hall, 1960 East 24th Street, Cleveland, Ohio 44115-2214, USA.
Moo-Yeal Lee, Department of Chemical and Biomedical Engineering, Cleveland State University, 455 Fenn Hall, 1960 East 24th Street, Cleveland, Ohio 44115-2214, USA.
Literature Cited
- 1.Murphy SV, Atala A. 3D bioprinting of tissues and organs. Nat Biotechnol. 2014;32(8):773–785. doi: 10.1038/nbt.2958. [DOI] [PubMed] [Google Scholar]
- 2.Knowlton S, Onal S, Yu CH, Zhao JJ, Tasoglu S. Bioprinting for cancer research. Trends Biotechnol. 2015;33(9):1–10. doi: 10.1016/j.tibtech.2015.06.007. [DOI] [PubMed] [Google Scholar]
- 3.Godoy P, Hewitt NJ, Albrecht U, et al. Recent advances in 2D and 3D in vitro systems using primary hepatocytes, alternative hepatocyte sources and non-parenchymal liver cells and their use in investigating mechanisms of hepatotoxicity, cell signaling and ADME. Arch Toxicol. 2013;87:1315–1530. doi: 10.1007/s00204-013-1078-5. [DOI] [PMC free article] [PubMed] [Google Scholar]
- 4.Pampaloni F, Reynaud EG, Stelzer EHK. The third dimension bridges the gap between cell culture and live tissue. Nat Rev Mol Cell Biol. 2007;8(10):839–845. doi: 10.1038/nrm2236. [DOI] [PubMed] [Google Scholar]
- 5.Lee J, Cuddihy MJ, Kotov NA. Three-dimensional cell culture matrices: state of the art. Tissue Eng Part B Rev. 2008;14(1):61–86. doi: 10.1089/teb.2007.0150. [DOI] [PubMed] [Google Scholar]
- 6.Charwat V, Schutze K, Holnthoner W, et al. Potential and limitations of microscopy and Raman spectroscopy for live-cell analysis of 3D cell cultures. J Biotechnol. 2015;205:70–81. doi: 10.1016/j.jbiotec.2015.02.007. [DOI] [PubMed] [Google Scholar]
- 7.Datar A, Joshi P, Lee M-Y. Biocompatible Hydrogels for Microarray Cell Printing and Encapsulation. Biosensors. 2015;5(4):647–663. doi: 10.3390/bios5040647. [DOI] [PMC free article] [PubMed] [Google Scholar]
- 8.Lee M-Y. Microarray Bioprinting Technology: Fundamentals and Practises. Springer International Publishing; 2016. [DOI] [Google Scholar]
- 9.Kwon SJ, Lee DW, Shah DA, et al. High-Throughput and Combinatorial Gene Expression on a Chip for Metabolism-Induced Toxicology Screening. Nat Commun. 2014;5(3739):1–16. doi: 10.1037/a0013262.Open. [DOI] [PMC free article] [PubMed] [Google Scholar]
- 10.Berthuy OI, Blum LJ, Marquette CA. Cells on chip for multiplex screening. Biosens Bioelectron. 2016;76:29–37. doi: 10.1016/j.bios.2015.04.024. [DOI] [PubMed] [Google Scholar]
- 11.Lee DW, Lee M-Y, Ku B, et al. Application of the DataChip/MetaChip technology for the evaluation of ajoene toxicity in vitro. Arch Toxicol. 2013;88(2):283–290. doi: 10.1007/s00204-013-1102-9. [DOI] [PubMed] [Google Scholar]
- 12.Lee M-Y, Kumar RA, Sukumaran SM, Hogg MG, Clark DS, Dordick JS. Three-dimensional cellular microarray for high-throughput toxicology assays. Proc Natl Acad Sci. 2008;105(1):59–63. doi: 10.1073/pnas.0708756105. [DOI] [PMC free article] [PubMed] [Google Scholar]
- 13.Lee M-Y, Park CB, Dordick JS, Clark DS. Metabolizing enzyme toxicology assay chip (MetaChip) for high-throughput microscale toxicity analyses. Proc Natl Acad Sci. 2005;102(4):983–987. doi: 10.1073/pnas.0406755102. [DOI] [PMC free article] [PubMed] [Google Scholar]
- 14.Wang C, Tang Z, Zhao Y, Yao R, Li L, Sun W. Three-dimensional in vitro cancer models: a short review. Biofabrication. 2014;6(2):22001. doi: 10.1088/1758-5082/6/2/022001. [DOI] [PubMed] [Google Scholar]
- 15.Wang Y, Ahmad AA, Shah PK, Sims CE, Magness ST, Allbritton NL. Capture and 3D culture of colonic crypts and colonoids in a microarray platform. Lab Chip. 2013;13(23):4625–4634. doi: 10.1039/c3lc50813g. [DOI] [PMC free article] [PubMed] [Google Scholar]
- 16.Kim HC, Kim G-H, Cho S-G, Lee EJ, Kwon Y-J. Development of a cell-defined siRNA microarray for analysis of gene functionin human bone marrow stromal cells. Stem Cell Res. 2016;16(2):365–376. doi: 10.1016/j.scr.2016.02.019. [DOI] [PubMed] [Google Scholar]
- 17.Flottmann B, Gunkel M, Lisauskas T, et al. Correlative light microscopy for high-content screening. Biotechniques. 2013;55(5):243–252. doi: 10.2144/000114099. [DOI] [PubMed] [Google Scholar]
- 18.Graf BW, Boppart SA. Imaging and analysis of three-dimensional cell culture models. Methods Mol Biol. 2010;591:211–227. doi: 10.1007/978-1-60761-404-3. [DOI] [PMC free article] [PubMed] [Google Scholar]
- 19.Jahr W, Schmid B, Schmied C, Fahrbach FO, Huisken J. Hyperspectral light sheet microscopy. Nat Commun. 2015;6:1–7. doi: 10.1038/ncomms8990. [DOI] [PMC free article] [PubMed] [Google Scholar]
- 20.Scherf N, Huisken J. The smart and gentle microscope. Nat Biotechnol. 2015;33(8):815–818. doi: 10.1038/nbt.3310. [DOI] [PubMed] [Google Scholar]
- 21.Shaw P. Deconvolution in 3-D optical microscopy. Histochem J. 1994;26(9):687–694. doi: 10.1007/BF00158201. [DOI] [PubMed] [Google Scholar]
- 22.Broxton M, Grosenick L, Yang S, et al. Wave optics theory and 3-D deconvolution for the light field microscope. Opt Express. 2013;21(21):25418. doi: 10.1364/OE.21.025418. [DOI] [PMC free article] [PubMed] [Google Scholar]
- 23.Sage D, Donati L, Soulez F, et al. DeconvolutionLab2: An open-source software for deconvolution microscopy. Methods. 2017;115:28–41. doi: 10.1016/j.ymeth.2016.12.015. [DOI] [PubMed] [Google Scholar]
- 24.Murphy DB, Davidson MW. Fundamentals of Light Microscopy and Electronic Imaging. 2. John Wiley & Sons, Inc; 2013. Confocal Laser Scanning Microscopy; pp. 265–305. [Google Scholar]
- 25.Fish DA, Brinicombe AM, Pike ER, Walker JG. Blind deconvolution by means of the Richardson–Lucy algorithm. J Opt Soc Am A. 1995;12(1):58. doi: 10.1364/JOSAA.12.000058. [DOI] [Google Scholar]
- 26.Li W, Cui X, Nguyen VH, Do TD, Park I, Kim H. Blind image deconvolution based on robust stable edge prediction. 3rd IEEE EMBS International Conference on Biomedical and Health Informatics, BHI 2016; IEEE; 2016. pp. 66–69. [DOI] [Google Scholar]
- 27.Krishnan D, Tay T, Fergus R. Blind deconvolution using a normalized sparsity measure. Proceedings of the IEEE Computer Society Conference on Computer Vision and Pattern Recognition; IEEE; 2011. pp. 233–240. [DOI] [Google Scholar]
- 28.Getreuer P. Total Variation Deconvolution using Split Bregman. Image Process Line. 2012;2:158–174. doi: 10.5201/ipol.2012.g-tvdc. [DOI] [Google Scholar]
- 29.Yuan L, Sun J, Quan L, Shum H-Y. Image deblurring with blurred/noisy image pairs. ACM Trans Graph. 2007;26(3):1–10. doi: 10.1145/1275808.1276379. [DOI] [Google Scholar]
- 30.Ding Y, Park I, Cui X, et al. Inter-level and intra-level deconvolution based image deblurring algorithm for wide field microscopy. Proceedings - 2015 8th International Conference on BioMedical Engineering and Informatics, BMEI 2015; Shenyang: IEEE; 2015. pp. 90–95. [DOI] [Google Scholar]
- 31.Goldstein T, Osher S. The split Bregman method for L1-regularized problems. SIAM J Imaging Sci. 2009;2(2):323–343. doi: 10.1137/080725891. [DOI] [Google Scholar]
- 32.Campisi P, Egiazarian K. In: Blind Image Deconvolution: Theory and Applications. Campisi P, Egiazarian K, editors. CRC Press; 2007. [DOI] [Google Scholar]
- 33.Yang HL, Chiao YH, Huang PH, Lai SH. Lecture Notes in Computer Science (Including Subseries Lecture Notes in Artificial Intelligence and Lecture Notes in Bioinformatics) Vol. 7088. LNCS; 2011. Blind image deblurring with modified Richardson-Lucy deconvolution for ringing artifact suppression; pp. 240–251. [DOI] [Google Scholar]
- 34.Sibarita JB. Deconvolution microscopy. Adv Biochem Eng Biotechnol. 2005;95:201–243. doi: 10.1007/b102215. [DOI] [PubMed] [Google Scholar]
- 35.Biggs DSC. 3D deconvolution microscopy. Curr Protoc Cytom. 2010;52:12.19.1–12.19.20. doi: 10.1002/0471142956.cy1219s52. [DOI] [PubMed] [Google Scholar]
Associated Data
This section collects any data citations, data availability statements, or supplementary materials included in this article.


