

Abstract
The growth and survival of organisms often depend on interactions between them. In many cases, these interactions are positive and caused by a cooperative modification of the environment. Examples are the cooperative breakdown of complex nutrients in microbes or the construction of elaborate architectures in social insects, where the individual profits from the collective actions of her peers. However, organisms can similarly display negative interactions by changing the environment in ways that are detrimental for them, for example by resource depletion or the production of toxic byproducts. Here we find an extreme type of negative interactions, in which Paenibacillus sp. bacteria modify the environmental pH to such a degree that it leads to a rapid extinction of the whole population, a phenomenon we call ecological suicide. Modification of the pH is more pronounced at higher population densities, and thus ecological suicide is more likely with increasing bacterial density. Correspondingly, promoting bacterial growth can drive populations extinct whereas inhibiting bacterial growth by the addition of harmful substances – like antibiotics – can rescue them. Moreover, ecological suicide can cause oscillatory dynamics, even in single-species populations. We find ecological suicide in a wide variety of microbes, suggesting that it could play a significant role in microbial ecology and evolution.
Introduction
Microbes depend on their environment but also modify it1–4. An especially important environmental parameter for microbial growth is the pH, since protein and lipid membrane stability depend strongly on it5,6. Microbes have a species-dependent pH optimum at which they grow best 7,8 and environmental pH away from this optimum either inhibits growth or can even cause cell death 9,10. At the same time, bacteria change the environmental pH by their metabolic activities 9,11. In this way, microbes can potentially induce pH values that are detrimental for their own growth and thus harm themselves.
Results
The soil bacterium Paenibacillus sp. (most similar to Paenibacillus tundrae, for more information about this strain see Supplementary Information) can grow in a medium that contains 1% glucose as the main carbon source, in addition to a small amount of complex nutrients (see Methods for details). In soil the amount of carbohydrates lies in the range from 0.1%12 to 10%13, mostly in the form of complex carbohydrates. Starting from neutral pH we measured a strong acidification of the environment to a pH of around 4 during bacterial growth by secreting a variety of organic acids (Fig. 1a, Supplementary Fig. 1b). Upon reaching this low pH, the bacteria suddenly start to die, resulting in a non-monotonic growth curve (Fig. 1a), since Paenibacillus sp. cannot survive at low pH values (Supplementary Fig. 1A and Supplementary Fig. 3). Indeed, after 24h of incubation, we find that there are no viable cells in the culture (as measured by colony forming units after 48h incubation on rich medium, which may exclude cells that could grow after more than 48h). We note that the bacterial densities that are reached in this experiments lie within the range that can be found in soil 14,15 and soil has even a slightly lower buffering capacity than our medium (Supplementary Fig. 2). Moreover, ecological suicide also appears on non-glycolytic substrates (like glycerol) and also complex sugars like starch (Supplementary Fig. 1). We call this rapid population extinction due to environmental modification “ecological suicide” - a phenomenon that has been previously speculated about16,17.
Fig. 1. Microbial acidification can cause ecological suicide.

Paenibacillus sp. was grown in well-mixed batch culture in media containing 1% glucose as main carbon source and minor amounts of complex nutrients (see methods). (a) At low buffer concentrations (10mM phosphate) initially growing bacteria change the pH of the medium so drastically that they cause their own extinction. (b–c) Adding increasing amounts of buffer (14 and 100mM phosphate) tempers the acidification, and finally allows for survival of the bacteria. Mean bacterial density (CFU/ml) and SEM are shown for three technical replicates in orange (solid line and shaded region, respectively). pH is shown in gray (solid line); the shaded region depicts the estimated measurement accuracy.
The correlation between the drop of pH and the onset of death suggests that the bacteria themselves may be responsible for their eventual extinction by lowering the pH into regions in which they cannot survive. To test this idea, we added buffer to the medium to temper the pH change. The buffer indeed slows down the death process (Fig. 1b) and prevents it completely at sufficiently high concentrations (Fig. 1c). Thus, it is the pH change that causes the death of the bacteria and the presence of buffer can hinder ecological suicide. These results show that initially flourishing bacterial populations can corrupt their environment and thus cause their own extinction. The pH change resembles a ‘public bad’ that is collectively produced and harms all members of the populations. This phenomenology can be recapitulated by a simple mathematical description based on negative feedback of the bacteria and the environmental pH (Supplementary Discussion and Supplementary Fig. 10).
Since bacteria collectively change the pH, higher bacterial densities can deteriorate the environment more strongly and thus expedite ecological suicide. We tested this idea experimentally by measuring the fold growth within 24h for different initial bacterial densities and different buffer concentrations. At low buffer concentrations, the bacteria die by ecological suicide independent of their initial density, whereas at high buffer concentrations they always survive (Fig. 2a). At intermediate buffer concentrations, however, survival becomes density-dependent (Fig. 2a). For high initial cell densities, the bacteria die within 24h, but below a critical initial density, the bacteria grow and survive. The fitness of the bacteria thus decreases dramatically with increasing cell density. This aspect of ecological suicide is thus opposite of the well-known Allee effect, where fitness increases with population density18–20. Although the observed death at high cell densities is reminiscent to death at high densities in common logistic growth models, in our experiments death continues until all cells have died out, whereas in logistic growth the density stabilizes at the carrying capacity.
Fig. 2. Ecological suicide can cause oscillations in the population size over time.

(a) At low buffer concentration (10mM phosphate) the bacteria commit ecologic suicide and at high buffer concentration (100mM phosphate) the bacteria grow, in both cases independent of their initial density. However, in moderate buffer concentration (26mM phosphate) the bacteria die at high starting densities and grow at low starting densities. The fold growth at high buffer concentration decreases for increasing initial bacterial densities since the final bacterial density equals the carrying capacity and is thus constant. Mean (solid lines) and SEM (error bars) are shown for four replicates. (b) To explore long time growth dynamics the bacteria were grown in a daily dilution scheme with 24h of incubation in well mixed conditions followed by a 1/100x dilution into fresh media. (c and e). At low (10mM phosphate) and high (100mM phosphate) buffer conditions the bacteria either die on the first day or grow to saturation every day. (d) However, at medium buffer conditions we measure oscillatory dynamics of the bacterial density. This is accompanied by oscillations in the time the bacteria need to acidify the environment (acidification time, Supplementary Fig. 8). The exact type of oscillatory dynamics depends on the slope and shape of the curve in (a), as discussed in more detail in the supplement. The four blue lines in (c–e) (solid, dashed, dotted, dashed-dotted) show different replicates. The strong differences between the replicates highlight the sensitivity of these oscillations to experimental conditions and that they do likely not show a limit cycle oscillation.
What does this growth behavior mean for the long-term growth dynamics of a population such as occurs in growth with daily dilution into fresh media? Fig. 2a shows how the bacterial density after one day of growth depends on the initial bacterial density. For intermediate buffering the bacteria die for high initial densities but grow for low initial densities. This may cause oscillatory dynamics, since high bacterial densities cause low densities on the next day and vice versa. Indeed, this intuitive prediction is fully supported by a mathematical description based on negative feedback of the bacteria and the environmental pH alone, which shows a bifurcation of the end-of-the-day bacteria densities upon changing the buffer concentration (see Supplementary Information and Supplementary Fig. 11 and 12). To test this prediction, we cultivated the bacteria in batch culture with a daily dilution of the culture 1/100x into fresh media. As expected from Fig. 2a, for low buffering the bacteria go extinct on the first day and for high buffering they grow up to the same saturated density each day (Fig. 2c, e, Supplementary Fig. 6 and 8a). For intermediate buffering, however, the bacteria show oscillatory dynamics as predicted by our model (Fig. 2d, Supplementary Fig. 8b and 10). The oscillations of the populations are accompanied by oscillations of the time at which the pH drops each day (acidification time, Fig. 2d and Supplementary Fig. 5 and 8b), which again shows the connection between pH change and ecological suicide. Ecological suicide caused by environmental deterioration therefore can drive oscillatory dynamics even in populations consisting of just one species.
We have seen that low bacterial densities lead to less deterioration of the environment and thus a less deadly effect on the bacteria. Therefore, effects that hinder bacterial growth by harming the bacteria may be able to save the population from ecological suicide. A first hint in this direction is given by changing the glucose concentration. While one would naively expect that an increase in glucose concentrations is beneficial, in the presence of ecological suicide, the opposite is the case (Fig 3a). At low glucose concentrations, the bacteria grow to lower densities, which hardly changes the pH and therefore allows the bacteria to survive. At high glucose concentrations, bacterial growth causes environmental acidification and thus ecological suicide. The bacterial population is therefore only able to survive in nutrient-poor conditions. Moreover Fig. 3a shows that ecological suicide can be observed even at rather low nutrient concentrations of around 0.2% glucose.
Fig. 3. Inhibiting growth of the bacteria can save the population.
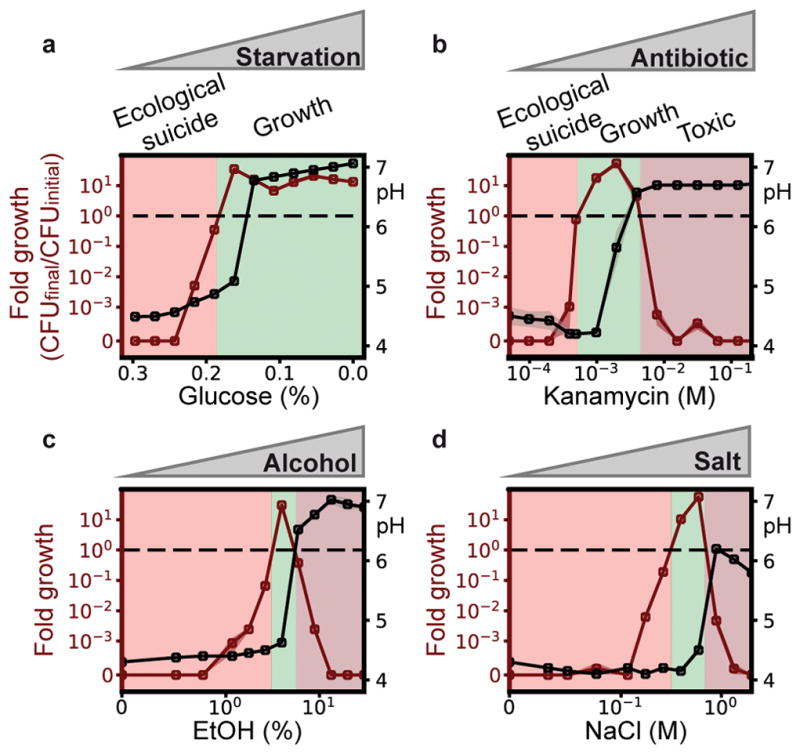
(a) Reducing sugar concentration prevents ecological suicide. At moderate concentrations, the addition of bactericidal substances like antibiotics (b), alcohol (c) or high amounts of sodium chloride (d) can save the population from ecological suicide. Open circles and shaded regions depict respectively mean and SEM of four replicates (orange: fold growth, gray: pH). All values are final values of 24h.
To explore the idea that environments that are usually considered poor can instead save the bacterial population, we measured the growth and survival of bacteria grown in the presence of the antibiotic kanamycin, ethanol, and salt. Although these substances are quite different, they all inhibit bacterial growth and lead to similar profiles of population survival as a function of the concentration of the inhibiting substance (Fig. 3 b–d). In the absence of the harmful substances, the bacteria lower the pH to the point of extinction. At high concentrations, the harmful substances kill the bacteria. However, at intermediate concentrations, the bacteria can grow and survive. This leads to the paradoxical situation that substances that are normally used to kill bacteria in medicine (antibiotics) or food preservation (salt, ethanol) are able to save bacteria and allow their growth. The interplay between the harming substance and the ecological suicide results in a U-shaped dose response curve of the harming substance, which is called hormesis in toxicology21.
The effect of ecological suicide is surprising and has paradoxical consequences. However, the question arises: How common is ecological suicide in bacteria? To investigate this question, we incubated 119 bacterial soil isolates22 from a broader taxonomic range (Supplementary Fig. 9) in the presence of glucose as a carbon source and urea as a nitrogen source. Glucose can be converted to organic acids and acidify the medium23, whereas urea can be converted by many bacteria into ammonia and alkalize the environment24. From these 119 strains, the 22 strongest pH modifiers (either in acidic or alkaline directions) were tested for the presence of ecological suicide by measuring the fold growth in 24h at low and high buffer concentrations (Fig. 4a). Indeed, around 25% of the strains suffered ecological suicide and were unable to survive at low buffer concentrations yet could be saved by more buffering (Fig. 4b). Another 20% grew better at high than low buffer, suggesting a self-inhibiting but non-deadly effect of the pH. Finally, one species even changed the pH in ways that supported its own growth (an effect discussed in more detail in a separate manuscript9). These results show that ecological suicide is not an exotic effect but appears rather often and its occurrence in nature should be investigated further in the future.
Fig. 4. Ecological suicide is a common phenomenon in microbes.

21 bacteria that strongly modified the pH were tested for ecological suicide by growing them on a medium containing 1% glucose and 0.8% urea at low buffer (10mM Phosphate) and high buffer (100mM Phosphate) conditions. Bacteria that die at low buffer but grow at high buffer concentrations were counted as ecological suicide (suicidal, 5). Bacteria that grow slower at low buffer than high buffer conditions are called self-inhibiting (4). Bacteria that grow in similar ways at low and high buffer (growth in one buffer condition is between equal and 1.5 fold relative to growth in the other condition) were called neutral (11) and bacteria that grow better with low than with high buffer are called self-supportive (1). The circles mark the mean of eight replicates for each individual bacterium; The lengths of the bars denote the SEM in x and y direction respectively.
Discussion
We demonstrated that microbes are able to cause their own extinction by deteriorating the environment, a process we call ecological suicide. Several cases are described where microbial populations experience a slow decline after reaching saturation25,26. However, this decline is usually very slow compared to the growth rate and does not cause sudden population extinction. In ecological suicide, however, the population does not even reach saturation; instead, the bacteria switch immediately from a growth into a death phase (Fig. 1a). A notable exception are quorum sensing deficient mutants of several Burkholderia species that show a type of ecological suicide27, whereas in the wildtype strains quorum sensing mediates a change of metabolism that avoids ecological suicide. This shows that bacteria can possess mechanisms that actively counteract ecological suicide27–29.
A phenomenon similar but not identical to ecological suicide is population overshoot, which is often connected to overexploitation of natural resources and has been proposed in several macro-organisms30–32, but it is mostly discussed in humans that over-exploit the environment33–35. Several ancient civilizations are suspected to have collapsed by overexploitation of natural resources36–38. Upon overshoot, a population exceeds the long-term carrying capacity of its ecosystem, followed by a drop of the population below the carrying capacity which usually does not lead to extinction of the population but is followed by recovery at a lower density30,35. However, in our case of ecological suicide, the carrying capacity of the ecosystem is changed to zero – the bacteria produce a deadly environment and go extinct without recovery, which marks ecological suicide as an extreme version of population overshoot.
In daily dilutions, ecological suicide can result in oscillatory behavior. Oscillations in ecology have been intensely studied, often as a consequence of species interactions39,40; in our system the second species is replaced by the pH value, resulting in a situation where interactions between one species and its environment drive the oscillations. In a similar way modifying and reacting to the environment have recently been described to cause metabolic oscillations in yeast41, expanding waves in microbial biofilms42 or by toxin production or resource competition 43,44.
In view of the high frequency of ecological suicide that we observed in natural isolates of soil bacteria, this effect may have a broad impact on microbial ecosystems in terms of microbial interactions and biodiversity9 and its occurrence and ecological meaning in nature have to be investigated in the future Moreover, ecological suicide can happen on different carbon sources, at lowered temperature of 22°C – although sufficiently low temperatures may stop ecological suicide - and even complex sugars and thus under conditions that more resemble those in soil (Supplementary Fig. 1). In our case, the ecological suicide was mediated by the pH, but changing any environmental parameter, like oxygen levels or metabolite concentrations in self-harming ways may cause similar outcomes.
Our findings raise the question of how such self-inflicted death of microbes can exist without evolution selecting against them. We speculate that although ecological suicide is detrimental for the population it may be evolutionary beneficial for the individual bacterium. A fast metabolism of glucose may harm and even kill the population but benefits the individual compared to an individual that takes the burden of slower glucose metabolism to save the population. The phenomena of ecological suicide could therefore be an end-product of evolutionary suicide45. Future work will explore the evolutionary origin of ecological suicide as well as the consequences of this phenomenon for the ecology and evolution of microbes.
Methods
All chemicals were purchased from Sigma Aldrich, St. Louis, USA, if not stated otherwise.
Buffer
For pre-cultures of the bacteria the basic buffer recipe was 10g/L yeast extract (Becton Dickinson, Franklin Lakes, USA) and 10g/L soytone (Becton Dickinson, Franklin Lakes, USA). We refer to that buffer as 1xNutrient medium (also 1xNu). The initial pH was 7 and 100mM phosphate were added. For the washing steps and the experiments itself the medium contained 1g/L yeast extract and 1g/L soytone, 0.1mM CaCl2, 2mM MgCl2, 4mg/L NiSO4, 50mg/L MnCl2 and 1x Trace Element Mix (Teknova, Hollister, USA). We refer to that buffer as base buffer. It was supplemented with phosphate buffer and/or glucose as outlined in the single experiments. The usual concentration was 10g/L glucose, deviations from that are described for the single experiments below. All media were filter sterilized.
Estimation of Colony Forming Units (CFU)
To estimate the number of living bacteria in the different experiments we used colony counting. At the end of every growth cycle a dilution row of the bacteria was made by diluting them once 1/100x and 6 times 1/10x in phosphate buffered saline (PBS, Corning, New York, USA). With a 96-well pipettor (Viaflo 96, Integra Biosciences, Hudson, USA) 10μL of every well for every dilution step were transferred to an agar plate (Tryptic Soy Broth (Teknova, Hollister, USA), 2.5% Agar (Becton Dickinson, Franklin Lakes, USA) with 150mm diameter. The droplets were allowed to dry in and the plates were incubated at 30°C for 1–2 days until clear colonies were visible. The different dilution steps ensured that a dilution could be found that allowed for the counting of colonies.
pH measurements
To measure the pH directly in the bacterial growth culture at the end of each growth cycle a pH microelectrode (N6000BNC, SI Analytics, Weilheim, Germany) was used. The grown up bacterial cultures were transferred into 96-well PCR plates (VWR, Radnor, USA) that allowed to measure pH values in less than 200μL.
Bacterial culture
All cultures were incubated at 30°C. The pre-cultures were done in 5mL medium in 50mL culture tubes (Falcon/Becton Dickinson, Franklin Lakes, USA) over night in 1xNu described above with additional 100mM Phosphate. The shaking speed was 250rpm on a New Brunswick Innova 2100 shaker (Eppendorf, Hauppauge, USA), the lids of the falcons tubes were only slightly screwed on to allow gas exchange. Except for the 24 h experiment with hourly measurements, which were done in 50mL culture tubes (Falcon/Becton Dickinson, Franklin Lakes, USA), the experiments were all done in 500μl 96-deepwell plates (Deepwell Plate 96/500 μL, Eppendorf, Hauppauge, USA) covered with two sterile AearaSeal adhesive sealing films (Excell Scientific, Victorville, USA), the plates were shaken at 1350rpm on Heidolph platform shakers (Titramax 100, Heidolph North America, Elk Grove Village, USA). The culture volume was 200μL if not stated otherwise. To avoid evaporation the shakers were covered with a custom made polyacryl box (Wetinator 2000) with small water reservoirs placed within.
Pre-culture and preparation of bacteria
For these experiments Paenibacillus sp. (Ps) was used, a bacterium that can acidify the environment but cannot tolerate low pH values. The bacterium was grown at 30°C. The preculture of Ps was done in 5mL 1xNu, pH 7 with 100mM phosphate for around 14h. Ps was diluted 1/100x into the same medium and grown to an OD/cm of 2. The bacterial solution was washed two times with base with 10mM Phosphate, pH 7. The bacteria were resuspended in the same base and the OD/cm adjusted to 2. The buffer concentration of the base was chosen as detailed in the experiments below.
24h experiment with hourly measurement of cell density and pH (Fig. 1)
Tubes were prepared by adding 10ml base with 10g/l glucose and different phosphate concentrations of 10, 14 and 100mM. The bacteria were added by 1/100x dilution. The tubes were incubated at 30°C, 1350rpm shaking. Every hour 200μL were taken from each tube, the CFU was estimated and the pH measured. For every measurement 3 technical replicates were done.
Density dependence of growth (Fig. 2a)
96-deepwell plates were prepared by adding 200μL base with 10g/l glucose and different Phosphate concentrations ranging from 10 to 100mM (see main text). To obtain different initial densities of bacteria, the bacteria were added by different dilutions ranging from 1/10x to (1/4)5/10x dilution. The 96-deepwell plates were incubated at 30°C, 1350rpm shaking. At the beginning of the experiment as well as after 24h, the CFU was estimated. After 24h the pH was measured. For every condition there are two biological replicates as well as two technical replicates.
Growth under daily dilution (Fig. 2B–d)
96-deepwell plates were prepared as for the ‘density dependence of growth’ experiment. The bacteria were added by 1/100x dilution. The 96-deepwell plates were incubated at 30°C, 1350rpm shaking. At the beginning of the experiment as well as after 24h, the CFU was estimated. After 24h the pH was measured. Every 24h the CFU estimated and the pH were measured and the bacteria were diluted 1/100x into fresh medium. To study the dynamics of bacterial growth and the pH, at the beginning of each day, the bacteria were also diluted 1/100x into a 96-well plate (96 Well Clear Flat Bottom TC-Treated Culture Microplate, 353072, Falcon, Corning, USA) with the same medium in each well as for the 500μl 96-deepwell plate. In addition, every well was supplemented by fluorescent nanobeads (1/100x dilution), which we fabricated as detailed below. In parallel to the incubation of the 500μl 96-deepwell plate, this 96-well plate was then observed in a Tecan infinite 200 Pro (Tecan, Männedorf, Switzerland) at 30°C, 182rpm, 4mm amplitude. Here, the OD was measured via absorbance and the fluorescence of the nanobeads was measured by exciting fluorescein (excitation wavelength 450nm, emission wavelength 516nm) and TFPP (excitation wavelength 582nm, emission wavelength 658nm). Measuring the OD of the bacteria and the fluorescence of the nanobeads every 15min in the course of one day, enabled us to track the change of the pH. Although the OD and fluorescence were measured in the parallel growing 96-well plate, we argue that they (at least qualitatively) capture the dynamics in the 96-deepwell plate, which is underlined by the fact that the measured acidification time and bacterial density oscillate synchronous (Fig. 2d). Parallel to the oscillations in the CFU observed in the 96-deepwell plates, the fluorescence measurements in the 96-well plates display oscillations in the timepoint, the pH drops, i.e. the timepoints of the fluorescence intensity’s turning points (see Fig. 2d, Fig. S2). For every buffer condition there were 4 biological replicates in the 96- well and 96-deepwell plates.
Fabrication of fluorescent nanobeads
To study the change of pH during our daily dilution experiments, we fabricated fluorescent nanobeads following a protocol established previously46. These nanobeads contain fluorescein, whose fluorescence intensity depends on the pH47, and a highly photostable fluorinated porphyrin (TFPP), which acts as a red-emitting reference dye. Since the fluorescence intensity of TFPP is independent of pH it serves as internal standard to make the result independent of the overall nanobead concentration. Thus the ratio of the fluorescein and TFPP fluorescence signals is a function only of the pH value (Supplementary Fig. 4).
Effect of harmful conditions on bacterial survival (Fig. 3)
The pre-culture was done overnight in 1xNu, pH7 with 100mM Phosphate. After 15h the bacteria were diluted 1/100x into the same medium. Upon reaching OD/cm 2 the bacteria were washed two times with base buffer and the OD/cm adjusted to 2. The bacteria were diluted 1/100x into 96-deepwell plates (Eppendorf, Hauppauge, USA) containing base medium, pH 7 with 10g/L glucose and different amounts of Kanamycin, NaCl or Ethanol. For Fig. 3a the glucose concentration was varied. The bacteria were incubated for 24h at 30°C, 1350rpm on a Heidolph platform shakers (Titramax 100, Heidolph North America, Elkove Village, USA) as described above. The live cell density was estimated via colony counting upon start of the experiment and after 24h. The pH was measured after 24h with a pH microelectrode as described above.
Frequency of ecological suicide (Fig. 4)
For this experiment 22 different soil bacteria were used, which were identified out of 119 soil bacteria to yield the highest change in pH. The 119 bacterial strains were isolated from a single grain of soil collected in September, 2015 in Cambridge, Mass., U.S.A. The grain weighed ~1 mg and was handled using sterile technique. The grain was washed in phosphate-buffered saline (PBS) and serial dilutions of the supernatant were plated on nutrient agar (0.3% yeast extract, 0.5% peptone, 1.5% bacto agar) and incubated for 48 hr at room temperature. Isolated colonies were sampled and cultured at room temperature in 5 mL nutrient broth (0.3% yeast extract, 0.5% peptone) for 48 hr. To ensure purity, the liquid cultures of the isolates were diluted in PBS and plated on nutrient agar. Single colonies picked from these plates were once again grown in nutrient broth for 48 hr at room temperature and the resulting stocks were stored in 20% glycerol at −80 C. The 16S rRNA gene was sequenced via Sanger sequencing of DNA extracted from glycerol stocks carried out at GENEWIZ (South Plainfield, New Jersey, U.S.A.). Sequencing was performed in both directions using the company’s proprietary universal 16S rRNA primers, yielding assembled sequences ~1100 nt in usable length. Some of those strains have been in more detail investigated in 24.
In order to identify the 22 species causing the strongest pH change, precultures of the 119 soil bacteria were done in 200μL 1xNu, pH 7 with 100mM phosphate for 14h at room temperature, 800rpm shaking. The precultures were then diluted 1/100x into the same medium and grown for 6h, which approximately corresponded to a growth to an OD/cm of 2 for the precultures of Ps used in the Ps experiments detailed above. The bacteria were then diluted 1/100x into fresh medium and grown for 24h at room temperature, 800rpm shaking. After 24h, the bacterial density (CFU/ml) and pH of all cultures were measured and the 22 bacteria with the highest change in pH were selected.
For these 22 species, precultures were done in 5mL 1xNu, pH 7 with 100mM phosphate for 14h. The cultures were diluted 1/100x into the same medium and grown to an OD/cm of approximately 2. The bacteria were resuspended in the same base and the OD/cm adjusted to 2. To categorize the species according to ‘suicidal’, ‘self-inhibiting’, ‘self-supporting’ and ‘neutral’ each species was grown in the same base once with high buffer concentration (100mM phosphate) and once with low buffer concentration (10mM phosphate). At the beginning and after 24h, the CFU was estimated. The pH was measured after 24h with a pH microelectrode as described above.
Data availability
All data generated or analysed during this study are included in this published article (and its supplementary information files)
Supplementary Material
Acknowledgments
We thank Loggan Higgins for providing us with the collection of bacterial soil isolates. J.D. is supported by a DFG fellowship through the Graduate School of Quantitative Biosciences Munich (QBM). We thank all members of the Gore lab for reading and discussing the manuscript. This work was funded by an Allen Distinguished Investigator Award and a NIH R01 grant.
Footnotes
Author contributions:
C.R. and J.D. contributed equally to this work. C.R., J.D. and J.G. designed the research. J.D. and C.R. and J.G. carried out the experiments and performed the mathematical analysis. C.R., J.D. and J.G discussed and interpreted the results, and wrote the manuscript.
The authors declare no competing financial interests.
References
- 1.Celiker H, Gore J. Cellular cooperation: insights from microbes. Trends Cell Biol. 2013;23:9–15. doi: 10.1016/j.tcb.2012.08.010. [DOI] [PubMed] [Google Scholar]
- 2.Ratzke C, Gore J. Self-organized patchiness facilitates survival in a cooperatively growing Bacillus subtilis population. Nat Microbiol. 2016;1:16022. doi: 10.1038/nmicrobiol.2016.22. [DOI] [PubMed] [Google Scholar]
- 3.Drescher K, Nadell CD, Stone HA, Wingreen NS, Bassler BL. Solutions to the Public Goods Dilemma in Bacterial Biofilms. Curr Biol. 2014;24:50–55. doi: 10.1016/j.cub.2013.10.030. [DOI] [PMC free article] [PubMed] [Google Scholar]
- 4.Celiker H, Gore J. Competition between species can stabilize public-goods cooperation within a species. Mol Syst Biol. 2012;8:621. doi: 10.1038/msb.2012.54. [DOI] [PMC free article] [PubMed] [Google Scholar]
- 5.Anderson DE, Becktel WJ, Dahlquist FW. pH-induced denaturation of proteins: a single salt bridge contributes 3–5 kcal/mol to the free energy of folding of T4 lysozyme. Biochemistry (Mosc) 1990;29:2403–2408. doi: 10.1021/bi00461a025. [DOI] [PubMed] [Google Scholar]
- 6.Träuble H, Teubner M, Woolley P, Eibl H. Electrostatic interactions at charged lipid membranes. Biophys Chem. 1976;4:319–342. doi: 10.1016/0301-4622(76)80013-0. [DOI] [PubMed] [Google Scholar]
- 7.Jones RT, et al. A comprehensive survey of soil acidobacterial diversity using pyrosequencing and clone library analyses. ISME J. 2009;3:442–453. doi: 10.1038/ismej.2008.127. [DOI] [PMC free article] [PubMed] [Google Scholar]
- 8.Rousk J, Brookes PC, Bååth E. Contrasting Soil pH Effects on Fungal and Bacterial Growth Suggest Functional Redundancy in Carbon Mineralization. Appl Environ Microbiol. 2009;75:1589–1596. doi: 10.1128/AEM.02775-08. [DOI] [PMC free article] [PubMed] [Google Scholar]
- 9.Ratzke C, Gore J. Modifying And Reacting To The Environmental pH Drives Bacterial Interactions. bioRxiv. 2017:136838. doi: 10.1371/journal.pbio.2004248. [DOI] [PMC free article] [PubMed] [Google Scholar]
- 10.Russell JB, Dombrowski DB. Effect of pH on the efficiency of growth by pure cultures of rumen bacteria in continuous culture. Appl Environ Microbiol. 1980;39:604–610. doi: 10.1128/aem.39.3.604-610.1980. [DOI] [PMC free article] [PubMed] [Google Scholar]
- 11.Raven JA, Smith FA. The evolution of chemiosmotic energy coupling. J Theor Biol. 1976;57:301–312. doi: 10.1016/0022-5193(76)90003-5. [DOI] [PubMed] [Google Scholar]
- 12.Safařík IVO, Šantrůčková H. Direct determination of total soil carbohydrate content. Plant Soil. 1992;143:109–114. [Google Scholar]
- 13.Mehta NC, Dubach P, Deuel H. Carbohydrates in the Soil. In: Wolfrom ML, editor. Advances in Carbohydrate Chemistry. Vol. 16. Academic Press; 1962. pp. 335–355. [DOI] [PubMed] [Google Scholar]
- 14.Li CH, Ma BL, Zhang TQ. Soil bulk density effects on soil microbial populations and enzyme activities during the growth of maize (Zea mays L.) planted in large pots under field exposure. Can J Soil Sci. 2002;82:147–154. [Google Scholar]
- 15.Raynaud X, Nunan N. Spatial Ecology of Bacteria at the Microscale in Soil. PLOS ONE. 2014;9:e87217. doi: 10.1371/journal.pone.0087217. [DOI] [PMC free article] [PubMed] [Google Scholar]
- 16.Seviour R, Nielsen PH. Microbial Ecology of Activated Sludge. IWA Publishing; 2010. [Google Scholar]
- 17.Seviour EM, et al. Studies on filamentous bacteria from australian activated sludge plants. Water Res. 1994;28:2335–2342. [Google Scholar]
- 18.Allee WC, et al. Principles of Animal Ecology. W. B. Saunders; 1965. [Google Scholar]
- 19.Courchamp F, Clutton-Brock T, Grenfell B. Inverse density dependence and the Allee effect. Trends Ecol Evol. 1999;14:405–410. doi: 10.1016/s0169-5347(99)01683-3. [DOI] [PubMed] [Google Scholar]
- 20.Stephens PA, Sutherland WJ, Freckleton RP. What Is the Allee Effect? Oikos. 1999;87:185–190. [Google Scholar]
- 21.Stebbing ARD. Hormesis — The stimulation of growth by low levels of inhibitors. Sci Total Environ. 1982;22:213–234. doi: 10.1016/0048-9697(82)90066-3. [DOI] [PubMed] [Google Scholar]
- 22.Higgins LM, Friedman J, Shen H, Gore J. Co-occurring soil bacteria exhibit a robust competitive hierarchy and lack of non-transitive interactions. bioRxiv. 2017:175737. doi: 10.1101/175737. [DOI] [Google Scholar]
- 23.Paczia N, et al. Extensive exometabolome analysis reveals extended overflow metabolism in various microorganisms. Microb Cell Factories. 2012;11:122. doi: 10.1186/1475-2859-11-122. [DOI] [PMC free article] [PubMed] [Google Scholar]
- 24.Fujita Y, Ferris FG, Lawson RD, Colwell FS, Smith RW. Subscribed Content Calcium Carbonate Precipitation by Ureolytic Subsurface Bacteria. Geomicrobiol J. 2000;17:305–318. [Google Scholar]
- 25.Finkel SE. Long-term survival during stationary phase: evolution and the GASP phenotype. Nat Rev Microbiol. 2006;4:113–120. doi: 10.1038/nrmicro1340. [DOI] [PubMed] [Google Scholar]
- 26.Burtner CR, Murakami CJ, Kennedy BK, Kaeberlein M. A molecular mechanism of chronological aging in yeast. Cell Cycle. 2009;8:1256–1270. doi: 10.4161/cc.8.8.8287. [DOI] [PMC free article] [PubMed] [Google Scholar]
- 27.Goo E, et al. Bacterial quorum sensing, cooperativity, and anticipation of stationary-phase stress. Proc Natl Acad Sci. 2012;109:19775–19780. doi: 10.1073/pnas.1218092109. [DOI] [PMC free article] [PubMed] [Google Scholar]
- 28.An JH, Goo E, Kim H, Seo YS, Hwang I. Bacterial quorum sensing and metabolic slowing in a cooperative population. Proc Natl Acad Sci. 2014;111:14912–14917. doi: 10.1073/pnas.1412431111. [DOI] [PMC free article] [PubMed] [Google Scholar]
- 29.Cotter PD, Hill C. Surviving the Acid Test: Responses of Gram-Positive Bacteria to Low pH. Microbiol Mol Biol Rev. 2003;67:429–453. doi: 10.1128/MMBR.67.3.429-453.2003. [DOI] [PMC free article] [PubMed] [Google Scholar]
- 30.Klein DR. The Introduction, Increase, and Crash of Reindeer on St. Matthew Island. J Wildl Manag. 1968;32:350–367. [Google Scholar]
- 31.Scheffer VB. The rise and fall of a reindeer herd. Sci Mon. 1951;73:356–362. [Google Scholar]
- 32.Hindell MA. Some Life-History Parameters of a Declining Population of Southern Elephant Seals, Mirounga leonina. J Anim Ecol. 1991;60:119–134. [Google Scholar]
- 33.Wackernagel M, et al. Tracking the ecological overshoot of the human economy. Proc Natl Acad Sci. 2002;99:9266–9271. doi: 10.1073/pnas.142033699. [DOI] [PMC free article] [PubMed] [Google Scholar]
- 34.Malthus TR. An Essay on the Principle of Population, as it Affects the Future Improvement of Society: With Remarks on the Speculations of Mr. Godwin, Mr. Condorcet, and Other Writers. 1798 [Google Scholar]
- 35.Meadows D, Randers J, Meadows D. Limits to Growth: The 30-Year Update. Chelsea Green Publishing; 2004. [Google Scholar]
- 36.Diamond J. Collapse: How Societies Choose to Fail or Succeed. Penguin; 2005. [Google Scholar]
- 37.Tainter JA. Archaeology of Overshoot and Collapse. Annu Rev Anthropol. 2006;35:59–74. [Google Scholar]
- 38.Shennan S, et al. Regional population collapse followed initial agriculture booms in mid-Holocene Europe. Nat Commun. 2013;4:2486. doi: 10.1038/ncomms3486. [DOI] [PMC free article] [PubMed] [Google Scholar]
- 39.Fussmann GF, Ellner SP, Shertzer KW, NGH Crossing the Hopf Bifurcation in a Live Predator-Prey System. Science. 2000;290:1358–1360. doi: 10.1126/science.290.5495.1358. [DOI] [PubMed] [Google Scholar]
- 40.Yurtsev EA, Conwill A, Gore J. Oscillatory dynamics in a bacterial cross-protection mutualism. Proc Natl Acad Sci. 2016;113:6236–6241. doi: 10.1073/pnas.1523317113. [DOI] [PMC free article] [PubMed] [Google Scholar]
- 41.Tu BP, Kudlicki A, Rowicka M, McKnight SL. Logic of the Yeast Metabolic Cycle: Temporal Compartmentalization of Cellular Processes. Science. 2005;310:1152–1158. doi: 10.1126/science.1120499. [DOI] [PubMed] [Google Scholar]
- 42.Liu J, et al. Coupling between distant biofilms and emergence of nutrient time-sharing. Science. 2017:eaah4204. doi: 10.1126/science.aah4204. [DOI] [PMC free article] [PubMed] [Google Scholar]
- 43.Collos Y, et al. Phased Oscillations in Cell Numbers and Nitrate in Batch Cultures of Alexandrium Tamarense (dinophyceae)1. J Phycol. 2011;47:1057–1062. doi: 10.1111/j.1529-8817.2011.01031.x. [DOI] [PubMed] [Google Scholar]
- 44.Cornejo OE, Rozen DE, May RM, Levin BR. Oscillations in continuous culture populations of Streptococcus pneumoniae: population dynamics and the evolution of clonal suicide. Proc R Soc Lond B Biol Sci. 2009;276:999–1008. doi: 10.1098/rspb.2008.1415. [DOI] [PMC free article] [PubMed] [Google Scholar]
- 45.Parvinen K. Evolutionary suicide. Acta Biotheor. 2005;53:241–264. doi: 10.1007/s10441-005-2531-5. [DOI] [PubMed] [Google Scholar]
- 46.Wang X, Meier RJ, Wolfbeis OS. Fluorescent pH-Sensitive Nanoparticles in an Agarose Matrix for Imaging of Bacterial Growth and Metabolism. Angew Chem Int Ed. 2013;52:406–409. doi: 10.1002/anie.201205715. [DOI] [PubMed] [Google Scholar]
- 47.Rein J, et al. Fluorescence measurements of serotonin-induced V-ATPase-dependent pH changes at the luminal surface in salivary glands of the blowfly Calliphora vicina. J Exp Biol. 2006;209:1716–1724. doi: 10.1242/jeb.02187. [DOI] [PubMed] [Google Scholar]
Associated Data
This section collects any data citations, data availability statements, or supplementary materials included in this article.
Supplementary Materials
Data Availability Statement
All data generated or analysed during this study are included in this published article (and its supplementary information files)