

Abstract
In normal cells, aberrant oncogene expression leads to the accumulation of cytotoxic metabolites, including reactive oxygen species (ROS), which can cause oxidative DNA-damage and apoptosis as an intrinsic barrier against neoplastic disease. The c-Myc oncoprotein is overexpressed in many lymphoid cancers due to c-myc gene amplification and/or 8q24 chromosomal translocations. Intriguingly, p53 is a downstream target of c-Myc and hematological malignancies, such as adult T-cell leukemia/lymphoma (ATL), frequently contain wildtype p53 and c-Myc overexpression. We therefore hypothesized that p53-regulated pro-survival signals may thwart the cell’s metabolic anticancer defenses to support oncogene-activation in lymphoid cancers. Here we show that the Tp53-induced glycolysis and apoptosis regulator (TIGAR) promotes c-myc oncogene-activation by the human T-cell leukemia virus type-1 (HTLV-1) latency-maintenance factor p30II, associated with c-Myc deregulation in ATL clinical isolates. TIGAR prevents the intracellular accumulation of c-Myc-induced ROS and inhibits oncogene-induced cellular senescence in ATL, acute lymphoblastic leukemia, and multiple myeloma cells with elevated c-Myc expression. Our results allude to a pivotal role for p53-regulated antioxidant signals as mediators of c-Myc oncogenic functions in viral and non-viral lymphoid tumors.
Keywords: HTLV-1, ATL, oncogene, p53, ROS, TIGAR
Introduction
The increased metabolic output and energy requirements of oncogenically-transformed cells begs the fundamental question –How do cancer cells avoid the oxidative damage and cytotoxicity inherently associated with the chemical byproducts (e.g., ROS or reactive nitrogen species) of metabolism (Vafa et al., 2002; Maya-Mendoza et al., 2015; Olenchock and Vander Heiden, 2013)? Mounting evidence suggests that p53-regulated pro-survival signals may aid in the dysregulated expression or activation of cellular oncogenes through the modulation of metabolic pathways which counter the potentially deleterious impact of oncogene-induced oxidative stress (Bensaad et al., 2009; Wang and Gu, 2014; Maddocks et al., 2013; Maillet et al., 2012; Karawajew et al., 2005). The TIGAR protein is a 2,6-bis-fructose-phosphatase which regulates glycolysis through the Pentose-phosphate pathway and prevents the accumulation of ROS by increasing the levels of NADPH and reduced glutathione (Bensaad et al., 2006; Bensaad et al., 2009; Li and Jogl, 2009; Cheung et al., 2012). Importantly, elevated TIGAR expression is associated with aggressive tumor phenotypes and may serve as a key therapy-determinant in colorectal carcinomas, breast carcinomas, multiple myeloma (MM), nasopharyngeal carcinomas, lung cancers, and malignant gliomas (Cheung et al., 2013; Yin et al., 2014; Wong et al., 2015; Chen et al., 2015; Ko et al., 2016; Pena-Rico et al., 2011). Qian et al. (2016) have demonstrated that small-interfering RNA (siRNA)-knockdown of TIGAR sensitizes cytogenetically normal-acute myelogenous leukemia cells to apoptosis induced by the chemical glycolysis inhibitor, 2-deoxy-D-glucose. Further, Cheung et al. (2016) have shown that TIGAR is induced by the Wnt target gene, Myc, and protects against the intracellular accumulation of damaging mitochondrial ROS in three-dimensional tissue culture and murine APC-depletion models of intestinal cell proliferation. Our studies to define the molecular mechanisms of c-Myc deregulation in HTLV-1-induced T-cell cancers prompted us to investigate whether p53-dependent pro-survival signals might contribute to the cooperation between transforming viruses and cellular oncogenes during viral carcinogenesis (Awasthi et al., 2005; Romeo et al., 2015).
The HTLV-1 is an oncoretrovirus that transforms CD4+ T-cells and deregulates lymphoproliferative pathways associated with the development of ATL –an aggressive hematological malignancy that is refractive to most anticancer treatments (Johnson et al., 2001; Bangham and Ratner, 2015). The HTLV-1 p30II protein suppresses proviral gene expression through transcriptional and posttranscriptional mechanisms (Nicot et al., 2004; Younis et al., 2004; Michael et al., 2006; Nicot et al., 2005) which allows HTLV-1-infected cells to evade host immune-surveillance pathways as a prerequisite for the establishment of persistent infections and neoplastic disease (Edwards et al., 2011; Valeri et al., 2010; Bartoe et al., 2000). In the Awasthi et al. (2005) paper, we demonstrated that amino acid residues 99–154 of p30II interact with the TIP60 acetyltransferase, and p30II enhances the oncogenic potential of c-Myc by stabilizing c-Myc-TIP60 transcriptional interactions on the promoters of c-Myc-responsive genes. We have further shown that p30II protects cells against c-Myc-dependent apoptosis in the presence of genotoxic stress (Romeo et al., 2015). The acetylation of the tumor suppressor p53 on lysine residue K120 by TIP60 is known to modulate the p53 pro-apoptotic response (Tang et al., 2006; Sykes et al., 2006; Kurash et al., 2008; Dar et al., 2013). We therefore speculated the inhibition of TIP60-mediated p53 K120-acetylation by HTLV-1 p30II could suppress c-Myc-induced apoptosis (Chen et al., 2010; Hermeking and Eick, 1994; Juin et al., 2002) and promote the survival of oncogene-addicted tumor cells through the p53-regulated induction of TIGAR (Bensaad et al., 2006). Consistent with this notion, Li et al. (2012) have demonstrated that transgenic mice containing a triple K→R acetylation-defective mutant of p53 (K117R+K161R+K162R; the K117 position is equivalent to human K120) maintained their ability to transcriptionally induce TIGAR and suppressed stress-induced ROS. However, Bensaad et al. (2009) have shown that cells which were siRNA-depleted of p53 retained significant, albeit reduced, TIGAR expression that was sufficient to suppress nutrient starvation-induced autophagy. Here we demonstrate that the HTLV-1 latency-maintenance factor p30II activates p53 and cooperates with the c-Myc oncoprotein by suppressing oncogene-induced ROS and cellular senescence through the induction of mitochondrial TIGAR expression. Furthermore, elevated TIGAR expression coincides with oncogenic c-Myc dysregulation in viral and non-viral hematological malignancies, including HTLV-1+ ATL, acute lymphoblastic leukemia (ALL), and MM. The siRNA-knockdown of TIGAR in ATL, ALL, and MM tumor cell-lines resulted in the increased accumulation of ROS and oxidative stress. The inhibition of TIGAR could represent an “Achilles heel” whereby to sensitize oncogene-addicted cancer cells to oncogene- and chemotherapy-induced oxidative damage.
Results
The HTLV-1 latency protein p30II induces aberrant lymphoproliferation beyond crisis
We have previously demonstrated that amino acid residues 99–154 of HTLV-1 p30II interact with the MYST-family acetyltransferase TIP60 (Fig. 1A), and p30II cooperates with the c-Myc oncoprotein by stabilizing c-Myc/TIP60 transcriptional interactions on the promoters of c-Myc-responsive genes (Awasthi et al., 2005; Romeo et al., 2015). The physiological significance of the p30II/c-Myc axis is likely to promote proviral replication by inducing the proliferation of latently HTLV-1-infected cells. To test this possibility, we transduced human peripheral blood mononuclear cells (hu-PBMCs) with lentiviral vectors that express a HTLV-1 p30II-Green Fluorescent Protein (p30II-GFP) fusion, p30II (hemagglutinin-tagged, HA-tagged) protein, or GFP control, and cultured the cells in the presence of recombinant human interleukin-2 (hu-IL-2) with selection on Blasticidin in 96-well microtiter plates. The cultures were then repeatedly passaged, expanded, and monitored for long-term proliferation (LTP) beyond crisis (i.e., >4 months). Indeed, these studies revealed that both lentiviral-p30II-GFP and lentiviral-p30II (HA) induced aberrant lymphoproliferation and the LTP of transduced hu-PBMCs, as compared to the pLenti 6.2/V5-DEST vector or lentiviral-GFP control (Figs. 1B-D). It is presumed, however, that cooperation with other retroviral proteins (e.g., Tax or HBZ; Lavorgna et al., 2014; Choi et al., 2014; Swaims et al., 2010; Bellon et al., 2010; Satou et al., 2006; Mitagami et al., 2015; Boxus et al., 2009; Arnold et al., 2008) or somatic gene deregulation is likely required for continuous T-cell immortalization leading to dysplastic transformation.
Fig. 1.
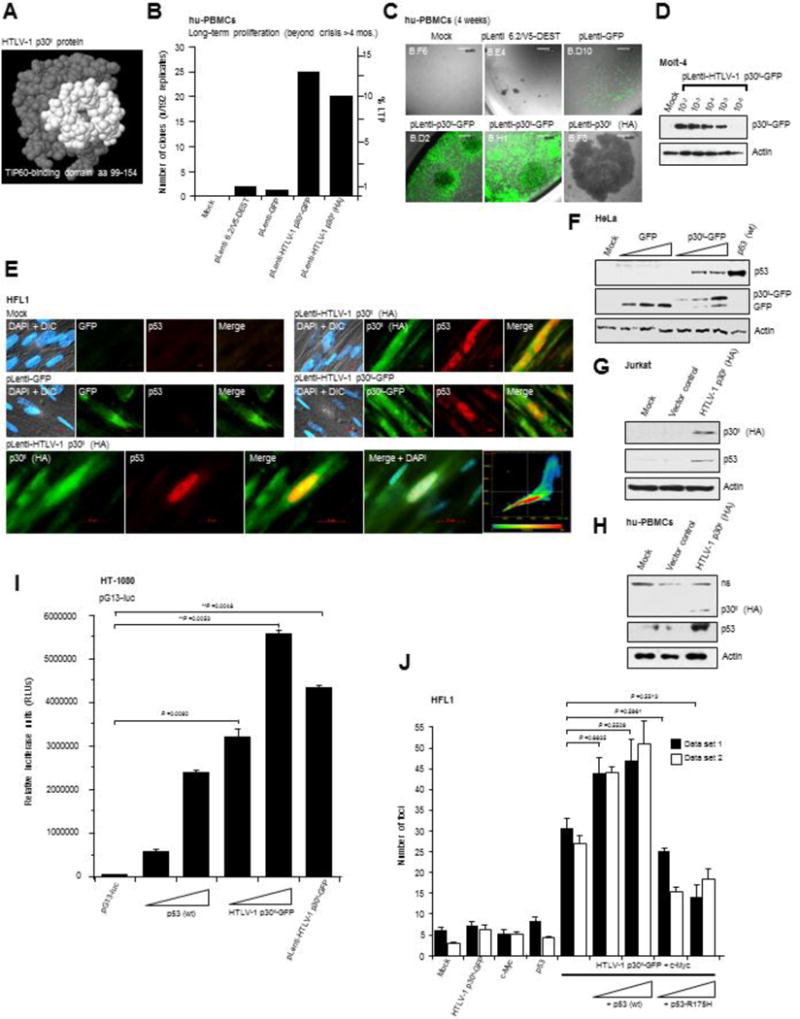
The HTLV-1 p30II protein activates p53 and induces oncogenic cellular transformation with c-Myc which is dependent upon p53 transcriptional activity. (A) The predicted structure of the HTLV-1 p30II protein with amino acid residues comprising the TIP60-binding domain (aa residues 99–154) highlighted in white (Awasthi et al., 2005; Romeo et al., 2015). (B and C) Primary hu-PBMCs were transduced with pLenti-HTLV-1 p30II-GFP, pLenti-HTLV-1 p30II (HA-tagged), pLenti-GFP control, or empty pLenti 6.2/V5-DEST vector and cultured in the presence of recombinant hu-IL-2 (50U/ml) and selected on Blasticidin (5 μg/ml). Untransduced mock cells are shown for comparison. The transduced cultures were repeatedly passaged and monitored for long-term proliferation, as defined by continuous growth beyond crisis (> 4 months). Data presented in the graph are from 192 experimental replicates. The scale bars represent 0.2 mm. (D) Immunoblot analysis of p30II-GFP expression in Molt-4 lymphoblasts transduced with various dilutions of a concentrated lentiviral HTLV-1 p30II-GFP virus stock. (E) The induction of p53 protein expression in human HFL1 fibroblasts that were transduced with pLenti-HTLV-1 p30II-GFP or pLenti-HTLV-1 p30II (HA) expression vectors, as compared to a pLenti-GFP negative control, was visualized by immunofluorescence-microscopy. Untransduced mock cells are also shown. DAPI-nuclear staining is provided in the DIC overlay images. The scale bars represent 20 μm. The nuclear colocalization between the HTLV-1 p30II (HA-tagged, green) and p53 (red)-specific fluorescent signals in the bottom panels was quantified using Carl Zeiss Axiovision 4.8 software and is represented in the heat-map graph. (F-H) The induction of p53 protein expression by HTLV-1 p30II-GFP or HTLV-1 p30II (HA) in transfected HeLa cells, Jurkat lymphocytes, and cultured hu-PBMCs was detected by SDS-PAGE and immunoblotting. A pCEP4-wildtype p53 expression construct was included (F, right lane) as a positive control. Relative Actin levels are shown for reference. (I) HT-1080 fibrosarcoma cells were cotransfected with a pG13-luc reporter plasmid, which contains two copies of the consensus p53-binding sequence (El-Deiry et al., 1993), and increasing amounts of pCEP4-wildtype p53 (as a positive control) or pEGFP-N3-HTLV-1 p30II-GFP, or the pLenti-HTLV-1 p30II-GFP expression construct. Relative luciferase activities were measured and normalized for equivalent total cellular protein levels. The averaged data from three experiments are shown. (J) Oncogenic foci-formation was assessed by cotransfecting HFL1 fibroblasts with expression constructs for c-Myc and HTLV-1 p30II-GFP, in the presence of increasing amounts of pCEP4-wildtype p53 or pCEP4-p53-R175H (a dominant-negative DNA-binding mutant of p53; Hermeking et al., 1997). The transfected cultures were monitored for foci-formation (i.e., loss of cellular contact-inhibition) over a three-week period (see s). Error bars represent the standard deviation between replicate data sets (n=3) for the duplicate experiments shown.
HTLV-1 p30II cooperates with c-Myc and induces oncogenic cellular transformation, dependent upon p53 transcriptional activity
As the p53 tumor suppressor is a downstream target of c-Myc (Chen et al., 2010; Roy et al., 1994; Reisman et al., 1993; Zindy et al., 1998; Chen et al., 2013) and TIP60 is a transcriptional cofactor for both p53 and c-Myc (Awasthi et al., 2005; Tang et al., 2006; Sykes et al., 2006; Frank et al., 2003; Patel et al., 2004), we next investigated whether HTLV-1 p30II might influence the expression of the p53 protein. For these studies, we performed immunofluorescence-microscopy to visualize the induction of p53 protein expression in human HFL1 fibroblasts that were transduced with lentiviral-HTLV-1 p30II-GFP or lentiviral-HTLV-1 p30II (HA-tagged) expression vectors, as compared to a lentiviral-GFP negative control or untransduced (mock) cells (Fig. 1E). The immortalized HFL1 cell-line has a stable pseudodiploid karyotype, grows as a uniform monolayer, and contains wildtype inducible p53. Using Carl Zeiss Axiovision software, we quantified the nuclear colocalization between the p30II (HA-tagged) and p53-specific immunofluorescent signals in transduced cells (Fig. 1E, graph at bottom right). The induction of p53 protein expression by lentiviral-HTLV-1 p30II in transduced HFL1 cells, compared to the lentiviral-GFP negative control or mock cells, was also quantified by measuring the relative fluorescence-intensity of the p53-specific signal in 100 cells per sample using Carl Zeiss Axiovision software and these data are summarized in supplementary Fig. S1. We also confirmed that p30II induces p53 in HeLa cells and Jurkat T-lymphocytes transfected with either a p30II-GFP expression construct, pcDNA3.1-GFP, or an empty vector by immunoblotting (Figs. 1F and 1G). A pCEP4-wildtype-p53 expression construct (Hermeking et al., 1997) was included as a positive control in Fig. 1F. The p53 protein in HeLa cells is constitutively degraded in a ubiquitin-dependent manner as a result of the human papillomavirus-18 E6 oncoprotein and the E6-Associated Protein (E6AP; Huibregtse et al., 1991; Talis et al., 1998). Thus, it is significant that p30II countered the HPV-induced destabilization of p53 in HeLa cells (Fig. 1F). We further demonstrated that HTLV-1 p30II (HA-tagged) induces p53 protein expression in transfected cultured hu-PBMCs (Fig. 1H). To determine if p30II influences p53-dependent transcriptional activation, we measured the transcriptional output of a pG13-luciferase reporter plasmid (which contains two consensus p53-binding sites; El-Deiry et al., 1993) in HT-1080 fibrosarcoma cells, cotransfected with increasing amounts of a pEGFP-N3-HTLV-1 p30II-GFP expression construct or lentiviral-p30II-GFP. pCEP4-wildtype-p53 was included as a positive control. The HTLV-1 p30II-GFP fusion moderately stimulated p53-dependent transactivation, compared to the overexpression of (pCEP4) wildtype p53 (Fig. 1I). As both the c-Myc oncoprotein and p53 are often overexpressed in acute and lymphoma-stage ATL clinical isolates (Zane et al., 2012; Mengle-Gaw and Rabbitts, 1987; Peller and Rotter, 2003), it is possible that p53-regulated target genes could mediate the cooperation between HTLV-1 p30II and c-Myc and contribute to disease progression (Awasthi et al., 2005; Romeo et al., 2015). To determine if p53 influences oncogenic cellular transformation by p30II/c-Myc, we performed foci-formation assays, as described in Awasthi et al. (2005) and Romeo et al. (2015), using immortalized HFL1 fibroblasts which typically grow as a monolayer (Supplement Fig. S2A). The cells were cotransfected with expression constructs for c-Myc and/or HTLV-1 p30II-GFP in various combinations, or with increasing amounts of pCEP4-wildtype-p53 or pCEP4-p53-R175H (a dominant-negative DNA-binding mutant of p53; Hermeking et al., 1997). Surprisingly, these studies revealed that overexpression of wildtype p53, together with p30II/c-Myc, resulted in significantly more transformed foci (39–54) than p30II/c-Myc (28–34) (Fig. 1J). The expression of HTLV-1 p30II-GFP, c-Myc, and p53 within individual colonies was visualized by immunofluorescence-microscopy (Fig. S2A). The loss of cellular contact-inhibition in transformed foci, compared to mock control cells, was evidenced by DAPI nuclear-staining (Fig. S2A). The dominant-negative p53-R175H DNA-binding mutant inhibited foci-formation by p30II/c-Myc (resulting in 14–18 foci at the highest concentration of p53-R175H; Fig. 1J), suggesting that p53-dependent transactivation is required for the oncogenic cooperation between p30II and c-Myc (Awasthi et al., 2005; Romeo et al., 2015). We also measured the relative fluorescence-intensities of the p30II-GFP and c-Myc signals in the presence or absence of p53-R175H in transiently-transfected HFL1 cells to rule out the possibility that the p53-R175H mutant might negatively affect the expression of p30II-GFP and/or c-Myc (Fig. S2B). Intriguingly, TIP60 acetylates lysine residue K120 of p53 in response to genotoxic stress and differentially modulates the transcriptional activation of p53-regulated pro-apoptotic genes (Tang et al., 2006; Sykes et al., 2006; Kurash et al., 2008; Dar et al., 2013). Our results in supplementary Fig. S3 demonstrate that HTLV-1 p30II inhibited the K120-acetylation of p53 induced by c-Myc overexpression, which suggests p30II could modulate the expression of p53-regulated target genes to cooperate with the c-Myc oncoprotein (Awasthi et al., 2005; Romeo et al., 2015).
HTLV-1 p30II induces TIGAR antioxidant-signaling which suppresses oncogene-induced ROS and oxidative stress
Emerging evidence points to a potential pro-tumorigenic role for p53-regulated metabolic effectors in certain human cancers (Wang and Gu, 2014; Vousden and Prives, 2009). In particular, the increased expression of TIGAR reduces damaging ROS levels (Bensaad et al., 2006; Bensaad et al., 2009) and has been shown to correlate with aggressively proliferating tumor cell phenotypes. As aberrant c-Myc overexpression results in the accumulation of cytotoxic metabolic byproducts, including ROS, associated with c-Myc-induced single-stranded DNA-breaks, oncogene-induced cellular senescence, and apoptosis (Vafa et al., 2002; Maya-Mendoza et al., 2015; Olenchock and Vander Heiden, 2013; Hermeking and Eick, 1994; Juin et al., 2002; Reimann et al., 2007; Juin et al., 1999; Wall et al., 2013), we investigated whether HTLV-1 p30II induces TIGAR as a possible mechanism for the cooperation between p53 and c-Myc (see Figs. 1J and S2A). Lentiviral-p30II-GFP resulted in increased TIGAR expression that localized in cytoplasmic structures resembling mitochondria in transduced HFL1 fibroblasts (Fig. 2A). The TIGAR protein has been shown to target mitochondria under hypoxic conditions through interactions with Hexokinase-2 and Hypoxia-inducible factor-1α activation (Cheung et al., 2012). We confirmed that p30II induces mitochondrial localization of TIGAR by labeling the lentiviral-p30II-GFP-transduced cultures with MitoTracker Orange (Fig. 2B). Further, we demonstrated that p30II-GFP induces TIGAR in transfected 293 HEK cells and Jurkat T-lymphocytes using SDS-PAGE and immunoblot analyses (Figs. 2C–2E). The induction of TIGAR by HTLV-1 p30II was dependent upon p53 transcriptional activity, as Calu-6 cells (a non-small-cell lung carcinoma cell-line which is null for p53; Mulloy et al., 1998) expressing p30II-GFP did not exhibit increased TIGAR protein levels (Supplement Fig. S4). To knockdown TIGAR expression, HT-1080 cells were repeatedly transfected with a small-interfering RNA targeted against tigar transcripts (siRNA-tigar), a scrambled RNA (scrRNA) negative control, or mock empty vector. Immunoblotting results demonstrated that siRNA-tigar inhibits endogenous TIGAR expression, as compared to the scrRNA control (Fig. 2F). We also confirmed the specificity of siRNA-tigar by cotransfecting the cells with a pcDNA3.1-TIGAR (FLAG-tagged) expression construct (Fig. 2G; Bensaad et al., 2006). We next assessed whether TIGAR is required for the oncogenic cooperation between HTLV-1 p30II and c-Myc (Figs. 1J and S2A; Awasthi et al., 2005; Romeo et al., 2015). Human HFL1 fibroblasts were cotransfected with various combinations of p30II-GFP, c-Myc, and/or TIGAR expression constructs, in the presence or absence of siRNA-tigar or a scrRNA control, and oncogenic foci-formation was monitored over a three-week period. These findings demonstrate that TIGAR overexpression, either with p30II-GFP or c-Myc, resulted in higher numbers of transformed foci (Fig. 2H). The expression of HTLV-1 p30II-GFP in the transformed colonies was visualized by direct-fluorescence microscopy (Fig. 2I). siRNA-tigar-knockdown of TIGAR expression inhibited foci-formation by p30II/c-Myc, relative to the scrRNA negative control (Fig. 2H). The oncogenic overexpression of c-Myc resulted in the accumulation of intracellular ROS which was countered by HTLV-1 p30II or the co-expression of TIGAR (FLAG) in cotransfected cells stained with the fluorescent chemical ROS-probe, CM-H2DCFDA (Figs. 3A–3E). siRNA-tigar-knockdown of TIGAR expression blocked the ability of p30II to effectively suppress c-Myc-induced ROS (Figs. 3A–3E). The targeted siRNA-knockdown of TIGAR expression, compared to the scrRNA and relative to a tubulin protein-loading control, was confirmed by SDS-PAGE and immunoblotting (Fig. 3D). These data indicate that TIGAR plays a key role in the oncogenic cooperation between HTLV-1 p30II and c-Myc.
Fig. 2.
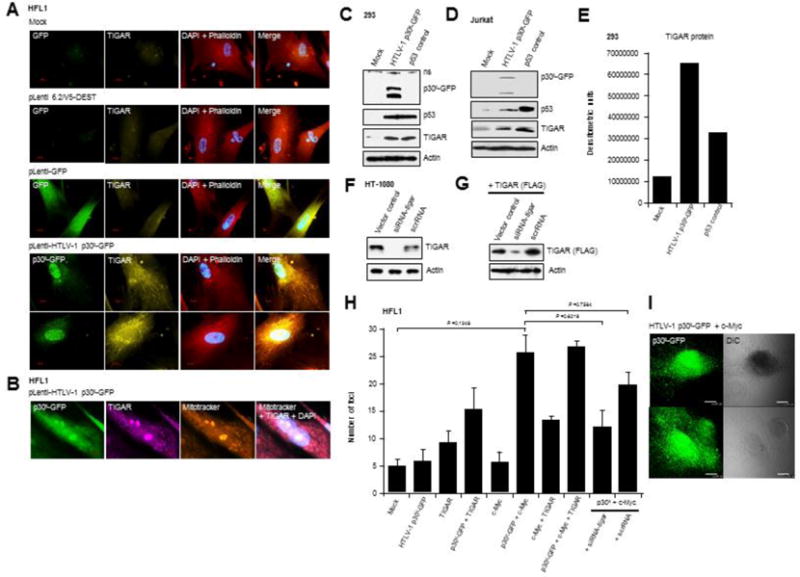
HTLV-1 p30II induces the expression and mitochondrial localization of TIGAR which is required for its oncogenic cooperation with c-Myc. (A) Human HFL1 fibroblasts were transduced with pLenti-HTLV-1 p30II-GFP, pLenti-GFP, or the empty pLenti 6.2/V5-DEST vector and the expression of TIGAR was visualized by immunofluorescence-microscopy. The HTLV-1 p30II-GFP and GFP were detected by direct-fluorescence. DAPI nuclear-staining and Texas Red-Phalloidin staining of the Actin cytoskeleton are provided for reference. The scale bars represent 20 μm. (B) The mitochondrial localization of TIGAR in HFL1 fibroblasts transduced with pLenti-HTLV-1 p30II-GFP was confirmed by immunofluorescence-microscopy in cells that were co-labeled with MitoTracker Orange. DAPI nuclear-staining is provided in the merged image. (C and D) The induction of p53 and TIGAR protein expression in 293 HEK cells and Jurkat lymphocytes expressing HTLV-1 p30II-GFP was detected by immunoblotting. The cells were also transfected with pCEP4-wildtype p53 as a positive control (Hermeking et al., 1997). (E) Densitometry quantification of the TIGAR protein expression in 293 HEK cells shown in C. (F) HT-1080 fibrosarcoma cells were repeatedly transfected with an siRNA targeted against tigar transcripts (siRNA-tigar) or a scrambled RNA (scrRNA) control and the knockdown of endogenous TIGAR expression was detected by immunoblotting. (G) HT-1080 cells were transfected with a CMV-TIGAR (FLAG-tagged) expression construct (Bensaad et al., 2006) and siRNA-tigar or a scrRNA control, and the knockdown of FLAG-tagged TIGAR was detected by immunoblotting. (H) The effects of TIGAR overexpression or siRNA-tigar knockdown of TIGAR expression upon oncogenic foci-formation by HTLV-1 p30II-GFP and c-Myc were determined by cotransfecting HFL1 fibroblasts and then monitoring the formation of transformed colonies over a three-week period. The scrRNA was included as a negative control. The averaged data from three experiments are shown. (I) The expression of the HTLV-1 p30II-GFP fusion was visualized in the transformed colonies by direct-fluorescence microscopy. DIC phase-contrast images (right panels) are provided for reference.
Fig. 3.
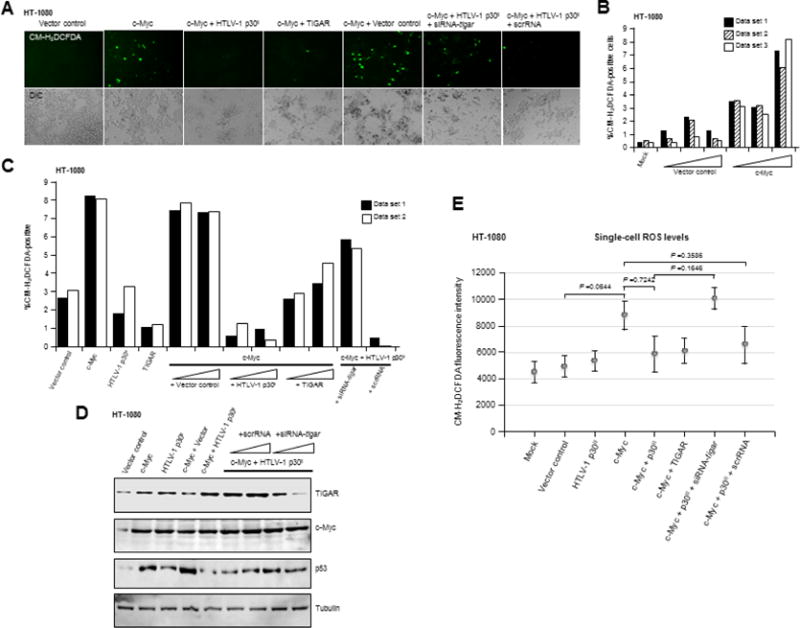
The induction of TIGAR by HTLV-1 p30II prevents the accumulation of oncogene-induced cytotoxic ROS. (A-C) The inhibition of c-Myc-induced ROS by HTLV-1 p30II (HA) or TIGAR (FLAG) was determined by transfecting HT-1080 cells with CβF-c-Myc and then transducing the cultures with pLenti-HTLV-1 p30II (HA) or the empty pLenti 6.2/V5-DEST vector. In certain samples, CMV-TIGAR (FLAG), siRNA-tigar, or the scrRNA control was also included. The cells were stained with the fluorescent ROS-specific chemical probe, CM-H2DCFDA, and the number of ROS-positive cells per field was counted in duplicate or triplicate using fluorescence-microscopy. DIC images are provided for comparison. Replicate data sets are shown for single representative experiments in panels B and C. (D) The expression of TIGAR, c-Myc, and p53 proteins in HT-1080 cells containing HTLV-1 p30II and/or oncogenic c-Myc, and cotransfected with siRNA-tigar or the scrRNA negative control, was detected by SDS-PAGE and immunoblotting. Relative tubulin levels are shown as a protein-loading control. (E) The levels of intracellular ROS in HT-1080 cells expressing various combinations of c-Myc, HTLV-1 p30II (HA), TIGAR (FLAG), or the empty pLenti-6.2/V5-DEST vector and either siRNA-tigar or a scrRNA control were determined by measuring the relative fluorescence-intensities of the CM-H2DCFDA fluorescent probe within individual cells using Carl Zeiss Axiovision 4.8 software. Each data point in the graph represents an average of 19 cells.
HTLV-1-infected T-cell-lines and primary ATL tumor samples contain elevated TIGAR levels and oncogenic c-Myc overexpression
Human HT-1080 fibrosarcoma cells stably expressing the infectious HTLV-1 ACH.p30II mutant provirus, defective for p30II production, were impaired for the mitochondrial induction of TIGAR, as compared to wildtype ACH (Figs. 4A–4C; Kimata et al., 1994; Silverman et al., 2004). The transiently-amplified HT-1080 clones which contained either ACH.wt or the ACH.p30II mutant provirus did not exhibit significant differences in the production of infectious virus particles, as determined by measuring the levels of extracellular p19Gag core antigen released into culture supernatants by Anti-HTLV-1 p19Gag ELISAs (Fig. 4D). The virus-producing HTLV-1-transformed SLB1 lymphoma cell-line was included as a positive control (Fig. 4D). We also did not observe any discernable differences in the proliferation rates of the HT-1080 ACH.wt and ACH.p30II proviral clones by flow-cytometry-based cell-cycle analyses (Supplemental Fig. S5). Moreover, the HTLV-1-transformed lymphoma cell-lines, MJG11 and SLB1, exhibited elevated TIGAR protein levels that coincided with c-Myc overexpression, compared to control donor-derived hu-PBMCs (Figs. 4E and 4F). Results in Figs. 4G and 4H further demonstrate that cultured HTLV-1-infected acute ATL cell-lines (ATL-1 and ATL-7) as well as primary buffy-coat ATL tumor isolates contained elevated TIGAR levels associated with oncogenic c-Myc expression, as compared to control hu-PBMCs. For a more direct comparison, we admixed HTLV-1-infected ATL-1 lymphoblasts with cultured hu-PBMCs and performed immunofluorescence-microscopy to assess the relative TIGAR expression in these cells (Fig. 4I). The ATL-1 cells were positive for the HTLV-1 gp21 envelope glycoprotein (middle panels, Fig. 4I). We then compared the relative expression of TIGAR in hu-PBMCs transduced with lentiviral-p30II-GFP to admixed mock control lymphocytes. The results in Fig. 4J demonstrate that p30II-GFP-expressing cells contained significantly higher TIGAR protein levels than mock control cells.
Fig. 4.
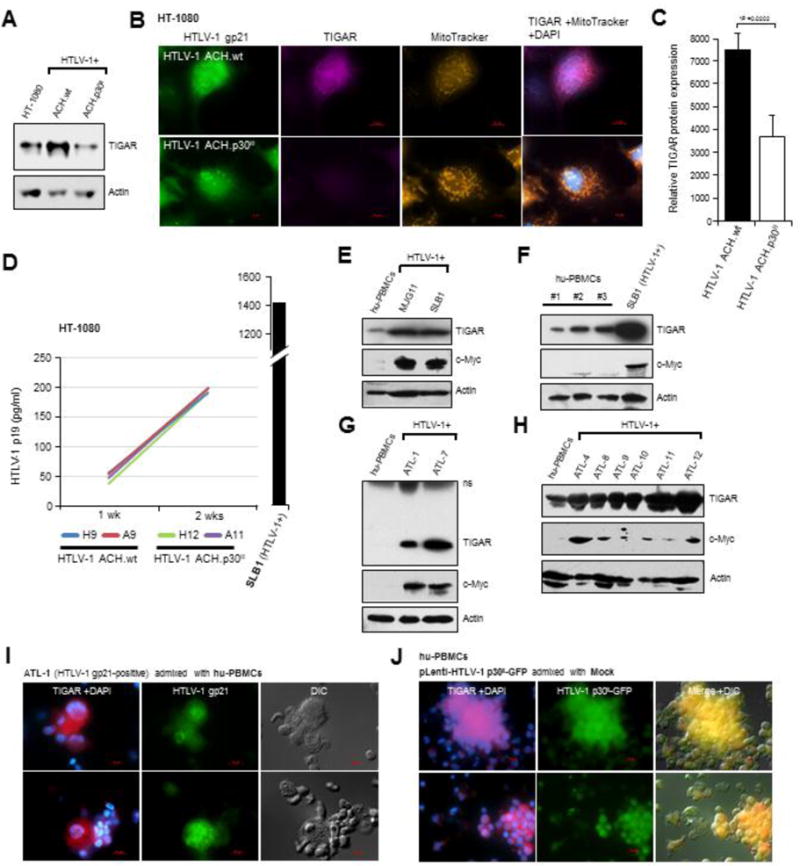
The infectious HTLV-1 ACH.p30II mutant provirus, defective for p30II production, is impaired for the induction of TIGAR. (A) The expression of TIGAR in HT-1080 cells stably expressing the HTLV-1 ACH.wildtype and ACH.p30II mutant proviral clones was detected by immunoblotting. Actin protein levels are shown for comparison. (B) The induction of TIGAR expression in HT-1080 cells containing the HTLV-1 ACH.wildtype or ACH.p30II mutant provirus was visualized by immunofluorescence-microscopy. Mitochondrial localization of the TIGAR protein was detected by co-labeling the cells with MitoTracker Orange. The expression of HTLV-1 gp21 was detected by immunofluorescence-microscopy. DAPI nuclear-staining is provided in the merged images. The scale bars represent 10 μm. (C) The relative levels of TIGAR protein in cells containing the HTLV-1 ACH.wildtype or ACH.p30II mutant provirus (gp21-positive cells) was measured using Carl Zeiss Axiovision 4.8 software. The graphed data represent 10 individual cells per sample; and the relative fluorescence-intensities of the TIGAR signal were quantified over a constant 5 μm2 surface area in each cell. (D) Equivalent virus production by HT-1080 clones stably expressing the HTLV-1 ACH.wildtype or ACH.p30II mutant provirus was confirmed by quantifying the amounts of extracellular p19Gag core antigen by ELISAs (Zeptometrix). Virus-containing supernatants were collected at 1-week and 2-week intervals; and data from two representative clones are shown relative to an HTLV-1 p19Gag protein standard curve. The SLB1 (HTLV-1-producing) lymphoma cell-line was included as a positive control. (E) The relative levels of TIGAR and c-Myc were compared in HTLV-1-transformed lymphoma T-cell-lines (MJG11 and SLB1) and activated cultured hu-PBMCs. Actin is shown for reference. (F) TIGAR protein expression in HTLV-1-transformed SLB1 lymphoblasts was compared to activated cultured hu-PBMCs obtained from three different donors. (G and H) The TIGAR is overexpressed in cultured (ATL-1, ATL-4, and ATL-7) and primary (ATL-8, ATL-9, ATL-10, ATL-11, and ATL-12) HTLV-1-infected ATL clinical isolates and correlates with increased c-Myc expression, as compared to activated cultured hu-PBMCs. (I) The relative expression of TIGAR in HTLV-1-infected ATL-1 lymphoblasts was compared to uninfected, activated cultured hu-PBMCs by admixing the samples and then immediately performing immunofluorescence-microscopy. The HTLV-1-infected ATL-1 samples were differentially identified by immunostaining to detect gp21. DAPI nuclear-staining is provided in the TIGAR signal (red) micrographs. DIC images are also shown for reference. (J) The relative levels of TIGAR were compared in admixed hu-PBMCs that were either transduced with pLenti-HTLV-1 p30II-GFP or mock treated. DAPI nuclear-staining is provided in the TIGAR signal (red) micrographs; and the HTLV-1 p30II-GFP and TIGAR signals are merged in the DIC overlay images. The scale bars represent 10 μm.
siRNA-knockdown of TIGAR sensitizes ATL and other hematological cancer cells with c-Myc dysregulation to oncogene-induced ROS and cytotoxicity
We next sought to determine whether the induction of TIGAR by HTLV-1 p30II could prevent oncogene-induced cellular senescence, due to oxidative damage, in cells expressing c-Myc (Vafa et al., 2002; Maya-Mendoza et al., 2015; Olenchock and Vander Heiden, 2013; Reimann et al., 2007). The overexpression of c-Myc resulted in increased cellular senescence in transfected HT-1080 cells which was prevented by transducing the cultures with lentiviral-p30II (HA) or through the co-expression of FLAG-tagged TIGAR (Figs. 5A and 5B). The repeated cotransfection of siRNA-tigar, but not the scrRNA negative control, countered the ability of lentiviral-p30II to protect against oncogene-induced cellular senescence (Figs. 5A and 5B). These findings suggest that inhibiting TIGAR could potentially sensitize HTLV-1-transformed ATL tumor cells to oncogene-induced oxidative damage and cytotoxicity. To test this possibility, HTLV-1-transformed SLB1 lymphoma cells were repeatedly transfected with either siRNA-tigar or a scrRNA control, and subsequently stained with the fluorescent ROS-probe CM-H2DCFDA, or X-Gal to detect senescence-associated Beta-galactosidase. The chemical uncoupler, CCCP, was included as a positive control. Our results in Figs. 5C–5E demonstrate that siRNA-tigar-knockdown of TIGAR resulted in increased ROS accumulation and oxidative stress associated with the induction of cellular senescence in HTLV-1-transformed SLB1 lymphoma cells. Furthermore, as other hematological malignancies are also known to contain c-Myc overexpression (Kanungo et al., 2006; Nagy et al., 2003; Selvanayagam et al., 1988; Shou et al., 2000; Delgado and Leon, 2010), we examined the levels of c-Myc and TIGAR in representative acute lymphoblastic leukemia (ALL: CCRF-CEM, CCRF-HSB2, Molt-4, Rs4;11), multiple myeloma (MM: MM.1R, NCI-H929, RPMI 8226, U266B1), and Sezary syndrome (SS: HuT-78) cell-lines by immunoblotting. All of the ALL and MM tumor cell-lines (with the exception of U266B1) contained high levels of c-Myc which coincided with elevated TIGAR expression (Fig. 5F). The SS cell-line, HuT-78, contained moderately increased c-Myc expression, but did not exhibit higher TIGAR expression (Fig. 5F). We therefore tested whether inhibiting TIGAR could cause oncogene-induced oxidative stress and cytotoxicity in representative ALL (RS4;11) and MM (NCI-H929) tumor cell-lines. As shown in Figs. 5G and 5H, the siRNA-tigar-knockdown of TIGAR resulted in increased ROS accumulation in transfected Rs4;11 and NCI-H929 cells, as compared to the scrRNA negative control. The micrographs of CM-H2DCFDA-staining and DIC phase-contrast images are provided in supplementary Fig. S6. These findings demonstrate the inhibition of TIGAR antioxidant-signaling broadly induces oxidative stress and cytoxicity in ATL, ALL, and MM tumor cells which overexpress the c-Myc oncoprotein.
Fig. 5.
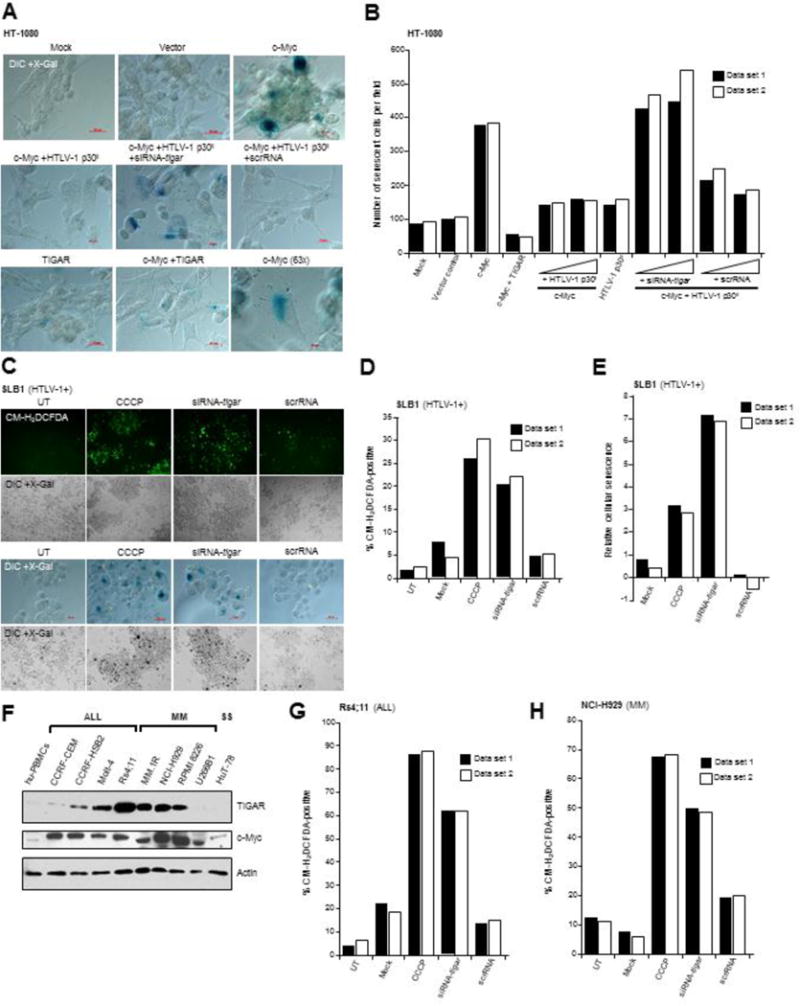
siRNA-knockdown of TIGAR expression sensitizes viral and non-viral hematological tumor cells to oncogene-induced ROS. (A and B) The HTLV-1 p30II and TIGAR proteins prevent c-Myc-induced cellular senescence in HT-1080 cells. The cells were first transfected with CβF-c-Myc and/or CMV-TIGAR (FLAG) and then transduced with pLenti-HTLV-1 p30II (HA) or the empty pLenti-6.2/V5-DEST vector. After five days, the cultures were fixed and stained using X-Gal to detect senescence-associated Beta-galactosidase expression (blue signal). Certain samples were also cotransfected with siRNA-tigar or a scrRNA control. The scale bars represent 20 μm. Replicate data sets are shown for a single representative experiment. (C-E) HTLV-1-transformed SLB1 lymphoma cells were repeatedly transfected with siRNA-tigar or a scrRNA control and the cultures were stained using the fluorescent ROS-specific chemical probe, CM-H2DCFDA, and fluorescence-microscopy was performed to visualize and quantify intracellular ROS accumulation (C, top panels). The transfected SLB1 cells were then stained with X-Gal to detect senescence-associated Beta-galactosidase expression (C, lower panels). Wide-field images of cellular senescence (dark stained cells in DIC + X-Gal) are provided below the color micrographs. The chemical uncoupler, CCCP, was included as a positive control. (F) The expression of TIGAR and c-Myc in acute lymphoblastic leukemia (ALL: CCRF-CEM, CCRF-HSB2, Molt-4, and Rs4;11), multiple myeloma (MM: MM.1R, NCI-H929, RPMI 8226, and U266B1), and Sezary syndrome (SS: HuT-78) tumor cell-lines, compared to activated cultured hu-PBMCs, was detected by immunoblotting. Actin protein levels are shown for reference. (G and H) ALL (RS4;11) and MM (NCI-H929) tumor cell-lines were repeatedly transfected with siRNA-tigar or a scrRNA control, and then stained with CM-H2DCFDA to detect intracellular ROS by fluorescence-microscopy. CCCP was included as a positive control. Replicate data sets for representative individual experiments are shown in the graphs.
Discussion
The aberrant activation or expression of cellular oncogenes can lead to metabolic toxicity –as a result of cumulative physiological stress, which serves as an intrinsic barrier against the development of neoplastic disease. However, many leukemias and lymphomas express high levels of the c-Myc oncoprotein, due to 8q24 chromosomal translocations and/or c-myc gene amplification, and bypass oncogene-associated cytotoxicity through mechanisms that remain to be fully elucidated (Reimann et al., 2007; Kanungo et al., 2006; Nagy et al., 2003; Selvanayagam et al., 1988; Delgado and Leon, 2010). Here we have demonstrated that elevated TIGAR expression coincides with oncogenic c-Myc deregulation in hematological cancers, and TIGAR antioxidant-signaling protects lymphoid tumor cells against the deleterious effects of c-Myc-induced ROS (Vafa et al., 2002; Bensaad et al., 2009). Gorrini et al. (2007) have reported that c-Myc induces a DNA-damage-like response which is dependent upon TIP60-mediated acetyltransferase activity. Further, several studies have shown that K120-acetylation of the p53 tumor suppressor protein by TIP60 differentially modulates the p53-dependent pro-apoptotic response (Tang et al., 2006; Sykes et al., 2006; Kurash et al., 2008; Dar et al., 2013). Our previous work has demonstrated that the HTLV-1 latency protein p30II interacts with TIP60 (Awasthi et al., 2005; Romeo et al., 2015); and p30II inhibits the c-Myc-induced K120-acetylation of p53 (Supplement Fig. S3). The induction of TIGAR by HTLV-1 p30II required functional p53, as the p53-null Calu6 cell-line (Mulloy et al., 1998) transfected with pEGFP-N3-HTLV-1 p30II-GFP did not exhibit increased TIGAR expression (Supplement Fig. S4). The HTLV-1 p30II protein cooperates with c-Myc to promote aberrant lymphoproliferation, and the induction of TIGAR by p30II prevents oncogene-induced cytotoxicity and c-Myc-induced oxidative damage in virus-infected cells (Vafa et al., 2002; Maya-Mendoza et al., 2015; Awasthi et al., 2005; Romeo et al., 2015; Hermeking and Eick, 1994; Juin et al., 2002; Reimann et al., 2007; Juin et al., 1999; Gorrini et al., 2007). The p30II protein is required for the maintenance of a high proviral titer in in vivo models of HTLV-1 pathogenesis (Edwards et al., 2011; Valeri et al., 2010; Silverman et al., 2004). Our studies have demonstrated that p30II promotes the survival of HTLV-1-transformed cells through the activation of p53-regulated antioxidant signals to prevent oncogene-induced oxidative damage and cytotoxicity. These findings allude to a possible pro-tumorigenic role for p53 in HTLV-1-induced T-cell malignancies–consistent with the fact that acute ATL clinical isolates frequently contain wildtype p53 and c-Myc overexpression (Zane et al., 2012; Mengle-Gaw and Rabbitts, 1987).
We have shown that elevated TIGAR expression coincides with c-Myc deregulation in primary ATL patient samples and ATL, ALL, and MM lymphoid tumor cell-lines; and the siRNA-knockdown of TIGAR resulted in significantly higher cytotoxic ROS levels associated with c-Myc-induced cellular senescence. The expression of TIGAR is upregulated by Myc in response to Wnt-signaling in an APC-deficient mouse model of intestinal cell proliferation (Cheung et al., 2016). However, the fact that the U266B1 (MM) and HuT-78 (SS) cell-lines did not contain increased TIGAR protein levels, suggests c-Myc overexpression alone is not sufficient to induce TIGAR in lymphoid cells (Fig. 5F). These findings are in agreement with those of Cheung et al. (2016) which demonstrated increased TIGAR expression was observed in B-cell lymphoma tumors, but not the pre-neoplastic tissues, of Eμ-Myc transgenic mice in which Myc expression is driven by the immunoglobulin heavy-chain enhancer. Our results lend support to an emerging paradoxical role for p53-regulated antioxidant signals in promoting c-Myc oncogenic functions in viral and non-viral hematological cancers, and suggest inhibiting TIGAR may be a plausible strategy to sensitize ATL tumor cells to oncogene-induced ROS or anticancer chemotherapy drugs that induce oxidative stress.
Materials and methods
Generation of lentiviral constructs and virus particle concentration
The pLenti-HTLV-1 p30II-GFP and pLenti-HTLV-1 p30II (HA-tagged) constructs which express a translation-optimized version of p30II were generated by amplifying the p30II nucleotide coding sequence in the pEGFP-N3-HTLV-1 p30II-GFP and pMH-HTLV-1 p30II (HA) plasmids, respectively (Nicot et al., 2004), by polymerase chain reaction (PCR) and subcloning the DNA fragments into the GATEWAY pCR8/GW/TOPO entry vector (Invitrogen). The constructs were sequenced using M13 forward and reverse oligonucleotide primers (Lone Star Labs), and Clonase recombination reactions were subsequently performed to insert the cloned products into the pLenti 6.2/V5-DEST destination vector (Invitrogen). The lentiviral constructs were then cotransfected, together with packaging mix plasmids, into 293FT HEK cells (Invitrogen) and the cultures were monitored for the presence of syncytia. After four days, the supernatants were collected, clarified by centrifugation and passed through a 0.22 μm polyethersulfone filter; and infectious pseudotyped lentivirus particles were concentrated by ultracentrifugation at 44,000 rpm and 4° C for 24 hrs on a 20% (w/v) sucrose-TSE (10 mM Tris [pH 7.5]-100 mM NaCl-10mM EDTA) cushion using a Beckman 70.1 Ti rotor. The virus pellets were resuspended in TNE (10 mM Tris [pH 7.4]-100 mM NaCl-1mM EDTA) buffer and stored in aliquots at −80° C until ready for experimental use.
Oligonucleotide primers used to generate lentiviral constructs
The following DNA oligonucleotide primers were used in PCR amplification reactions (a Kozak consensus sequence was created surrounding the AUGfMet initiation codon of the p30II coding sequence and is underlined): HTLV-1 p30II (HA-tagged): 5′-AAGGTACCCCACCATGGCACTTTGCTGTTTCGCCTTCTCAGCCCC-3′ and 5′-AAGCGGCCGCTTAAGCGTAGTCTGGGACG-3′; HTLV-1 p30II-GFP: 5′-AAGGTACCCCACCATGGCACTTTGCTGTTTCGCCTTCTCAGCCCC-3′ and 5′-AAGCGGCCGCTTATTTGTAGAGCTCATCCATGCCATG-3′. The GFP nucleotide coding sequence was amplified by PCR using the oligonucleotide primers: 5′-AAGGTACCATGGCTAGCAAAGGAGAAGAA-3′ and 5′-AAGCGGCCGCTTATTTGTAGAGCTCATCCATGCCATG-3′. The HTLV-1 p30II (HA-tagged), HTLV-1 p30II-GFP, and GFP primer pairs introduce KpnI and NotI restriction endonuclease cleavage sites which facilitated the rapid screening of transformant clones. The viral titers were empirically determined by monitoring syncytia formation and transducing HT-1080 fibrosarcoma cells (ATCC No. CCL-121) or Molt-4 lymphoblasts (ATCC No. CRL-1582) with serial-dilutions of the concentrated virus stocks, followed by analyzing lentiviral expression of HTLV-1 p30II-GFP and GFP by direct fluorescence-microscopy, and by performing immunofluorescence-microscopy and Western blotting to detect HTLV-1 p30II (HA), HTLV-1 p30II-GFP, and GFP. The GFP and HTLV-1 p30II-GFP fusion were detected with a monoclonal Anti-GFP (GFP-20) antibody (Sigma-Aldrich) and the HA-tagged HTLV-1 p30II protein was detected using the monoclonal Anti-HA (12CA5) primary antibody (Roche). Actin was detected using a goat polyclonal Anti-Actin (C-11) primary antibody (Santa Cruz Biotechnology).
Cell lines, transfections and oncogenic foci-formation
The HT-1080 fibrosarcoma cells were cultured in collagen-coated vessels in Eagle’s Minimum Essential Medium (EMEM. ATCC), supplemented with 10% heat-inactivated fetal bovine serum (FBS, Biowest), penicillin (100U/ml), streptomycin sulfate (100 μg/ml), and gentamycin sulfate (20 μg/ml, Invitrogen), and incubated at 37° C and 5% CO2. The HFL1 fibroblasts (ATCC No. CCL-153) were cultured in F-12K medium (ATCC), supplemented with 10% FBS, penicillin, streptomycin sulfate, and gentamycin sulfate at 37° C and 5% CO2. 293 HEK cells (ATCC No. CRL-1573) were grown in EMEM, supplemented with 10% FBS and antibiotics, at 37° C and 5% CO2. The HTLV-1-infected ATL-1, ATL-4, and ATL-7 acute leukemia T-cell-lines (Awasthi et al., 2005) were cultured in RPMI-1640 medium, supplemented with 20% FBS, recombinant human interleukin-2 (hu-IL-2, 50U/ml, Roche), and antibiotics, and incubated at 37° C and 10% CO2. The HTLV-1-infected lymphoma T-cell-line, MJG11 (ATCC No. CRL-8294) was grown in RPMI-1640 medium, supplemented with 20% FBS and antibiotics; and the HTLV-1-infected T-cell-line, SLB1, was cultured in Iscove’s Modified Dubecco’s Medium (IMDM, ATCC), supplemented with 10% FBS and antibiotics, and incubated at 37° C and 10% CO2. Primary HTLV-1-infected ATL clinical isolates (ATL-8, ATL-9, ATL-10, ATL-11, and ATL-12) were generously provided by T. Ikezoe (Kochi University Hospital, Japan). The acute lymphoblastic leukemia cell-lines: CCRF-CEM (ATCC No. CCL-119), CCRF-HSB2 (ATCC No. CCL-120.1), Molt-4 (ATCC No. CRL-1582), and Rs4;11 (ATCC No. CRL-1873), multiple myeloma-plasmacytoid cell-lines: MM.1R (ATCC No. CRL-2975), NCI-H929 (ATCC No. CRL-9068), RPMI 8226 (ATCC No. CCL-155), U266B1 (ATCC No. TIB-196), and Sezary syndrome T-cell-line, HuT-78 (ATCC No. TIB-161), were cultured according to ATCC recommended procedures. All cell-lines were negative for mycoplasma contamination. All transfections were carried out using SuperFect (Qiagen) or Lipofectamine LTX (Invitrogen) transfection reagents. Luciferase assays were performed using the Promega Luciferase Assay System with Reporter Lysis Buffer, as described in Romeo et al. (2015) to quantify p53-dependent transcriptional activation induced by HTLV-1 p30II. The pEGFP-N3-HTLV-1 p30II-GFP expression construct (Nicot et al., 2004) and PG13-luc reporter plasmid (El-Deiry et al., 1993) were kindly provided by G. Franchini (NCI/NIH). Oncogenic cellular transformation/foci-formation experiments were performed as previously described in Awasthi et al. (2005) and Romeo et al. (2015), using immortalized human HFL1 fibroblasts which typically grow as a monolayer. In brief, the cells were cotransfected with various combinations of CβF-c-Myc, pEGFP-N3-HTLV-1 p30II-GFP, and pCEP-wildtype p53 or pCEP-p53R175H (Hermeking et al., 1997), and foci-formation (i.e., loss of contact-inhibition) was monitored by microscopy over a three-week period. The expression of HTLV-1 p30II-GFP in individual p30II-GFP/c-Myc-transformed colonies was observed by direct fluorescence-microscopy. In certain samples, the cells were cotransfected with siRNA-tigar or a scrambled scrRNA control. To generate transiently-amplified clones expressing the HTLV-1 ACH.wt and ACH.p30II mutant proviruses (Bartoe et al., 2000; Kimata et al., 1994), HT-1080 fibrosarcoma cells were transfected with plasmids which contain the full-length molecular clones of ACH.wt or ACH.p30II and then plated by limiting dilution on poly-D-lysine-coated 96-well microtiter plates. The cells were maintained in EMEM in high-glucose (4.5 g/L), supplemented with 10% heat-inactivated FBS, penicillin (100U/ml), streptomycin sulfate (100 μg/ml), and gentamycin sulfate (20 μg/ml), and incubated at 37° C and 5% CO2. The transfected cells were continuously cultured in the presence of azidothymidine (50 μM. Sigma-Aldrich), and HTLV-1-producing HT-1080 clones were identified by detecting the p19Gag core antigen in culture supernatents by performing HTLV-1 p19Gag ELISAs (Zeptometrix) at 1-week and 2-week intervals using a Berthold Tristar plate reader. Virus production by the individual ACH.wt and ACH.p30II-containing clones was quantified relative to a p19Gag protein standard curve, and compared to the HTLV-1-infected SLB1 lymphoma T-cell-line as a positive control.
Long-term proliferation of lentiviral-transduced hu-PBMCs
The ability of HTLV-1 p30II to promote the aberrant long-term proliferation (i.e., continuous growth beyond crisis, > 4 months) of human peripheral blood mononuclear cells (hu-PBMCs) was determined by transducing donor-derived buffy-coat hu-PBMCs with the pLenti-6.2/V5 DEST empty vector, pLenti-GFP, pLenti-HTLV-1 p30II (HA), or pLenti-HTLV-1 p30II-GFP virus particles, and then plating the cells on BD-Biocoat poly-D-lysine-coated 96-well microtiter plates. Primary buffy-coat hu-PBMCs were isolated from whole-blood, diluted with phosphate-buffered saline (PBS), pH 7.4, and Lymphocyte Separation Medium (MP Biomedicals), by centrifugation at 1,850 rpm and 25° C. Human-PBMCs were stimulated with phytohemagglutinin (PHA, 10 ng/ml. Sigma-Aldrich) and expanded in the presence of recombinant hu-IL-2 for three days prior to lentiviral transductions. The HTLV-1 p30II-GFP and GFP were visualized in transduced hu-PBMCs by direct fluorescence-microscopy. The cultures were maintained in RPMI-1640 medium (ATCC) with high-glucose (4.5 g/L), supplemented with 20% heat-inactivated FBS, penicillin (100U/ml), streptomycin sulfate (100 μg/ml), and gentamycin sulfate (20 μg/ml), in the presence of recombinant hu-IL-2 and incubated at 37° C and 10% CO2. The transduced clones were selected on Blasticidin (5 μg/ml), repeatedly passaged, and expanded in culture for more than 7 months. The data presented represent 192 experimental replicates. Informed consent was obtained from all subjects for the isolation and use of donor-derived hu-PBMCs; and all protocols and experimental procedures conformed to the principles set out in the WMA Declaration of Helsinki and the Department of Health and Human Services Belmont Report and were approved by the SMU Human Subjects Research-Institutional Review Board.
siRNA-inhibition of TIGAR
Small-interfering RNA-mediated knockdown of TIGAR expression was achieved by repeatedly transfecting the cells with a 2′-O,4′aminoethylene bridged nucleic acid (BNA)-modified siRNA-tigar oligonucleotide with the sequence: 5′-AUAUACCAGCAGCUGCUGC-3′ with phosphorothioate linkages at the 5′ and 3′ ends. As a negative control, the cells were transfected with a 2′-O-methyl-uridine-modified scrambled scrRNA oligonucleotide with the sequence: 5′-UUACCGAGACCGUACGUAU-3′ and terminal phosphorothioate bonds (Biosynthesis). All RNA transfections were performed using HiPerFect transfection reagent (Qiagen). The knockdown of TIGAR protein levels was confirmed by immunoblotting and verified by inhibiting the expression of FLAG-tagged TIGAR in cells that were cotransfected with a CMV-TIGAR (FLAG) construct (Bensaad et al., 2006). The endogenous TIGAR protein was detected by immunoblotting using a monoclonal Anti-TIGAR (G2) primary antibody (Santa Cruz Biotechnology) and FLAG-epitope-tagged TIGAR was detected using a monoclonal Anti-FLAG M2 antibody (Sigma-Aldrich).
Immunofluorescence-microscopy and mitochondrial staining
Immunostaining to detect the expression and subcellular distribution of the TIGAR, wildtype p53, p53-R175H mutant, and HTLV-1 p30II (HA-tagged) proteins by immunofluorescence-microscopy was performed using primary antibodies, in combination with appropriate fluorescence-conjugated secondary antibodies (Jackson ImmunoResearch Laboratories), as previously described in Romeo et al. (2015). The TIGAR protein was detected using a rabbit polyclonal Anti-TIGAR antibody, referenced in Bensaad et al. (2006), or Anti-TIGAR (M-209) from Santa Cruz Biotechnology. The p53 protein was detected using a monoclonal Anti-p53 (DO-2) primary antibody (Santa Cruz Biotechnology). Relative fluorescence-intensity measurements to compare the expression of HTLV-1 p30II-GFP and c-Myc in cotransfected HFL1 fibroblasts containing the p53-R175H mutant were performed using Carl Zeiss Axiovision 4.8 software. The c-Myc oncoprotein was visualized using a monoclonal Anti-c-Myc (9E10) antibody (Santa Cruz Biotechnology). The HTLV-1 envelope glycoprotein was detected in the ATL-1 cell-line using a goat polyclonal Anti-HTLV-1 gp21 (vC-17) antibody (Santa Cruz Biotechnology). All fluorescence- and immunofluorescence-microscopy analyses were performed on a Zeiss Axioimager Z2 fluorescence microscope equipped with an Apotome optical slider. To detect the mitochondrial localization of the TIGAR protein, the cells were labeled with MitoTracker Orange (Molecular Probes) diluted in the growth medium for 45 minutes at room temperature, then washed 2X with serum-free medium, fixed, and immunostained for subsequent fluorescence-microscopy analysis.
Measurement of ROS and cellular senescence
The accumulation of oncogene-induced intracellular ROS was detected by staining c-Myc-expressing HT-1080 cells, or HTLV-1-infected SLB1 lymphoma cells, Rs4;11 ALL lymphoblasts, and NCI-H929 MM plasmacytoid cells with the fluorescent chemical ROS probe, 5-(and-6)-chloromethyl-2′,7′-dichlorodihydrofluorescein diacetate, acetyl ester (CM-H2DCFDA. Molecular Probes). The cells were fixed with 2% formaldehyde and 0.2% glutaraldehyde in PBS, pH 7.4, for 15 minutes at room temperature, washed 2X with PBS, and the relative percentages of ROS-positive cells were determined by counting duplicate or triplicate visual fields using fluorescence-microscopy, and compared to the total number of cells in DIC (phase contrast) images. The chemical uncoupler, carbonyl cyanide 3-chlorophenylhydrazone (CCCP. Sigma-Aldrich), was included as a positive control. For suspension cultures, the cells were incubated for 30 minutes at 37° C and 10% CO2 on 96-well plates that were pretreated with 1 mg/ml Concanavalin A (Sigma-Aldrich) and poly-D-lysine prior to staining. Single-cell intracellular ROS levels were determined by measuring the relative fluorescence-intensity of the CM-H2DCFDA chemical ROS probe across a randomly-positioned 5 μm2 surface area using Carl Zeiss Axiovision 4.8 software in 19 different individual cells per sample. The effects of inhibiting TIGAR upon intracellular ROS levels in HTLV-1-infected SLB1 lymphoma cells, Rs4;11 ALL lymphoblasts, and NCI-H929 MM plasmacytoid cells were determined by repeatedly transfecting the cells with siRNA-tigar, or a scrambled scrRNA control, and then staining with the fluorescent chemical ROS probe, CM-H2DCFDA. The percentages of ROS-positive cells were determined by counting duplicate visual fields using fluorescence-microscopy, as compared to the total number of cells per field in DIC images.
To determine the effects of HTLV-1 p30II and TIGAR expression upon oncogene-induced cellular senescence, HT-1080 cells were transfected with CβF-c-Myc and/or CMV-TIGAR (FLAG) and then transduced with pLenti-HTLV-1 p30II (HA) or the pLenti-6.2/V5-DEST empty vector. After five days, the cultures were stained using X-Gal to detect senescence-associated Beta-galactosidase (SA-β-gal) expression. The cells were rinsed with PBS, pH 7.4, and then fixed in a solution of 2% formaldehyde and 0.2% glutaraldehyde in PBS for 15 minutes at room temperature. The samples were washed 2X with PBS and subsequently stained with the X-Gal-Staining Solution (37.2 mM citric acid/sodium phosphate, 140 mM NaCl, 2mM MgCl2, 0.5 mM potassium ferrocyanide, 0.5 mM potassium ferricyanide, 1 mg/ml X-Gal, and 2% N-N-dimethylformamide, pH 6.0) at 37° C overnight in a dry incubator without CO2. The SA-β-gal-positive (blue) senescent cells were quantified by counting duplicate visual fields. To determine the effects of inhibiting TIGAR expression upon oncogene-induced cellular senescence, lentivirus-transduced c-Myc (and/or HTLV-1 p30II)-expressing HT-1080 cells, or HTLV-1-infected SLB1 lymphoblasts, were repeatedly transfected with siRNA-tigar or a scrambled scrRNA control using HiPerFect reagent, and the cultures were stained to detect SA-β-gal as described.
Statistical analysis
The statistical significance of experimental data sets was determined based upon their Student’s t-distribution values in two-tailed unpaired tests (alpha =0.05) and calculated P-values using the Shapiro-Wilk normality test and Graphpad Prism 7.03 software. Error bars indicate the standard deviation between replicate samples. The significance values were defined as: ****P<0.0001, ***P<0.0002, **P<0.0021, *P<0.0332. The siRNA-tigar-knockdown of TIGAR expression produced similar or nearly identical results in the ROS-detection and cell senescence experiments in different cellular backgrounds and, therefore, single experiments with replicate data points were performed for some of these studies.
Supplementary Material
Highlights.
HTLV-1 p30II cooperates with the c-Myc oncoprotein through a p53-dependent mechanism
The HTLV-1 p30II protein induces the Tp53-induced glycolysis and apoptosis regulator
The induction of TIGAR by p30II counters c-Myc-induced ROS and oxidative stress
HTLV-1 p30II prevents oncogene-induced cellular senescence through TIGAR
siRNA-inhibition of TIGAR induces oxidative cytotoxicity in HTLV-1+ ATL lymphoma cells
Acknowledgments
This work was supported by National Cancer Institute/National Institutes of Health Grants 1R15CA202265-01A1 and 1R15CA158945-01A1 to RH. We thank K. Vousden for kindly providing the rabbit polyclonal anti-TIGAR antibody and pcDNA3.1-FLAG-tagged-TIGAR expression construct, B. Vogelstein for pCEP4-wildtype p53 and pCEP4-p53-R175H, and P. Green for the SLB1 HTLV-1+ lymphoma T-cell-line. The authors are grateful to T. Ikezoe for providing primary ATL clinical samples to support these studies.
Footnotes
Publisher's Disclaimer: This is a PDF file of an unedited manuscript that has been accepted for publication. As a service to our customers we are providing this early version of the manuscript. The manuscript will undergo copyediting, typesetting, and review of the resulting proof before it is published in its final citable form. Please note that during the production process errors may be discovered which could affect the content, and all legal disclaimers that apply to the journal pertain.
References
- Arnold J, Zimmerman B, Li M, Lairmore MD, Green PL. Human T-cell leukemia virus type-1 antisense-encoded gene, Hbz, promotes T-lymphocyte proliferation. Blood. 2008;112:3788–3797. doi: 10.1182/blood-2008-04-154286. [DOI] [PMC free article] [PubMed] [Google Scholar]
- Awasthi S, Sharma A, Wong K, Zhang J, Matlock EF, Rogers L, Motloch P, Takemoto S, Taguchi H, Cole MD, Luscher B, Dittrich O, Tagami H, Nakatani Y, McGee M, Girard AM, Gaughan L, Robson CN, Monnat RJ, Jr, Harrod R. A human T-cell lymphotropic virus type 1 enhancer of Myc transforming potential stabilizes Myc-TIP60 transcriptional interactions. Mol Cell Biol. 2005;25:6178–6198. doi: 10.1128/MCB.25.14.6178-6198.2005. [DOI] [PMC free article] [PubMed] [Google Scholar]
- Bangham CR, Ratner L. How does HTLV-1 cause adult T-cell leukaemia/lymphoma (ATL)? Curr Opin Virol. 2015;14:93–100. doi: 10.1016/j.coviro.2015.09.004. [DOI] [PMC free article] [PubMed] [Google Scholar]
- Bartoe JT, Albrecht B, Collins ND, Robek MD, Ratner L, Green PL, Lairmore MD. Functional role of pX open reading frame II of human T-lymphotropic virus type 1 in maintenance of viral loads in vivo. J Virol. 2000;74:1094–1100. doi: 10.1128/jvi.74.3.1094-1100.2000. [DOI] [PMC free article] [PubMed] [Google Scholar]
- Bellon M, Baydoun HH, Yao Y, Nicot C. HTLV-I Tax-dependent and –independent events associated with immortalization of human primary T lymphocytes. Blood. 2010;115:2441–2448. doi: 10.1182/blood-2009-08-241117. [DOI] [PMC free article] [PubMed] [Google Scholar]
- Bensaad K, Cheung EC, Vousden KH. Modulation of intracellular ROS levels by TIGAR controls autophagy. EMBO J. 2009;28:3015–3026. doi: 10.1038/emboj.2009.242. [DOI] [PMC free article] [PubMed] [Google Scholar]
- Bensaad K, Tsuruta A, Selak MA, Vidal MN, Nakano K, Bartrons R, Gottlieb E, Vousden KH. TIGAR, a p53-inducible regulator of glycolysis and apoptosis. Cell. 2006;126:107–120. doi: 10.1016/j.cell.2006.05.036. [DOI] [PubMed] [Google Scholar]
- Boxus M, Willems L. Mechanisms of HTLV-1 persistence and transformation. Br J Cancer. 2009;101:1497–1501. doi: 10.1038/sj.bjc.6605345. [DOI] [PMC free article] [PubMed] [Google Scholar]
- Chen D, Kon N, Zhong J, Zhang P, Yu L, Gu W. Differential effects on ARF stability by normal versus oncogenic levels of c-Myc expression. Mol Cell. 2013;51:46–56. doi: 10.1016/j.molcel.2013.05.006. [DOI] [PMC free article] [PubMed] [Google Scholar]
- Chen D, Shan J, Zhu WG, Qin J, Gu W. Transcription-independent ARF regulation in oncogenic stress-mediated p53 responses. Nature. 2010;464:624–627. doi: 10.1038/nature08820. [DOI] [PMC free article] [PubMed] [Google Scholar]
- Chen S, Li P, Li J, Wang Y, Du Y, Chen X, Zang W, Wang H, Chu H, Zhao G, Zhang G. MiR-144 inhibits proliferation and induces apoptosis and autophagy in lung cancer cells by targeting TIGAR. Cell Physiol Biochem. 2015;35:997–1007. doi: 10.1159/000369755. [DOI] [PubMed] [Google Scholar]
- Cheung EC, Athineos D, Lee P, Ridgway RA, Lambie W, Nixon C, Strathdee D, Blyth K, Sansom OJ, Vousden KH. TIGAR is required for efficient intestinal regeneration and tumorigenesis. Develop Cell. 2013;25:463–477. doi: 10.1016/j.devcel.2013.05.001. [DOI] [PMC free article] [PubMed] [Google Scholar]
- Cheung EC, Lee P, Ceteci F, Nixon C, Blyth K, Sansom OJ, Vousden KH. Opposing effects of TIGAR- and RAC1-derived ROS on Wnt-driven proliferation in the mouse intestine. Genes Dev. 2016;30:52–63. doi: 10.1101/gad.271130.115. [DOI] [PMC free article] [PubMed] [Google Scholar]
- Cheung EC, Ludwig RL, Vousden KH. Mitochondrial localization of TIGAR under hypoxia stimulates HK2 and lowers ROS and cell death. Proc Natl Acad Sci, USA. 2012;109:20491–20496. doi: 10.1073/pnas.1206530109. [DOI] [PMC free article] [PubMed] [Google Scholar]
- Choi YB, Harhaj EW. HTLV-1 tax stabilizes MCL-1 via TRAF6-dependent K63-linked polyubiquitination to promote cell survival and transformation. PLoS Pathog. 2014;10:e1004458. doi: 10.1371/journal.ppat.1004458. [1–17] [DOI] [PMC free article] [PubMed] [Google Scholar]
- Dar A, Shibata E, Dutta A. Deubiquitination of Tip60 by USP7 determines the activity of the p53-dependent apoptotic pathway. Mol Cell Biol. 2013;33:3309–3320. doi: 10.1128/MCB.00358-13. [DOI] [PMC free article] [PubMed] [Google Scholar]
- Delgado MD, Leon J. Myc roles in hematopoiesis and leukemia. Genes Cancer. 2010;1:605–616. doi: 10.1177/1947601910377495. [DOI] [PMC free article] [PubMed] [Google Scholar]
- Edwards D, Fenizia C, Gold H, de Castro-Amarante MF, Buchmann C, Pise-Masison CA, Franchini G. Orf-I and orf-II-encoded proteins in HTLV-1 infection and persistence. Viruses. 2011;3:861–885. doi: 10.3390/v3060861. [DOI] [PMC free article] [PubMed] [Google Scholar]
- El-Deiry WS, Tokino T, Velculescu VE, Levy DB, Parsons R, Trent JM, Lin D, Mercer WE, Kinzler KW, Vogelstein B. WAF1, a potential mediator of p53 tumor suppression. Cell. 1993;75:817–825. doi: 10.1016/0092-8674(93)90500-p. [DOI] [PubMed] [Google Scholar]
- Frank SR, Parisi T, Taubert S, Fernandez P, Fuchs M, Chan HM, Livingston DM, Amati B. MYC recruits the TIP60 histone acetyltransferase complex to chromatin. EMBO Rep. 2003;4:575–580. doi: 10.1038/sj.embor.embor861. [DOI] [PMC free article] [PubMed] [Google Scholar]
- Gorrini C, Squatrito M, Luise C, Syed N, Perna D, Wark L, Martinato F, Sardella D, Verrecchia A, Bennett S, Confalonieri S, Cesaroni M, Marchesi F, Gasco M, Scanziani E, Capra M, Mai S, Nuciforo P, Crook T, Lough J, Amati B. Tip60 is a haplo-insufficient tumour suppressor required for an oncogene-induced DNA damage response. Nature. 2007;448:1063–1067. doi: 10.1038/nature06055. [DOI] [PubMed] [Google Scholar]
- Hermeking H, Eick D. Mediation of c-Myc-induced apoptosis by p53. Science. 1994;265:2091–2093. doi: 10.1126/science.8091232. [DOI] [PubMed] [Google Scholar]
- Hermeking H, Lengauer C, Polyak K, He TC, Zhang L, Thiagalingam S, Kinzler KW, Vogelstein B. 14-3-3 sigma is a p53-regulated inhibitor of G2/M progression. Mol Cell. 1997;1:3–11. doi: 10.1016/s1097-2765(00)80002-7. [DOI] [PubMed] [Google Scholar]
- Huibregtse JM, Scheffner M, Howley PM. A cellular protein mediates association of p53 with the E6 oncoprotein of human papillomavirus types 16 or 18. EMBO J. 1991;10:4129–4135. doi: 10.1002/j.1460-2075.1991.tb04990.x. [DOI] [PMC free article] [PubMed] [Google Scholar]
- Johnson JM, Harrod R, Franchini G. Molecular biology and pathogenesis of the human T-cell leukaemia/lymphotropic virus type-1 (HTLV-1) Int J Exp Pathol. 2001;82:135–147. doi: 10.1046/j.1365-2613.2001.00191.x. [DOI] [PMC free article] [PubMed] [Google Scholar]
- Juin P, Hueber AO, Littlewood T, Evan G. c-Myc-induced sensitization to apoptosis is mediated through cytochrome c release. Genes Dev. 1999;13:1367–1381. doi: 10.1101/gad.13.11.1367. [DOI] [PMC free article] [PubMed] [Google Scholar]
- Juin P, Hunt A, Littlewood T, Griffiths B, Swigart LB, Korsmeyer S, Evan G. c-Myc functionally cooperates with Bax to induce apoptosis. Mol Cell Biol. 2002;22:6158–6169. doi: 10.1128/MCB.22.17.6158-6169.2002. [DOI] [PMC free article] [PubMed] [Google Scholar]
- Kanungo A, Medeiros LJ, Abruzzo LV, Lin P. Lymphoid neoplasms associated with concurrent t(14;18) and 8q24/c-MYC translocation generally have a poor prognosis. Mod Pathol. 2006;19:25–33. doi: 10.1038/modpathol.3800500. [DOI] [PubMed] [Google Scholar]
- Karawajew L, Rhein P, Czerwony G, Ludwig WD. Stress-induced activation of the p53 tumor suppressor in leukemia cells and normal lymphocytes requires mitochondrial activity and reactive oxygen species. Blood. 2005;105:4767–4775. doi: 10.1182/blood-2004-09-3428. [DOI] [PubMed] [Google Scholar]
- Kimata JT, Wong FH, Wang JJ, Ratner L. Construction and characterization of infectious human T-cell leukemia virus type 1 molecular clones. Virology. 1994;204:656–664. doi: 10.1006/viro.1994.1581. [DOI] [PubMed] [Google Scholar]
- Ko YH, Domingo-Vidal M, Roche M, Lin Z, Whitaker-Menezes D, Seifert E, Capparelli C, Tuluc M, Birbe RC, Tassone P, Curry JM, Navarro-Sabate A, Manzano A, Bartrons R, Caro J, Martinez-Outschoorn U. TIGAR metabolically reprograms carcinoma and stromal cells in breast cancer. J Biol Chem. 2016;291:26291–26303. doi: 10.1074/jbc.M116.740209. [DOI] [PMC free article] [PubMed] [Google Scholar]
- Kurash JK, Lei H, Shen Q, Marston WL, Granda BW, Fan H, Wall D, Li E, Gaudet F. Methylation of p53 by Set7/9 mediates p53 acetylation and activity in vivo. Mol Cell. 2008;29:392–400. doi: 10.1016/j.molcel.2007.12.025. [DOI] [PubMed] [Google Scholar]
- Lavorgna A, Matsuoka M, Harhaj EW. A critical role for IL-17RB signaling in HTLV-1 tax-induced NF-κB activation and T-cell transformation. PLoS Pathog. 2014;10:e1004418. doi: 10.1371/journal.ppat.1004418. [1–16] [DOI] [PMC free article] [PubMed] [Google Scholar]
- Li H, Jogl G. Structural and biochemical studies of TIGAR (TP53-induced glycolysis and apoptosis regulator) J Biol Chem. 2009;284:1748–1754. doi: 10.1074/jbc.M807821200. [DOI] [PMC free article] [PubMed] [Google Scholar]
- Li T, Kon N, Jiang L, Tan M, Ludwig T, Zhao Y, Baer R, Gu W. Tumor suppression in the absence of p53-mediated cell-cycle arrest, apoptosis, and senescence. Cell. 2012;149:1269–1283. doi: 10.1016/j.cell.2012.04.026. [DOI] [PMC free article] [PubMed] [Google Scholar]
- Maddocks OD, Berkers CR, Mason SM, Zheng L, Blyth K, Gottlieb E, Vousden KH. Serine starvation induces stress and p53-dependent metabolic remodelling in cancer cells. Nature. 2013;493:542–546. doi: 10.1038/nature11743. [DOI] [PMC free article] [PubMed] [Google Scholar]
- Maillet A, Pervaiz S. Redox regulation of p53, redox effectors regulated by p53: a subtle balance. Antioxid Redox Signal. 2012;16:1285–1294. doi: 10.1089/ars.2011.4434. [DOI] [PubMed] [Google Scholar]
- Maya-Mendoza A, Ostrakova J, Kosar M, Hall A, Duskova P, Mistrik M, Merchut-Maya JM, Hodny Z, Bartkova J, Christensen C, Bartek J. Myc and Ras oncogenes engage different energy metabolism programs and evoke distinct patterns of oxidative and DNA replication stress. Mol Oncol. 2015;9:601–616. doi: 10.1016/j.molonc.2014.11.001. [DOI] [PMC free article] [PubMed] [Google Scholar]
- Mengle-Gaw L, Rabbitts TH. A human chromosome 8 region with abnormalities in B cell, HTLV-I+ T cell and c-myc amplified tumours. EMBO J. 1987;6:1959–1965. doi: 10.1002/j.1460-2075.1987.tb02458.x. [DOI] [PMC free article] [PubMed] [Google Scholar]
- Michael B, Nair AM, Datta A, Hiraragi H, Ratner L, Lairmore MD. Histone acetyltransferase (HAT) activity of p300 modulates human T lymphotropic virus type 1 p30II-mediated repression of LTR transcriptional activity. Virology. 2006;354:225–239. doi: 10.1016/j.virol.2006.07.002. [DOI] [PMC free article] [PubMed] [Google Scholar]
- Mitagami Y, Yasunaga J, Kinosada H, Ohshima K, Matsuoka M. Interferon-γ promotes inflammation and development of T-cell lymphoma in HTLV-1 bZIP factor transgenic mice. PLoS Pathog. 2015;11:e1005120. doi: 10.1371/journal.ppat.1005120. [1–19] [DOI] [PMC free article] [PubMed] [Google Scholar]
- Mulloy JC, Kislyakova T, Cereseto A, Casareto L, LoMonico A, Fullen J, Lorenzi MV, Cara A, Nicot C, Giam G, Franchini G. Human T-cell lymphotropic/leukemia virus type 1 Tax abrogates p53-induced cell cycle arrest and apoptosis through its CREB/ATF functional domain. J Virol. 1998;72:8852–8860. doi: 10.1128/jvi.72.11.8852-8860.1998. [DOI] [PMC free article] [PubMed] [Google Scholar]
- Nagy B, Lundan T, Larramendy ML, Aalto Y, Zhu Y, Niini T, Edgren H, Ferrer A, Vilpo J, Elonen E, Vettenranta K, Franssila K, Knuutila S. Abnormal expression of apoptosis-related genes in haematological malignancies: overexpression of MYC is poor prognostic sign in mantle cell lymphoma. Br J Haematol. 2003;120:434–441. doi: 10.1046/j.1365-2141.2003.04121.x. [DOI] [PubMed] [Google Scholar]
- Nicot C, Dundr M, Johnson JM, Fullen JR, Alonzo N, Fukumoto R, Princler GL, Derse D, Misteli T, Franchini G. HTLV-1-encoded p30II is a post-transcriptional negative regulator of viral replication. Nat Med. 2004;10:197–201. doi: 10.1038/nm984. [DOI] [PubMed] [Google Scholar]
- Nicot C, Harrod R, Ciminale V, Franchini G. Human T-cell leukemia/lymphoma virus type 1 nonstructural genes and their functions. Oncogene. 2005;24:6026–6034. doi: 10.1038/sj.onc.1208977. [DOI] [PubMed] [Google Scholar]
- Olenchock BA, Vander Heiden MG. Pyruvate as a pivot point for oncogene-induced senescence. Cell. 2013;153:1429–1430. doi: 10.1016/j.cell.2013.06.001. [DOI] [PMC free article] [PubMed] [Google Scholar]
- Patel JH, Du Y, Ard PG, Phillips C, Carella B, Chen CJ, Rakowski C, Chatterjee C, Lieberman PM, Lane WS, Blobel GA, McMahon SB. The c-MYC oncoprotein is a substrate of the acetyltransferases hGCN5/PCAF and TIP60. Mol Cell Biol. 2004;24:10826–10834. doi: 10.1128/MCB.24.24.10826-10834.2004. [DOI] [PMC free article] [PubMed] [Google Scholar]
- Peller S, Rotter V. TP53 in hematological cancer: low incidence of mutations with significant clinical relevance. Hum Mutat. 2003;21:277–284. doi: 10.1002/humu.10190. [DOI] [PubMed] [Google Scholar]
- Pena-Rico MA, Calvo-Vidal MN, Villalonga-Planells R, Martinez-Soler F, Gimenez-Bonafe P, Navarro-Sabate A, Tortosa A, Bartrons R, Manzano A. Tp53 induced glycolysis and apoptosis regulator (TIGAR) knockdown results in radiosensitization of glioma cells. Radiother Oncol. 2011;101:132–139. doi: 10.1016/j.radonc.2011.07.002. [DOI] [PubMed] [Google Scholar]
- Qian S, Li J, Hong M, Zhu Y, Zhao H, Xie Y, Huang J, Lian Y, Li Y, Wang S, Mao J, Chen Y. TIGAR cooperated with glycolysis to inhibit the apoptosis of leukemia cells and associated with poor prognosis in patients with cytogenetically normal acute myeloid leukemia. J Hematol Oncol. 2016;9:128. doi: 10.1186/s13045-016-0360-4. [1–13] [DOI] [PMC free article] [PubMed] [Google Scholar]
- Reimann M, Loddenkemper C, Rudolph C, Schildhauer I, Teichmann B, Stein H, Schlegelberger B, Dorken B, Schmitt CA. The Myc-evoked DNA damage response accounts for treatment resistance in primary lymphomas in vivo. Blood. 2007;110:2996–3004. doi: 10.1182/blood-2007-02-075614. [DOI] [PubMed] [Google Scholar]
- Reisman D, Elkind NB, Roy B, Beamon J, Rotter V. c-Myc trans-activates the p53 promoter through a required downstream CACGTG motif. Cell Growth Differ. 1993;4:57–65. [PubMed] [Google Scholar]
- Romeo MM, Ko B, Kim J, Brady R, Heatley HC, He J, Harrod CK, Barnett B, Ratner L, Lairmore MD, Martinez E, Luscher B, Robson CN, Henriksson M, Harrod R. Acetylation of the c-MYC oncoprotein is required for cooperation with the HTLV-1 p30II accessory protein and the induction of oncogenic cellular transformation by p30II/c-MYC. Virology. 2015;476:271–288. doi: 10.1016/j.virol.2014.12.008. [DOI] [PMC free article] [PubMed] [Google Scholar]
- Roy B, Beamon J, Balint E, Reisman D. Transactivation of the human p53 tumor suppressor gene by c-Myc/Max contributes to elevated mutant p53 expression in some tumors. Mol Cell Biol. 1994;14:7805–7815. doi: 10.1128/mcb.14.12.7805. [DOI] [PMC free article] [PubMed] [Google Scholar]
- Satou Y, Yasunaga J, Yoshida M, Matsuoka M. HTLV-I basic leucine zipper factor gene mRNA supports proliferation of adult T cell leukemia cells. Proc Natl Acad Sci, USA. 2006;103:720–725. doi: 10.1073/pnas.0507631103. [DOI] [PMC free article] [PubMed] [Google Scholar]
- Selvanayagam P, Blick M, Narni F, van Tuinen P, Ledbetter DH, Alexanian R, Saunders GF, Barlogie B. Alteration and abnormal expression of the c-myc oncogene in human multiple myeloma. Blood. 1988;71:30–35. [PubMed] [Google Scholar]
- Shou Y, Martelli ML, Gabrea A, Qi Y, Brents LA, Roschke A, Dewald G, Kirsch IR, Bergsagel PL, Kuehl WM. Diverse karyotypic abnormalities of the c-myc locus associated with c-myc dysregulation and tumor progression in multiple myeloma. Proc Natl Acad Sci, USA. 2000;97:228–233. doi: 10.1073/pnas.97.1.228. [DOI] [PMC free article] [PubMed] [Google Scholar]
- Silverman LR, Phipps AJ, Montgomery A, Ratner L, Lairmore MD. Human T-cell lymphotropic virus type 1 open reading frame II-encoded p30II is required for in vivo replication: evidence of in vivo reversion. J Virol. 2004;78:3837–3845. doi: 10.1128/JVI.78.8.3837-3845.2004. [DOI] [PMC free article] [PubMed] [Google Scholar]
- Swaims AY, Khani F, Zhang Y, Roberts AI, Devadas S, Shi Y, Rabson AB. Immune activation induces immortalization of HTLV-1 LTR-Tax transgenic CD4+ T cells. Blood. 2010;116:2994–3003. doi: 10.1182/blood-2009-07-231050. [DOI] [PMC free article] [PubMed] [Google Scholar]
- Sykes SM, Mellert HS, Holbert MA, Li K, Marmorstein R, Lane WS, McMahon SB. Acetylation of the p53 DNA-binding domain regulates apoptosis induction. Mol Cell. 2006;24:841–851. doi: 10.1016/j.molcel.2006.11.026. [DOI] [PMC free article] [PubMed] [Google Scholar]
- Talis AL, Huibregtse JM, Howley PM. The role of E6AP in the regulation of p53 protein levels in human papillomavirus (HPV)-positive and HPV-negative cells. J Biol Chem. 1998;272:6439–6445. doi: 10.1074/jbc.273.11.6439. [DOI] [PubMed] [Google Scholar]
- Tang Y, Luo J, Zhang W, Gu W. Tip60-dependent acetylation of p53 modulates the decision between cell-cycle arrest and apoptosis. Mol Cell. 2006;24:827–839. doi: 10.1016/j.molcel.2006.11.021. [DOI] [PubMed] [Google Scholar]
- Vafa O, Wade M, Kern S, Beeche M, Pandita TK, Hampton GM, Wahl GM. c-Myc can induce DNA damage, increase reactive oxygen species, and mitigate p53 function: a mechanism for oncogene-induced genetic instability. Mol Cell. 2002;9:1031–1044. doi: 10.1016/s1097-2765(02)00520-8. [DOI] [PubMed] [Google Scholar]
- Valeri VW, Hryniewicz A, Andresen V, Jones K, Fenizia C, Bialuk I, Chung HK, Fukumoto R, Parks RW, Ferrari MG, Nicot C, Cecchinato V, Ruscetti F, Franchini G. Requirement of the human T-cell leukemia virus p12 and p30 products for infectivity of human dendritic cells and macaques but not rabbits. Blood. 2010;116:3809–3817. doi: 10.1182/blood-2010-05-284141. [DOI] [PMC free article] [PubMed] [Google Scholar]
- Vousden KH, Prives C. Blinded by the light: the growing complexity of p53. Cell. 2009;137:413–431. doi: 10.1016/j.cell.2009.04.037. [DOI] [PubMed] [Google Scholar]
- Wall M, Poortinga G, Stanley KL, Lindemann RK, Bots M, Chan CJ, Bywater MJ, Kinross KM, Astle MV, Waldeck K, Hannan KM, Shortt J, Smyth MJ, Lowe SW, Hannan RD, Pearson RB, Johnstone RW, McArthur GA. The mTORC1 inhibitor everolimus prevents and treats Eμ-Myc lymphoma by restoring oncogene-induced senescence. Cancer Discov. 2013;3:82–95. doi: 10.1158/2159-8290.CD-12-0404. [DOI] [PMC free article] [PubMed] [Google Scholar]
- Wang SJ, Gu W. To be, or not to be: functional dilemma of p53 metabolic regulation. Curr Opin Oncol. 2014;26:78–85. doi: 10.1097/CCO.0000000000000024. [DOI] [PMC free article] [PubMed] [Google Scholar]
- Wong EY, Wong SC, Chan CM, Lam EK, Ho LY, Lau CP, Au TC, Chan AK, Tsang CM, Tsao SW, Lui VW, Chan AT. TP53-induced glycolysis and apoptosis regulator promotes proliferation and invasiveness of nasopharyngeal carcinoma cells. Oncol Lett. 2015;9:569–574. doi: 10.3892/ol.2014.2797. [DOI] [PMC free article] [PubMed] [Google Scholar]
- Yin L, Kufe T, Avigan D, Kufe D. Targeting MUC1-C is synergistic with bortezomib in downregulating TIGAR and inducing ROS-mediated myeloma cell death. Blood. 2014;123:2997–3006. doi: 10.1182/blood-2013-11-539395. [DOI] [PMC free article] [PubMed] [Google Scholar]
- Younis I, Khair L, Dundr M, Lairmore MD, Franchini G, Green PL. Repression of human T-cell leukemia virus type 1 and 2 replication by a viral mRNA-encoded posttranscriptional regulator. J Virol. 2004;78:11077–11083. doi: 10.1128/JVI.78.20.11077-11083.2004. [DOI] [PMC free article] [PubMed] [Google Scholar]
- Zane L, Yasunaga J, Mitagami Y, Yedavalli V, Tang SW, Chen CY, Ratner L, Lu X, Jeang KT. Wip1 and p53 contribute to HTLV-1 Tax-induced tumorigenesis. Retrovirology. 2012;9:114. doi: 10.1186/1742-4690-9-114. [1–12] [DOI] [PMC free article] [PubMed] [Google Scholar]
- Zindy F, Eischen CM, Randle DH, Kamijo T, Cleveland JL, Sherr CJ, Roussel MF. Myc signaling via the ARF tumor suppressor regulates p53-dependent apoptosis and immortalization. Genes Dev. 1998;12:2424–2433. doi: 10.1101/gad.12.15.2424. [DOI] [PMC free article] [PubMed] [Google Scholar]
Associated Data
This section collects any data citations, data availability statements, or supplementary materials included in this article.