

Abstract
Large-scale phosphoproteomics with coverage of over 10,000 sites of phosphorylation have now been routinely achieved with advanced mass spectrometry (MS)-based workflows. However, accurate targeted MS-based quantification of phosphorylation dynamics, an important direction for gaining quantitative understanding of signaling pathways or networks, has been much less investigated. Herein, we report an assessment of the targeted workflow in the context of signal transduction pathways, using the epidermal growth factor receptor (EGFR)–mitogen-activated protein kinase (MAPK) pathway as our model. A total of 43 phosphopeptides from the EGFR– MAPK pathway were selected for the study. The recovery and sensitivity of a workflow consisted of two commonly used enrichment methods, immobilized metal affinity chromatography (IMAC) and titanium oxide (TiO2), combined with selected reaction monitoring (SRM)-MS, were evaluated. The recovery of phosphopeptides by IMAC and TiO2 enrichment was quantified to be 38 ± 5% and 58 ± 20%, respectively, based on internal standards. Moreover, both enrichment methods provided comparable sensitivity from 1–100 µg starting peptides. Robust quantification was consistently achieved for most targeted phosphopeptides when starting with 25–100 µg peptides. However, the numbers of quantified targets significantly dropped when peptide samples were in the 1–25 µg range. Finally, IMAC-SRM was applied to quantify signaling dynamics of EGFR-MAPK pathway in Hs578T cells following 10 ng/mL EGF treatment. The kinetics of phosphorylation clearly revealed early and late phases of phosphorylation, even for very low abundance proteins. These results demonstrate the feasibility of robust targeted quantification of phosphorylation dynamics for specific pathways, even starting with relatively small amounts of protein.
Keywords: protein phosphorylation, affinity enrichment, selected reaction monitoring, targeted quantification, enrichment recovery, sensitivity, MAPK pathway
Table of Content Graphics
INTRODUCTION
Phosphorylation is an important mechanism regulating signal transduction in a variety of cellular activities, including proliferation, differentiation, and apoptosis. Our knowledge on specific sites on protein phosphorylation has been greatly expanded in recently years mainly due to recent advances of mass spectrometry (MS)-based phosphoproteomics.1,2 Among the multitude of enrichment techniques for phosphopeptides, immobilized metal affinity chromatography (IMAC)3 and titanium oxide (TiO2)4 are still the two most commonly used methods. Comparative quantitative phosphoproteomics workflows with IMAC or TiO2 coupled with either label-free quantification or isobaric TMT or iTRAQ labeling have been well established for large-scale profiling of phosphorylation changes across different biological conditions.4 For example, label free quantification consisting of TiO2 enrichment and single dimensional LC-MS/MS has been demonstrated for high throughput phosphoproteome measurements of insulin signaling dynamics.4 The IMAC-TMT workflow was well demonstrated for large-scale analyses of the phosphoproteome in tumor samples.5,6
In addition to global phosphoproteomics, precise targeted quantification of phosphorylation dynamics in specific signaling pathways or networks is of significant interest for gaining quantitative understanding of signaling networks or for mathematical modeling. Targeted MS approaches such as selected reaction monitoring (SRM) or parallel reaction monitoring (PRM) are promising techniques for site-specific quantification of phosphorylation with high selectivity, sensitivity, and reproducibility.7 SRM/PRM is well established for precise quantification of endogenous peptides relative to the spiked-in synthetic isotopic labeled peptides at known concentrations as internal standards and can be standardized across different laboratories.8 Moreover, the high multiplexing feature of targeted MS approaches makes it an excellent alternative to traditional antibody-based detection to validate specific phosphorylation sites and their modulation under distinct cellular conditions in high throughput. However, direct targeted MS assays (LC-SRM/PRM) of phosphorylation still face the common challenge of low stoichiometry and low-abundances of phosphopeptides and consequently requires enrichment of phosphopeptides or fractionation prior to the LC-MS assays. Multidimensional fractionation9 and immunoprecipitation10,11 have been coupled with LC-SRM to monitor the dynamics of a limited number of phosphorylation sites. More recently, IMAC was coupled with LC-SRM/PRM to quantify the dynamics of ~100 phosphosites in specific signaling networks.12,13 However, the relative abundance of important phosphorylation targets in signaling pathways is not uniform. For example, we have shown that the absolute abundance of signaling proteins can range from hundreds to millions of copies per cell.14 It is not clear that current phosphoproteomics workflows have the ability to accurately quantify the phosphorylation state of such a wide dynamic range of proteins.
Conceptually, the integration of IMAC and TiO2 enrichment with targeted MS approaches is highly suitable for achieving accurate targeted quantification of site-specific phosphorylation. However, some key parameters for targeted phosphorylation quantification workflow such as enrichment recovery and overall sensitivity are still not clear. First, the recovery of phosphopeptides from the enrichment process is an important factor for the overall workflow. However, prior works on recovery were mainly based estimation by comparing the signal intensities or identification numbers of phosphopeptides in different LC-MS runs,15,16 and it has not been accurately evaluated. Second, most optimized protocols have been demonstrated with feasibility with hundreds of micrograms even to milligrams of protein materials. It is not yet clear how well a targeted quantification workflow will perform for small amounts of starting materials (e.g., 1–100 µg peptides), which will be important to enable broad applications such as clinical specimens. Small amounts of starting materials also make it challenging to follow the phosphorylation of low abundance proteins. In this work, we investigated the enrichment recovery and overall sensitivity of the targeted phosphorylation quantification workflow incorporating IMAC and TiO2 enrichment in the context of EGFR-MAPK pathway. We further demonstrated the feasibility of robust quantification of signaling dynamics of even low abundance regulatory proteins of the pathway using this targeted workflow.
EXPERIMENTAL SECTION
Reagents
Urea, dithiothreitol (DTT), iodoacetamide, iron chloride, ammonium bicarbonate, pathatic acid, acetic acid, trifluoroacetic acid (TFA), ethylenediaminetetraacetic acid (EDTA), ammonium hydroxide, and formic acid (FA) were obtained from Sigma (St. Louis, MO). Synthetic light with >95% purity and heavy crude peptides labeled with 13C/15N on the C-terminal arginine or lysine residues were purchased from New England Peptide, Inc. (Gardner, MA) and Thermo Fisher Scientific, Inc. (Waltham, MA) The Ni-NTA agarose beads were obtained from Qiagen (Valencia, CA) and TiO2 beads (5 µm) were purchased from GL Sciences, Inc. (Japan). Empore™ extraction disk C8 and C18 were from 3M (St. Paul, MN).
Cell culture, treatment, and protein digestion
Breast cancer cell lines MCF7 and Hs578T were obtained from the American Type Culture Collection and were grown as previously described.17 Briefly, MCF-7 cells were maintained in 15-cm dishes in Dulbelcco’s Modified Eagle medium (Thermo Fisher Scientific, Inc.) supplemented with 10% heat inactivated fetal bovine serum (Thermo Fisher Scientific) and penicillin/streptomycin (Thermo Fisher Scientific, Inc.). Hs578T cells were maintained in 15-cm dishes in Dulbelcco’s Modified Eagle medium supplemented with 0.01 mg/mL bovine insulin (Sigma Aldrich), 10% heat inactivated fetal bovine serum, and penicillin/streptomycin. Cells were grown at 37°C with 5% CO2. Cells were seeded into 15-cm culture plates, grown until near confluence. For enrichment specificity and recovery assessment, MCF7 cells were rinsed twice with ice cold PBS and harvested in 1 mL ice cold PBS containing 1% phosphatase inhibitor (Thermo Fisher Scientific, Inc.). For the sensitivity test, EGF (PeproTech, Rocky Hill, NJ) was added directly to the Hs578T cell plates at 10 ng/mL and cultured for 10 min before rinse and harvest. For the study of phosphorylation dynamics, ~ 1 million Hs578T cells were either treated with 10 ng/mL EGF for 10, 30, and 120 min or no EGF for 120 min as the control. Each time point had four biological replicates. After cell harvest, cells were centrifuged at 1500 rpm for 10 min at 4°C and excess PBS was carefully aspirated from cell pellet.
Cell pellets were resuspended in cell lysis buffer (100 mM NH4HCO3, 8 M urea, 1% phosphatase inhibitor, pH 8.0) and sonicated in ice-bath for 3 min. Cell lysates were centrifuged and the protein concentrations were measured with the BCA assay (Thermo Fisher Scientific, Inc.). Proteins were then denatured and reduced with 5 mM DTT for 1 h at 37°C and alkylated with 20 mM iodoacetamide in dark for 1 h at room temperature. The resulting samples were diluted 8-fold with 100 mM NH4HCO3, pH 8.0 and digested by sequencing grade modified trypsin (Promega Corporation, Madison, WI) with a 1:50 trypsin:protein ratio (w/w) for 3 h at 37 °C on a shaker. After samples were acidified to 0.1%TFA, the supernatant of each sample was desalted by C18 SPE extraction and dried down for further enrichment.
Selection of phosphopeptides and optimization of SRM assays
Phosphorylated peptides were selected for core component proteins for the EGFR-MAPK pathway based on our previous publication.14 Phosphopeptides covering the functional phosphosites on these proteins were selected empirically based on several database resources: 1) public data database PhosphoSitePlus for selecting functional important sites; 2) in house LC-MS/MS results18 for guiding peptide detectability. We also included several additional synthetic phosphopeptides that were already available in house and are relevant to the pathway. The performance of the selected phosphopeptides were optimized by direct infusion to QQQ MS and three to four best transitions with optimal collusion energy were selected. These selected transitions of all target phosphopeptides were then assessed by LC-SRM to check the endogenous signal intensities and interference in Hs578T cell digest. The number of final assays were limited to 43 phosphosites on 24 proteins (Table 1). In addition, a set of synthetic peptides with light and heavy pairs available from the Clinical Proteome Tumor Analysis Consortium (CPTAC) project were used for the enrichment recovery and reproducibility test.
Table 1.
List of phosphoproteins and their sites for targeted quantification.
| Protein Symbol |
Peptide Sequences with Modifications | Phos Sites |
|---|---|---|
| AKT1 | RPHFPQFS[+80]YSASGTA | S473 |
| AKT2 | THFPQFS[+80]YSASIRE | S474 |
| AKT3 | RPHFPQFS[+80]YSASGRE | S472 |
| CBL | IKPSSSANAIY[+80]SLAARPLPVPK | Y647 |
| CTNA1 | (T[+80]SVQT)pEDDQLIAGQSAR | T654 |
| CTNA1 | SRT[+80]SVQTEDDQLIAGQSAR | T654 |
| CTNB1 | S[+80]PQMVSAIVR | S191 |
| DOCK7 | KQISGQYSGS[+80]PQLLK | S30 |
| DOCK7 | MNS[+80]LTFK | S1383 |
| DOCK7 | MNS[+80]LTFKK | S1383 |
| DOCK7 | QISGQYSGS[+80]PQLLK | S30 |
| DOCK7 | SPS[+80]GSAFGSQENLR | S1432 |
| EGFR | ELVEPLT[+80]PSGEAPNQALLR | T693 |
| EGFR | YSSDPTGALTEDSIDDTFLPVPEY[+80]INQSVPK | Y1092 |
| EGFR | RPAGSVQNPVY[+80]HNQPLNPAPSR | Y1110 |
| EGFR | GSHQISLDNPDY[+80]QQDFFPK | Y1172 |
| EGFR | GSTAENAEY[+80]LR | Y1197 |
| GAB1 | APSASVDSSLY[+80]NLPR | Y259 |
| GAB1 | VDY[+80]VVVDQQK | Y659 |
| GRB2 | NY[+80]VTPVNR | Y209 |
| MAPK1 | VADPDHDHTGFLT[+80]EYVATR | T185 |
| MAPK1 | VADPDHDHTGFLTEY[+80]VATR | Y187 |
| MAPK1 | VADPDHDHTGFLT[+80]EY[+80]VATR | T185+Y187 |
| MAPK3 | LADPEHDHTGFLT[+80]EYVATR | T202 |
| MAPK3 | LADPEHDHTGFLTEY[+80]VATR | Y204 |
| MAPK3 | LADPEHDHTGFLT[+80]EY[+80]VATR | T202+Y204 |
| MERL | KLT[+80]LQSAK | T581 |
| MERL | RLS[+80]MEIEK | S518 |
| PAK2 | YLSFT[+80]PPEKDGFPSGTPALNAK | T143 |
| PLCG1 | GSDAS[+80]GQLFHGR | S1236 |
| PTPN11 | VY[+80]ENVGLMQQQK | Y584 |
| PTPN11 | IQNTGDY[+80]YDLYGGEK | Y62 |
| RAF1 | S[+80]TSTPNVHMVSTTLPVDSR | S257 |
| RAF1 | AAHTEDINAC[+57]TLTTS[+80]PR | S642 |
| RBP1 | TPS[+80]SEEISPTKFPGLYR | S29 |
| RBP1 | TPSSEEIS[+80]PTKFPGLYR | S34 |
| RHG01 | SS[+80]SPELVTHLK | S51 |
| SHC1 | ELFDDPSY[+80]VNVQNLDK | Y427 |
| SOS1 | SAS[+80]VSSISLTK | S1134 |
| SOS1 | SASVSS[+80]ISLTK | S1137 |
| SRF | ALIQTC[+57]LNSPDS[+80]PPRSDPTTDQR | S224 |
| STAT3 | YC[+57]RPESQEHPEADPGSAAPY[+80]LK | Y705 |
| STAT5A | AVDGY[+80]VKPQIK | Y694 |
IMAC and TiO2 enrichment
For IMAC, peptides were reconstituted at 1 µg/µL in 80% ACN/0.1%TFA prior to enrichment. The Fe3+-NTA agarose beads were prepared by replacing the Ni2+ ion on the Ni-NTA beads with Fe3+ through buffer exchange. Phosphopeptide enrichment was performed as previously described.3 Briefly, peptide samples were incubated with 10 µL 50% bead slurry at room temperature for 30 min with shaking and the supernatant was discarded. The beads were resuspended in 100 µL 80%ACN/0.1%TFA and loaded on Empore C18 silica-packed Stage Tips for desalting. Before sample loading, the Stage Tips were washed with 100 µL methanol twice, 50 µL 50%ACN/0.1%FA once, and 100 µL 1% FA twice. After washing the beads with 50 µL 80%ACN/0.1%TFA twice and 50 µL 1% FA once, the phosphopeptides were eluted from the IMAC beads to the C18 membrane with 70 µL 500 mM phosphate buffer, pH 7.0 three times and washed with 100 µL 1%FA once before being eluted from the C18 membrane with 60 µL 50%ACN/0.1%FA.
TiO2 enrichment columns were prepared similarly as previously described.19 500 µg TiO2 bead slurry in ACN were loaded on Empore C8 silica-packed gel loading tips. Peptides were reconstituted at 1 µg/µL in 80%ACN, 5%TFA, and 0.3 mol/L pathalic acid and loaded onto the Stage Tips twice. The columns were then washed with 100 µL 50% ACN/5%TFA once and 100 µL 80%ACN/5%TFA twice. The phosphorylated peptides were eluted with 100 µL 50%ACN/5%NH4OH twice and 100 µL 80%ACN/5%NH4OH. All washes were completed on a centrifuge (Eppendorf, Hauppauge, NY) at a maximum speed of 3500 g. Eluted phosphopeptides were dried down and stored at −80°C until LC-MS/MS analysis.
For recovery test, 29 synthetic crude heavy phosphopeptide were spiked at 10 fmol/µL before and after IMAC or TiO2 enrichment of 50 µg MCF 7 cell digest to evaluate the enrichment recovery. Corresponding synthetic pure light phosphopeptides were spiked in the eluent at 10 fmol/µL as internal standards to normalize LC-SRM detection variability. For the study of sensitivity and phosphorylation dynamics, 50 fmol/µL of crude heavy phosphopeptides were spiked before enrichment. The concentrations of all spiked synthetic peptides were calculated based on 15 µL of the final sample volume.
LC-SRM analysis
Lyophilized phosphopeptides were reconstituted in 0.1%FA and subjected to LC-SRM analysis immediately using a nanoACQUITY UPLC® system coupled online with a TSQ Vantage triple quadrupole mass spectrometer (Thermo Fisher Scientific, Inc.). Solvents used were 0.1% FA in water (mobile phase A) and 0.1% FA in 90% ACN (mobile phase B). 4 µL of peptide sample was loaded directly on a BEH 1.7 µm C18 column (75 µm i.d. × 20 cm), which was connected to a chemically etched 20 µm i.d. fused silica emitter via a conductive carbon fiber peek union. Sample loading and LC separation were performed at a flow rate of 300 nL/min and the LC separation gradient was 2–30% solvent B in 60 min, 30–80% solvent B in 1 min, and finally 80% solvent B for 9 min and the analytical column was reequilibrated at 98% solvent A for 15 min.
The TSQ Vantage mass spectrometer was operated in positive ion-mode with the ESI voltage set to 2,400 V and a capillary temperature at 350 °C. The SRM experiment was programmed to conduct scheduled SRM assays. The cycle time was set to 1 s and the dwell time for each transition was automatically adjusted depending on the number of transitions scanned in the different retention time windows. A minimum dwell time of 10 ms was used for all SRM transitions.
Data analysis
SRM data were analyzed using Skyline software.20 Peak detection and integration were determined based on a) the same retention time and b) similar relative SRM peak intensity ratios across multiple transitions between light peptides and heavy peptides. At least two best transition with signal to noise ratio (S/N) higher than 3-fold of the highest background noise in a retention region of ±15 s was used for quantification of each peptide. For the evaluation of enrichment recovery, the signal intensities of each heavy peptides were normalized to that of the corresponding pure light peptides that were spiked after enrichment to reduce the LC-SRM detection variability. The recovery was calculated as the ratios of normalized signal of each peptide spiked in samples before enrichment to the normalized signal of peptide spiked after enrichment. For the rest of the study, the relative abundance of each peptide was calculated as the intensity ratio of the endogenous peptide to the heavy peptide standard. Standard derivation (S.D.) and coefficient of variation (C.V.) were calculated based on two or three technique replicates and standard errors (S.E.) were used for three or four biological replicates for the time-course study. Heatmap of phosphorylation dynamics was generated using the MeV software (http://www.tm4.org/mev.html). All LC-SRM data were deposited in the Panorama public database at https://panoramaweb.org/EGFR_targeted_phospho.url.
RESULTS
Enrichment specificity and recovery
To adapt IMAC and TiO2 enrichment for targeted quantification of phosphorylation in microgram scale samples, we initially compared the enrichment efficiency and recovery of two commonly used protocols3,19 with minor modification. For example, TiO2 enrichment was performed in gel loading tips (orifice 0.6 mm) that minimize the surface area for sample contact. Phosphopeptides were eluted with ammonium in acetonitrile directly without additional acidification and SPE steps. In this protocol, the C8 membrane only functions as a frit to hold the TiO2 beads (5µm diameter) (Figure 1A). For IMAC enrichment, gel loading tips did not work as well as regular pipetting tips due to the higher diameters (45–165 µm) and volumes of IMAC beads. In this case, samples and beads were initially incubated in microcentrifuge tubes, followed by washing and elution in regular pipetting tips with C18 membrane as a desalting column. Phosphopeptides were eluted with phosphate buffer and additional in situ SPE was performed. A global shotgun LC-MS/MS experiment was performed to compare the performance of the two protocols in terms of enrichment specificity and phosphoproteome coverage. A much higher enrichment specificity was observed for IMAC (~98%) compared to TiO2 (~68%) (Figure S1 and Supplemental Methods). The total number of phosphopeptides (~14,000) identified from IMAC enriched samples were also much higher than those identified from TiO2 (~8,500), suggesting that enrichment specificity is critical for obtaining high phosphoproteome coverage in shotgun proteomics.
Figure 1. Evaluation of recovery and reproducibility of IMAC and TiO2 enrichment.

A. Schematic representations of enrichment tips with Fe-IMAC and TiO2 beads. B. Workflow for the measurement of recovery for phosphorylation enrichment. C. Representative XICs of transitions monitored for the evaluation of enrichment recovery of CTNB1-S191 phosphopeptides using TiO2 beads.
To quantitatively assess IMAC and TiO2 protocols, we established a targeted quantification workflow (Figure 1B) using LC-SRM to measure the enrichment recoveries and reproducibility of a selection of 29 pairs of light and heavy synthetic phosphopeptides. To account for potential LC-SRM detection variations, synthetic light peptides were spiked after enrichment as internal standards while corresponding crude heavy peptides were spiked either before or after enrichment to establish recovery. Percent recovery was calculated as the ratio of relative abundance (H/L ratio) of heavy phosphopeptides spiked before versus after enrichment (Figure 1B and 1C). The recovery of IMAC enrichment was consistently observed to be 38 ± 5% across the 29 phosphopeptides. Recovery using TiO2 enrichment was observed to be higher at 58 ± 20%, but more variable as compared to IMAC (Figure 2 and Table S1). The technical reproducibility of IMAC and TiO2 in terms of mean intra peptide CV was observed to be 9.4% and 5.1%, respectively. The results suggest that both IMAC and TiO2 enrichment can be reproducible with good recoveries across different phosphopeptides. Although our assessment is based on a limited panel of phosphopeptides, the data suggests that sequence-specific recovery differences are more pronounced with TiO2 compared to IMAC. The differences in recovery by the two protocols are presumably due to differences in binding affinity and elution efficiency for each protocol.
Figure 2. Recoveries of IMAC and TiO2 enrichment of phosphopeptides of individual phosphopeptides (A) and overall box plot (B).

Overall sensitivity of targeted MS workflows
Next, we assessed the overall sensitivity of targeted MS workflows employing IMAC and TiO2 enrichment with a panel of 43 phosphopeptides from 24 proteins of the EGFR-MAPK pathway. A range of starting tryptic digest of Hs578T cells (treated with 10 ng/mL of EGF for 10 min) from 1–100 µg peptides was utilized for this evaluation. For all experiments with varying starting amounts, tryptic peptides were spiked with the same amount of heavy phosphopeptide standards and subjected to either IMAC or TiO2 enrichment followed by LC-SRM. The results revealed that the two workflows provided similar overall sensitivity in terms of the number of quantified phosphopeptides (Figure 3A and Table S2 & S3). TiO2 enrichment was slightly more sensitive at low starting materials (1–25 µg), while IMAC enrichment allows detection of more phosphopeptides when starting with higher amounts of peptides. This is in concordant with the higher enrichment specificity observed for IMAC and the higher average recovery, but more sequence-dependent variations for TiO2.
Figure 3. Evaluation of sensitivity of IMAC and TiO2-SRM assay.

A. Number of quantified peptides of IMAC and TiO2 enrichment from different starting amounts of tryptic peptides. B. Linearity of representative phosphopeptides enriched from increased starting material. C. Selected XICs for the detection of phosphopeptides for SHC1-Y427 from different amounts of Hs578T cell digest using IMAC enrichment.
The overall number of quantified phosphopeptides decreased sharply when the starting material decreased to 25 µg or lower, but were relatively consistent from 25 µg and higher (Figure 3A inset). While several phosphopeptides were quantifiable even at 1 µg of starting peptides, the signal intensities were decreased dramatically (Figure S2 & S3), suggesting a significant degree of sample loss from nonspecific surface binding. With increased amounts of starting peptides, the ratio of endogenous phosphopeptides over internal standards (L/H) increased linearly with both IMAC and TiO2 enrichment (Figure 3B). This indicates that spiking in heavy phosphopeptides can reliably normalize for sample loss and handling variance during enrichment. Thus, phosphopeptide enrichment combined with targeted quantification can be applied for absolute quantification of phosphorylation provided that pure heavy phosphopeptides with known concentrations are available as internal standards.
As shown in Figure 3C, endogenous phosphopeptides containing site Y427 from SHC1 protein can be detected from 50, 10, and 5 µg cell digest. Even at 5 µg starting peptides, which is equivalent to ~50,000 cells, more than 10 phosphopeptides can be quantified using either IMAC and TiO2 enrichment, but the two protocols displayed different sensitivity or selectivity towards different phosphopeptides. For example, we found that IMAC enrichment outperforms TiO2 for DOCK7-S1383 at 5 µg of tryptic peptide while TiO2 enrichment was more favorable to EGFR-Y1092 compared to the IMAC method (Table S4). For specific phosphopeptide sequences (e.g., MAPK1) with several possible phosphosites, the identity of phosphorylation sites was confirmed by the same retention time and same transition pattern with the synthetic heavy phosphopeptides standards (Figure S4). We also noted that for some of the phosphopeptides, the endogenous peaks did not elute at the exact same time as the internal standards, but with similar transitions (Figure S2.B). In such cases, the detected endogenous phosphopeptides could be isoforms with phosphosites distinct from the synthetic standards.9
Targeted quantification of phosphorylation dynamics
The TiO2 and IMAC workflows should be equally applicable for targeted quantification based on their comparable overall performance although each protocol has its own advantages and limitations. Here we chose the IMAC-SRM workflow for quantifying phosphorylation dynamics of the EGFR-MAPK signaling pathway using 100 µg tryptic peptides due to its advantages in enrichment specificity and more consistent recovery. Endogenous levels of phosphorylation were quantified in Hs578T cells before and after 10 ng/mL EGF for 10, 30, 120 min with four biological replicates per time point (Table S5). The precision of the assays is good with a median standard error of 9.9% across biological replicates.
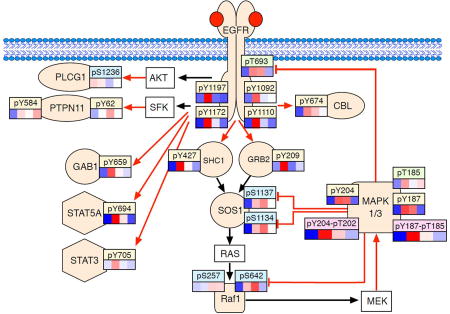
Figure 4A shows the overall phosphorylation dynamics of the pathway proteins, normalized to the average intensity values. Phosphorylation levels for 34 sites from 21 proteins could be reliably quantified. Significant differences in the dynamic pattern of the phosphopeptides were observed, which could be grouped into two distinct clusters (Figure 4A). The bottom cluster of phosphorylation sites were rapid responders to EGF treatment, with maximal levels of phosphorylation at 10 min and decayed rapidly afterwards. This cluster of phosphorylation sites represents direct substrates of the EGFR and other kinases of the MAPK kinase cascade. These include adaptor proteins (e.g. SHC1 Y427,21 GRB2 Y209,22 GAB1 Y65923), and transcription factors STAT3 and STAT5A. It also includes the two isoforms of MAPK itself. (Figure 4B). The second distinct cluster of phosphorylation sites displays a maximum at approximately 30 min, most of which correspond to negative feedback phosphorylation mediated by MAPK itself.24 Among these phosphorylation sites, those on SOS1 comprise a well-studied negative feedback system where phosphorylation at multiple sites by activated MAPK1/3 results in the dissociation of the adaptor proteins GRB2 and SHC1, which results in signal termination.25 The similar patterns of other negative phosphorylation events in this group (e.g. RAF1 S64226) indicates the presence of multiple feedback processes occurring simultaneously in the EGFR-MAPK signaling pathway. It is interesting to note that the rapid activation of MAPK1/3 by dual phosphorylation by MEK (MAPK1 Y204-T202 and MAPK3 Y187-T185) is followed by a slower increase of singly phosphorylated peptides. This suggests that inactivation of MAPK1/3 by phosphatases proceeds by sequential removal of one of the two activating phosphorylation events.
Figure 4. Phosphorylation dynamics in EGFR signaling pathway.

A. Heat map of phosphorylation dynamics as a function of time following 10 ng/mL EGF stimulation. For better visualization, the response of each phosphorylation site at each time point was normalized to its average relative abundance across all time points. Phosphorylation site of each protein labeled on the right, clustered by Pearson correlation. Columns represent relative intensity at indicated points of each phosphorylation site compared with its own averaged L/H ratio. At right showed are representative phosphorylation dynamics of selected sites in each distinct cluster. B. Selected dynamics of phosphorylation sites of key signaling molecules in the EGFR-MAPK signaling pathway. Colored symbols represent proteins that were evaluated and non-colored boxes were not evaluated. Red arrows are direct phosphorylation events and black arrows are indirect events or protein associations. Phosphorylation sites were coded with colors where tan is tyrosine phosphorylation, blue is serine phosphorylation, green is threonine phosphorylation and pink is double tyrosine-threonine phosphorylation.
DISCUSSION
In this study, we evaluated two commonly used enrichment protocols, IMAC and TiO2, as key components of targeted workflow for phosphorylation quantification in terms of enrichment recovery, reproducibility, and overall sensitivity. The two protocols apparently have significant differences in terms of enrichment recovery and specificity. The IMAC protocol provides nearly perfect specificity (~99%) but lower recovery (~40% on average); while TiO2 shows higher recovery (~70% on average) but poorer specificity (~70%) (Figure S1 and Figure 2). Interestingly, despite the higher enrichment recovery for TiO2, the phosphoproteome coverage for TiO2 from global LC-MS/MS analysis was much lower than that from IMAC enrichment (Figure S1). This observation suggests that enrichment specificity is a more critical factor than recovery in global LC-MS/MS experiments for obtaining high phosphoproteome coverage especially when sample amounts are not limited. This is presumably due to the stochastic sampling nature of shotgun proteomics. For example, in TiO2 enriched samples a significant portion of MS/MS spectra (~30%) were directed towards non-phosphopeptides due to the relatively poor enrichment specificity, thus resulting less spectra for phosphopeptides.
In term of targeted quantification, both enrichment protocols are confirmed as reproducible and reliable and both protocols are capable of achieving reproducible targeted quantification with relatively small amounts of starting materials (1–100 µg total starting peptides). While the overall performance of the two protocols is quite comparable, TiO2 enrichment is slightly more sensitive when using low amounts of starting material (<25 µg peptides) while IMAC enrichment works slightly better when starting with more than 25 µg peptides. There are several factors likely contributing to this difference, including the different binding chemistry between beads and phosphopeptide, the sizes and surface areas of resins, as well as the tips used for the study. Similar to a recent global phosphoproteomics study,27 we also observed significant loss at total starting peptides lower than 25 µg, which appears to be the threshold for preserving phosphopeptides during the enrichment step. Interestingly, we could quantify specific phosphopeptides when starting with 1–100 µg total peptides, which we attribute to the use of heavy phosphopeptides as internal standards for the enrichment. Also, the amount of peptides used in this work is generally less than those reported in recent studies using similar workflow for targeted phosphorylation (e.g. 200 µg),13,28 thus demonstrating that targeted workflows can be applied to biological and clinical samples, even when sample amounts are limited. We also noted that the two protocols can be complementary, especially when sample starting amounts are low. For example, IMAC protocol was more efficient in enriching phosphoserine-containing peptides while TiO2 method was more favorable to phosphorylated tyrosine when starting with 5 - 10 µg peptides (Table S4). It should be noted that a sharp drop in the number of quantifiable phosphopeptides was observed for both protocols when starting peptide amounts were below 25 µg. This is presumably due to a significant degree of nonspecific loss of peptides to the excess amount of beads when starting sample amount is small. Therefore, further improvements may be possible by detailed optimization of bead amounts and other conditions for handling very small amounts of samples.
Another interesting phenomenon is the observation of some more abundant miscleaved phosphopeptides than fully their counterpart tryptic phosphopeptides (Figure S5). For example, for the site of S1383 of DOCK7, we detected a much higher endogenous concentration of the miscleaved peptide (MNS[+80]LTFKK) compared to the full cleaved peptide (MNS[+80]LTFK) in trypsin digested samples. The results suggest that an extra caution needs to be taken when selecting surrogate phosphopeptides as the internal standards for targeted quantification of phosphorylation, since selection of a peptide with less favorable digestion efficiency could result in reduced sensitivity or even false negative results.
We demonstrated the utility of the targeted workflow for quantifying phosphorylation dynamics by quantifying the EGFR-MAPK pathway phosphorylation pattern in response to EGF. This temporal data provided several interesting insights into the network of EGF stimulated MAPK signaling transduction and their feedback regulation. As expected, many of the phosphorylation sites directly involved in the signal transduction cascade displayed rapid and strong increases in phosphorylation. For example, EGF rapidly activates the intrinsic protein tyrosine kinase activity of the EGFR as evidenced by its autophosphorylation at several tyrosine sites, such as Y1092, Y1110, Y1172, and Y1197.29 The autophosphorylation of the EGFR leads to the recruitment of diverse adaptor proteins mediated through binding of the SH2 and PTB domains of signaling effectors, including SHC1 Y427,21 GRB2 Y209,22 and GAB1 Y65923 (Figure 4B). The adaptors subsequently bind to SOS1 and activates the RAF-MAPK kinase cascade, leading to the phosphorylation of MAPK1/3. The activation of the downstream targets is evident in the significant increase of phosphorylation of proteins such as DOCK7 S30. These phosphorylation sites are positive regulators that are involved in the signal flowing and amplification of signal from the cell surface to the nucleus, resulting in a variety of cellular processes, including differentiation, proliferation, survival, and migration.30–32
Once the pathway is activated, cells are also equipped with negative regulators to attenuate signaling. Importantly, proteins that are targets of negative feedback regulation are frequently very low abundance proteins. For example, SOS1 and RAF1, which are only present at 5–10,000 copies per cell in the Hs578T cell line that we used.14 This is in contrast to the EGFR and MAPK1/3, which are present at hundreds of thousands of copies per cell. Despite the low abundance of these proteins, we were able to reliably measure several negative phosphorylation sites, which showed a maximum at 30 min.26 The S642 on RAF1 is a proline-directed serine site that is targeted by activated MAPK kinases at the SP/TP motif.33 In our phosphopeptide panel, 9 phosphorylation sites share the motif of SP/TP at or near the phosphorylation site of S/T (Table S5). In these 9 phosphorylation sites, 7 of them have significant phosphorylation increases sustained beyond 30 min. MAPK1/3 can also directly phosphorylate the EGFR at T693,3 and RAF1 at S642.26 Other proteins with significantly increased phosphorylation at 30 min are most likely direct or indirect substrates of MAPK, although further experiments will be needed to confirm the specific mechanisms involved. Nevertheless, the quantitative protein phosphorylation data can provides important information on both the kinetics of negative feedback, but also the relative strengths in the multiple feedback processes involved in signal attenuation. Understanding how the relative strength of these feedback loops are regulated could provide important insight into how cell signaling is controlled.
CONCLUSIONS
Targeted MS workflows for quantification of phosphorylating dynamics incorporating IMAC and TiO2 enrichment and LC-SRM are demonstrated to be effective with relatively small amounts of starting materials. The recovery of enrichment protocols, and the overall reproducibility and sensitivity of the workflows were assessed. Both protocols provided comparable performance in all these aspects; however, the enrichment recovery of IMAC is slightly lower, but more consistent across different peptides but the recovery of TiO2 is more sequence dependent. In terms of overall sensitivity, ~10 phosphopeptides (~25% among the panel) can still be quantified for both enrichment methods when only 5 µg tryptic peptides were used. Finally, the targeted quantification workflow enables simultaneous quantification of the phosphorylation dynamics of a panel of 33 phosphorylation sites in the EGFR-MAPK pathway in response to the stimulation of EGF, whose abundances vary over several orders of magnitude. The resulting quantitative data provides some insights of signal flows and feedback regulation in signal transduction.
Supplementary Material
Acknowledgments
Portions of this work were supported by NIH Grants UC4 DK104167, DP3 DK110844, and P41GM103493. This research was performed using resources and/or funding provided by the NIDDK-supported Human Islet Research Network (HIRN, RRID: SCR_014393; https://hirnetwork.org). The experimental work was performed in the Environmental Molecular Sciences Laboratory, a national scientific user facility sponsored by the DOE and located at Pacific Northwest National Laboratory, which is operated by Battelle Memorial Institute for the DOE under Contract DE-AC05-76RL0 1830.
Abbreviations
- IMAC
Immobilized metal affinity chromatography
- SRM
selected reaction monitoring
- PRM
parallel reaction monitoring
- LC
liquid chromatography
- MS
mass spectrometry
Footnotes
ASSOCIATED CONTENT
Supporting Information Available:
Supplementary tables and supplementary document on the details of global LC-MS/MS analysis, data analysis, and results for enrichment specificity, selected XICs for targeted detection of phosphopeptides with IMAC and TiO2, and observed miscleavage in phosphoproteomics are available. This material is available free of charge via the Internet at http://pubs.acs.org.
The authors declare no conflicts of interest.
References
- 1.Giansanti P, Aye TT, van den Toorn H, Peng M, van Breukelen B, Heck AJ. Cell Reports. 2015;11:1834–1843. doi: 10.1016/j.celrep.2015.05.029. [DOI] [PubMed] [Google Scholar]
- 2.Chan CY, Gritsenko MA, Smith RD, Qian WJ. Expert Rev. Proteomics. 2016;13:421–433. doi: 10.1586/14789450.2016.1164604. [DOI] [PMC free article] [PubMed] [Google Scholar]
- 3.Mertins P, Yang F, Liu T, Mani DR, Petyuk VA, Gillette MA, Clauser KR, Qiao JW, Gritsenko MA, Moore RJ, Levine DA, Townsend R, Erdmann-Gilmore P, Snider JE, Davies SR, Ruggles KV, Fenyo D, Kitchens RT, Li S, Olvera N, Dao F, Rodriguez H, Chan DW, Liebler D, White F, Rodland KD, Mills GB, Smith RD, Paulovich AG, Ellis M, Carr SA. Mol. Cell. Proteomics. 2014;13:1690–1704. doi: 10.1074/mcp.M113.036392. [DOI] [PMC free article] [PubMed] [Google Scholar]
- 4.Humphrey SJ, Azimifar SB, Mann M. Nat. Biotechnol. 2015;33:990–995. doi: 10.1038/nbt.3327. [DOI] [PubMed] [Google Scholar]
- 5.Mertins P, Mani DR, Ruggles KV, Gillette MA, Clauser KR, Wang P, Wang X, Qiao JW, Cao S, Petralia F, Kawaler E, Mundt F, Krug K, Tu Z, Lei JT, Gatza ML, Wilkerson M, Perou CM, Yellapantula V, Huang KL, Lin C, McLellan MD, Yan P, Davies SR, Townsend RR, Skates SJ, Wang J, Zhang B, Kinsinger CR, Mesri M, Rodriguez H, Ding L, Paulovich AG, Fenyö D, Ellis MJ, Carr SA. Nature. 2016;534:55–62. doi: 10.1038/nature18003. [DOI] [PMC free article] [PubMed] [Google Scholar]
- 6.Zhang H, Liu T, Zhang Z, Payne SH, Zhang B, McDermott JE, Zhou JY, Petyuk VA, Chen L, Ray D, Sun S, Yang F, Chen L, Wang J, Shah P, Cha SW, Aiyetan P, Woo S, Tian Y, Gritsenko MA, Clauss TR, Choi C, Monroe ME, Thomas S, Nie S, Wu C, Moore RJ, Yu KH, Tabb DL, Fenyö D, Bafna V, Wang Y, Rodriguez H, Boja ES, Hiltke T, Rivers RC, Sokoll L, Zhu H, Shih IM, Cope L, Pandey A, Zhang B, Snyder MP, Levine DA, Smith RD, Chan DW, Rodland KD. Cell. 2016;166:755–765. doi: 10.1016/j.cell.2016.05.069. [DOI] [PMC free article] [PubMed] [Google Scholar]
- 7.Shi T, Song E, Nie S, Rodland KD, Liu T, Qian WJ, Smith RD. Proteomics. 2016;16:2160–2182. doi: 10.1002/pmic.201500449. [DOI] [PMC free article] [PubMed] [Google Scholar]
- 8.Addona TA, Abbatiello SE, Schilling B, Skates SJ, Mani DR, Bunk DM, Spiegelman CH, Zimmerman LJ, Ham AJ, Keshishian H, Hall SC, Allen S, Blackman RK, Borchers CH, Buck C, Cardasis HL, Cusack MP, Dodder NG, Gibson BW, Held JM, Hiltke T, Jackson A, Johansen EB, Kinsinger CR, Li J, Mesri M, Neubert TA, Niles RK, Pulsipher TC, Ransohoff D, Rodriguez H, Rudnick PA, Smith D, Tabb DL, Tegeler TJ, Variyath AM, Vega-Montoto LJ, Wahlander A, Waldemarson S, Wang M, Whiteaker JR, Zhao L, Anderson NL, Fisher SJ, Liebler DC, Paulovich AG, Regnier FE, Tempst P, Carr SA. Nat. Biotechnol. 2009;27:633–641. doi: 10.1038/nbt.1546. [DOI] [PMC free article] [PubMed] [Google Scholar]
- 9.Shi T, Gao Y, Gaffrey MJ, Nicora CD, Fillmore TL, Chrisler WB, Gritsenko MA, Wu C, He J, Bloodsworth KJ, Zhao R, Camp DG, 2nd, Liu T, Rodland KD, Smith RD, Wiley HS, Qian WJ. Anal. Chem. 2015;87:1103–1110. doi: 10.1021/ac503797x. [DOI] [PMC free article] [PubMed] [Google Scholar]
- 10.Zheng Y, Zhang C, Croucher DR, Soliman MA, St-Denis N, Pasculescu A, Taylor L, Tate SA, Hardy WR, Colwill K, Dai AY, Bagshaw R, Dennis JW, Gingras AC, Daly RJ, Pawson T. Nature. 2013;499:166–171. doi: 10.1038/nature12308. [DOI] [PMC free article] [PubMed] [Google Scholar]
- 11.Vogel WK, Gafken PR, Leid M, Filtz TM. J. Proteome Res. 2014;13:5860–5868. doi: 10.1021/pr5007697. [DOI] [PMC free article] [PubMed] [Google Scholar]
- 12.Abelin JG, Patel J, Lu X, Feeney CM, Fagbami L, Creech AL, Hu R, Lam D, Davison D, Pino L, Qiao JW, Kuhn E, Officer A, Li J, Abbatiello S, Subramanian A, Sidman R, Snyder E, Carr SA, Jaffe JD. Mol. Cell. Proteomics. 2016;15:1622–1641. doi: 10.1074/mcp.M116.058354. [DOI] [PMC free article] [PubMed] [Google Scholar]
- 13.Kennedy JJ, Yan P, Zhao L, Ivey RG, Voytovich UJ, Moore HD, Lin C, Pogosova-Agadjanyan EL, Stirewalt DL, Reding KW, Whiteaker JR, Paulovich AG. Mol. Cell. Proteomics. 2016;15:726–739. doi: 10.1074/mcp.O115.054940. [DOI] [PMC free article] [PubMed] [Google Scholar]
- 14.Shi T, Niepel M, McDermott JE, Gao Y, Nicora CD, Chrisler WB, Markillie LM, Petyuk VA, Smith RD, Rodland KD, Sorger PK, Qian WJ, Wiley HS. Sci. Signal. 2016;9:rs6. doi: 10.1126/scisignal.aaf0891. [DOI] [PMC free article] [PubMed] [Google Scholar]
- 15.Tape CJ, Worboys JD, Sinclair J, Gourlay R, Vogt J, McMahon KM, Trost M, Lauffenburger DA, Lamont DJ, Jørgensen C. Anal. Chem. 2014;86:10296–10302. doi: 10.1021/ac5025842. [DOI] [PMC free article] [PubMed] [Google Scholar]
- 16.Abelin JG, Trantham PD, Penny SA, Patterson AM, Ward ST, Hildebrand WH, Cobbold M, Bai DL, Shabanowitz J, Hunt DF. Nat. Protoc. 2015;10:1308–1318. doi: 10.1038/nprot.2015.086. [DOI] [PMC free article] [PubMed] [Google Scholar]
- 17.Niepel M, Hafner M, Pace EA, Chung M, Chai DH, Zhou L, Schoeberl B, Sorger PK. Sci. Signal. 2013;6:ra84. doi: 10.1126/scisignal.2004379. [DOI] [PMC free article] [PubMed] [Google Scholar]
- 18.Heibeck TH, Ding SJ, Opresko LK, Zhao R, Schepmoes AA, Yang F, Tolmachev AV, Monroe ME, Camp DG, 2nd, Smith RD, Wiley HS, Qian WJ. J. Proteome Res. 2009;8:3852–3861. doi: 10.1021/pr900044c. [DOI] [PMC free article] [PubMed] [Google Scholar]
- 19.Thingholm TE, Jørgensen TJ, Jensen ON, Larsen MR. Nat. Protoc. 2006;1:1929–1935. doi: 10.1038/nprot.2006.185. [DOI] [PubMed] [Google Scholar]
- 20.MacLean B, Tomazela DM, Shulman N, Chambers M, Finney GL, Frewen B, Kern R, Tabb DL, Liebler DC, MacCoss MJ. Bioinformatics. 2010;26:966–968. doi: 10.1093/bioinformatics/btq054. [DOI] [PMC free article] [PubMed] [Google Scholar]
- 21.Naegle KM, White FM, Lauffenburger DA, Yaffe MB. Mol. Biosyst. 2012;8:2771–2782. doi: 10.1039/c2mb25200g. [DOI] [PMC free article] [PubMed] [Google Scholar]
- 22.Li S, Couvillon AD, Brasher BB, Van Etten RA. Embo J. 2001;20:6793–6804. doi: 10.1093/emboj/20.23.6793. [DOI] [PMC free article] [PubMed] [Google Scholar]
- 23.Cunnick JM, Mei L, Doupnik CA, Wu J. J. Biol. Chem. 2001;276:24380–24387. doi: 10.1074/jbc.M010275200. [DOI] [PubMed] [Google Scholar]
- 24.Sturm OE, Orton R, Grindlay J, Birtwistle M, Vyshemirsky V, Gilbert D, Calder M, Pitt A, Kholodenko B, Kolch W. Sci. Signal. 2010;3:ra90. doi: 10.1126/scisignal.2001212. [DOI] [PubMed] [Google Scholar]
- 25.Lake D, Corrêa SA, Müller J. Cell. Mol. Life Sci. 2016;73:4397–4413. doi: 10.1007/s00018-016-2297-8. [DOI] [PMC free article] [PubMed] [Google Scholar]
- 26.Dougherty MK, Müller J, Ritt DA, Zhou M, Zhou XZ, Copeland TD, Conrads TP, Veenstra TD, Lu KP, Morrison DK. Mol. Cell. 2005;17:215–224. doi: 10.1016/j.molcel.2004.11.055. [DOI] [PubMed] [Google Scholar]
- 27.Post H, Penning R, Fitzpatrick MA, Garrigues LB, Wu W, MacGillavry HD, Hoogenraad CC, Heck AJ, Altelaar AF. J. Proteome Res. 2017;16:728–737. doi: 10.1021/acs.jproteome.6b00753. [DOI] [PubMed] [Google Scholar]
- 28.de Graaf EL, Kaplon J, Mohammed S, Vereijken LA, Duarte DP, Gallego LR, Heck AJ, Peeper DS, Altelaar AF. J. Proteome Res. 2015;14:2906–2914. doi: 10.1021/acs.jproteome.5b00236. [DOI] [PubMed] [Google Scholar]
- 29.Assiddiq BF, Tan KY, Toy W, Chan SP, Chong PK, Lim YP. J. Proteome Res. 2012;11:4110–4119. doi: 10.1021/pr3002029. [DOI] [PubMed] [Google Scholar]
- 30.Roskoski R. Pharmacol. Res. 2012;66:105–143. doi: 10.1016/j.phrs.2012.04.005. [DOI] [PubMed] [Google Scholar]
- 31.Zhang W, Liu HT. Cell Res. 2002;12:9–18. doi: 10.1038/sj.cr.7290105. [DOI] [PubMed] [Google Scholar]
- 32.Arthur JS, Ley SC. Nat. Rev. Immunol. 2013;13:679–692. doi: 10.1038/nri3495. [DOI] [PubMed] [Google Scholar]
- 33.Davis RJ. J. Biol. Chem. 1993;268:14553–14556. [PubMed] [Google Scholar]
Associated Data
This section collects any data citations, data availability statements, or supplementary materials included in this article.