Abstract
Intestinal epithelial cells form a selectively permeable barrier to protect colon tissues from luminal microbiota and antigens and to mediate nutrient, fluid, and waste flux in the intestinal tract. Dysregulation of the epithelial cell barrier coincides with profound shifts in metabolic energy, especially in the colon, which exists in an energetically depleting state of physiological hypoxia. However, studies that systematically examine energy flux and adenylate metabolism during intestinal epithelial barrier development and restoration after disruption are lacking. Here, to delineate barrier-related energy flux, we developed an HPLC-based profiling method to track changes in energy flux and adenylate metabolites during barrier development and restoration. Cultured epithelia exhibited pooling of phosphocreatine and maintained ATP during barrier development. EDTA-induced epithelial barrier disruption revealed that hypoxanthine levels correlated with barrier resistance. Further studies uncovered that hypoxanthine supplementation improves barrier function and wound healing and that hypoxanthine appears to do so by increasing intracellular ATP, which improved cytoskeletal G- to F-actin polymerization. Hypoxanthine supplementation increased the adenylate energy charge in the murine colon, indicating potential to regulate adenylate energy charge–mediated metabolism in intestinal epithelial cells. Moreover, experiments in a murine colitis model disclosed that hypoxanthine loss during active inflammation correlates with markers of disease severity. In summary, our results indicate that hypoxanthine modulates energy metabolism in intestinal epithelial cells and is critical for intestinal barrier function.
Keywords: intestinal epithelium, epithelia, barrier function, intestinal metabolism, tight junction, energy metabolism, colitis, cytoskeleton
Introduction
The primary functions of intestinal epithelial cells (IECs)2 are to form a selectively permeable barrier to protect the tissue from luminal microbiota and antigens and mediate the flux of nutrients, fluid, and waste across that barrier. Selective permeability of the polarized, intact epithelium is mediated by specialized intercellular junctions termed the apical junctional complex (AJC), comprising the tight junction and adjacent adherens junction (1). The AJC is supported by a highly cross-linked actin cytoskeleton built from an extensive network of F-actin bundles associating with tight junctions and a dense circumferential ring of actin and myosin contiguous with adherens junctions (2). This actomyosin ring readily co-purifies with other cytoskeletal proteins and demonstrates ATP-dependent contractility ex vivo (2), highlighting the contractile nature of the apical actin cytoskeletal network and its intimate association with barrier-forming and -regulating components (3).
Tissues lined by epithelial cells are supplied by a rich and complex vasculature. The gastrointestinal tract, for example, adapts to profound fluctuations in blood perfusion on a daily basis (4). Areas of a healthy gastrointestinal mucosa withstand pO2 levels approaching anoxia, existing in a homeostatic state termed “physiologic hypoxia” (5). Analysis of oxygen exchange within the intestine revealed that arterial blood-derived O2 diffuses across the villus to parallel venules, resulting in graded hypoxia as the oxygen emanating from the submucosa depletes as it traverses toward the anaerobic lumen (6). Colonic epithelia endure the hypoxic end of the O2 gradient, existing in one of the more austere microenvironments found in mammals (7). In this environment, small perturbations in blood flow can result in relatively large decreases in O2 delivery and resultant ischemia/hypoxia, which can be particularly profound during injury. The high-energy demands of the mucosa and fundamental need of barrier function for intestinal homeostasis have driven the evolution of a number of mechanisms to cope with this energetically depleting, low-oxygen state (8).
Barrier dysregulation in a variety of disease states is accompanied by profound shifts in metabolic energy. We previously identified a family of genes involved in creatine metabolism that are coordinately regulated by the transcription factor hypoxia-inducible factor (HIF) (9). Subcellular localization of creatine kinase (CK) isoforms revealed coupling to the AJC, with CK inhibition attenuating junctional assembly and barrier function. Despite these observations, studies that systematically examine energy flux and adenylate metabolism during intestinal epithelial barrier development and restoration after disruption are lacking. To delineate barrier-related adenylate energy flux, we developed an HPLC-based profiling method to characterize changes in high-energy phosphates and associated adenylate metabolites. We identified an ability in IECs to maintain ATP and pool phosphocreatine during barrier development that associated with the accumulation of downstream adenylate metabolites. Extensions of these studies with models of barrier stress identified a capacity for hypoxanthine (Hpx) to promote epithelial cellular function through improving cellular energetics and cytoskeletal capability. An unbiased metabolomic screen in murine colon tissue identified a loss of Hpx during active inflammation, which correlated with indicators of disease severity, suggesting that Hpx may also serve as an in vivo biomarker of barrier function. The work contained herein identifies Hpx as a central metabolite in IEC function.
Results
Energy and adenylate metabolite profiling during epithelial barrier formation
Our recent studies revealed that barrier function is tightly linked to creatine (Cr) and phosphocreatine (PCr) metabolism, where a loss of functional CK attenuated barrier development and restitution (9). For this reason, we broadened our analysis of adenylate energy metabolites during IEC barrier formation. An extraction protocol and HPLC-based analytical method was developed to quantitate Cr, PCr, and 10 adenylate energy-related metabolites (Fig. 1). Using this protocol, adenylate metabolites were profiled during barrier formation in T84 cells. As barrier resistance increased, Cr and PCr accumulated (∼1300 and 500 μm, respectively), indicating that stored energy capacity rises in conjunction with barrier (Figs. 2, A and B). Early in the barrier formation process (transepithelial resistance <25% of maximum), ATP and xanthine (Xan) levels equilibrate (∼25 and 7.5 μm, respectively), whereas inosine (Ino) and hypoxanthine (Hpx) equilibrate later (transepithelial resistance >85% of maximum) to ∼2 and 1 μm, respectively (Fig. 2B). ADP was observed at <1 μm throughout barrier formation, whereas low (<500 nm) to undetectable levels of AMP, IMP, adenosine (Ado), adenine (Ad), and uric acid (UA) were observed (Fig. 2C).
Figure 1.
Profile of the HPLC method used to analyze the energy and adenylate metabolites.
Figure 2.
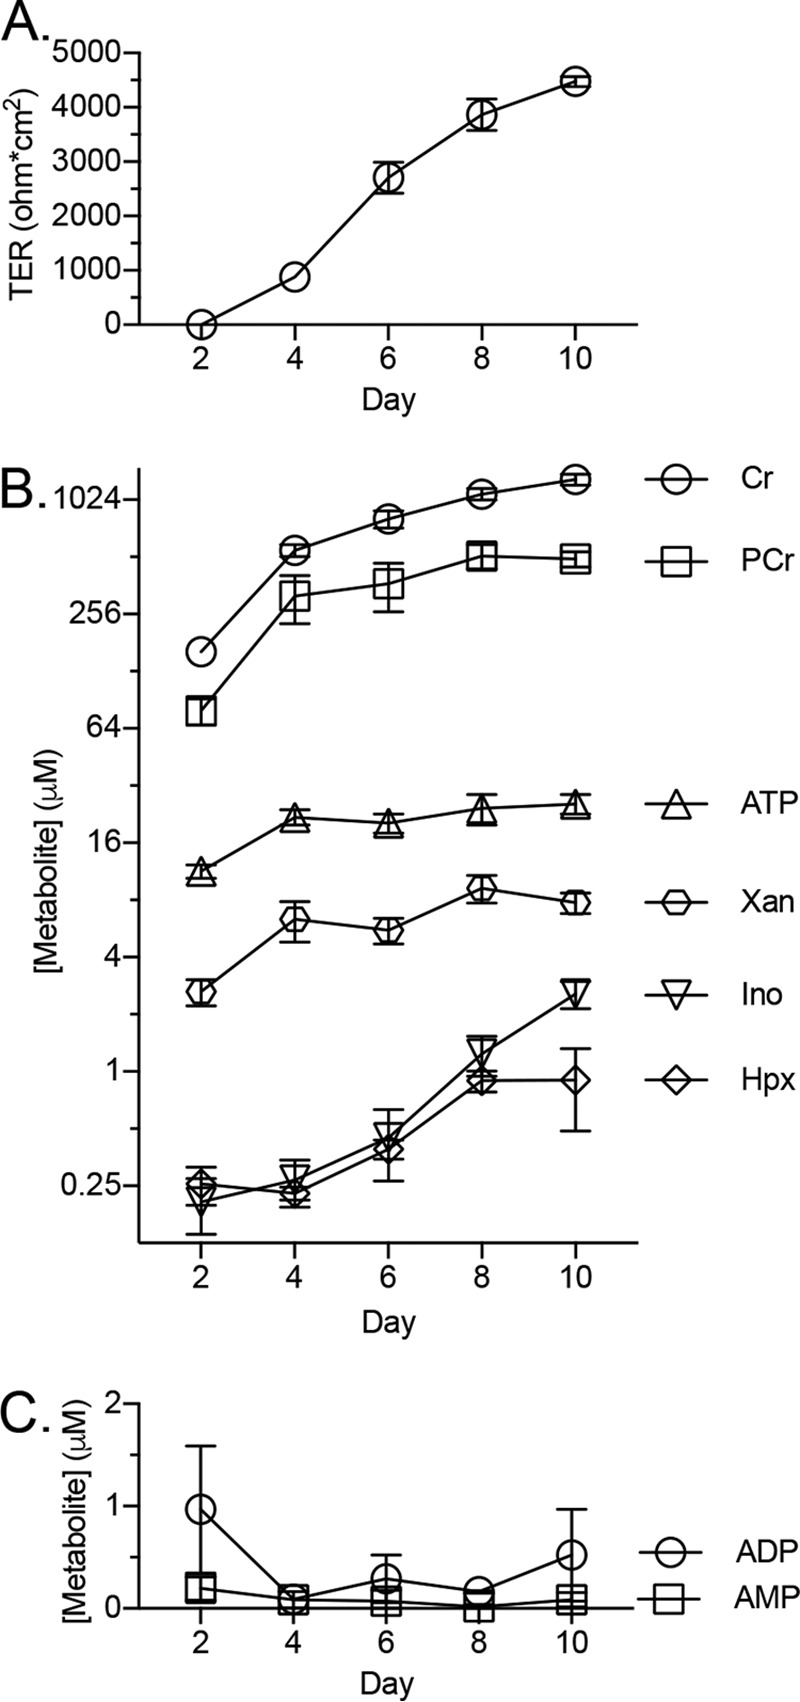
Quantification of T84 cell metabolite extracts during barrier development. A, transepithelial resistance measurements during barrier formation; n = 3. B and C, concentration of metabolites in cellular extracts during barrier formation as determined by HPLC; n = 3. Data are presented as mean ± S.D. (error bars).
Hypoxanthine supplementation improves barrier function and wound-healing capabilities
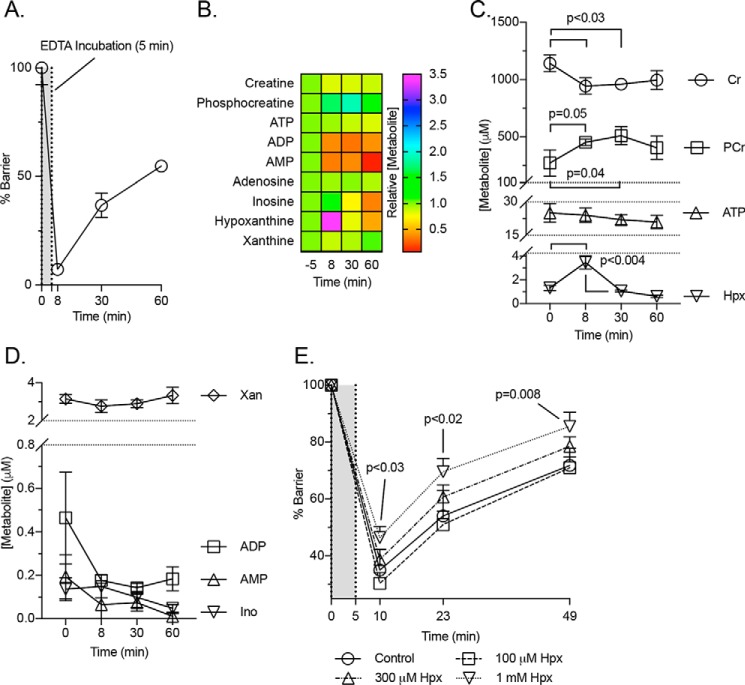
The adenylate and energy metabolite shifts were next observed in a model of epithelial barrier disruption, namely the “calcium switch” model (10). This model utilizes transient divalent cation chelation to disrupt epithelial tight junctions in fully confluent cells. As shown in Fig. 3A, this maneuver results in a >90% loss of measureable barrier that can be restored over time. Significant changes were observed in the creatine pool, with PCr increasing from ∼275 to 500 μm (p = 0.04) and Cr decreasing from ∼1100 to 950 μm (p < 0.03) at points along the experiment (Fig. 3, B and C). To our surprise, this analysis identified an inverse correlation between Hpx and barrier, with Hpx spiking from ∼1 to 3.5 μm (p < 0.004) at the barrier nadir (Fig. 3, B and C). This observation suggests that epithelia have the capacity to rapidly regulate adenylate metabolite pools, with Hpx serving as a marker of such metabolite flux. All other metabolite responses were insignificant or undetectable (Fig. 3D).
Figure 3.
Metabolite analyses of Ca2+ switch experiments. A, transepithelial resistance measurements of the T84 cells used for the calcium switch metabolic analyses; n = 3. B–D, metabolite responses to calcium switch experiment as determined by HPLC; n = 3. E, barrier responses to hypoxanthine supplementation during a calcium switch experiment; n = 6. Data are presented as mean ± S.D. (error bars).
To extend this observation, T84 cells were supplemented with Hpx (range 0.1–1 mm, 20 h), and a calcium switch assay was performed. Such pre-exposure to Hpx typically increased intracellular Hpx levels up to 100-fold. Functionally, Hpx preloading proved protective of cellular barrier and promoted barrier reformation in a dose-responsive manner (Fig. 3E). Cells supplemented with 300 μm and 1 mm Hpx (p < 0.03) exhibited improved barrier throughout the course of the experiment, indicating that Hpx promotes epithelial barrier restitution following disruption.
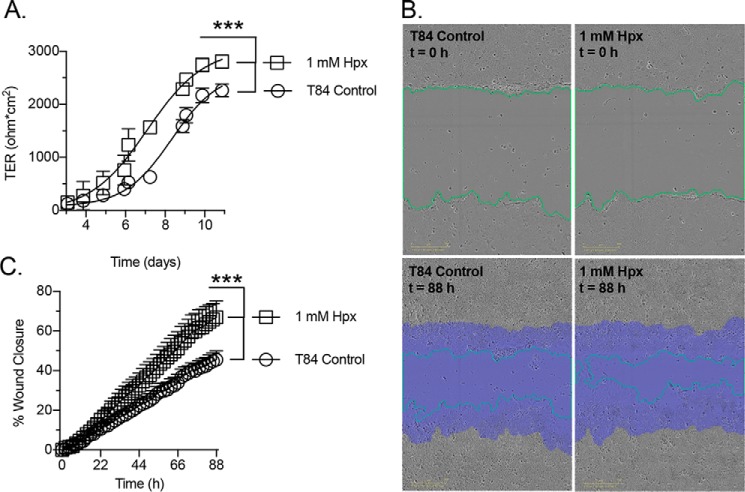
As an additional model, we examined the influence of Hpx supplementation on T84 cell barrier formation from a subconfluent state. This analysis revealed that Hpx enhances the barrier formation rate (∼1.2-fold based upon time to 50% maximal transepithelial resistance (TER), p < 0.001) and resulted in a monolayer with significantly higher resistance (∼1.2-fold, p < 0.001; Fig. 4A). Parallel studies employed a scratch wound assay to assess the influence of Hpx supplementation on cellular restitution. Hypoxanthine significantly increased epithelial wound closure rate following scratching (∼1.5-fold, p < 0.001; Fig. 4, B and C), revealing a capacity to improve cellular migratory ability.
Figure 4.
Barrier formation and wound-healing responses to hypoxanthine supplementation. A, barrier formation response to 1 mm hypoxanthine supplementation; n = 6. B and C, wound-healing responses to 1 mm hypoxanthine supplementation; n = 5. Green line, wound edge; purple area, original wound area in B. Data are presented as mean ± S.D. (error bars). ***, p < 0.001.
Epithelial cellular energetics are promoted by hypoxanthine
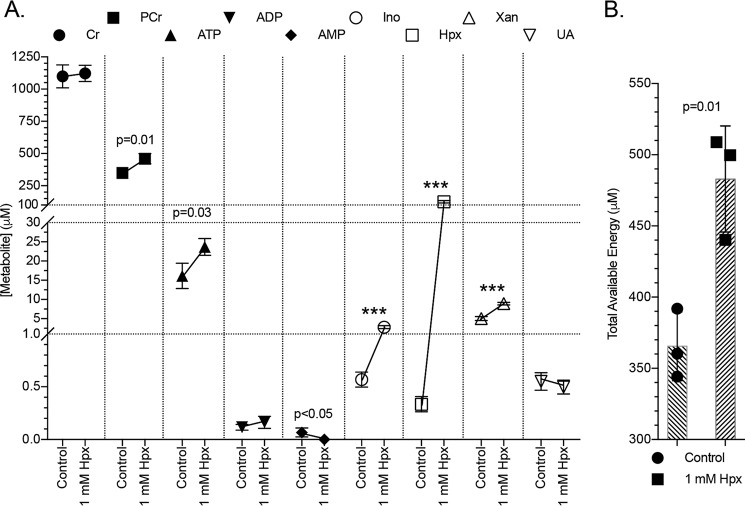
The energy and adenylate metabolite responses of T84 cells to Hpx supplementation were determined next. As shown in Fig. 5A, Hpx was effectively used by the cells as an energetic source, where supplementation significantly increased both PCr from ∼300 to 450 μm (p = 0.01) and ATP from ∼15 to 24 μm (p = 0.03), resulting in an ∼365 to 480 μm increase (p = 0.01) in total available energy (TAE; PCr + ATP + 0.5 × ADP; Fig. 5B). Adenosine diphosphate amounts did not significantly change, whereas the initially low AMP levels abated (p < 0.05). Inosine rose from ∼600 nm to 3 μm (p < 0.001), and xanthine increased from ∼6 to 9 μm (p < 0.001). Intriguingly, UA did not significantly change, indicating that Hpx can function as a purine reservoir.
Figure 5.
Metabolite responses to hypoxanthine supplementation. A, metabolite responses of T84 cells to 1 mm hypoxanthine supplementation as measured by HPLC; n = 3, t = 20 h. B, total available energy response to hypoxanthine supplementation. Data are presented as mean ± S.D. (error bars). Total available energy = PCr + ATP + (0.5 × ADP); ***, p < 0.001.
Allopurinol attenuates barrier development by inhibiting adenylate flux through the hypoxanthine salvage pathway
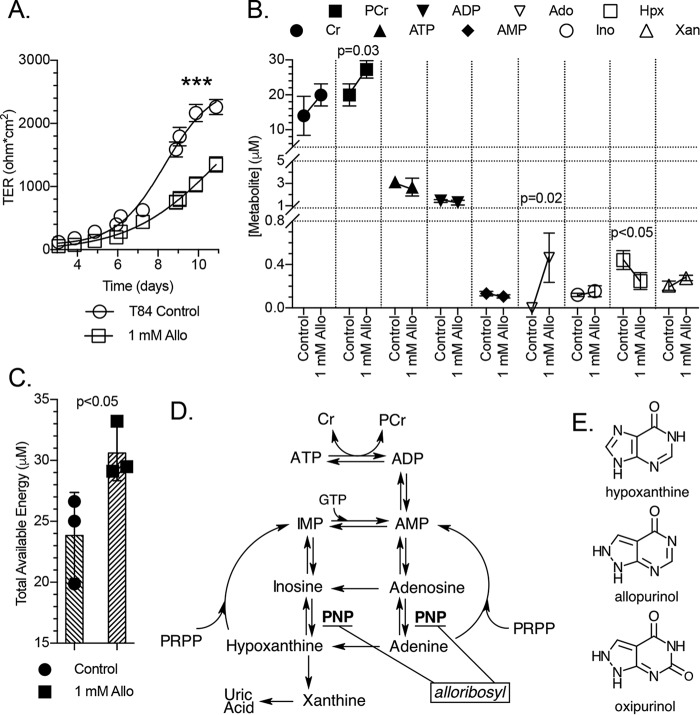
Allopurinol (Allo) is a structural analog of hypoxanthine commonly used to treat gout. The drug is metabolized into oxipurinol by xanthine oxidase (XO), which in turn inhibits XO and decreases UA. Allopurinol was employed here to function as a competitive substrate/inhibitor for hypoxanthine-guanine phosphoribosyl transferase (HGPRT) to assess the contribution of Hpx salvage to the barrier formation process. Supplementation with Allo (1 mm) significantly attenuated T84 cell barrier formation (p < 0.001; Fig. 6A). In subconfluent (restituting) T84 cells treated with Allo (20 h), small increases in Xan and Ino were observed, but to our surprise, Hpx decreased from ∼400 to 250 nm (p < 0.05), whereas Ado increased from trace/undetectable levels to ∼400 nm (p = 0.02; Fig. 6B). An ∼20 to 27 μm (p = 0.03) PCr increase accounted for a corresponding increase in TAE (Fig. 6C). Adenine, IMP, and UA were observed at undetectable to trace levels.
Figure 6.
Barrier development and metabolite responses to allopurinol. A, transepithelial resistance measurements of T84 cell barrier development in control and 1 mm allopurinol-treated cells; n = 6. B, metabolite responses of subconfluent T84 cells to allopurinol as measured by HPLC; n = 3, t = 20 h. C, total available energy response of experiment depicted in B. D, representation of the adenylate metabolite pathway identifying the point of hypoxanthine salvage inhibition by a putative allopurinol-ribosyl derivative (alloribosyl). E, structures of hypoxanthine, allopurinol, and oxipurinol. Data are presented as mean ± S.D. (error bars). Total available energy = PCr + ATP + (0.5 × ADP). ***, p < 0.001.
Allopurinol can be metabolized into a ribosyl derivative (alloribosyl) that inhibits purine nucleoside phosphorylase (PNP) (11–13) and therefore metabolite flux through the Hpx and adenine salvage pathways (14). Indeed, a new peak in the HPLC analyses exclusive to allopurinol-treated samples was observed and has a retention time compatible with what could be expected for alloribosyl (Fig. S1). Purine nucleoside phosphorylase inhibition can account for the lower Hpx and higher Ado and Ino observed in Allo-treated, restituting T84 cells (Fig. 6D). If PNP inhibition is the case, alloribosyl performs the intended purpose of Allo treatment, perhaps in conjunction with competitive HGPRT inhibition, by attenuating adenylate degradation to Hpx and demonstrates the necessity of adenylate flux through the purine salvage pathway(s) for proper cellular function.
Hypoxanthine promotes barrier function under hypoxia and attenuates oxygen consumption
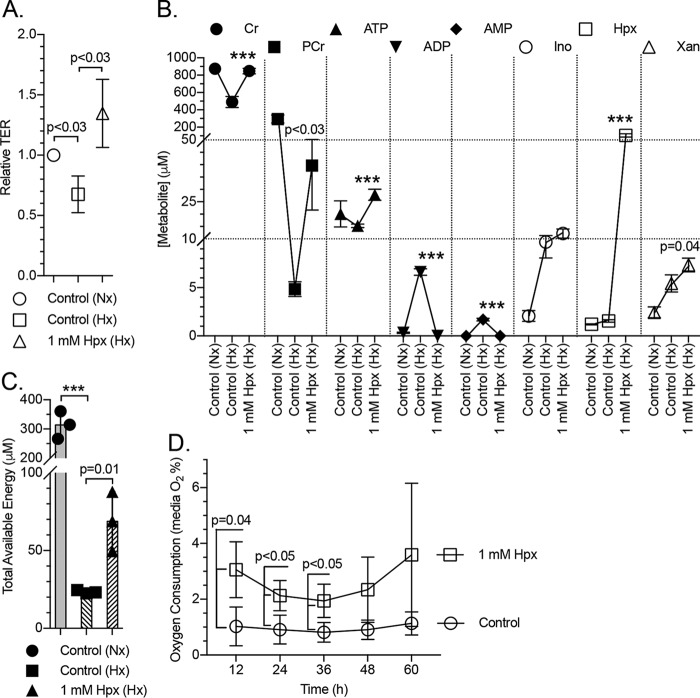
To examine the impact of Hpx supplementation on epithelial function during physiologically relevant metabolic stress, T84 cells were exposed to hypoxia (1% O2, 40 h) in the presence and absence of 1 mm Hpx, and barrier and adenylate metabolites were monitored. Hypoxia elicited an ∼32% decrease (p < 0.03) in measured barrier in the control cells (Fig. 7A). The hypoxia-induced fall in TER was not only prevented by Hpx supplementation but perhaps even overcompensated to increase overall barrier resistance above control conditions (1.3-fold; Fig. 7A). Hypoxia proved depleting to the creatine pool, with Cr and PCr drastically decreasing from ∼900 to 500 μm (p < 0.001) and from ∼300 to 5 μm (p < 0.001), respectively. Hypoxanthine nearly prevented the hypoxia-induced loss of Cr by increasing levels to ∼800 μm (p < 0.001) while increasing PCr levels to ∼40 μm (p < 0.03). In a similar fashion, hypoxia induced a ∼20 to 15 μm decrease in ATP that was recovered by Hpx supplementation to ∼28 μm (p < 0.001). Hypoxia also increased ADP and AMP from <500 nm to nearly 7 and 2 μm (p < 0.001), respectively, with the increases counteracted by Hpx (p < 0.001), resulting in the normalization of ATP, ADP, and AMP to normoxic levels. Inosine levels rose ∼5-fold to 10 μm (p < 0.002), Hpx rose ∼1.3-fold to 1.6 μm, and Xan rose ∼2-fold to 5 μm (p < 0.008) under hypoxia. Inosine further rose to ∼13 μm and xanthine rose to ∼7.5 μm (p = 0.04) with Hpx supplementation (Fig. 7B). The TAE was detrimentally impacted by hypoxia, dropping from ∼320 to 21 μm (p < 0.001), but showed significant recovery with hypoxanthine to ∼69 μm (p = 0.01; Fig. 7C). Adenine, Ado, IMP, and UA were observed at undetectable to trace levels.
Figure 7.
Barrier and metabolite responses of hypoxic cells to hypoxanthine. A, relative transepithelial resistance measurements of normoxic control, hypoxic control (1% O2), and hypoxanthine (1 mm)-supplemented (hypoxic, 1% O2) T84 cells; n = 3, t = 40 h. B, metabolite responses of cells submitted to hypoxia and hypoxia + 1 mm hypoxanthine as measured by HPLC. Statistics are shown for hypoxic samples only; n = 3, t = 40 h. C, total available energy response of the experiment depicted in B. D, oxygen consumption of control and hypoxanthine-supplemented T84 cells in the late restitution/early barrier-forming stage as measured by medium O2 percentage. Cells were plated at t = −24 h; n = 3. Data are presented as mean ± S.D. (error bars). Total available energy = PCr + ATP + (0.5 × ADP). Nx, normoxia; Hx, hypoxia; ***, p < 0.001.
In further analyses, we monitored the oxygen consumption of T84 cells in the late restitution/early barrier-forming stage. The medium was found to be quite hypoxic at 1% O2 for control cells. Hypoxanthine-supplemented cells consumed less oxygen, with supplemented medium O2 ranging between 2 and 3% (p < 0.05; Fig. 7D), indicating a capacity for Hpx to alleviate the aerobic respiratory burden of T84 cells.
Glycolytic inhibition abrogates the influence of hypoxanthine on cellular energetics
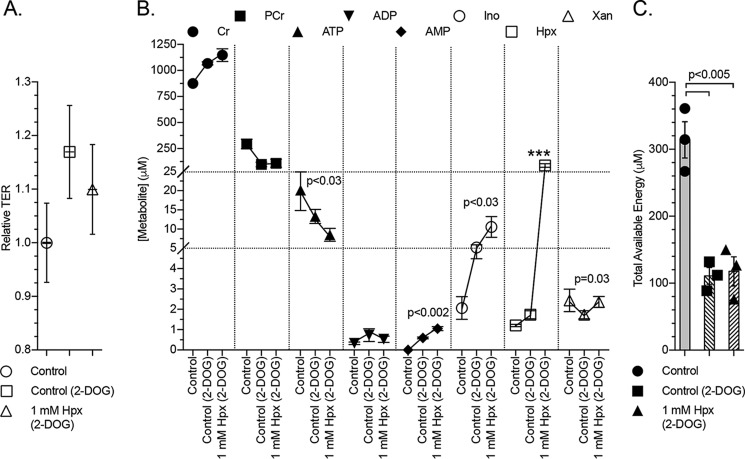
To extend our models of energetic stress, we defined the energy and adenylate metabolic shifts in chemical ATP-depleting conditions. For these purposes, T84 cells were incubated with 2-deoxy-d-glucose (2-DOG; 20 mm, 2 h). Transepithelial resistance did not significantly change over the course of the 2-DOG experiment (Fig. 8A). Cells submitted to 2-DOG produced extracts that exhibited a ∼900 to 1050 μm (p < 0.002) Cr increase, ∼300 to 100 μm (p < 0.003) PCr decrease, ∼20 to 13 μm ATP decrease, slight ADP and AMP increases to <1 μm, ∼2 to 5 μm (p < 0.004) Ino increase, 1.2 to 1.7 μm (p = 0.01) Hpx increase, and small Xan decrease (Fig. 8B). These energy metabolite shifts concomitantly decreased the TAE from ∼320 to 110 μm (p < 0.005; Fig. 8C). Adenine, Ado, IMP, and UA were observed at undetectable to trace levels.
Figure 8.
Barrier and metabolite responses of chemically ATP-depleted cells to hypoxanthine. A, relative transepithelial resistance measurements of control, 2-deoxyglucose (20 mm)–treated, and 2-deoxyglucose + hypoxanthine (1 mm)–treated T84 cells; n = 3, t = 2 h. B, metabolite responses of 2-deoxyglucose–treated cells supplemented with hypoxanthine as measured by HPLC. Statistics are shown for 2-deoxyglucose-treated samples only; n = 3, t = 2 h. C, total available energy response of experiments depicted in B. Data are presented as mean ± S.D. (error bars). Total available energy = PCr + ATP + (0.5 × ADP); ***, p < 0.001.
Hypoxanthine supplementation did not improve cellular energetics during 2-DOG–induced glycolytic inhibition despite increasing the intracellular Hpx over 40-fold. Instead, decreases in ATP and increases in AMP, Ino, and Xan were observed (Fig. 8B), resulting in no significant improvement of TAE (Fig. 8C). In a separate experiment, the 2-DOG + Hpx results were generally recapitulated in cells treated with 2-DOG + oligomycin A + Hpx (2 μm oligomycin A, 30 min; Fig. S2).
The energetic benefit provided by hypoxanthine improves cytoskeletal capability
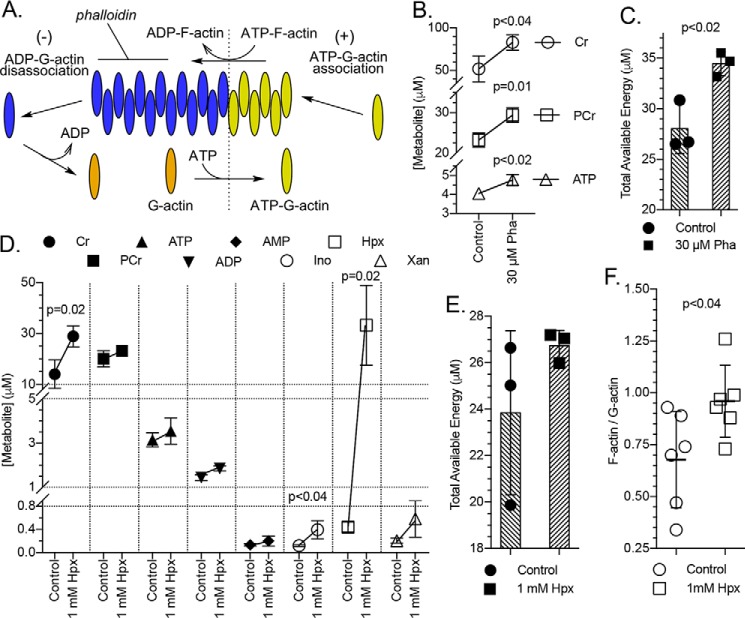
To determine the contribution of energy to cytoskeletal activity during barrier restitution in intestinal epithelial cells, subconfluent (restituting) T84 cells were treated with 30 μm phalloidin for 20 h, and their energy metabolites were analyzed (a 30 μm treatment was determined best after an initial experiment screening 0–100 μm treatments). Phalloidin is a phallotoxin that binds and stabilizes filamentous actin (F-actin), halting actin treadmilling activity and thus cellular migratory capability (Fig. 9A) (15). Phalloidin-treated cells showed significant increases in both PCr and ATP (Fig. 9B), resulting in a TAE increase from ∼28 to 34 μm (p < 0.02; Fig. 9C). From these data, we estimate that the epithelial cells commit 19 ± 1% of TAE to actin-based activity during restitution. This estimate approximates previous findings where vascular endothelial cells commit 18% of energy to actomyosin ATPase activity (16). Restituting cells supplemented with hypoxanthine doubled their Cr to ∼30 μm (p = 0.02) but displayed only moderate increases in PCr and ATP and in turn an equally moderate increase in TAE (Fig. 9, D and E). This modest hypoxanthine-derived energetic benefit is a remnant of the actual benefit, which was utilized to polymerize G-actin into F-actin, as indicated by a 0.68 to 0.96 (p < 0.04) increase in the cellular F- to G-actin ratio (Fig. 9F).
Figure 9.
Energy devoted to cytoskeletal function and influence of hypoxanthine supplementation on G- to F-actin polymerization. A, depiction of actin treadmilling indicating the binding of phalloidin to F-actin. B, energy metabolite response in subconfluent (restituting) T84 cells to 30 μm phalloidin as measured by HPLC; n = 3, t = 20 h. C, total available energy response of experiment depicted in B. D, metabolite responses in restituting T84 cells treated with 1 mm hypoxanthine as measured by HPLC; n = 3, t = 20 h. E, total available energy response of experiment depicted in D. F, influence of hypoxanthine supplementation on the F-actin to G-actin ratio in restituting T84 cells. Data are presented as mean ± S.D. (error bars). Total available energy = PCr + ATP + (0.5 × ADP). Pha, phalloidin.
Hypoxanthine supplementation modulates murine colon energy metabolites
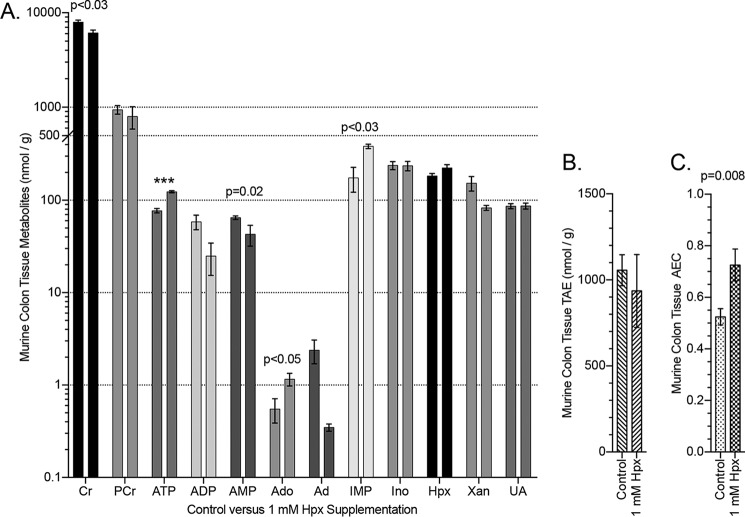
We further extended our in vitro observations to the in vivo setting. Initially, we profiled adenylate metabolites in wildtype C57Bl/6 murine colonic tissue (Fig. 10A). This analysis revealed a surprisingly broad distribution of adenylate and energy metabolites at baseline. For example, adenine and adenosine exhibit concentrations <1 nmol/g, whereas basal Cr and PCr levels exceed 1 μmol/g. Moreover, ATP, ADP, AMP levels exist at nearly equimolar concentrations at baseline.
Figure 10.
Murine colon energy and adenylate metabolite responses to hypoxanthine supplementation. A, HPLC analyses of murine colon tissue in control (n = 9) and 1 mm hypoxanthine-supplemented (drinking water; n = 4) mice. B, total available energy in colon tissue of control and hypoxanthine-treated mice. C, adenylate energy charge in colon tissue of control and hypoxanthine-treated mice. Data are presented as mean ± S.E. (error bars). TAE = PCr + ATP + (0.5 × ADP); AEC = (ATP + 0.5 × ADP)/(ATP + ADP + AMP); ***, p < 0.001.
To define the influence of Hpx in vivo, we compared murine colonic energy and adenylate metabolites with and without Hpx supplementation (1 mm Hpx in drinking water for 2 weeks). This analysis revealed a capacity for Hpx (∼1.2-fold increase) to significantly modulate relative [ATP], [ADP], and [AMP] in a manner similar to that observed in T84 cells. Specifically, Hpx induced an ∼80 to 125 nmol/g (p < 0.001) ATP increase, ∼60 to 25 nmol/g ADP decrease, and ∼65 to 40 nmol/g (p = 0.02) AMP decrease. Also of note were ∼0.6 to 1.2 nmol/g (p < 0.05) Ado and ∼175 to 385 nmol/g (p < 0.03) IMP increases (Fig. 10A). Hypoxanthine supplementation did not significantly alter the TAE in the tissue (Fig. 10B) but did increase the adenylate energy charge (AEC; (ATP + 0.5 × ADP)/(ATP + ADP + AMP)) from ∼0.52 to 0.73 (p = 0.008). The relative concentrations of the adenine phosphate pool ([ATP], [ADP], and [AMP]) operate to allosterically control many regulatory enzymes, notably the AEC-controlled AMPK (17, 18), indicating potential for Hpx to influence colonic epithelial metabolism at a fundamental level.
Loss of hypoxanthine correlates with disease severity in a murine colitis model
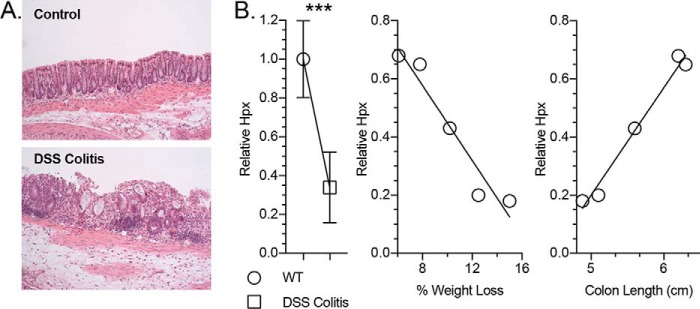
Given the prominent role of Hpx in epithelial energetics and barrier function in vitro, we tracked the impact of a mucosal disease model on Hpx levels in the colon in vivo. For these purposes, we utilized the dextran sulfate sodium (DSS) colitis model of acute inflammation. An unbiased metabolomic analysis of tissue extracts from healthy and DSS colitic murine colons (19) revealed a >65% decrease in Hpx (p < 0.001) in colitic mice during active inflammation, including a loss of crypt architecture and infiltration of large numbers of leukocytes (Fig. 11, A and B). Importantly, among the colitic animals, the DSS-associated Hpx loss strongly correlated with disease markers, such as decreased colon length (p < 0.01) and increased weight loss (p < 0.01; Fig. 11B). Taken together, these results identify Hpx as a potential biomarker for intestinal disease severity.
Figure 11.
Hypoxanthine responses in murine colon tissue submitted to DSS colitis. A, histological imaging of healthy and DSS colitis murine colon tissue. B, relative hypoxanthine levels in healthy versus DSS colitis murine colon tissue (n = 5) and hypoxanthine correlations to disease markers of DSS colitis severity (n = 1). Data are presented as mean ± S.E. (error bars). ***, p < 0.001.
Discussion
Adenine nucleotides are connected to every sequence in a living cell. A functional metabolism relies upon regulating energy deposit and energy withdrawal rates, as unchecked shifts in relative ATP, ADP, and AMP amounts inevitably disrupt the rates of all metabolic reactions, impeding cellular function (20). Perhaps unsurprisingly, original studies using ATP depletion models revealed an important role for high-energy phosphates in the regulation of barrier function (21, 22). Also notable is the regulation of epithelial barrier integrity by low oxygen tension through HIF-mediated adaptive pathways tightly linked to the metabolic demands of the cell (23, 24), as the anoxic state of the lumen submits colonic epithelial cells to a unique, energetically depleting metabolic state of physiological hypoxia (25, 26). In the current work, we profile adenylate energy flux during barrier development and restitution. These studies identify Hpx as a checkpoint metabolite in IEC function and reveal that epithelial cells can utilize Hpx to promote cellular energetics and, in turn, cytoskeletal and barrier function.
Our studies of adenylate metabolism during barrier development revealed a strong capacity for IECs to stabilize ATP early and bolster TAE through steady PCr production. Previous studies in renal epithelial cells have shown that during monolayer maturation, epithelia stabilize HIF-1 to drive glycolysis for energy generation (27). Once confluent, the epithelia switch to β-oxidation of fatty acids as a primary means of energy generation. This metabolic switch appears to coincide with the structural and functional differences between epithelial restitution and barrier formation/maintenance. CKs are highly expressed at or around apical epithelial junctions (9) for functional availability to employ PCr to buffer the high demand for local ATP at the AJC. The energetic buffering activity of CK is fundamental to barrier function, as enzymatic inhibition abolishes barrier recovery following calcium chelation (9). The AJC is one of the most organized actin networks found in nature, being rich in exceptionally active actin filaments that undergo constant remodeling at steady-state (28–31). IECs employ a circumferential actomyosin ring to mediate selective barrier function in health and disease (32), and this ring is a primary target for molecular remodeling by diverse inflammatory stimuli (33, 34). The actomyosin ring utilizes a myosin II cytoskeletal motor to convert ATP hydrolysis into mechanical forces, mediating the static tension and contractility of actin filaments. Given the importance of junction integrity to epithelial homeostasis, apically localized ATPases associated with the AJC seem likely candidates for energy targeting under conditions of metabolic stress. From the work presented herein, it is apparent that the CK system provides a supporting role to store the energy in the form of PCr to buffer the loss of ATP during epithelial stress responses and maintain barrier integrity.
Studies using a calcium depletion/repletion model with parallel metabolite tracking identified Hpx as a critical metabolite for barrier recovery. Elevated Hpx levels after calcium chelation prompted us to test and discover that extracellular Hpx promoted barrier reformation in a dose-responsive manner. At multiple levels, Hpx supplementation provided substantial benefit to epithelial cell function, whereas inhibition of the adenylate flux through Hpx attenuated barrier development. It appears that a significant aspect of the in vitro benefits of Hpx is attributable to enhanced cellular energetics. IECs exhibit a limited capacity for the de novo synthesis of purines and instead rely on salvage pathways for adenylate biosynthesis (35–37). This preference for purine salvage probably accounts for the cells' ability to effectively utilize Hpx to drive their energetic equilibrium toward ATP and PCr. Both hypoxia and chemical ATP depletion crashed the Cr/PCr circuit. The capacity of Hpx to significantly increase PCr in the physiologically relevant hypoxia model had a profoundly protective effect on the Cr/PCr pool, with Cr levels maintaining at normoxic levels. It appears as if the increases in PCr and ATP work to maintain the circuit during energetic stress and, through the action of CK, protect against idle Cr spontaneously degrading into creatinine. Creatine supplementation greatly attenuated the severity of murine colitis (9) and probably plays a key part in the barrier improvement observed in the hypoxia model, highlighting the reliance of IECs on the CK isozyme temporal and spatial shuttle system to link mitochondrial and glycolytic ATP production to sites of ATP consumption.
The fundamental link between the actin cytoskeleton and apical junctional complex was discussed earlier. Of equal significance to IEC function is the central cytoskeletal role in wound healing. Under common physiological conditions, actin filaments “treadmill,” where globular actin (G-actin) is added to the extending end (plus end) of a filamentous actin (F-actin) strand while being removed from the other end (minus end), a process driven by ATP hydrolysis (38). Treadmilling is integral to IEC wound healing (39). After superficial injury, epithelia shouldering the wound utilize their actin cytoskeleton to depolarize and migrate across to close the gap. Cellular migration occurs through F-actin–containing lamellipodia-like projections composed of F-actin microspikes extending from the leading edge (40). The lamellipodia-like growth manifests the balance between G-actin polymerization to F-actin on the plus end and retrograde actin flow (41). When G-actin assembly into F-actin occurs faster than retrograde flow in a particular region, cell contact and protrusion is favored in a distinct direction (42). This dynamic application of the cytoskeleton in IEC migration is energetically demanding, employing nearly 20% of the TAE, by our estimate. In consideration of the exceptional reliance of IEC function on the cytoskeleton, and the fact that Hpx increased the cellular F-actin to G-actin ratio by ∼1.5-fold, it is plausible that the energetic benefit of Hpx supplementation drives much of the improved wound-healing and barrier function abilities through enhanced cytoskeletal capability.
The identification of hypoxanthine as a biomarker for hypoxia has long been known (43) and has recently been extended to colorectal cancer (44), dementia (45), and multiple sclerosis (46). Using a model of murine colitis, we revealed that decreased Hpx during active inflammation corresponds with losses in weight and colon length, both of which are sensitive endpoints of colonic disease severity (47). The correlation of Hpx with a variety of disease states is indicative of the intimate association of Hpx with energy and purine metabolism. Altogether, the in vitro experiments lend insight into the adenylate metabolic flux in IECs. The rapid accumulation of Hpx during the calcium switch model presumably arose from a burst in ATP consumption, followed by the conversion of the resultant ADP into AMP and ATP by adenylate kinase and then rapid shuttling of AMP to Hpx. This observation, in conjunction with a lack of concomitant increases in other adenylate metabolites and UA, reveals that Hpx functions as a checkpoint reservoir to preserve the purine ring during energetic stress. Under such conditions, Hpx is salvaged via the HGPRT-catalyzed addition of activated ribose-5-phosphate (phosphoribosyl pyrophosphate, PRPP), forming IMP. Further reactions convert IMP to AMP, given the availability of GTP, with AMP then shuttled up to ATP and PCr, given the availability of ATP, by the actions of adenylate kinase (AK), ATPase, and CK (Fig. 12). This control of adenylate flux through Hpx provides several opportunities for purine metabolic checkpoints. First, the AMP produced by energetic stress is initially shuttled to Hpx, providing a mechanism to maintain the adenylate energy charge and check against premature AMPK activation by AMP in times of acute ATP consumption, as exemplified in the calcium switch analysis. Under such conditions, AMP accumulation and subsequent AMPK activation does not occur unless the energetic stress is prolonged, and the combination of Hpx salvage to AMP and inability of AK to convert the AMP to ADP, due to a decrease in ATP, causes AMP to accumulate. Second, Hpx functions as an IEC indicator of adenylate metabolite availability through PRPP consumption by purine salvage. PRPP is involved in the first committed step of de novo purine synthesis, with PRPP elevation triggering the pathway (48). As IECs primarily rely on the salvage pathway for purine biosynthesis, decreases in extracellular adenylate availability will incur an intracellular decrease in Hpx and increase in PRPP, signaling a need for purines and initiation of de novo synthesis. Third, the dependence of converting IMP to AMP on GTP provides an intracellular check of guanylate metabolite levels. IMP occupies a crossroads in purine metabolism, where it can either be converted to xanthosine monophosphate by IMP dehydrogenase, the rate-limiting enzyme in de novo GTP synthesis (49), and incorporate into the guanylate pool or begin conversion to AMP by the GTP-dependent adenylosuccinate synthase and incorporate into the adenylate pool. This dependence of adenylosuccinate synthase on GTP ensures sufficient guanylate metabolite levels before contributing purine to the adenylate pool. Collectively, shuttling adenylate metabolism through Hpx provides IECs mechanisms to assess and respond to the need for AMPK activation, de novo purine synthesis, and guanylate metabolites.
Figure 12.
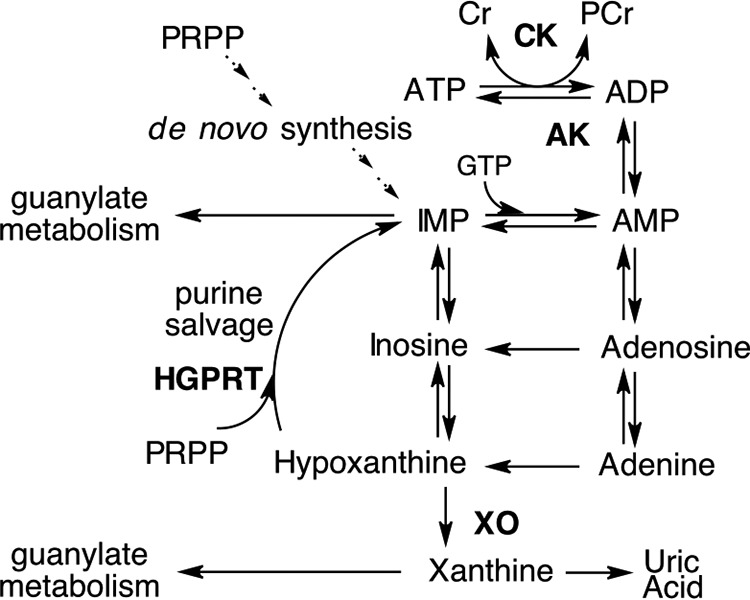
Representation of the adenylate metabolic pathway.
Our analysis of Hpx metabolism in vivo proved insightful. Initially, the levels of PCr in the colon were surprising. Our analysis of energy metabolites revealed that the PCr/ATP ratio of healthy murine colonic tissue approximates and even exceeds that of other high energy demand tissues. For example, NMR analysis of calf muscle biopsies (50) revealed a PCr/ATP ratio of ∼4, whereas the healthy colon PCr/ATP ratio was measured to be ∼12, further displaying the significance of the Cr/PCr circuit in IECs. The AEC functions as an index of cellular energy status (51). The ratio of ATP, ADP, and AMP carries more functional importance than absolute [ATP], as the AEC controls elemental cellular activities (52). The nucleotides themselves are not only directly involved in energetics but also allosterically control various regulatory enzymes to mediate ATP-producing and ATP-consuming processes (53–56), in particular the master intracellular energy sensor and regulator AMPK (17, 18). In general, optimally growing cells across many organisms maintain an AEC between 0.7 and 0.95; it is thought that this range of operation represents a balance between ATP production and consumption, with adverse conditions dropping the AEC and inciting cell death (52, 57–61). Hypoxanthine supplementation significantly improved the murine colonic AEC from 0.52 to 0.73 (p = 0.008), a shift with significant metabolic and therapeutic implications that may serve to influence the difference between inflammatory resolution or sustained disease.
It is intriguing that the energetic benefit provided by Hpx appears dependent upon glycolysis; even more so considering that the cells were highly effective at exploiting Hpx supplementation under hypoxia and that Hpx significantly decreased the rate of oxygen consumption, and thus oxidative phosphorylation, in late restituting/early barrier-forming T84 cells. These in vitro observations are suggestive of a synergistic relationship between hypoxia and Hpx salvage. This hypothesis tracks with what is known of the colonic genetic and metabolic state in vivo. In addition to the transactivation of creatine kinase and creatine transport enzymes under low oxygen tension, HIF induces expression of glucose transport and numerous glycolytic enzymes in an effort to drive ATP production through anaerobic metabolism (62–64). As the intestinal mucosa exhibit preferential sourcing of purine via salvage pathways, and murine Hpx supplementation increased colonic ATP levels nearly 1.6-fold, a picture of a potential stratagem employed emerges in which the hypoxic, colonic epithelia utilize anaerobic glycolysis as an initial ATP investment for Hpx-derived energy production. Altogether, this work demonstrates substantial capacity for Hpx to modulate intestinal mucosal energy balance and barrier function and identifies a compelling, fundamental role for Hpx metabolism in colonic epithelia.
Experimental procedures
Metabolite extraction and HPLC analysis protocols
Cultured cell extractions
Human T84 intestinal epithelial cells were cultured as described previously (65). All extractions were performed on ice, with solvents cooled to, and centrifugations performed at, 4 °C. Transwell permeable support inserts (Costar; 5 cm2, 0.4 μm) containing T84 cells were placed on ice and washed twice with 1 ml of PBS. The insert membrane was removed and submerged in 500 μl of 80% MeOH. The sample was then placed in liquid N2 until frozen, removed and thawed, and vortexed for ∼10 s. The sample was centrifuged for 10 min at 10,000 × g, and the supernatant was transferred to a new Eppendorf tube. Another 500 μl of 80% MeOH was then added to the sample, and the extraction process was repeated twice more. The resulting 1.5 ml of extract was dried via an Eppendorf Vacufuge at room temperature. The dried extract was dissolved in 200 μl of HPLC mobile phase A (details below) and filtered (Whatman Puradisc 4, 0.45 μm, nylon) into vials for HPLC injection.
Tissue extraction
10–40 mg of whole, distal colon was quickly placed in 500 μl of 80% MeOH and flash-frozen to quench metabolic activity. The frozen tissue was stored at −80 °C, if necessary, before continuing on with the metabolite extraction procedure. The extraction procedure for tissue was identical to that described for cultured cells, only the samples were sonicated 3 × 10 s (BioLogics Inc., 150 V/T Ultrasonic Homogenizer, power output ∼20) beforehand.
HPLC protocol
Analyses were performed on an Agilent Technologies 1260 Infinity HPLC using a Phenomenex Luna C18(2) column (100 Å, 150 × 4.6 mm) (mobile phase A, 50 mm KH2PO4, 5 mm tetrabutylammonium bisulfate, pH 6.25; mobile phase B, acetonitrile; column temperature, 30 °C; flow rate, 1 ml/min). Chromatographic separation of the metabolites was performed using a combination of isocratic and gradient methods, including column washing and equilibration periods at the end (0 min, 100% A; 7 min, 100% A; 10 min, 97% A; 18 min, 97% A; 45 min, 86% A; 60 min, 50% A; 80 min, 50% A; 90 min, 100% A; 135 min, 100% A). The metabolites were detected by absorption at wavelengths of 210, 254, and 280 nm (Fig. 1A), with their absorbance spectra and retention times verified by co-injection with authentic standards. Metabolites were quantitated from calibration curves developed from injection of standards ranging from 100 nm to 5 mm.
Calcium switch experiment and transepithelial resistance measurements
Polarized, high-resistance (>1500 ohms·cm2) T84 monolayers on 0.33 cm2 (non-metabolomic) or 5 cm2 (metabolomic) Transwell inserts (Costar; 0.4 μm) were equilibrated for 1 h in HBSS in the case of non-metabolomic analyses and ∼20 h in the case of metabolomic analyses. All experiments were performed at 37 °C, and transepithelial resistance was monitored using a voltohmmeter (World Precision Instruments EVOM). Extracellular Ca2+ was chelated via washing and incubation with Ca2+-free HBSS supplemented with 2 mm EDTA for 5 min, after which the samples were washed into HBSS with normal calcium (1.8 mm) as described previously (10).
Wound-healing assays
T84 cells were plated at 35,000 cells/well on a 96-well ImageLock tissue culture plate (Essen Bioscience Inc.) and incubated in standard conditions until a confluent cell monolayer formed (∼24 h). Precise and reproducible wounds were made in all wells with a WoundMaker (Essen Bioscience Inc.). After wounding, medium was aspirated from each well, and each well was gently washed with PBS before 100 μl of control medium or medium containing 1 mm hypoxanthine was added. Initial images were taken immediately after wounding at 10× using the IncuCyte live-cell imaging (Essen Bioscience Inc.) and then every 2 h over the course of 88 h in culture. Relative wound closure (%) was quantified for every image using the relative wound density metric, a measure of cell density in the wound area relative to the cell density outside of the wound area.
ATP depletion experiments
All experiments were performed at 37 °C, and TER was monitored using a voltohmmeter.
Hypoxia
High-resistance T84 monolayers were incubated in 1% O2 for 40 h before metabolite analyses.
Chemical ATP depletion
High-resistance T84 monolayers were incubated with 20 mm 2-DOG (2 h) and 2-DOG + 2 μm oligomycin A (30 min) before harvesting for metabolite analyses.
Phalloidin treatments and F- to G-actin ratio determinations
T84 cells were plated at 157,500 cells/well on 5-cm2 Transwell permeable supports (Costar; 0.4 μm) and were allowed to adhere (∼24 h). The cells were then washed with 1 ml of PBS before adding control medium or medium supplemented with phalloidin and incubated under standard conditions for 20 h before harvesting for metabolite analyses. Filamentous and globular actin ratios were determined as described by Rasmussen et al. (66). Treated and untreated cells (20 h) were washed with 1 ml of ice-cold PBS before lysis with actin stabilization buffer (200 μl/well of cells; 0.1 m PIPES, pH 6.9, 30% glycerol, 5% DMSO, 1 mm MgSO4, 1 mm EGTA, 1% Triton X-100, 1 mm ATP, and Thermo Fisher Halt protease inhibitor) on ice for 30 min, followed by thorough, repeated pipetting to ensure lysis. A 100-μl aliquot was transferred to a new tube, and the extract was centrifuged at 4 °C for 75 min in a tabletop centrifuge at 16,000 × g. The supernatant containing G-actin was transferred to a new tube, and the remaining pellet containing F-actin was solubilized with 100 μl of actin depolymerization buffer (0.1 m PIPES, pH 6.9, 1 mm MgSO4, 10 mm CaCl2, and 5 μm cytochalasin D). Aliquots (20 μl) of supernatant and pellet fractions were separated on 12% SDS-polyacrylamide gels and Western blotted with anti-β-actin antibody (Abcam ab8227). Signal was detected via KPL LumiGLO chemiluminescent substrate (sera care) and Bio-Rad Universal Hood III. The peak areas of the actin bands were determined using ImageJ to quantitate F- to G-actin ratios.
Oxygen consumption analyses
Human T84 intestinal epithelial cells were cultured as described previously (65). Cells plated on 0.33-cm2 Transwell inserts (Costar; 0.4 μm) were allowed to adhere for ∼24 h before washing with PBS and refreshing medium, initiating hypoxanthine treatment (1 mm), and transferring the insert to an OxoDish OD24 (PreSens). Oxygen consumption (percentage of O2 in medium) was analyzed using an SDR SensorDish reader (Presens) for 0–60 h at 37 °C.
Animal studies
Eight-week-old female C57BL/6 mice were purchased from the Jackson Laboratories. Mice were administered 1 mm hypoxanthine through drinking water supplementation for 2 weeks. Hypoxanthine was solubilized in the drinking water by the dropwise addition of 10 mm NaOH, and then the pH of the water was returned to that of the control (∼7.7) with HCl. The hypoxanthine data presented from DSS-treated mice were obtained from a previously conducted experiment (19). All animal work was approved by the institutional animal care and use committee at the University of Colorado.
Statistical analyses
In vitro data are expressed as mean ± S.D., and in vivo data are shown as mean ± S.E. Statistical analyses were performed in GraphPad Prism (La Jolla, CA) using two-tailed unpaired Student's t test for direct comparisons and one- or two-way analysis of variance with Tukey's test for multiple comparisons. Statistical differences are reported as significant when p < 0.05.
Author contributions
J. S. L. and S. P. C. conceptualization; J. S. L., R. X. W., E. E. A., J. M. L., and K. D. B. resources; J. S. L. and R. X. W. investigation; J. S. L. methodology; J. S. L. and S. P. C. writing-original draft; J. S. L., R. X. W., E. E. A., J. M. L., K. D. B., and S. P. C. writing-review and editing; L. E. G. supervision; S. P. C. funding acquisition.
Supplementary Material
This work was supported by National Institutes of Health Grants DK050189, DK095491, DK104713, and DK103712 and Veterans Affairs Merit Award BX002182. The authors declare that they have no conflicts of interest with the contents of this article. The content is solely the responsibility of the authors and does not necessarily represent the official views of the National Institutes of Health.
This article contains Figs. S1 and S2.
- IEC
- intestinal epithelial cell
- CK
- creatine kinase
- AK
- adenylate kinase
- HGPRT
- hypoxanthine-guanine phosphoribosyltransferase
- XO
- xanthine oxidase
- PRPP
- phosphoribosyl pyrophosphate
- Cr
- creatine
- PCr
- phosphocreatine
- Ino
- inosine
- Hpx
- hypoxanthine
- Xan
- xanthine
- UA
- uric acid
- Ado
- adenosine
- Ad
- adenine
- TER
- transepithelial resistance
- TAE
- total available energy
- Allo
- allopurinol
- PNP
- purine nucleoside phosphorylase
- 2-DOG
- 2-deoxy-d-glucose
- AEC
- adenylate energy charge
- DSS
- dextran sulfate sodium
- HBSS
- Hanks' balanced salt solution.
References
- 1. Capaldo C. T., and Nusrat A. (2015) Claudin switching: physiological plasticity of the tight junction. Semin. Cell Dev. Biol. 42, 22–29 10.1016/j.semcdb.2015.04.003 [DOI] [PubMed] [Google Scholar]
- 2. Hirokawa N., Keller T. C. 3rd, Chasan R., and Mooseker M. S. (1983) Mechanism of brush border contractility studied by the quick-freeze, deep-etch method. J. Cell Biol. 96, 1325–1336 10.1083/jcb.96.5.1325 [DOI] [PMC free article] [PubMed] [Google Scholar]
- 3. Ivanov A. I., Parkos C. A., and Nusrat A. (2010) Cytoskeletal regulation of epithelial barrier function during inflammation. Am. J. Pathol. 177, 512–524 10.2353/ajpath.2010.100168 [DOI] [PMC free article] [PubMed] [Google Scholar]
- 4. Colgan S. P., and Taylor C. T. (2010) Hypoxia: an alarm signal during intestinal inflammation. Nat. Rev. Gastroenterol. Hepatol. 7, 281–287 10.1038/nrgastro.2010.39 [DOI] [PMC free article] [PubMed] [Google Scholar]
- 5. Karhausen J., Haase V. H., and Colgan S. P. (2005) Inflammatory hypoxia: role of hypoxia-inducible factor. Cell Cycle 4, 256–258 [PubMed] [Google Scholar]
- 6. Shepherd A. P. (1982) Metabolic control of intestinal oxygenation and blood flow. Fed. Proc. 41, 2084–2089 [PubMed] [Google Scholar]
- 7. Albenberg L., Esipova T. V., Judge C. P., Bittinger K., Chen J., Laughlin A., Grunberg S., Baldassano R. N., Lewis J. D., Li H., Thom S. R., Bushman F. D., Vinogradov S. A., and Wu G. D. (2014) Correlation between intraluminal oxygen gradient and radial partitioning of intestinal microbiota. Gastroenterology 147, 1055–1063.e8 10.1053/j.gastro.2014.07.020 [DOI] [PMC free article] [PubMed] [Google Scholar]
- 8. Colgan S. P., Campbell E. L., and Kominsky D. J. (2016) Hypoxia and mucosal inflammation. Annu. Rev. Pathol. 11, 77–100 10.1146/annurev-pathol-012615-044231 [DOI] [PMC free article] [PubMed] [Google Scholar]
- 9. Glover L. E., Bowers B. E., Saeedi B., Ehrentraut S. F., Campbell E. L., Bayless A. J., Dobrinskikh E., Kendrick A. A., Kelly C. J., Burgess A., Miller L., Kominsky D. J., Jedlicka P., and Colgan S. P. (2013) Control of creatine metabolism by HIF is an endogenous mechanism of barrier regulation in colitis. Proc. Natl. Acad. Sci. U.S.A. 110, 19820–19825 10.1073/pnas.1302840110 [DOI] [PMC free article] [PubMed] [Google Scholar]
- 10. Synnestvedt K., Furuta G. T., Comerford K. M., Louis N., Karhausen J., Eltzschig H. K., Hansen K. R., Thompson L. F., and Colgan S. P. (2002) Ecto-5′-nucleotidase (CD73) regulation by hypoxia-inducible factor-1 mediates permeability changes in intestinal epithelia. J. Clin. Invest. 110, 993–1002 10.1172/JCI0215337 [DOI] [PMC free article] [PubMed] [Google Scholar]
- 11. Krenitsky T. A., Elion G. B., Strelitz R. A., and Hitchings G. H. (1967) Ribonucleosides of allopurinol and oxoallopurinol Isolation from human urine, enzymatic synthesis, and characterization. J. Biol. Chem. 242, 2675–2682 [PubMed] [Google Scholar]
- 12. Reiter S., Simmonds H. A., Webster D. R., and Watson A. R. (1983) On the metabolism of allopurinol: Formation of allopurinol-1-riboside in purine nucleoside phosphorylase deficiency. Biochem. Pharmacol. 32, 2167–2174 10.1016/0006-2952(83)90222-8 [DOI] [PubMed] [Google Scholar]
- 13. Elion G. B. (1978) Allopurinol and other inhibitors of urate synthesis. In Uric Acid (Kelley W. N., and Weiner I. M., eds) pp. 485–514, Springer, Berlin [Google Scholar]
- 14. Nishida Y., Kamatani N., Tanimoto K., and Akaoka I. (1979) Inhibition of purine nucleoside phosphorylase activity and of T-cell function with allopurinol-riboside. Agents Actions 9, 549–552 10.1007/BF01968126 [DOI] [PubMed] [Google Scholar]
- 15. Matthews J. B., Awtrey C. S., and Madara J. L. (1992) Microfilament-dependent activation of Na+/K+/2Cl-cotransport by cAMP in intestinal epithelial monolayers. J. Clin. Invest. 90, 1608–1613 10.1172/JCI116030 [DOI] [PMC free article] [PubMed] [Google Scholar]
- 16. Culic O., Gruwel M. L., and Schrader J. (1997) Energy turnover of vascular endothelial cells. Am. J. Physiol. 273, C205–C213 10.1152/ajpcell.1997.273.1.C205 [DOI] [PubMed] [Google Scholar]
- 17. Oakhill J. S., Steel R., Chen Z.-P., Scott J. W., Ling N., Tam S., and Kemp B. E. (2011) AMPK is a direct adenylate charge-regulated protein kinase. Science 332, 1433–1435 10.1126/science.1200094 [DOI] [PubMed] [Google Scholar]
- 18. Sun X., and Zhu M.-J. (2017) AMP-activated protein kinase: a therapeutic target in intestinal diseases. Open Biol. 7, 170104 10.1098/rsob.170104 [DOI] [PMC free article] [PubMed] [Google Scholar]
- 19. Lanis J. M., Alexeev E. E., Curtis V. F., Kitzenberg D. A., Kao D. J., Battista K. D., Gerich M. E., Glover L. E., Kominsky D. J., and Colgan S. P. (2017) Tryptophan metabolite activation of the aryl hydrocarbon receptor regulates IL10 receptor expression on intestinal epithelia. Mucosal Immunol. 10, 1133–1144 10.1038/mi.2016.133 [DOI] [PMC free article] [PubMed] [Google Scholar]
- 20. Atkinson D. E. (1977) Adenylate control and the adenylate energy charge. In Cellular Energy Metabolism and its Regulation, pp. 85–107, Academic Press, Inc., San Diego [Google Scholar]
- 21. Bacallao R., Garginkel A., Monke S., Zampighi G., and Mandel L. J. (1994) ATP depletion: a novel method to study junctional properties in epithelial tissues. I. Rearrangement of the actin cytoskeleton. J. Cell Sci. 107, 3301–3313 [DOI] [PubMed] [Google Scholar]
- 22. Tsukamoto T., and Nigam S. K. (1997) Tight junction proteins form large complexes and associate with the cytoskeleton in an ATP depletion model for reversible junction assembly. J. Biol. Chem. 272, 16133–16139 10.1074/jbc.272.26.16133 [DOI] [PubMed] [Google Scholar]
- 23. Glover L. E., and Colgan S. P. (2011) Hypoxia and metabolic factors that influence inflammatory bowel disease pathogenesis. Gastroenterology 140, 1748–1755 10.1053/j.gastro.2011.01.056 [DOI] [PMC free article] [PubMed] [Google Scholar]
- 24. Mastrogiannaki M., Matak P., Keith B., Simon M. C., Vaulont S., and Peyssonnaux C. (2009) HIF-2α, but not HIF-1α, promotes iron absorption in mice. J. Clin. Invest. 119, 1159–1166 10.1172/JCI38499 [DOI] [PMC free article] [PubMed] [Google Scholar]
- 25. Glover L. E., Lee J. S., and Colgan S. P. (2016) Oxygen metabolism and barrier regulation in the intestinal mucosa. J. Clin. Invest. 126, 3680–3688 10.1172/JCI84429 [DOI] [PMC free article] [PubMed] [Google Scholar]
- 26. Zheng L., Kelly C. J., and Colgan S. P. (2015) Physiologic hypoxia and oxygen homeostasis in the healthy intestine. A review in the theme: cellular responses to hypoxia. Am. J. Physiol. Cell Physiol. 309, C350–C360 10.1152/ajpcell.00191.2015 [DOI] [PMC free article] [PubMed] [Google Scholar]
- 27. Aschauer L., Gruber L. N., Pfaller W., Limonciel A., Athersuch T. J., Cavill R., Khan A., Gstraunthaler G., Grillari J., Grillari R., Hewitt P., Leonard M. O., Wilmes A., and Jennings P. (2013) Delineation of the key aspects in the regulation of epithelial monolayer formation. Mol. Cell. Biol. 33, 2535–2550 10.1128/MCB.01435-12 [DOI] [PMC free article] [PubMed] [Google Scholar]
- 28. Yamada S., Pokutta S., Drees F., Weis W. I., and Nelson W. J. (2005) Deconstructing the cadherin-catenin-actin complex. Cell 123, 889–901 10.1016/j.cell.2005.09.020 [DOI] [PMC free article] [PubMed] [Google Scholar]
- 29. Bretscher A. (1991) Microfilament structure and function in the cortical cytoskeleton. Annu. Rev. Cell Biol. 7, 337–374 10.1146/annurev.cb.07.110191.002005 [DOI] [PubMed] [Google Scholar]
- 30. Mooseker M. S. (1985) Organization, chemistry, and assembly of the cytoskeletal apparatus of the intestinal brush border. Annu. Rev. Cell Biol. 1, 209–241 10.1146/annurev.cb.01.110185.001233 [DOI] [PubMed] [Google Scholar]
- 31. Shen L., Weber C. R., and Turner J. R. (2008) The tight junction protein complex undergoes rapid and continuous molecular remodeling at steady state. J. Cell Biol. 181, 683–695 10.1083/jcb.200711165 [DOI] [PMC free article] [PubMed] [Google Scholar]
- 32. Madara J. L., and Pappenheimer J. R. (1987) Structural basis for physiological regulation of paracellular pathways in intestinal epithelia. J. Membr. Biol. 100, 149–164 10.1007/BF02209147 [DOI] [PubMed] [Google Scholar]
- 33. Koch S., and Nusrat A. (2009) Dynamic regulation of epithelial cell fate and barrier function by intercellular junctions. Ann. N.Y. Acad. Sci. 1165, 220–227 10.1111/j.1749-6632.2009.04025.x [DOI] [PubMed] [Google Scholar]
- 34. Turner J. R. (2009) Intestinal mucosal barrier function in health and disease. Nat. Rev. Immunol. 9, 799–809 10.1038/nri2653 [DOI] [PubMed] [Google Scholar]
- 35. Mackinnon A. M., and Deller D. J. (1973) Purine nucleotide biosynthesis in gastrointestinal mucosa. Biochim. Biophys. Acta 319, 1–4 10.1016/0005-2787(73)90034-8 [DOI] [PubMed] [Google Scholar]
- 36. Savaiano D. A., and Clifford A. J. (1981) Adenine, the precursor of nucleic acids in intestinal cells unable to synthesize purines de novo. J. Nutr. 111, 1816–1822 10.1093/jn/111.10.1816 [DOI] [PubMed] [Google Scholar]
- 37. Grimble G. K. (1994) Dietary nucleotides and gut mucosal defence. Gut 35, S46–S51 10.1136/gut.35.1_Suppl.S46 [DOI] [PMC free article] [PubMed] [Google Scholar]
- 38. Juelicher F., Kruse K., Prost J., and Joanny J. F. (2007) Active behavior of the cytoskeleton. Phys. Rep. 449, 3–28 10.1016/j.physrep.2007.02.018 [DOI] [Google Scholar]
- 39. Lotz M. M., Rabinovitz I., and Mercurio A. M. (2000) Intestinal restitution: progression of actin cytoskeleton rearrangements and integrin function in a model of epithelial wound healing. Am. J. Pathol. 156, 985–996 10.1016/S0002-9440(10)64966-8 [DOI] [PMC free article] [PubMed] [Google Scholar]
- 40. Nusrat A., Delp C., and Madara J. L. (1992) Intestinal epithelial restitution: characterization of a cell culture model and mapping of cytoskeletal elements in migrating cells. J. Clin. Invest. 89, 1501–1511 10.1172/JCI115741 [DOI] [PMC free article] [PubMed] [Google Scholar]
- 41. Insall R. H., and Machesky L. M. (2009) Actin dynamics at the leading edge: from simple machinery to complex networks. Dev. Cell 17, 310–322 10.1016/j.devcel.2009.08.012 [DOI] [PubMed] [Google Scholar]
- 42. Forscher P., Lin C. H., and Thompson C. (1992) Novel form of growth cone motility involving site-directed actin filament assembly. Nature 357, 515–518 10.1038/357515a0 [DOI] [PubMed] [Google Scholar]
- 43. Saugstad O. D. (1975) Hypoxanthine as a measurement of hypoxia. Pediatr. Res. 9, 158–161 10.1203/00006450-197504000-00002 [DOI] [PubMed] [Google Scholar]
- 44. Long Y., Sanchez-Espiridion B., Lin M., White L., Mishra L., Raju G. S., Kopetz S., Eng C., Hildebrandt M. A. T., and Chang D. W., Ye Y., Liang D., and Wu X. (2017) Global and targeted serum metabolic profiling of colorectal cancer progression. Cancer 123, 4066–4074 10.1002/cncr.30829 [DOI] [PMC free article] [PubMed] [Google Scholar]
- 45. Chouraki V., Preis S. R., Yang Q., Beiser A., Li S., Larson M. G., Weinstein G., Wang T. J., Gerszten R. E., Vasan R. S., and Seshadri S. (2017) Association of amine biomarkers with incident dementia and Alzheimer's disease in the Framingham Study. Alzheimers Dement. 13, 1327–1336 10.1016/j.jalz.2017.04.009 [DOI] [PMC free article] [PubMed] [Google Scholar]
- 46. Lazzarino G., Amorini A. M., Petzold A., Gasperini C., Ruggieri S., Quartuccio M. E., Lazzarino G., Di Stasio E., and Tavazzi B. (2017) Serum compounds of energy metabolism impairment are related to disability, disease course and neuroimaging in multiple sclerosis. Mol. Neurobiol. 54, 7520–7533 10.1007/s12035-016-0257-9 [DOI] [PubMed] [Google Scholar]
- 47. Gaudio E., Taddei G., Vetuschi A., Sferra R., Frieri G., Ricciardi G., and Caprilli R. (1999) Dextran sulfate sodium (DSS) colitis in rats: clinical, structural, and ultrastructural aspects. Dig. Dis. Sci. 44, 1458–1475 10.1023/A:1026620322859 [DOI] [PubMed] [Google Scholar]
- 48. Moffatt B. A., and Ashihara H. (2002) Purine and pyrimidine nucleotide synthesis and metabolism. Arabidopsis Book 1, e0018 10.1199/tab.0018 [DOI] [PMC free article] [PubMed] [Google Scholar]
- 49. Natsumeda Y., Ohno S., Kawasaki H., Konno Y., Weber G., and Suzuki K. (1990) Two distinct cDNAs for human IMP dehydrogenase. J. Biol. Chem. 265, 5292–5295 [PubMed] [Google Scholar]
- 50. Kemp G. J., Meyerspeer M., and Moser E. (2007) Absolute quantification of phosphorus metabolite concentrations in human muscle in vivo by 31P MRS: a quantitative review. NMR Biomed. 20, 555–565 10.1002/nbm.1192 [DOI] [PubMed] [Google Scholar]
- 51. Atkinson D. E., and Walton G. M. (1967) Adenosine triphosphate conservation in metabolic regulation rat liver citrate cleavage enzyme. J. Biol. Chem. 242, 3239–3241 [PubMed] [Google Scholar]
- 52. De la Fuente I. M., Cortés J. M., Valero E., Desroches M., Rodrigues S., Malaina I., and Martínez L. (2014) On the dynamics of the adenylate energy system: homeorhesis vs homeostasis. PLoS One 9, e108676 10.1371/journal.pone.0108676 [DOI] [PMC free article] [PubMed] [Google Scholar]
- 53. Cohen P. F., and Colman R. F. (1972) Diphosphopyridine nucleotide dependent isocitrate dehydrogenase from pig heart: characterization of active substrate and modes of regulation. Biochemistry 11, 1501–1508 10.1021/bi00758a027 [DOI] [PubMed] [Google Scholar]
- 54. Ercan N., Gannon M. C., and Nuttall F. Q. (1996) Allosteric regulation of liver phosphorylasea: revisited under approximated physiological conditions. Arch. Biochem. Biophys. 328, 255–264 10.1006/abbi.1996.0171 [DOI] [PubMed] [Google Scholar]
- 55. Ercan-Fang N., Gannon M. C., Rath V. L., Treadway J. L., Taylor M. R., and Nuttall F. Q. (2002) Integrated effects of multiple modulators on human liver glycogen phosphorylase a. Am. J. Physiol. Endocrinol. Metab. 283, E29–E37 10.1152/ajpendo.00425.2001 [DOI] [PubMed] [Google Scholar]
- 56. Nelson S. W., Honzatko R. B., and Fromm H. J. (2002) Hybrid tetramers of porcine liver fructose-1, 6-bisphosphatase reveal multiple pathways of allosteric inhibition. J. Biol. Chem. 277, 15539–15545 10.1074/jbc.M112304200 [DOI] [PubMed] [Google Scholar]
- 57. Chapman A. G., Fall L., and Atkinson D. E. (1971) Adenylate energy charge in Escherichia coli during growth and starvation. J. Bacteriol. 108, 1072–1086 [DOI] [PMC free article] [PubMed] [Google Scholar]
- 58. Ball W. J. Jr., and Atkinson D. E. (1975) Adenylate energy charge in Saccharomyces cerevisiae during starvation. J. Bacteriol. 121, 975–982 [DOI] [PMC free article] [PubMed] [Google Scholar]
- 59. Swedes J. S., Sedo R. J., and Atkinson D. E. (1975) Relation of growth and protein synthesis to the adenylate energy charge in an adenine-requiring mutant of Escherichia coli. J. Biol. Chem. 250, 6930–6938 [PubMed] [Google Scholar]
- 60. Chapman A. G., and Atkinson D. E. (1977) Adenine nucleotide concentrations and turnover rates: their correlation with biological activity in bacteria and yeast. Adv. Microb. Physiol. 15, 253–306 10.1016/S0065-2911(08)60318-5 [DOI] [PubMed] [Google Scholar]
- 61. Walker-Simmons M., and Atkinson D. E. (1977) Functional capacities and the adenylate energy charge in Escherichia coli under conditions of nutritional stress. J. Bacteriol. 130, 676–683 [DOI] [PMC free article] [PubMed] [Google Scholar]
- 62. Hu C.-J., Wang L.-Y., Chodosh L. A., Keith B., and Simon M. C. (2003) Differential roles of hypoxia-inducible factor 1α (HIF-1α) and HIF-2α in hypoxic gene regulation. Mol. Cell. Biol. 23, 9361–9374 10.1128/MCB.23.24.9361-9374.2003 [DOI] [PMC free article] [PubMed] [Google Scholar]
- 63. Semenza G. L. (1998) Hypoxia-inducible factor 1: master regulator of O2 homeostasis. Curr. Opin. Genet. Dev. 8, 588–594 10.1016/S0959-437X(98)80016-6 [DOI] [PubMed] [Google Scholar]
- 64. Wenger R. H. (2002) Cellular adaptation to hypoxia: O2-sensing protein hydroxylases, hypoxia-inducible transcription factors, and O2-regulated gene expression. FASEB J. 16, 1151–1162 10.1096/fj.01-0944rev [DOI] [PubMed] [Google Scholar]
- 65. Ibla J. C., Khoury J., Kong T., Robinson A., and Colgan S. P. (2006) Transcriptional repression of Na-K-2Cl cotransporter NKCC1 by hypoxia-inducible factor-1. Am. J. Physiol. Cell Physiol. 291, C282–C289 10.1152/ajpcell.00564.2005 [DOI] [PubMed] [Google Scholar]
- 66. Rasmussen I., Pedersen L. H., Byg L., Suzuki K., Sumimoto H., and Vilhardt F. (2010) Effects of F/G-actin ratio and actin turn-over rate on NADPH oxidase activity in microglia. BMC Immunol. 11, 44 10.1186/1471-2172-11-44 [DOI] [PMC free article] [PubMed] [Google Scholar]
Associated Data
This section collects any data citations, data availability statements, or supplementary materials included in this article.


