Abstract
In many optical imaging applications, it is necessary to correct for aberrations to obtain high quality images. Optical coherence tomography (OCT) provides access to the amplitude and phase of the backscattered optical field for three-dimensional (3D) imaging samples. Computational adaptive optics (CAO) modifies the phase of the OCT data in the spatial frequency domain to correct optical aberrations without using a deformable mirror, as is commonly done in hardware-based adaptive optics (AO). This provides improvement of image quality throughout the 3D volume, enabling imaging across greater depth ranges and in highly aberrated samples. However, the CAO aberration correction has a complicated relation to the imaging pupil and is not a direct measurement of the pupil aberrations. Here we present new methods for recovering the wavefront aberrations directly from the OCT data without the use of hardware adaptive optics. This enables both computational measurement and correction of optical aberrations.
1. INTRODUCTION
Measurement and correction of aberrations is often an important step in obtaining high-resolution images in optical microscopy [1]. In some cases the imaging optics may be imperfect due to physical limitations or design constraints. Additionally, imaging below the surface of biological tissue is complicated by sample-induced aberrations, which arise from the spatially varying refractive index of the tissue. In the case of living or dynamic samples, these aberrations can also be time varying. Therefore, it is necessary to devise a strategy to determine and compensate for the wavefront aberrations to obtain a diffraction-limited image.
Typically this is done using adaptive optics (AO) components, such as a wavefront sensor and deformable mirror, to measure and correct the aberrated optical wavefront. However, these additional hardware components can be expensive and difficult to align and maintain. The hardware aberration correction is only optimized for a particular location within the 3D imaging volume, and calibration error, fitting error, measurement error, and bandwidth error all contribute to the presence of uncorrected aberrations [2].
Alternatively, interferometric detection provides access to both the amplitude and the phase of the backscattered light. Access to this phase information provides computational control of the full complex wavefront, allowing computational image formation based upon models of the imaging experiment. In this way, aberrations can be corrected postacquisition without the need for adaptive optics hardware.
Optical coherence tomography (OCT)measures a broadband interferometric signal to reconstruct the three-dimensional structure of scattering samples from backscattered light [3]. Since its invention, OCT has become an invaluable tool in medicine and biology. It is now the standard of care for retinal imaging and has been applied in various other clinical settings, as well as in nonbiological materials imaging [4]. Computational adaptive optics (CAO) is a computational imaging method that modifies the spatial frequency content of the OCT data to correct for optical aberrations [5–7]. CAO has primarily been used for aberration correction, and it has been demonstrated for imaging of tissues such as in vivo skin and ex vivo brain [8], as well as the living human retina [9–11].
In some cases, it may also be desirable to perform computational aberration measurements. For example, aberration measurements can be used to determine the flaws in an imaging system design, and three-dimensional mapping of aberrations in biological tissue can be used to optimize system parameters [12]. Wavefront measurement can also be medically relevant, as in aberrometry of the human eye [2], and sample-induced aberrations may prove to be a source of contrast for various tissue types.
CAO acts on OCT data in the Fourier domain by a phase-only filter. However, due to the double-pass nature of the OCT imaging experiment, this CAO correction filter does not directly correspond to the aberrations of the imaging pupil. Previous work has attempted to directly compare the CAO correction filter with the true wavefront measurement acquired with a Shack–Hartmann wavefront sensor [13]. However, the complicated relationship between the pupil wavefront and the CAO correction filter was only explored for defocus, leaving aberrations unaddressed.
We have developed new methods for recovering the wavefront aberrations directly from the OCT data itself, without the need for a wavefront sensor or deformable mirror. These methods have been tested in simulation to determine sensitivity to induced aberrations, as well as with cross talk between aberrations. The results are shown to compare favorably with previously published hardware adaptive optics wavefront sensing measurements.
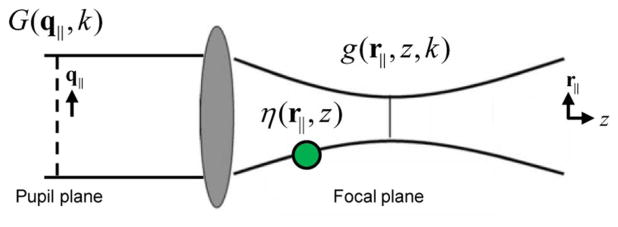
2. COMPUTATIONAL ADAPTIVE OPTICS MODEL
A. OCT Signal Acquisition
The OCT signal is obtained through interference of backscattered light from the sample with a coherent reference beam, providing complex-valued data for each point within the imaged volume. An illustration of the imaging setup is given in Fig. 1. Detailed derivations can be found in [14,15] and are followed closely here. The complex-valued spectral domain OCT signal is acquired as a function of wavenumber, k, at each transverse scan location, (x, y) = (r||). The focus remains fixed at a particular depth, z0. The signal S(r||, k) can then be written as
Fig. 1.
Illustration of the OCT imaging setup. The imaging beam passes through the pupil G(q||, k) and illuminates the sample with field g(r||, z, k). The light is backscattered from the sample η(r||, z) and is collected through the same imaging pupil.
| (1) |
which is the convolution of the system point spread function, h(r||, z, k), with the sample susceptibility, η(r||, z).
The system point spread function is given as
| (2) |
which is the multiplication of the input and output beam profiles, f (r||, z, k) and g(r||, z, k), along with the power spectrum of the laser source, |P(k)|2. In a standard OCT imaging system, the input and output imaging pupils are the same. The beam profile can be described by a plane wave representation, G(q||, k). Therefore, both the input and output beam profiles are given by
| (3) |
where . At the focus z = 0, the beam profile is given by the Fourier transform of the imaging pupil G(q||, k).
The signal representation in Eq. (1) can be simplified by transforming to the spatial frequency domain,
| (4) |
where the (∼) denotes the two-dimensional Fourier transform over the lateral scanning dimension. The transfer function is then given as the transverse convolution, denoted as *||, of the input and output pupil functions in the spatial frequency domain,
| (5) |
The spatial frequency domain representation of the pupil function is
| (6) |
which is the imaging pupil G(q||, k) propagated a distance z away from the focus. Aberrations are modeled as phase variations in the imaging pupil, G(q||, k). This leads to an aberrated system transfer function via the autoconvolution operation, as indicated in Eq. (5).
B. Aberration Correction
In computational adaptive optics, the aberrated system transfer function is corrected by multiplication with a phase-only filter in the spatial frequency domain,
| (7) |
where
| (8) |
and where subscript A indicates the aberrated data, and subscript AC indicates the aberration correction filter and aberration corrected data. The phase term ϕh(q||, k) corresponds to the phase of the aberrated system transfer function. Under the assumption that the deviation from the central wavenumber is not too large, meaning (Δk/kc)2 is negligible [7], the aberration correction filter can be evaluated at the central wavelength and applied at each depth plane, zi, as
| (9) |
where
| (10) |
This filter can be determined through a variety of procedures including image sharpness optimization, the guide-star method, and the split-aperture method [5,16,17]. These are analogous to sensorless AO, guide-star optimization, and the Shack–Hartmann wavefront sensor in hardware AO. In any case, the filter corresponds to the double-pass system transfer function.
3. METHODS FOR WAVEFRONT MEASUREMENT
A generic pupil function has both amplitude and phase,
| (11) |
where the goal of wavefront measurement is to determine the phase aberrations of the imaging pupil, ϕg. Through the CAO aberration correction procedure, the phase ϕh is obtained. The relationship between the pupil and system transfer function is, to within a constant,
| (12) |
where the propagation away from focus in Eq. (6) has been absorbed into the function G(q||, zi). The following sections outline methods for estimating the aberrations of the pupil phase. While the first two methods attempt to estimate ϕg given ϕh, the final method estimates ϕg directly.
A. Asymptotic Method
A computational method termed interferometric synthetic aperture microscopy (ISAM) solves the OCT inverse problem through asymptotic approximations taken near and far from the focus [14,18]. Although these approximations were performed with an unaberrated imaging pupil, it is possible that they may hold for small wavefront aberrations. The asymptotic approximations taken in ISAM allow the complex autoconvolution to be represented as a multiplication of stretched pupil functions,
| (13) |
For the generic pupil function of Equation (11), the corresponding transfer function under the asymptotic approximation is
| (14) |
The relationship between the strength of aberrations is then simply a factor of two.
The phase aberrations are often represented as a weighted sum of Zernike polynomials (see Appendix A). The pupil phase can then be represented by
| (15) |
where cn is the root-mean-square (RMS) variation of each corresponding Zernike aberration at depth zi. Note that for the current model, the pupil aberrations are depth independent, and the propagation away from focus can be approximated using the defocus term Z4. Therefore the depth dependence of cn will be left unnoted for convenience. Also note that the Zernike polynomials exist over the unit circle. Therefore the coordinates are normalized to extend over the limiting pupil defined by the numerical aperture (NA),
| (16) |
The transfer function phase determined using CAO with Zernike weights dn can be similarly represented as
| (17) |
An estimate of the Zernike weights for the pupil aberrations can then be easily obtained as
| (18) |
This provides a simple relationship between the Zernike weights of the CAO phase filter and the imaging pupil.
B. Autoconvolution Method
Instead of relying upon the asymptotic approximations of ISAM, it is possible to retrieve the pupil phase via inverse autoconvolution. In this case, the autoconvolution relationship of Eq. (12) still holds. However, the inverse autoconvolution is complicated by the fact that ϕh is influenced by both the amplitude and phase of G(q||). Therefore, it is necessary include the pupil function amplitude. Gaussian beam illumination is typical for a point scanned OCT system and will be assumed here, although other amplitude profiles could be used. Passing a Gaussian beam through a limiting circular aperture results in the complex pupil function
| (19) |
where circ(s||) is defined as unity for |s||| ≤ 1 and zero elsewhere.
Given the phase ϕh from the CAO correction and a model for |G(q||)|, we can perform an optimization procedure to search for the corresponding pupil phase [19]. The estimated Zernike polynomial weights are calculated as
| (20) |
This finds a pupil function whose autoconvolution has a phase profile that matches the CAO filter.
C. Forward-Model Method
The previous two methods estimate the pupil aberrations from the phase obtained by the CAO image correction; that is to say, ϕg is estimated from ϕh. Alternatively, the pupil aberrations ϕg can be estimated directly by incorporating the forward model into the CAO procedure. In the absence of aberrations, a group of image metrics known as image sharpness are maximized [20–22]. Stated another way, aberrations can only decrease the image sharpness. Therefore, it is possible to determine the appropriate CAO phase filter by maximizing the image sharpness. Here we define the image sharpness operator as
| (21) |
where (*) indicates the complex conjugate. This operator calculates the sum of the intensity squared across the image.
Typically, the image sharpness is optimized by searching over possible phases ϕh, in accordance with Eqs. (9) and (10). However, it is possible to generate the CAO phase filter via the forward model as
| (22) |
The image sharpness optimization can then be performed by searching over possible phases ϕg, providing a direct estimate of the imaging pupil phase
| (23) |
where ℱ−1[] indicates the inverse Fourier transform to the spatial domain.
4. SIMULATION AND RESULTS
To determine the effectiveness of each method, OCT data was simulated, allowing for the introduction of arbitrary aberrations into the imaging pupil. The data used here were generated using the more exact model of Eqs. (21) and (29) from [14]. Simulated data were generated on a densely spaced 3D grid, then resampled by a noninteger multiple to a coarser grid to mimic data acquisition. The simulated OCT experiments used a Gaussian spectrum with 1 μm central wavelength and 100 nm bandwidth, and the transverse imaging area was 128 μm × 128 μm acquired with a 1 μm step size. The NA was 0.1, matching that of previous computational OCT experiments [5,23]. The imaging pupil was constructed following Eq. (19), with aberrations introduced into the pupil phase using weighted Zernike polynomial functions,
| (24) |
Here cn was defined in units of micrometers (μm) corresponding to optical path length, and the variation in wavenumber was explicitly accounted for in the simulation. The image sharpness optimization and inverse autoconvolution procedures were performed on an Intel Core i7-5960X with 32 GB of RAM using the MATLAB 2016a Optimization Toolbox. The optimization time was approximately 0.59, 3.75, and 2.07 s for the asymptotic, autoconvolution, and forward model methods, respectively.
The following sections outline a series of simulated experiments in which the sensitivity, cross talk, and other characteristics of the above methods are determined.
A. Sensitivity and Cross Talk
To determine the sensitivity to each aberration term, as well as the cross talk between terms, single aberrations were applied in the imaging pupil with increasing RMS. The imaging sample consisted of in-focus point-scatterers with unit susceptibility, such that the induced polarization was equal to the incident field (see [24], Section 2.3). Aberrations up to 4th order were applied (excluding tip/tilt and defocus) with RMS increasing from zero to 0.6 rad at the central wavelength. The applied aberrations were then estimated from the OCT data using each of the three methods detailed in Section 3.
For the asymptotic and forward model methods, the wavefront was estimated by correcting up to 4th order Zernike terms (excluding tip/tilt). However, as a result of the autoconvolution operation, the phase of the system transfer function is more rapidly varying than that of the imaging pupil. This means that while ϕg is described accurately by Zernike terms up to 4th order, ϕh may not be. The transfer function phase is represented more accurately as more Zernike modes are used. It was experimentally determined that the CAO optimization performed as the first step in the autoconvolution method must include up to at least 6th order Zernike modes. This provides an approximation of ϕh that is sufficiently accurate for performing the inverse autoconvolution operation to 4th order imaging pupil aberrations, and that was used for the results presented here.
The sensitivity was defined as the slope of the linear least-squares fit between the estimated weights, ĉn, corresponding to applied weights, cn. The cross talk was defined as the normalized RMS variation in all aberration terms other than the applied term,
| (25) |
evaluated at the maximum applied aberration. A perfect estimate would result in sensitivity equal to one and cross talk equal to zero [25].
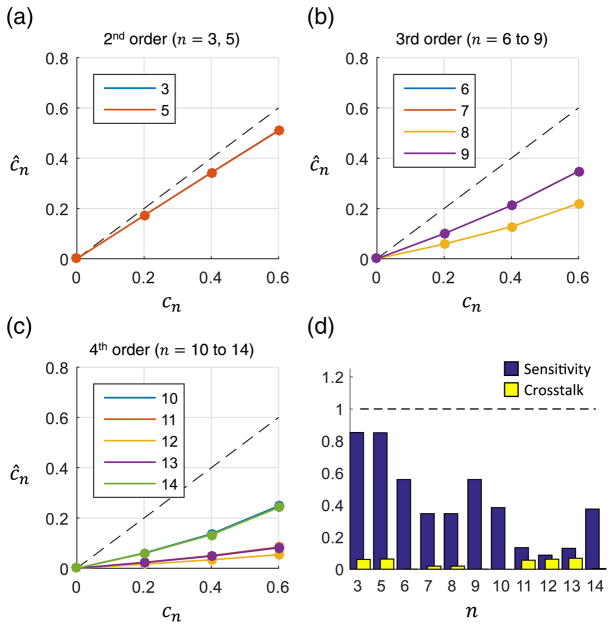
Aberration estimates obtained using the asymptotic approximation are shown in Fig. 2. In Figs. 2(a)–2(c), the estimated weights are given for 2nd, 3rd, and 4th orders, respectively. An ideal estimate is indicated by the dashed line for reference. Notice that certain Zernike modes are nearly identical, differing only in their rotation (e.g., astigmatism terms n = 3, 5). Therefore the estimates for these terms are very close to one another. The sensitivity and cross talk for each applied term are shown in Fig. 2(d). There is reasonable performance only for 2nd order aberrations, indicating that the asymptotic approximation is not valid at higher orders. This is not unexpected, as the approximations used in this method were developed in the absence of phase aberrations.
Fig. 2.
Measurement of single aberrations using the asymptotic method. (a)–(c) The applied and estimated Zernike weights are shown for 2nd, 3rd, and 4th order aberrations, respectively. The dotted line corresponds to a perfect estimate. All Zernike weights are in radians. (d) The sensitivity and cross talk were calculated for each applied Zernike term.
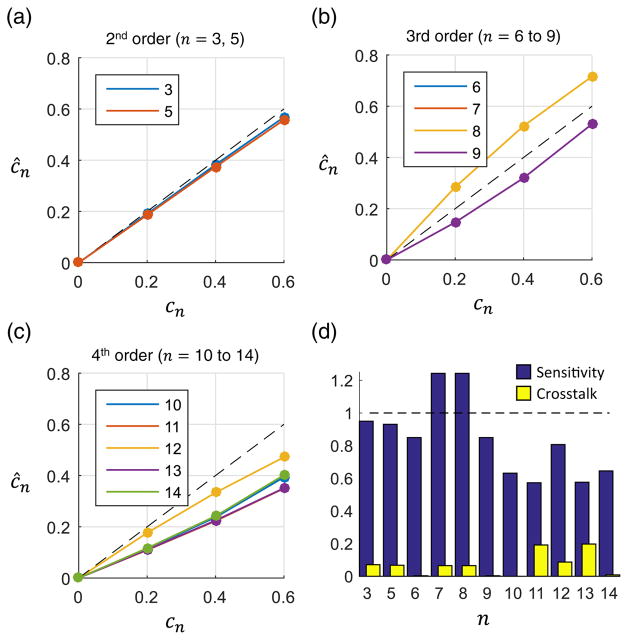
The inverse autoconvolution method showed superior sensitivity at all orders when compared with the asymptotic method. The aberration estimates and corresponding metrics are given in Fig. 3. The sensitivity at 2nd order was 0.95 and remained greater than 0.5 through 4th order. For coma (terms n = 7, 8), the method overestimated the applied aberration, but the sensitivity remained within 0.25 of the ideal case.
Fig. 3.
Measurement of single aberrations using the autoconvolution method. (a)–(c) The applied and estimated Zernike weights are shown for 2nd, 3rd, and 4th order aberrations, respectively. The dotted line corresponds to a perfect estimate. All Zernike weights are in radians. (d) The sensitivity and cross talk were calculated for each applied Zernike term.
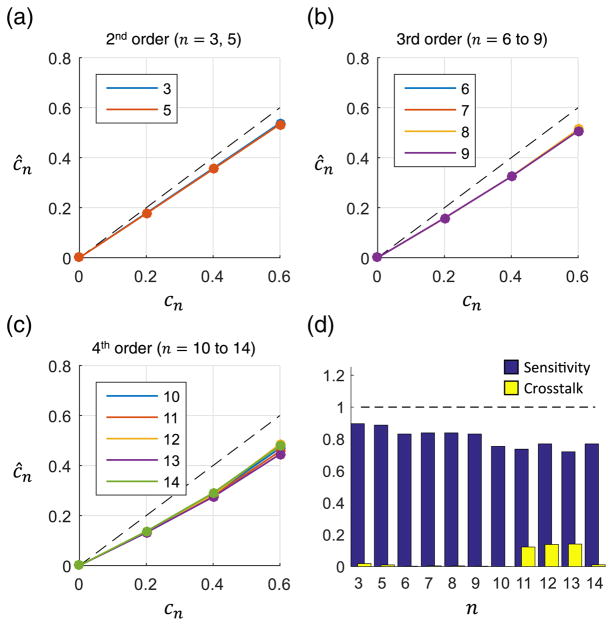
Of the three proposed methods, the forward model method had the most consistent performance across all orders as demonstrated in Fig. 4. Additionally, the method did not overestimate any aberrations. The average sensitivity across all terms was 0.81, while the average cross talk was 0.04.
Fig. 4.
Measurement of single aberrations using the forward model method. (a)–(c) The applied and estimated Zernike weights are shown for 2nd, 3rd, and 4th order aberrations, respectively. The dotted line corresponds to a perfect estimate. All Zernike weights are in radians. (d) The sensitivity and cross talk were calculated for each applied Zernike term.
B. Impact of Signal-to-Noise Ratio
In a realistic imaging scenario, the data will be corrupted by noise. For OCT, this can be modeled by additive complex white Gaussian noise [14,26]. The simulations and measurements of the previous section were repeated with peak signal-to-noise ratio (SNR) varying from 50 dB down to 20 dB, where the peak SNR was defined as
| (26) |
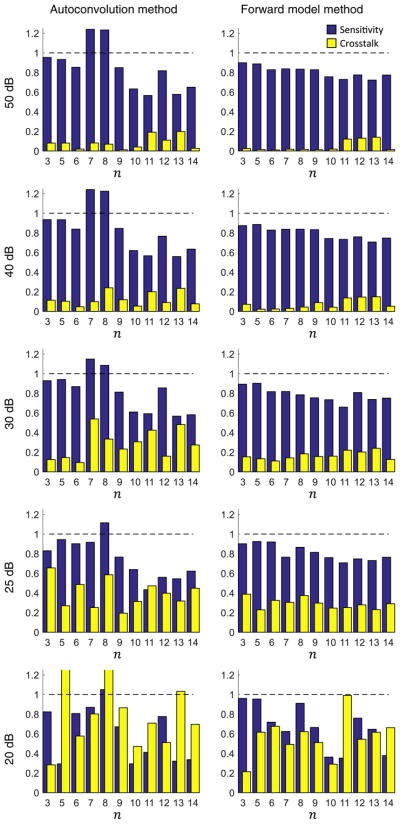
The resulting sensitivity and cross talk for the autoconvolution and forward model methods are shown in Fig. 5. As the asymptotic method is not sensitive to higher orders, the results are not included. Although the computational wavefront measurement fails below a certain SNR threshold, it is important to note that the computational image correction still succeeds. This is in accordance with previous results [27].
Fig. 5.
Performance of the autoconvolution and forward model methods at each Zernike mode for decreasing peak SNR. The forward model method shows superior performance in noisy conditions.
At high SNR, both methods performed similarly to the noise free case. However, as the SNR decreases, the tails and sidelobes of the point spread function became buried in the noise. Therefore, much of the point spread function shape can be obscured. The performance of the autoconvolution method began to suffer with peak SNR of 30 dB, where cross talk approached the sensitivity for several aberration terms. At 20 dB, the results became unstable with estimated RMS far beyond that which was applied.
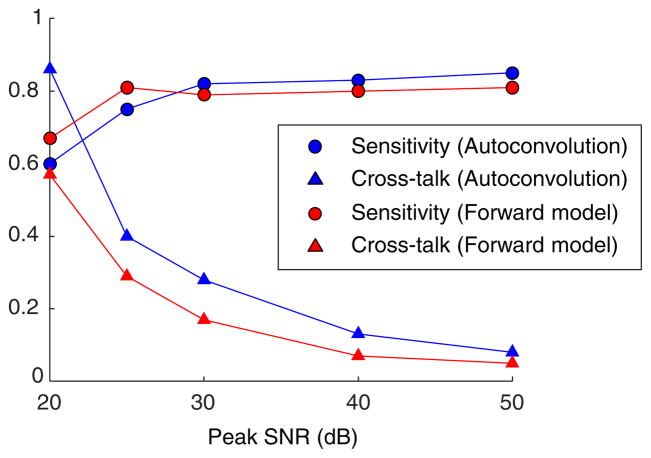
The performance of the forward model method remained strong down to 25 dB peak SNR. Here the average sensitivity was 0.81, and average cross talk was 0.29. A comparison between the average sensitivity and cross talk for the autoconvolution and forward model methods is given in Fig. 6. A comparable experiment was previously performed using a deformable mirror and Shack–Hartmann wavefront sensor [25]. The average sensitivity and cross talk were 0.71 and 0.32, respectively, and only included aberrations up to 3rd order. Considering this, the performance of the forward model method was comparable or superior to that of direct hardware measurement.
Fig. 6.
Average sensitivity and cross talk versus peak SNR for the autoconvolution and forward model methods. While the methods have similar average sensitivity, the cross talk for the forward model method is notably superior at low SNR.
C. Multiple Simultaneous Aberrations
Additional simulated experiments were performed with multiple aberrations applied simultaneously in the pupil plane. The aberration weights were randomly generated to have a total wavefront RMS of zero, 0.2, 0.4, and 0.6 rad, with lower order Zernike terms allowed to take on greater weights. This was done to mimic common imaging scenarios where the magnitude of lower order aberrations is significantly greater than that of higher order aberrations, such as imaging the human retina [28,29]. The total wavefront RMS is defined as
| (27) |
A total of 10 random wavefronts were generated at each RMS, and OCT data were simulated for each wavefront. The noise level was set to 50 dB peak SNR. Due to its consistent performance across all orders and resilience to noise, the forward model method was used to estimate the applied wavefronts.
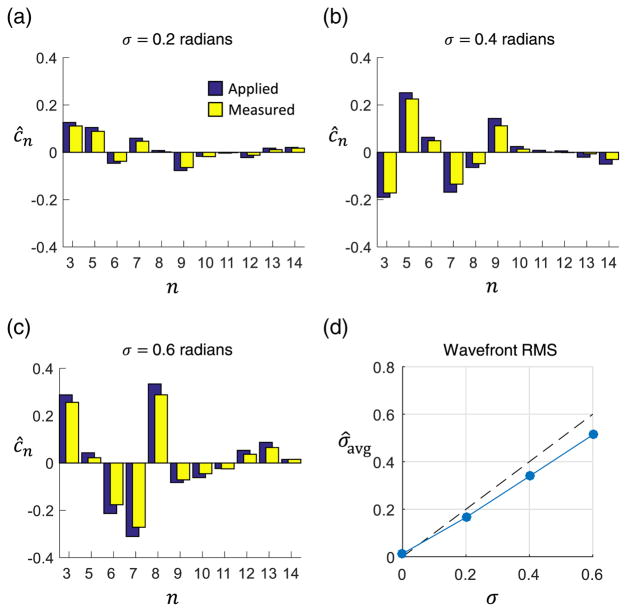
Example wavefronts and the corresponding computational measurements are shown in Fig. 7. As seen in Figs. 7(a)–7(c), the measurement closely tracked the applied wavefront. For each wavefront, the total RMS of the measured aberrations was calculated. The average measured RMS across each set of 10 wavefronts is shown in Fig. 7(d). The sensitivity was 0.85, calculated as the least squares slope of the total measured RMS as a function of applied RMS.
Fig. 7.
Measurement of multiple simultaneous aberrations using the forward model method. (a)–(c) The applied and measured Zernike weights are shown for a randomly generated wavefront at 0.2, 0.4, and 0.6 radians RMS, respectively. (d) Average wavefront RMS measured over 10 randomly generated wavefronts. The corresponding sensitivity to total wavefront RMS was 0.85.
As a demonstration of volumetric aberration measurement and correction, a 3D OCT dataset was generated with 50 randomly located point scatterers. The pupil aberrations were given by a randomly generated wavefront of 0.6 rad total RMS. The forward model method was used to estimate and correct the aberrations throughout the imaging volume. Volume renderings of the aberrated OCT data and CAO corrected data are shown in Fig. 8(a), along with corresponding en face images taken 150 μm below focus shown in Fig. 8(b). The CAO image demonstrates correction of the point spread function with increased signal amplitude and resolution, and 3.9 times improvement in image sharpness [see Eq. (21)]. While only four points are resolved the OCT image, a previously obscured fifth point is revealed following wavefront correction (white arrow). The applied and measured aberration weights are given in Fig. 8(c), showing the mean and standard deviation of the wavefront measurement across all 50 scatterers. The average sensitivity to the total wavefront RMS was 0.89, giving an approximate Strehl ratio of 0.94 [30].
Fig. 8.
Measurement and correction of multiple aberrations in a 3D imaging volume. (a) Volume rendering of aberrated (OCT) and corrected (CAO) data. The dimensions of the volume are 128 μm × 128 μm × 640 μm. (b) En face images are taken from 150 μm below focus. Following CAO, the point spread function is improved and a previously obscured fifth point is revealed (white arrow). (c) Applied and measured aberrations at each point scatterer throughout the volume. The error bars correspond to the standard deviation across all 50 measurements. Zernike weights are in radians.
5. CONCLUSIONS
Using the proposed methods, aberrations can be both measured and corrected computationally directly from the OCT data without the use of hardware adaptive optics components. Our methods were tested in simulation, and the performance compares favorably to that of previously published wavefront sensor measurements in optical microscopy. Based on its simplicity, consistency, and robustness to noise, the forward model method is recommended for use in future experiments.
The results presented here only considered pupil aberrations. However, these methods could also be used to determine the local aberrations introduced by the imaged sample. This could provide aberration corrected images as well as a 3D aberration map, revealing the effect of the tissue on the imaging beam. This is interesting from a scientific perspective, since the mapping of optical aberrations can be used to optimize imaging system parameters such as choice of optics or scanning region. For biomedical applications, aberration measurement could be used as a new form of image contrast between tissue types that may otherwise appear similar under OCT imaging. In general, where hardware wavefront measurement has found useful application, CAO is a computational alternative for simultaneous wavefront measurement and correction.
Acknowledgments
Funding. National Institutes of Health (NIH) (R01 CA213149, R01 EB013723, R01 EB023232); Air Force Office of Scientific Research (AFOSR) (FA9550-17-1-0387); Beckman Institute for Advanced Science and Technology, University of Illinois, Urbana-Champaign; University of Illinois at Urbana-Champaign (UIUC).
The authors thank Darold Spillman for technical support. F. A. S. was supported in part by an ECE Yang Fellowship, and A. J. B. was supported in part by a Beckman Graduate Fellowship. Additional information can be found at http://biophotonics.illinois.edu.
APPENDIX A: TABLE OF ZERNIKE POLYNOMIALS
A list of the Zernike polynomial indices used in this publication is included in Table 1 to aid the reader. The polynomials are indexed according to the ANSI Z80.28 standard [31]. The functions are given here in polar coordinates but can also be written in rectangular coordinates [32]. Each polynomial was normalized by its RMS to satisfy the condition
Table 1.
Zernike Polynomial Indices, RMS Normalization Factors, and Common Names
| n | Zn(r,θ) | RMS | Name | ||
|---|---|---|---|---|---|
| 2nd order | 3 | r2 sin(2θ) |
|
astigmatism | |
| 4 | 2r2 – 1 |
|
defocus | ||
| 5 | r2 cos(2θ) |
|
astigmatism | ||
|
| |||||
| 3rd order | 6 | r3 sin(3θ) |
|
trefoil | |
| 7 | (3r3 – 2r) sin(θ) |
|
coma | ||
| 8 | (3r3 – 2r) cos(θ) |
|
coma | ||
| 9 | r3 sin(3θ) |
|
trefoil | ||
|
| |||||
| 4th order | 10 | r4 sin(4θ) |
|
quadrafoil | |
| 11 | (4r4 – 3r2) sin(2θ) |
|
secondary astigmatism | ||
| 12 | 6r4 – 6r2 + 1 |
|
spherical | ||
| 13 | (4r4 – 3r2) cos(2θ) |
|
secondary astigmatism | ||
| 14 | r4 cos(4θ) |
|
quatrefoil | ||
| (A1) |
Footnotes
OCIS codes: (100.5090) Phase-only filters; (110.3175) Interferometric imaging; (110.3200) Inverse scattering; (110.4500) Optical coherence tomography; (110.1758) Computational imaging.
References
- 1.Booth MJ. Adaptive optical microscopy: the ongoing quest for a perfect image. Light Sci Appl. 2014;3:e165. [Google Scholar]
- 2.Porter J, Queener H, Lin J, Thorn K, Awwal A, editors. Adaptive Optics for Vision Science. Wiley; 2006. [Google Scholar]
- 3.Huang D, Swanson EA, Lin CP, Schuman JS, Stinson WG, Chang W, Hee MR, Flotte T, Gregory K, Puliafito CA, Fujimoto JG. Optical coherence tomography. Science. 1991;254:1178–1181. doi: 10.1126/science.1957169. [DOI] [PMC free article] [PubMed] [Google Scholar]
- 4.Fujimoto JG, Swanson EA. The development, commercialization, and impact of optical coherence tomography. Invest Ophthalmol Visual Sci. 2016;57:OCT1–OCT13. doi: 10.1167/iovs.16-19963. [DOI] [PMC free article] [PubMed] [Google Scholar]
- 5.Adie SG, Graf BW, Ahmad A, Carney PS, Boppart SA. Computational adaptive optics for broadband optical interferometric tomography of biological tissue. Proc Natl Acad Sci USA. 2012;109:7175–7180. doi: 10.1073/pnas.1121193109. [DOI] [PMC free article] [PubMed] [Google Scholar]
- 6.South FA, Liu YZ, Carney PS, Boppart SA. Computed optical interferometric imaging: methods, achievements, and challenges. IEEE J Sel Top Quantum Electron. 2016;22:186–196. doi: 10.1109/JSTQE.2015.2493962. [DOI] [PMC free article] [PubMed] [Google Scholar]
- 7.Liu YZ, South FA, Xu Y, Carney PS, Boppart SA. Computational optical coherence tomography. Biomed Opt Express. 2017;8:1549–1574. doi: 10.1364/BOE.8.001549. [DOI] [PMC free article] [PubMed] [Google Scholar]
- 8.Liu YZ, Shemonski ND, Adie SG, Ahmad A, Bower AJ, Carney PS, Boppart SA. Computed optical interferometric tomography for high-speed volumetric cellular imaging. Biomed Opt Express. 2014;5:2988–3000. doi: 10.1364/BOE.5.002988. [DOI] [PMC free article] [PubMed] [Google Scholar]
- 9.Shemonski ND, South FA, Liu YZ, Adie SG, Carney PS, Boppart SA. Computational high-resolution optical imaging of the living human retina. Nat Photonics. 2015;9:440–443. doi: 10.1038/NPHOTON.2015.102. [DOI] [PMC free article] [PubMed] [Google Scholar]
- 10.Hillmann D, Spahr H, Hain C, Sudkamp H, Franke G, Pfäffle C, Winter C, Hüttmann G. Aberration-free volumetric high-speed imaging of in vivo retina. Sci Rep. 2016;6:35209. doi: 10.1038/srep35209. [DOI] [PMC free article] [PubMed] [Google Scholar]
- 11.Ginner L, Kumar A, Fechtig D, Wurster LM, Salas M, Pircher M, Leitgeb RA. Noniterative digital aberration correction for cellular resolution retinal optical coherence tomography in vivo. Optica. 2017;4:924–931. [Google Scholar]
- 12.Zeng J, Mahou P, Schanne-Klein MC, Beaurepaire E, Débarre D. 3D resolved mapping of optical aberrations in thick tissues. Biomed Opt Express. 2012;3:1898–1913. doi: 10.1364/BOE.3.001898. [DOI] [PMC free article] [PubMed] [Google Scholar]
- 13.Kumar A, Wurster LM, Salas M, Ginner L, Drexler W, Leitgeb RA. In-vivo digital wavefront sensing using swept source OCT. Biomed Opt Express. 2017;8:3369–3382. doi: 10.1364/BOE.8.003369. [DOI] [PMC free article] [PubMed] [Google Scholar]
- 14.Davis BJ, Schlachter SC, Marks DL, Ralston TS, Boppart SA, Carney PS. Nonparaxial vector-field modeling of optical coherence tomography and interferometric synthetic aperture microscopy. J Opt Soc Am A. 2007;24:2527–2542. doi: 10.1364/josaa.24.002527. [DOI] [PubMed] [Google Scholar]
- 15.Davis BJ, Marks DL, Ralston TS, Carney PS, Boppart SA. Interferometric synthetic aperture microscopy: computed imaging for scanned coherent microscopy. Sensors. 2008;8:3903–3931. doi: 10.3390/s8063903. [DOI] [PMC free article] [PubMed] [Google Scholar]
- 16.Adie SG, Shemonski ND, Graf BW, Ahmad A, Carney PS, Boppart SA. Guide-star-based computational adaptive optics for broadband interferometric tomography. Appl Phys Lett. 2012;101:221117. doi: 10.1063/1.4768778. [DOI] [PMC free article] [PubMed] [Google Scholar]
- 17.Kumar A, Drexler W, Leitgeb RA. Subaperture correlation based digital adaptive optics for full field optical coherence tomography. Opt Express. 2013;21:10850–10866. doi: 10.1364/OE.21.010850. [DOI] [PubMed] [Google Scholar]
- 18.Ralston TS, Marks DL, Carney PS, Boppart SA. Interferometric synthetic aperture microscopy. Nat Phys. 2007;3:129–134. doi: 10.1038/nphys514. [DOI] [PMC free article] [PubMed] [Google Scholar]
- 19.Anzengruber SW, Bürger S, Hofmann B, Steinmeyer G. Variational regularization of complex deautoconvolution and phase retrieval in ultrashort laser pulse characterization. Inverse Probl. 2016;32:35002. [Google Scholar]
- 20.Muller RA, Buffington A. Real-time correction of atmospherically degraded telescope images through image sharpening. J Opt Soc Am. 1974;64:1200–1210. [Google Scholar]
- 21.Paxman RG, Marron JC. Aberration correction of speckled imagery with an image-sharpness criterion. Proc SPIE Stat Opt. 1988;976:37–47. [Google Scholar]
- 22.Fienup JR, Miller JJ. Aberration correction by maximizing generalized sharpness metrics. J Opt Soc Am A. 2003;20:609–620. doi: 10.1364/josaa.20.000609. [DOI] [PubMed] [Google Scholar]
- 23.Ahmad A, Shemonski ND, Adie SG, Kim H-S, Hwu W-mW, Carney PS, Boppart SA. Real-time in vivo computed optical interferometric tomography. Nat Photonics. 2013;7:444–448. doi: 10.1038/nphoton.2013.71. [DOI] [PMC free article] [PubMed] [Google Scholar]
- 24.Born M, Wolf E. Principles of Optics. 7. Cambridge University; 1999. [Google Scholar]
- 25.Rahman SA, Booth MJ. Direct wavefront sensing in adaptive optical microscopy using backscattered light. Appl Opt. 2013;52:5523–5532. doi: 10.1364/AO.52.005523. [DOI] [PubMed] [Google Scholar]
- 26.Leitgeb R, Hitzenberger CK, Fercher AF. Performance of Fourier domain versus time domain optical coherence tomography. Opt Express. 2003;11:889–894. doi: 10.1364/oe.11.000889. [DOI] [PubMed] [Google Scholar]
- 27.Shemonski ND, Adie SG, Liu YZ, South FA, Carney PS, Boppart SA. Stability in computed optical interferometric tomography (Part I): stability requirements. Opt Express. 2014;22:19183–19197. doi: 10.1364/OE.22.019183. [DOI] [PMC free article] [PubMed] [Google Scholar]
- 28.Liang J, Williams DR. Aberrations and retinal image quality of the normal human eye. J Opt Soc Am A. 1997;14:2873–2883. doi: 10.1364/josaa.14.002873. [DOI] [PubMed] [Google Scholar]
- 29.Francisco Castejón-Mochón J, López-Gil N, Benito A, Artal P. Ocular wave-front aberration statistics in a normal young population. Vis Res. 2002;42:1611–1617. doi: 10.1016/s0042-6989(02)00085-8. [DOI] [PubMed] [Google Scholar]
- 30.Mahajan VN. Strehl ratio for primary aberrations in terms of their aberration variance. J Opt Soc Am A. 1983;73:860–861. [Google Scholar]
- 31.ANSI Z80.28. Methods of reporting optical aberrations of eyes. 2004 [Google Scholar]
- 32.Lakshminarayanan V, Fleck A. Zernike polynomials: a guide. J Mod Opt. 2011;58:1678. [Google Scholar]


