

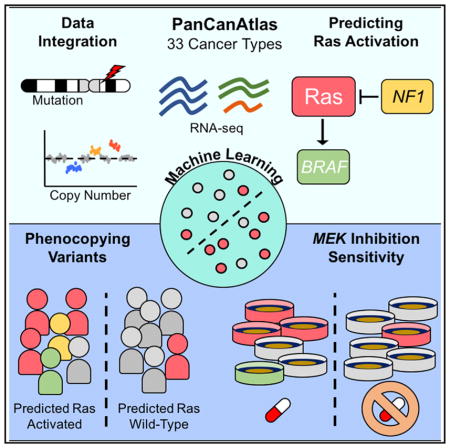
SUMMARY
Precision oncology uses genomic evidence to match patients with treatment but often fails to identify all patients who may respond. The transcriptome of these “hidden responders” may reveal responsive molecular states. We describe and evaluate a machine-learning approach to classify aberrant pathway activity in tumors, which may aid in hidden responder identification. The algorithm integrates RNA-seq, copy number, and mutations from 33 different cancer types across The Cancer Genome Atlas (TCGA) PanCanAtlas project to predict aberrant molecular states in tumors. Applied to the Ras pathway, the method detects Ras activation across cancer types and identifies phenocopying variants. The model, trained on human tumors, can predict response to MEK inhibitors in wild-type Ras cell lines. We also present data that suggest that multiple hits in the Ras pathway confer increased Ras activity. The transcriptome is underused in precision oncology and, combined with machine learning, can aid in the identification of hidden responders.
In Brief
Way et al. develop a machine-learning approach using PanCanAtlas data to detect Ras activation in cancer. Integrating mutation, copy number, and expression data, the authors show that their method detects Ras-activating variants in tumors and sensitivity to MEK inhibitors in cell lines.
INTRODUCTION
Precision oncology matches cancer patients to specific therapies based on genomic evidence, but it has benefited only a relatively low proportion of cancer patients to date (Prasad et al., 2016). While clinically promising, precision oncology lacks complete and accurate matching strategies and fails to identify many patients that could be matched using alternative approaches (Kumar-Sinha and Chinnaiyan, 2018). Cataloging transcriptome measurements across thousands of tumors enables a systems-biology perspective into the downstream consequences of molecular perturbation. Detecting these perturbations using transcriptomic states can improve precision oncology efforts toward more accurate and complete pairing of patients to effective treatments (Cieślik and Chinnaiyan, 2018).
In the largest uniformly processed cancer dataset to date, The Cancer Genome Atlas (TCGA) PanCancerAtlas has released multi-platform genomic measurements across thousands of tumors from 33 different cancer types (Weinstein et al., 2013). With this scale of data, researchers can build and evaluate statistical models that stratify tumors based on aberrant gene and pathway function. Previously, strategies have been explored using expression signatures to stratify patients (Bild et al., 2006). Some strategies have used data from individual cancer types. For example, gene expression signatures in colon adenocarcinoma (COAD) and glioblastoma (GBM) stratified tumors with aberrant KRAS and NF1 function, respectively (Guinney et al., 2014; Way et al., 2017). Furthermore, data integration approaches incorporating pathway connectivity, including PARADIGM, are used to characterize pathway activity and infer gain- or loss-of-function events (Vaske et al., 2010; Ng et al., 2012; Sokolov et al., 2016). An unsupervised approach decomposing gene expression states in cell lines to map pathway activity has been proposed (Kim et al., 2017). Here, we introduce an elastic net penalized logistic regression classifier to learn signatures of gene or pathway alterations from gene expression assays of tumor biopsies across cancer types. We applied our method across cancer types to learn an independent, pan-cancer signature of pathway aberration. Our method can be used to identify phenocopying variants and requires only gene expression data for inference on new data. We apply our method to detect Ras pathway activation pan-cancer.
The Ras pathway is frequently altered in many different cancer types (De Luca et al., 2012). When the pathway is activated, often by gain-of-function KRAS, NRAS, or HRAS mutations or through NF1 loss-of-function events, cells increase their translational output, and unchecked cellular proliferation occurs (McCormick, 1989; Xu et al., 1990). Certain cancer types, such as pancreatic adenocarcinoma (PAAD), skin cutaneous melanoma (SKCM), thyroid carcinoma (THCA), lung adenocarcinoma (LUAD), and COAD are known to be largely driven by mutations in Ras pathway genes (Goretzki et al., 1992; Omholt et al., 2003; Pao et al., 2005; di Magliano and Logsdon, 2013). Additionally, mutations in the Ras pathway have been observed to be early events driving tumorigenesis and have also been associated with poor survival and treatment resistance (Garcia-Rostan et al., 2003; Vauthey et al., 2013; Dinu et al., 2014; Hsu et al., 2016). Because the Ras pathway is ubiquitously misregulated, developing specific therapeutic targets is one of the National Cancer Institute’s key initiatives. However, Ras is also notoriously difficult to therapeutically target, and accurate detection of its malfunction is paramount (Stephen et al., 2014).
The most direct method of assessing Ras activation is by targeted sequencing of Ras. However, these methods would fail to detect unknown variants in other genes that phenocopy Ras-activating mutations. Detecting such tumors may enable more patients to be targeted therapeutically. In the present study, we describe our machine-learning approach that integrates bulk RNA sequencing (RNA-seq), copy number, and mutation data from the PanCanAtlas. We apply the method to Ras genes and demonstrate that our method can detect Ras activation pan-cancer. The classifier also identifies NF1 phenocopying events in TCGA and prioritizes Ras wild-type cell lines that respond to MEK inhibitors. Manually curated oncogenic variants in Ras pathway genes were assigned higher classification scores than variants with unknown significance. Our method can be applied to other cancer-associated genes and pathways as well. For example, the DNA Damage Repair PanCanAtlas analysis working group (AWG) applied this approach to detecting TP53 inactivation (Knijnenburg et al., 2018).
RESULTS
Machine-Learning Models to Predict Pathway Activity
We developed a machine-learning approach to detect aberrant pathway activity in tumors. The method integrated RNA-seq, copy number, and mutation data. The models were trained using tumors from TCGA PanCanAtlas, with a complete set of these measurements, which included 9,075 tumors across 33 different cancer types. The method is based on a logistic regression classifier framework regularized with an elastic net penalty. We used RNA-seq as a measurement describing the expression state of a tumor and trained the classifier to detect downstream gene expression patterns consistent with aberrant pathway activity (Figure 1A). The algorithm learned a combination of gene importance scores, or weights (w), that together learn to best separate aberrant from wild-type expression patterns. As input during training, tumors with any non-silent somatic variants in target genes were included in the positive set (Figure 1B). We also included copy number gains for oncogenes and deep copy number loss for tumor suppressor genes (Figure 1B). For complete details about the model and training approach, refer to the STAR Methods. In principle, this approach could be applied to predict other gene or pathway events. Here, we applied the method to classifying Ras activity.
Figure 1. Framing the Algorithm and Integration Tasks.

(A) RNA-seq data (X) is multiplied by a vector of gene weights (w) where the optimization task is to find the optimal w to correctly classify the pathway status matrix (y). We train the model with the train partition and evaluate performance on a held-out test set.
(B) The status matrix, y, is constructed by integrating mutations and copy number alterations (CNA). We consider activating or loss-of-function mutations and high copy number gain and deep copy number loss for oncogenes and tumor-suppressor genes, respectively. Black squares indicate aberrant events. For the Ras classifier, we used non-silent somatic mutations and high copy gains in the oncogenes KRAS, NRAS, and HRAS.
Detecting Ras Activation Pan-cancer
We trained a classifier to detect aberrant Ras activity in tumors, using knowledge of KRAS, HRAS, and NRAS mutations and copy number gains (see Figure 1). These 3 core Ras genes differed greatly in variant prevalence across cancer types. In the PanCanAtlas, KRAS mutations were widespread in PAAD (72%), COAD (45%), rectum adenocarcinoma (READ, 42%), and LUAD (31%), while NRAS mutations were common in SKCM (31%) (Figure S1A). We performed a differential expression analysis of PanCanAtlas tumors, controlled for cancer type, comparing wild-type against aberrant Ras tumors (Figure S1B; Data S1).
In the classifier, to enforce a more balanced class representation and to reduce performance metric inflation (Davis and Goadrich, 2006), we used samples from 16 of 33 cancer types for training (Figure 2A). We also used the top 8,000 most variably expressed genes by median absolute deviation (MAD) (see STAR Methods for details). We then randomly held out 10% of the samples (n = 476) to create a test set. The test set was selected to have the same proportion of cancer types and Ras statuses as the training set. The training set consisted of the remaining 90% (n = 4,283), which included 3,374 Ras wild-type tumors and 909 tumors with non-silent somatic Ras variants. Within the training set, we performed 5-fold cross-validation (CV). We report training (“training”), cross-validation (“CV”), and held-out test set (“testing”) performance using these cancer types. We also evaluated the final classifier on cancer types that were initially filtered from training.
Figure 2. Evaluating Machine-Learning Classification of Ras Activation.

(A) Cancer-type-specific percentages of Ras aberration by copy number gain and deleterious mutation in KRAS, HRAS, or NRAS. The colored squares indicate whether the cancer type was included in model training.
(B) Predicting Ras pathway activation metrics. The gray lines represent classifier predictions on a randomly shuffled gene expression matrix. Left: receiver operating characteristic (ROC) curve and area under the ROC (AUROC) curve given for training, testing, and cross-validation (CV) sets. The dotted navy line represents a hypothetical random classifier. Right: precision recall (PR) curve and corresponding area under the PR (AUPR) curve for each evaluation set.
(C) Sparse classifier coefficients indicate which genes impact classifier performance. log10_mut represents tumor-specific non-silent mutation rate. (D) Cancer-type-specific performance for the pan-cancer model compared to separate models trained on each cancer type independently.
See also Figures S2 and S3.
Overall, the classifier showed high performance, with an area under the receiver operating characteristic (AUROC) curve above 84% and an area under the precision recall (AUPR) curve above 63% in the cross-validation and testing sets (Figure 2B). For the samples initially filtered from training, we also observed reasonable performance, with an AUROC curve of 75.2% and an AUPR curve of 24.7%. Therefore, the classifier detected Ras activation signal in tissues it was not exposed to during training. Applying the final classifier to all 9,075 samples, we observed an 86.7% AUROC curve and a 61.2% AUPR curve. We provide Ras prediction scores for each PanCancerAtlas sample in Data S2.
The Ras classifier consisted of automatically learned gene weights, or importance scores. Training with an elastic net penalty resulted in a sparse classifier, with only 185 genes contributing to classification. Genes and covariates with weights above zero can be interpreted as being upregulated in tumors with activated Ras, while negative-weight genes are characteristic of tumors with wild-type Ras (Figure 2C). The full classifier gene weights are provided in Data S3. However, caution must be exercised in interpreting these coefficients, as our elastic net regularization approach induces sparsity, which means that the solution represents a subset of genes associated with—and, therefore, useful for identifying—Ras activation. A differential expression analysis of Ras aberrant to wild-type tumors would reveal these downstream genes (Data S1).
Nevertheless, many of the classifier-implicated genes are known modulators of the Ras/MAPK (mitogen-activated protein kinase) pathway. For instance, high expression of ERRFI1 contributed to predicting tumors with activated Ras. ERRFI1 is a tumor suppressor of various receptors in the Ras pathway (Masoumi-Moghaddam et al., 2014). The top positive gene, PBX3, is a transcription factor previously implicated in certain astrocytomas (Ho et al., 2013b). The second top positive gene, SPRY2, inhibits FGFR signaling and interacts with ERBB1. The negatively associated genes are indicative of expression profiles of wild-type Ras tumors. For example, CDK13 was the most predictive gene and is involved in regulating transcription, which potentially indicates an alternative mechanism driving transcriptional disruption in wild-type Ras tumors. We also compared pan-cancer classification with classifiers trained independently within each cancer type. Both the cancer-type-specific and pan-cancer classifiers had variable performance across cancer types, with the pan-cancer model outperforming the models optimized within cancer types approximately half of the time (Figure 2D).
Ras Classifier Benchmarking Analyses
We performed several analyses to evaluate the robustness of the Ras classifier. A null model trained on a randomly shuffled gene expression matrix performed with about 50% AUROC and 20% AUPR in holdout test and cross-validation sets, which indicates strong performance of the model over this baseline (Figures S2A and S2B). We also assessed performance of the classifier for detecting Ras mutations and Ras copy number gains separately. Performance was similar, with the mutations-only model performing better than the combined model and the copy-number-only model performing worst (Figure S2C). Our model was robust to dropping KRAS, NRAS, and HRAS and 11 other Rasopathy genes from the gene expression matrix (Figure S2D). Lastly, performance was not impacted by covariate information (Figure S2E).
We also explored gene coefficient relationships across models. The high-weight-positive genes in the copy-only model included C12orf11 (ASUN), MRPS35, ERGIC2, and CMAS, all of which are located on chromosome 12p near KRAS, which may indicate artifacts of common copy-gain events and be a result of low sample size in the positive-copy-only set (Figure S2F). Gene coefficients were similar across models when dropping different Ras pathway genes (Figure S2G). Lastly, we compared our machine-learning approach to a differential expression analysis of Ras mutant versus wild-type tumors controlled by cancer type. The differential expression scores aligned closely with the learned Ras classifier coefficients but identified many more genes than the sparse classifier (Figure S2H) (Data S1). In summary, the Ras classifier differed depending on data-type inclusion but was robust to input genes in the expression matrix, did not rely on covariate data, and included similar but fewer genes than a differential expression analysis.
Detecting Ras Activation in Cell Lines
We sought to determine whether predictions from the Ras classifier trained with TCGA tumors generalized to cell lines. We applied the classifier to two cell-line datasets. First, we applied the classifier to 10 small-airway epithelial cell RNA-seq profiles (GEO: GSE94937) (Kim et al., 2017). The set consisted of 4 wild-type profiles and 6 KRAS G12V-expressing mutant profiles. Our classifier correctly classified 9 out of 10 profiles and ranked all mutant profiles higher than all wild-type profiles (p = 1.16e–2) (Figure 3A). Though the PanCanAtlas data do not include gene-edited tumors that would allow us to directly evaluate Ras oncogenicity, the cell lines from this independent test set are induced to stably express a bona fide oncogenic KRAS variant.
Figure 3. Cell-Line Predictions of Ras Activity.

(A) Ras classifier trained on PanCanAtlas tumors applied to a dataset of small airway epithelial cells (GEO: GSE94937). The mutant cells included a stably expressed KRAS G12V mutation.
(B) Ras classifier trained on PanCanAtlas tumors applied to 737 cell lines from The Cancer Cell Line Encyclopedia (CCLE). Cell lines with KRAS, HRAS, or NRAS mutations are indicated in the right boxes, and wild-type tumors are indicated in the left boxes. Scores for cell lines with BRAF mutations (green) and wild-type BRAF (gold) are also shown.
(C and D) Drug activity area for (C) selumetinib (AZD6244) and (D) PD-0325901 compared against Ras classifier scores for 388 CCLE cell lines with both gene expression and pharmacologic profiling data. Cell lines with mutant (orange) or wild-type (blue) KRAS, HRAS, and NRAS are indicated. The best fit lines, SE estimates, correlation coefficients, and p values are shown separately for cell lines with mutant or wild-type Ras.
Next, we applied our Ras classifier to RNA-seq profiles from 737 different cell lines from the Cancer Cell Line Encyclopedia (CCLE) with matched expression and mutation data (Barretina et al., 2012) (Figure 3B). The Ras classifier assigned significantly higher scores to Ras mutated (KRAS, HRAS, or NRAS) from Ras wild-type cell lines (p = 6.35e–36). Of the 393 cell lines predicted to be wild-type, 357 were labeled wild-type (negative predictive value = 90.8%). However, only 153 of 344 cell lines that were predicted to be Ras mutated were labeled Ras mutant (precision = 44.5%). In total, 510 of 737 (69.2%) cell lines were predicted correctly. In this case, the low precision could indicate either that the classifier failed to generalize or that the classifier successfully identified phenocopying events, which were negatives from the point of view of evaluations but also what we aimed to capture.
We sought to differentiate between these two possibilities by using independent information that was not provided to the classifier. First, we examined mutation status for BRAF, a well-characterized oncogene downstream of Ras genes (Davies et al., 2002). BRAF mutations that phenocopy Ras would be counted as negatives and, if they were highly ranked, would reduce the observed precision. Indeed, the classifier assigned significantly higher scores to BRAF mutant cell lines, compared to BRAF wild-type cell lines (p = 1.16e–11) (Figure 3B). Of all 191 false-positives, 56 had BRAF mutations (29.3%). The remaining false-positives indicated either tumors incorrectly assigned or tumors that harbored other phenocopying variants. Next, we tested CCLE pharmacological response data to determine whether Ras classifier scores were predictive of sensitivity to MEK inhibitors. We observed a strong correlation of the Ras classifier scores with sensitivity to two MEK inhibitors, selumetinib (AZD6244) and PD-0325901 (Figures 3C and 3D). The correlation was primarily driven by cell lines that were wild-type for Ras genes, implicating several drug-sensitive cell lines that may have otherwise been missed by direct sequencing of Ras genes. Taken together, the evaluation of additional mutations and the drug response data for Ras wild-type cell lines strongly suggested that the low precision in this case was related to the identification of phenocopying events.
Lastly, the classifier scored 34 cell lines harboring Ras mutations as Ras wild-type. We observed that 22 of these 34 false-negatives harbored variants annotated in the COSMIC database (64%) (Forbes et al., 2017). Conversely, 144 of 152 true-positives harbored COSMIC variants (95%), which is significantly higher than the proportion in false-negatives, χ2 = 26.1, degree of freedom 1, p = 3.2e–7. Therefore, our classifier detected signal at variant level resolution. We provide mean classifier scores for all nucleotide (Data S4) and amino-acid (Data S5) Ras variants observed in the CCLE.
Other Ras Pathway Variants Phenocopy Ras Activation
The Ras classifier was able to detect NF1-loss events particularly well in CNS tumors (GBM, low-grade glioma [LGG], and pheochromocytoma and paraganglioma [PCPG]). Performance was comparable to that of NF1 classifiers built using cancer-type-specific and pan-cancer models (Figure 4A). These tumors were not included in training the Ras classifier. Detection of NF1-inactivating events was also improved in COAD, OV, and uterine corpus endometrial carcinoma (UCEC), as compared to NF1-specific classifiers (Figure 4A). The Ras classifier’s performance predicting NF1 loss of function was comparable to that of distinct pan-cancer models trained specifically to detect NF1 loss-of-function events (Figure S3).
Figure 4. Ras Activation across Ras Variants and Alternative Ras Pathway Members.

(A) Cross-validation area under the receiver operating characteristic curve for predicting NF1 inactivation. Within and pan-cancer models are classifiers trained to detect NF1 inactivation. The Ras model is the classifier trained in Figure 2. The pan-cancer NF1 classifier is shown in Figure S3.
(B) Ras classifier scores for samples with oncogenic or unconfirmed variants in KRAS, HRAS, and NRAS. Variant oncogenicity designations are based on curation (see STAR Methods).
(C and D) Ras classifier scores stratified by Ras activity (KRAS, NRAS, HRAS) status and number of (C) aberrant mutations or (D) copy number alterations in other Ras pathway members. The two rows of numbers above each graph indicate number of samples in each group (top) and percentage of samples assigned to active Ras (bottom).
See also Figure S3.
We applied the Ras classifier to curated variants in 38 core Ras pathway genes, which consisted of 34 oncogenes and 4 tumor-suppressor genes (Chakravarty et al., 2017; Sanchez-Vega et al., 2018). We provide Ras classifier scores for all Ras pathway mutations detected in PanCanAtlas tumors (Data S4 and Data S5). We observed an enrichment of high scores in tumors with oncogenic variants in KRAS, NRAS, and HRAS (Figure 4B). Scores for oncogenic BRAF variants were also enriched (Figure S4A). However, we noted that BRAF V600E mutations in THCA were overwhelmingly predicted to be Ras wild-type (Figure S4B). We trained a classifier for which we removed both of the BRAF-dominated cancer types (THCA and SKCM) (Figure S4C). In this model, we observed that THCA BRAF V600E mutations were predicted to have Ras activation, which aligns with previous understanding of BRAF function and our cell-line analysis (Figure S4D).
Lastly, in wild-type samples for KRAS, NRAS, and HRAS (Figure 4C, blue bars), we observed that Ras classifier scores increased after subsequent mutations in other pathway genes. In samples with a KRAS, NRAS, or HRAS mutation (Figure 4C, red bars), classifier scores did not increase after additional mutations to other genes in the pathway. However, more copy number events in other Ras pathway genes led to lower Ras classifier scores in Ras mutated samples (Figure 4D). These results potentially suggest that multiple hits in Ras pathway genes outside of Ras genes themselves may confer an increased Ras activation phenotype.
DISCUSSION
We described a machine-learning method to detect malfunctioning genes and pathways in cancer and applied our method to detecting Ras activation. The method has variable performance across cancer types but is generally sensitive and specific overall, is generalizable to cell-line data, largely aligns with curated variant oncogenicity, and identifies phenocopying events leading to activated Ras. The approach can be applied generally to other genes and pathways.
The cell-line evaluation included accurately detecting isogenic lines transfected to express activating KRAS mutations and identifying CCLE cell lines with known Ras and BRAF mutations. We also demonstrated that CCLE Ras classifier scores were correlated with the drug activity of two MEK inhibitors (selumetinib and PD-0325901). In clinical trials, selumetinib did not increase overall survival in KRAS mutant advanced non-small-cell lung cancer (NSCLC) patients (Jänne et al., 2013, 2016). PD-0325901 also failed to meet efficacy endpoints in KRAS mutant NSCLC patients (Haura et al., 2010). Selumetinib and PD-0325901 have also been tested across many different cancer types, including ovarian, thyroid, skin, hepatocellular, breast, and colon cancers (Boasberg et al., 2011; Farley et al., 2013; Ho et al., 2013a; Jänne et al., 2016; O’Neil et al., 2011). Selumetinib has shown promising results in treating children with NF1 mutant plexiform neurofibromas (Dombi et al., 2016), while PD-0325901 has shown efficacy in treating NF1 mutant neurofibromas in mouse- and human-derived malignant peripheral nerve sheath xenografts (Jessen et al., 2013). Furthermore, the classifier automatically learns similar gene coefficients of an 18-gene panel previously curated using a targeted differential expression analysis to predict selumetinib sensitivity (Dry et al., 2010). Overall, our results suggest a useful biomarker application to potentially reveal hidden responders that may have otherwise been missed by sequencing.
Our approach to detecting Ras activation is supervised and, as with any supervised approach, is penalized by inaccurate labels. We encountered this limitation when detecting BRAF mutations in THCA. BRAF mutations are known to activate ERK and should not be classified as wild-type Ras (Oikonomou et al., 2014). Our results suggest that, in situations with predicted confounding mutations, it may be best to withhold a cancer type entirely during training. Withholding such data, as opposed to re-building a new classifier post hoc that uses BRAF V600E mutations as positive examples, may help to prevent a process of classifier creep, in which the classifier is continually expanded to improve metrics. Additionally, it is unclear how to best adjust for hypermutated phenotypes, as these tumors are more likely to have Ras mutations by chance. Unsupervised or semi-supervised methods to automatically retrieve gene expression signatures may overcome labeling issues and may sidestep some of the difficulties in modeling hypermutated tumors by first separating sources of variation.
While mutual exclusivity analyses across pathways drives hypotheses and reveals etiological insights (Babur et al., 2015; Mina et al., 2017), our findings suggest that, when multiple mutations occur in Ras pathway genes, tumors exhibit a transcriptional profile associated with increased Ras activity. This is the opposite observation for copy number events, as more events outside of KRAS, NRAS, and HRAS appear to confer lower scores, which may indicate either some sort of dosage response counteracting the effects of hyperactivation or alternative events that dampen accurate Ras classification. Furthermore, tumors harboring specific Ras pathway isoforms curated by the PanCanAtlas Pathways AWG are generally predicted to have higher scores than unconfirmed variants. We provide scores for all observed somatic Ras variants for TCGA tumors and CCLE cell lines at base-pair and amino-acid resolution (Data S4 and Data S5) and present this resource for potential follow-up study.
In conclusion, we presented a machine learning method to predict Ras activity in individual bulk tumors using transcriptomes. Our approach may sidestep requirements to profile multiple genomic measurements to detect Ras activation and identify more patients with activated Ras. Our approach can be used as an additional method to improve precision oncology (Cieślik and Chinnaiyan, 2018). Subclonal mutations may also prevent accurate Ras classification by gene sequencing. Training classifiers with single-cell RNA-seq data may enable the detection of rare events and can help to characterize intratumor heterogeneity. As data increase in scale and algorithms are better constructed to model disease heterogeneity, the ability to research downstream responses of pathway misregulation and identify multi-model therapies targeting various vulnerabilities of individual tumors will improve.
STAR ★ METHODS
Detailed methods are provided in the online version of this paper and include the following:
KEY RESOURCES TABLE
CONTACT FOR REAGENT AND RESOURCE SHARING
Further information and requests for resources and reagents should be directed to and will be fulfilled by the Lead Contact, Casey S. Greene (csgreene@upenn.edu). The Cancer Genome Atlas will provide instructions on how to access publicly available data.
METHOD DETAILS
Training machine learning classifiers to detect aberrant gene events
We integrated Illumina RNaseq, multi-center mutation calls (MC3), and GISTIC2.0 copy number threshold calls from The Cancer Genome Atlas (TCGA) PanCanAtlas project to classify aberrant pathway function (Mermel et al., 2011). We downloaded TCGA data-sets from the Genome Data Commons (GDC). In total, there were 9,075 tumors that were measured on all three platforms that passed quality control filtering. We subset the gene expression matrix to the 8,000 most variably expressed genes by median absolute deviation (MAD), as genes that do not vary are unlikely to be useful for classification and to reduce training time. We dropped the target genes of interest (e.g., KRAS, NRAS, HRAS or NF1) when training the models to prevent the model from potentially relying too heavily on dosage-specific effects of these genes instead of the downstream response to their activation. We also removed the samples with the highest mutation burden to remove potential false positives. We defined these samples based on five standard deviations above the log10 total non-silent somatic mutation count per sample. Because we were interested in a balanced training set based on aberrant gene events, we further filtered samples to include only cancer-types with greater than 15 target gene events and a proportion of negatives to positives no less than 5%.
Using this data, we trained a supervised elastic net penalized logistic regression classifier with stochastic gradient descent (Zou and Hastie, 2005). Our model is trained on RNaseq gene expression (X) to predict gene status (Y) (see Figure 1). To control for tumors with a hypermutator phenotype and potential tissue-specific expression patterns, we included cancer-type dummy variables and per sample log10 mutation count in the model as covariates. We defined gold standard gene status using loss of function mutation and deep copy number losses for tumor suppressor genes and gain of function mutations and large copy number gains for oncogenes. For simplicity and to reduce the requirement for extensive manual curation, we considered any non-silent mutation including insertion-deletions in the gene body or mutations in splice site regions of target genes. For the specific focus of the paper, we integrated gain of function mutation and copy number gains for the oncogenes (KRAS, NRAS, and HRAS), and loss of function and deep copy number losses for the tumor suppressors (NF1). For example, if a tumor had a deleterious mutation or copy number amplification in one of these genes, we considered the Ras status equal to one.
The objective of the classifier is to determine the probability a given sample (i) has a Ras event given the sample’s RNaseq measurements (Xi). In order to achieve the objective, the classifier learns a vector of coefficients or gene-specific weights (w) that optimize the following penalized logistic function.
Where α and l are regularization and elastic net mixing hyperparameters that are only active during training, respectively. Using a training set consisting of 90% of the full dataset, equally balanced for different proportions of included cancer-types and Ras status, we performed cross validation over the hyperparameter grid: l = {0.15, 0.155, 0.16, 0.2, 0.25, 0.3, 0.4} and α = {0.1, 0.13, 0.15, 0.18, 0.2, 0.25, 0.3}. We used balanced 5-fold cross validation based on the highest cross-validation area under the receiver operating characteristic (AUROC).
We trained the Ras classifier using optimal hyperparameters (l = 0.15 and α = 0.1) and assessed performance on training, testing (held out 10% of data) and across 5-fold cross-validation intervals. In 5-fold cross-validation, the data are partitioned into five even sets (balanced by Ras status and cancer-type). Four of the folds, called training intervals, are used to construct the model. The model is then evaluated on the fifth fold, which is called the evaluation fold. The reported training performance comes from the folds used for training, while the cross-validation performance uses the evaluation fold. Therefore, performance on cross-validation intervals are the predictions reported on the training set samples when they were included in the internal cross-validation evaluation fold. The full model is reported in Data S3 and all resulting classification scores in Data S2 is the model learned from the training set alone.
Evaluating machine learning classifiers
We evaluated the pan-cancer classifiers in various ways. For every evaluation, we reported the AUROC and area under the precision-recall (AUPR) curve. We also compared gene specific classifiers built using pan-cancer data to classifiers trained independently using only data from individual cancer-types. In these cases, each cancer-type specific model was optimized individually. We compared how the pan-cancer model performed on individual cancer-types compared to individual cancer-type optimizations. Additionally, we cataloged the performance of the Ras classifier to predict NF1 inactivation in various cancer-types. NF1 is a tumor suppressor of Ras and we postulated that it would have similar downstream consequences that could be captured by the Ras classifier. Therefore, we performed the same procedure of filtering datasets and training pan and within cancer-type classifiers for NF1. We compared these NF1 evaluations against the Ras classification. Lastly, we evaluated the Ras classifier on predicting aberrant mutations of other genes and variants in the Ras pathway and in two different cell line datasets.
Classifier Benchmarking Analyses
We determined the robustness of the classifier by evaluating performance under various input features and prediction tasks. We evaluated potential inflation of performance metrics by training a null model on a randomly shuffled input gene expression matrix. We did not shuffle the covariate information or the y matrix. Performance on the random shuffling of genes, while maintaining the same ratio of Ras mutations, provides insight into how the model would be expected to perform in a scenario lacking Ras activation signal. We also performed the same shuffling and classifier testing procedure as internal negative controls in every pan-cancer model and report ROC/PR curves and AUROC/AUPRs in each figure.
To assess value added in combining mutation and copy number data in the prediction task (altering the y matrix), we trained pan-cancer classifiers with the same procedure described above to predict Ras mutations and Ras copy number gains separately. The combined model presented here is the same model trained in Figure 2. To test the effect of dropping KRAS, HRAS, and NRAS from the model (altering the X matrix), we trained models with the previously described procedure with the input gene expression matrix without dropping Ras genes. We also tested a classifier after dropping 14 genes from the Expanded RASopathy Panel (Genetic Testing Registry). The genes included BRAF, CBL, HRAS, KRAS, MAP2K1, MAP2K2, NF1, NRAS, PTPN11, RAF1, SHOC2, SOS1, SPRED1, and RIT1. For the two previous comparisons, we compared the learned gene expression coefficients to the classifier trained in Figure 2. For the dropping genes analysis, we added back all dropped genes as zero weights. We also compared the performance of gene expression-only and covariate-only models (altering the X matrix) to the combined model presented in Figure 2. The y matrix remained the same, but each model was trained on only a subset of the combined X matrix. The differentially expressed genes visualized in Figure S2H were obtained from the differential expression analysis described below.
Differential Expression Analysis
We performed a differential expression analysis using the limma Bioconductor package (Ritchie et al., 2015). We adjusted the model by cancer-type by including cancer-type indicator variables in the limma design matrix. We considered all 9,074 samples and 20,500 genes in this analysis. We zero-one normalized the input matrix by gene prior to fitting with limma.
Cell Line Validation
We applied the Ras classifier to two independent cell line datasets. The first dataset was generated by Kim et al. (2017) and was deposited in the Gene Expression Omnibus (Edgar et al., 2002) with the identifier GEO: GSE94937. We used the preprocessed form of the data from (Kim et al., 2017). We also used data from 737 cell lines from the CCLE that had matching RNaseq and mutation data (Barretina et al., 2012). Of these 737, 708 also had variant level annotations. In order to apply the classifier to both cell-line data-sets, we z-score normalized gene expression values and subset the data to classifier genes, independently. 177 out of 185 (96%) of the features were in common to classifier genes in both datasets, so we proceeded to make predictions with this subset. In order to apply the predictions, we used the following transformation:
Where s is the classifier prediction, w is the gene weights, and X is the corresponding subset cell line gene expression matrix.
We used the CCLE pharmacologic profiling data, which measured the activity of 24 drugs across 504 CCLE cell lines (CCLE_NP24.2009_profiling_2012.02.20.csv). Data were accessed from https://portals.broadinstitute.org/ccle/data (Barretina et al., 2012).
Ras Pathway and Oncogenicity Curation
We used the PanCanAtlas Pathways Working Group definition of 38 core Ras pathway genes (Sanchez-Vega et al., 2018). We obtained oncogenicity assignments for mutations in these genes using OncoKB (Chakravarty et al., 2017) and additional manual curation by the PanCanAtlas Pathways AWG. The manual curation included referencing MutSig (Lawrence et al., 2013), hotspot analyses (Chang et al., 2016), and GISTIC Peaks (Mermel et al., 2011).
QUANTIFICATION AND STATISTICAL ANALYSES
We performed all machine learning model training, testing, and evaluations using sci-kit learn (version 0.18.1) with python 3.5.2 (Pedregosa et al., 2011). We processed data using a combination of pandas (version 0.20.3) and dplyr (version 0.7.1) and visualized results using a combination of seaborn (version 0.7.1), ggplot2 (version 2.2.1), and PathwayMapper (Bahceci et al., 2017). R packages were run on R version 3.4.0. Please refer to the Key Resources Table and the available GitHub repository (https://github.com/greenelab/pancancer) for full software version details. We evaluated all classifiers using AUROC and AUPR. The AUROC is a metric describing the overall trade-off between true positive and false positive rates, while the AUPR measures precision against recall for a given classifier. An AUROC of 0.5 constitutes random guessing. We describe specific filtering steps for each analysis in various places in the Method Details section of the STAR Methods. We describe overall sample and gene filtering in the Training subsection. We discuss additional gene filtering for evaluating all alternative genes in the Evaluation subsection. We set random seeds in all computational analyses in order to preserve reproducibility. We performed independent t tests with unequal variances when comparing classifier scores for curated variants versus variants of unknown significance per Ras pathway gene. We performed the same test comparing CCLE cell line Ras classifier scores for Ras wild-type versus Ras (KRAS, HRAS, or NRAS) mutant samples and for Ras wild-type, BRAF wild-type versus Ras wild-type, BRAF mutant. Using the up to 388 cell lines with both gene expression and pharmacology data measured, we fit linear regression models comparing drug activity versus Ras classifier scores for all 24 drugs to Ras wild-type and Ras mutant cell lines individually. Using a Bonferroni adjusted p value (0.05/(24 * 2) = 0.001), we implicated two high correlated drugs (AZD6244 (Selumetinib) and PD-0325901). Selumetinib was tested on 387 cell lines while PD-0325901 was tested on 388 cell lines. We also used a chi square test for proportions of Ras mutations annotated as COSMIC variants in true positives compared to false negatives with a null hypothesis that both sets of samples have the same proportion of COSMIC variants.
DATA AND SOFTWARE AVAILABILITY
All analytical results can be reproduced using the code available at https://github.com/greenelab/pancancer. There, we provide instructions to replicate the computing environment, download versioned data, and all scripts to reproduce the entire analysis pipeline. The pipeline is modular and amendable to generate classifiers and predictions for any combination of genes, pathways, and TCGA PanCanAtlas cancer-types. The source code has been deposited to Zenodo at https://doi.org/10.5281/zenodo.1186801.
Supplementary Material
Highlights.
Machine learning models of gene expression can aid in precision oncology
The model can identify Ras activation in TCGA PanCanAtlas tumors and cell lines
The model identifies events that phenocopy Ras activation, such as NF1 loss
The approach characterizes Ras pathway variants and is extensible to other pathways
Acknowledgments
We thank Daniel Himmelstein, Jie Tan, and Amy Campbell for helpful code review. This work was funded in part by grants from the Gordon and Betty Moore Foundation (GBMF 4552) to C.S.G. and from the NIH (R01 NS095411) to Y.S. G.P.W. was supported in part by a training grant from the NIH (T32 HG000046). This work was also supported by the U.S. National Cancer Institute funding of TCGA (U54 HG003273, U54 HG003067, U54 HG003079, U24 CA143799, U24 CA143835, U24 CA143840, U24 CA143843, U24 CA143845, U24 CA143848, U24 CA143858, U24 CA143866, U24 CA143867, U24 CA143882, U24 CA143883, U24 CA144025, and P30 CA016672).
Footnotes
Supplemental Information includes four figures and five data files and can be found with this article online at https://doi.org/10.1016/j.celrep.2018.03.046.
AUTHOR CONTRIBUTIONS
Conceptualization: G.P.W., Y.S., and C.S.G.; Methodology: G.P.W. and C.S.G.; Software: G.P.W.; Investigation: G.P.W. and C.S.G.; Curation and Resources: F.S.-V., K.L., J.A., W.K.C., N.S., A.L., C.S., A.D.C., M.M., and G.C.; Writing – Original Draft: G.P.W. and C.S.G.; Writing – Review and Editing: F.S.-V., K.L., J.A., W.K.C., N.S., A.L., C.S., A.D.C., M.M., G.C., and Y.S.
DECLARATION OF INTERESTS
Michael Seiler, Peter G. Smith, Ping Zhu, Silvia Buonamici, and Lihua Yu are employees of H3 Biomedicine, Inc. Parts of this work are the subject of a patent application: WO2017040526 titled “Splice variants associated with neo-morphic sf3b1 mutants.” Shouyoung Peng, Anant A. Agrawal, James Palacino, and Teng Teng are employees of H3 Biomedicine, Inc. Andrew D. Cherniack, Ashton C. Berger, and Galen F. Gao receive research support from Bayer Pharmaceuticals. Gordon B. Mills serves on the External Scientific Review Board of Astrazeneca. Anil Sood is on the Scientific Advisory Board for Kiyatec and is a shareholder in BioPath. Jonathan S. Serody receives funding from Merck, Inc. Kyle R. Covington is an employee of Castle Biosciences, Inc. Preethi H. Gunaratne is founder, CSO, and shareholder of NextmiRNA Therapeutics. Christina Yau is a part-time employee/consultant at NantOmics. Franz X. Schaub is an employee and shareholder of SEngine Precision Medicine, Inc. Carla Grandori is an employee, founder, and shareholder of SEngine Precision Medicine, Inc. Robert N. Eisenman is a member of the Scientific Advisory Boards and shareholder of Shenogen Pharma and Kronos Bio. Daniel J. Weisenberger is a consultant for Zymo Research Corporation. Joshua M. Stuart is the founder of Five3 Genomics and shareholder of NantOmics. Marc T. Goodman receives research support from Merck, Inc. Andrew J. Gentles is a consultant for Cibermed. Charles M. Perou is an equity stock holder, consultant, and Board of Directors member of BioClassifier and GeneCentric Diagnostics and is also listed as an inventor on patent applications on the Breast PAM50 and Lung Cancer Subtyping assays. Matthew Meyerson receives research support from Bayer Pharmaceuticals; is an equity holder in, consultant for, and Scientific Advisory Board chair for OrigiMed; and is an inventor of a patent for EGFR mutation diagnosis in lung cancer, licensed to LabCorp. Eduard Porta-Pardo is an inventor of a patent for domainXplorer. Han Liang is a shareholder and scientific advisor of Precision Scientific and Eagle Nebula. Da Yang is an inventor on a pending patent application describing the use of antisense oligonucleotides against specific lncRNA sequence as diagnostic and therapeutic tools. Yonghong Xiao was an employee and shareholder of TESARO, Inc. Bin Feng is an employee and shareholder of TESARO, Inc. Carter Van Waes received research funding for the study of IAP inhibitor ASTX660 through a Cooperative Agreement between NIDCD, NIH, and Astex Pharmaceuticals. Raunaq Malhotra is an employee and shareholder of Seven Bridges, Inc. Peter W. Laird serves on the Scientific Advisory Board for AnchorDx. Joel Tepper is a consultant at EMD Serono. Kenneth Wang serves on the Advisory Board for Boston Scientific, Microtech, and Olympus. Andrea Califano is a founder, shareholder, and advisory board member of DarwinHealth, Inc. and a shareholder and advisory board member of Tempus, Inc. Toni K. Choueiri serves as needed on advisory boards for Bristol-Myers Squibb, Merck, and Roche. Lawrence Kwong receives research support from Array BioPharma. Sharon E. Plon is a member of the Scientific Advisory Board for Baylor Genetics Laboratory. Beth Y. Karlan serves on the Advisory Board of Invitae.
References
- Babur Ö, Gönen M, Aksoy BA, Schultz N, Ciriello G, Sander C, Demir E. Systematic identification of cancer driving signaling pathways based on mutual exclusivity of genomic alterations. Genome Biol. 2015;16:45. doi: 10.1186/s13059-015-0612-6. [DOI] [PMC free article] [PubMed] [Google Scholar]
- Bahceci I, Dogrusoz U, La KC, Babur Ö, Gao J, Schultz N. PathwayMapper: a collaborative visual web editor for cancer pathways and genomic data. Bioinformatics. 2017;33:2238–2240. doi: 10.1093/bioinformatics/btx149. [DOI] [PMC free article] [PubMed] [Google Scholar]
- Barretina J, Caponigro G, Stransky N, Venkatesan K, Margolin AA, Kim S, Wilson CJ, Lehár J, Kryukov GV, Sonkin D, et al. The Cancer Cell Line Encyclopedia enables predictive modelling of anticancer drug sensitivity. Nature. 2012;483:603–607. doi: 10.1038/nature11003. [DOI] [PMC free article] [PubMed] [Google Scholar]
- Bild AH, Yao G, Chang JT, Wang Q, Potti A, Chasse D, Joshi MB, Harpole D, Lancaster JM, Berchuck A, et al. Oncogenic pathway signatures in human cancers as a guide to targeted therapies. Nature. 2006;439:353–357. doi: 10.1038/nature04296. [DOI] [PubMed] [Google Scholar]
- Boasberg PD, Redfern CH, Daniels GA, Bodkin D, Garrett CR, Ricart AD. Pilot study of PD-0325901 in previously treated patients with advanced melanoma, breast cancer, and colon cancer. Cancer Chemother Pharmacol. 2011;68:547–552. doi: 10.1007/s00280-011-1620-1. [DOI] [PubMed] [Google Scholar]
- Chakravarty D, Gao J, Phillips S, Kundra R, Zhang H, Wang J, Rudolph JE, Yaeger R, Soumerai T, Nissan MH, et al. OncoKB: a precision oncology knowledge base. JCO Precis Oncol. 2017 doi: 10.1200/PO.17.00011. Published online May 16, 2017. https://doi.org/10.1200/PO.17.00011. [DOI] [PMC free article] [PubMed]
- Chang MT, Asthana S, Gao SP, Lee BH, Chapman JS, Kandoth C, Gao J, Socci ND, Solit DB, Olshen AB, et al. Identifying recurrent mutations in cancer reveals widespread lineage diversity and mutational specificity. Nat Biotechnol. 2016;34:155–163. doi: 10.1038/nbt.3391. [DOI] [PMC free article] [PubMed] [Google Scholar]
- Cieślik M, Chinnaiyan AM. Cancer transcriptome profiling at the juncture of clinical translation. Nat Rev Genet. 2018;19:93–109. doi: 10.1038/nrg.2017.96. [DOI] [PubMed] [Google Scholar]
- Davies H, Bignell GR, Cox C, Stephens P, Edkins S, Clegg S, Teague J, Woffendin H, Garnett MJ, Bottomley W, et al. Mutations of the BRAF gene in human cancer. Nature. 2002;417:949–954. doi: 10.1038/nature00766. [DOI] [PubMed] [Google Scholar]
- Davis J, Goadrich M. In: Cohen D, Moore A, editors. The Relationship Between Precision-Recall and ROC Curves; Proceedings of the 23rd International Conference on Machine Learning; Association for Computing Machinery; 2006. pp. 233–240. [Google Scholar]
- De Luca A, Maiello MR, D’Alessio A, Pergameno M, Normanno N. The RAS/RAF/MEK/ERK and the PI3K/AKT signalling pathways: role in cancer pathogenesis and implications for therapeutic approaches. Expert Opin Ther Targets. 2012;16(Suppl 2):S17–S27. doi: 10.1517/14728222.2011.639361. [DOI] [PubMed] [Google Scholar]
- di Magliano MP, Logsdon CD. Roles for KRAS in pancreatic tumor development and progression. Gastroenterology. 2013;144:1220–1229. doi: 10.1053/j.gastro.2013.01.071. [DOI] [PMC free article] [PubMed] [Google Scholar]
- Dinu D, Dobre M, Panaitescu E, Bîrlă R, Iosif C, Hoara P, Caragui A, Boeriu M, Constantinoiu S, Ardeleanu C. Prognostic significance of KRAS gene mutations in colorectal cancer–preliminary study. J Med Life. 2014;7:581–587. [PMC free article] [PubMed] [Google Scholar]
- Dombi E, Baldwin A, Marcus LJ, Fisher MJ, Weiss B, Kim A, Whitcomb P, Martin S, Aschbacher-Smith LE, Rizvi TA, et al. Activity of Selumetinib in Neurofibromatosis Type 1-Related Plexiform Neurofibromas. N Engl J Med. 2016;375:2550–2560. doi: 10.1056/NEJMoa1605943. [DOI] [PMC free article] [PubMed] [Google Scholar]
- Dry JR, Pavey S, Pratilas CA, Harbron C, Runswick S, Hodgson D, Chresta C, McCormack R, Byrne N, Cockerill M, et al. Transcriptional pathway signatures predict MEK addiction and response to selumetinib (AZD6244) Cancer Res. 2010;70:2264–2273. doi: 10.1158/0008-5472.CAN-09-1577. [DOI] [PMC free article] [PubMed] [Google Scholar]
- Edgar R, Domrachev M, Lash AE. Gene Expression Omnibus: NCBI gene expression and hybridization array data repository. Nucleic Acids Res. 2002;30:207–210. doi: 10.1093/nar/30.1.207. [DOI] [PMC free article] [PubMed] [Google Scholar]
- Farley J, Brady WE, Vathipadiekal V, Lankes HA, Coleman R, Morgan MA, Mannel R, Yamada SD, Mutch D, Rodgers WH, et al. Selumetinib in women with recurrent low-grade serous carcinoma of the ovary or peritoneum: an open-label, single-arm, phase 2 study. Lancet Oncol. 2013;14:134–140. doi: 10.1016/S1470-2045(12)70572-7. [DOI] [PMC free article] [PubMed] [Google Scholar]
- Forbes SA, Beare D, Boutselakis H, Bamford S, Bindal N, Tate J, Cole CG, Ward S, Dawson E, Ponting L, et al. COSMIC: somatic cancer genetics at high-resolution. Nucleic Acids Res. 2017;45(D1):D777–D783. doi: 10.1093/nar/gkw1121. [DOI] [PMC free article] [PubMed] [Google Scholar]
- Garcia-Rostan G, Zhao H, Camp RL, Pollan M, Herrero A, Pardo J, Wu R, Carcangiu ML, Costa J, Tallini G. ras mutations are associated with aggressive tumor phenotypes and poor prognosis in thyroid cancer. J Clin Oncol. 2003;21:3226–3235. doi: 10.1200/JCO.2003.10.130. [DOI] [PubMed] [Google Scholar]
- Genetic Testing Registry. NCBI Expanded RASopathy Panel (14 Genes) https://www.ncbi.nlm.nih.gov/gtr/tests/GTR000521315/
- Goretzki PE, Lyons J, Stacy-Phipps S, Rosenau W, Demeure M, Clark OH, McCormick F, Röher HD, Bourne HR. Mutational activation of RAS and GSP oncogenes in differentiated thyroid cancer and their biological implications. World J Surg. 1992;16:576–581. doi: 10.1007/BF02067325. [DOI] [PubMed] [Google Scholar]
- Guinney J, Ferté C, Dry J, McEwen R, Manceau G, Kao KJ, Chang KM, Bendtsen C, Hudson K, Huang E, et al. Modeling RAS phenotype in colorectal cancer uncovers novel molecular traits of RAS dependency and improves prediction of response to targeted agents in patients. Clin Cancer Res. 2014;20:265–272. doi: 10.1158/1078-0432.CCR-13-1943. [DOI] [PMC free article] [PubMed] [Google Scholar]
- Haura EB, Ricart AD, Larson TG, Stella PJ, Bazhenova L, Miller VA, Cohen RB, Eisenberg PD, Selaru P, Wilner KD, Gadgeel SM. A phase II study of PD-0325901, an oral MEK inhibitor, in previously treated patients with advanced non-small cell lung cancer. Clin Cancer Res. 2010;16:2450–2457. doi: 10.1158/1078-0432.CCR-09-1920. [DOI] [PubMed] [Google Scholar]
- Ho AL, Grewal RK, Leboeuf R, Sherman EJ, Pfister DG, Deandreis D, Pentlow KS, Zanzonico PB, Haque S, Gavane S, et al. Selumetinib-enhanced radioiodine uptake in advanced thyroid cancer. N Engl J Med. 2013a;368:623–632. doi: 10.1056/NEJMoa1209288. [DOI] [PMC free article] [PubMed] [Google Scholar]
- Ho CY, Bar E, Giannini C, Marchionni L, Karajannis MA, Zagzag D, Gutmann DH, Eberhart CG, Rodriguez FJ. MicroRNA profiling in pediatric pilocytic astrocytoma reveals biologically relevant targets, including PBX3, NFIB, and METAP2. Neurooncol. 2013b;15:69–82. doi: 10.1093/neuonc/nos269. [DOI] [PMC free article] [PubMed] [Google Scholar]
- Hsu HC, Thiam TK, Lu YJ, Yeh CY, Tsai WS, You JF, Hung HY, Tsai CN, Hsu A, Chen HC, et al. Mutations of KRAS/NRAS/BRAF predict cetuximab resistance in metastatic colorectal cancer patients. Onco-target. 2016;7:22257–22270. doi: 10.18632/oncotarget.8076. [DOI] [PMC free article] [PubMed] [Google Scholar]
- Jänne PA, Shaw AT, Pereira JR, Jeannin G, Vansteenkiste J, Barrios C, Franke FA, Grinsted L, Zazulina V, Smith P, et al. Selumetinib plus docetaxel for KRAS-mutant advanced non-small-cell lung cancer: a randomised, multicentre, placebo-controlled, phase 2 study. Lancet Oncol. 2013;14:38–47. doi: 10.1016/S1470-2045(12)70489-8. [DOI] [PubMed] [Google Scholar]
- Jänne PA, van den Heuvel M, Barlesi F, Cobo M, Mazieres J, Crinò L, Orlov S, Blackhall F, Wolf J, Garrido P, et al. Selumetinib in combination with docetaxel as second-line treatment for patients with KRAS-mutant advanced NSCLC: Results from the phase III SELECT-1 trial. Ann Oncol. 2016;27(Suppl 6):vi552–vi587. [Google Scholar]
- Jessen WJ, Miller SJ, Jousma E, Wu J, Rizvi TA, Brundage ME, Eaves D, Widemann B, Kim MO, Dombi E, et al. MEK inhibition exhibits efficacy in human and mouse neurofibromatosis tumors. J Clin Invest. 2013;123:340–347. doi: 10.1172/JCI60578. [DOI] [PMC free article] [PubMed] [Google Scholar]
- Kim JW, Abudayyeh OO, Yeerna H, Yeang CH, Stewart M, Jenkins RW, Kitajima S, Konieczkowski DJ, Medetgul-Ernar K, Cavazos T, et al. Decomposing Oncogenic Transcriptional Signatures to Generate Maps of Divergent Cellular States. Cell Syst. 2017;5:105–118. e9. doi: 10.1016/j.cels.2017.08.002. [DOI] [PMC free article] [PubMed] [Google Scholar]
- Knijnenburg T, Wang L, Zimmermann MT, Chambwe N, Gao GF, Cherniack AD, Fan H, Shen H, Way GP, Greene CS, et al. Genomic and molecular landscape of DNA damage repair deficiency across The Cancer Genome Atlas. Cell Rep. 2018;23(this issue):239–254. doi: 10.1016/j.celrep.2018.03.076. [DOI] [PMC free article] [PubMed] [Google Scholar]
- Kumar-Sinha C, Chinnaiyan AM. Precision oncology in the age of integrative genomics. Nat Biotechnol. 2018;36:46–60. doi: 10.1038/nbt.4017. [DOI] [PMC free article] [PubMed] [Google Scholar]
- Lawrence MS, Stojanov P, Polak P, Kryukov GV, Cibulskis K, Sivachenko A, Carter SL, Stewart C, Mermel CH, Roberts SA, et al. Mutational heterogeneity in cancer and the search for new cancer-associated genes. Nature. 2013;499:214–218. doi: 10.1038/nature12213. [DOI] [PMC free article] [PubMed] [Google Scholar]
- Masoumi-Moghaddam S, Amini A, Morris DL. The developing story of Sprouty and cancer. Cancer Metastasis Rev. 2014;33:695–720. doi: 10.1007/s10555-014-9497-1. [DOI] [PMC free article] [PubMed] [Google Scholar]
- McCormick F. ras GTPase activating protein: signal transmitter and signal terminator. Cell. 1989;56:5–8. doi: 10.1016/0092-8674(89)90976-8. [DOI] [PubMed] [Google Scholar]
- McKinney W. Data Structures for Statistical Computing in Python. Proceedings of the 9th Python Science Conference; 2010. pp. 51–56. [Google Scholar]
- Mermel CH, Schumacher SE, Hill B, Meyerson ML, Beroukhim R, Getz G. GISTIC2.0 facilitates sensitive and confident localization of the targets of focal somatic copy-number alteration in human cancers. Genome Biol. 2011;12:R41. doi: 10.1186/gb-2011-12-4-r41. [DOI] [PMC free article] [PubMed] [Google Scholar]
- Mina M, Raynaud F, Tavernari D, Battistello E, Sungalee S, Saghafinia S, Laessle T, Sanchez-Vega F, Schultz N, Oricchio E, Ciriello G. Conditional Selection of Genomic Alterations Dictates Cancer Evolution and Oncogenic Dependencies. Cancer Cell. 2017;32:155–168. e6. doi: 10.1016/j.ccell.2017.06.010. [DOI] [PubMed] [Google Scholar]
- Ng S, Collisson EA, Sokolov A, Goldstein T, Gonzalez-Perez A, Lopez-Bigas N, Benz C, Haussler D, Stuart JM. PARADIGM-SHIFT predicts the function of mutations in multiple cancers using pathway impact analysis. Bioinformatics. 2012;28:i640–i646. doi: 10.1093/bioinformatics/bts402. [DOI] [PMC free article] [PubMed] [Google Scholar]
- O’Neil BH, Goff LW, Kauh JSW, Strosberg JR, Bekaii-Saab TS, Lee RM, Kazi A, Moore DT, Learoyd M, Lush RM, et al. Phase II study of the mitogen-activated protein kinase 1/2 inhibitor selumetinib in patients with advanced hepatocellular carcinoma. J Clin Oncol. 2011;29:2350–2356. doi: 10.1200/JCO.2010.33.9432. [DOI] [PMC free article] [PubMed] [Google Scholar]
- Oikonomou E, Koustas E, Goulielmaki M, Pintzas A. BRAF vs RAS oncogenes: are mutations of the same pathway equal? Differential signalling and therapeutic implications Oncotarget. 2014;5:11752–11777. doi: 10.18632/oncotarget.2555. [DOI] [PMC free article] [PubMed] [Google Scholar]
- Omholt K, Platz A, Kanter L, Ringborg U, Hansson J. NRAS and BRAF mutations arise early during melanoma pathogenesis and are preserved throughout tumor progression. Clin Cancer Res. 2003;9:6483–6488. [PubMed] [Google Scholar]
- Pao W, Wang TY, Riely GJ, Miller VA, Pan Q, Ladanyi M, Zakowski MF, Heelan RT, Kris MG, Varmus HE. KRAS mutations and primary resistance of lung adenocarcinomas to gefitinib or erlotinib. PLoS Med. 2005;2:e17. doi: 10.1371/journal.pmed.0020017. [DOI] [PMC free article] [PubMed] [Google Scholar]
- Pedregosa F, Varoquaux G, Gramfort A, Michel V, Thirion B, Grisel O, Blondel M, Prettenhofer P, Weiss R, Dubourg V, et al. Scikit-learn: Machine Learning in Python. J Mach Learn Res. 2011;12:2825–2830. [Google Scholar]
- Prasad V, Fojo T, Brada M. Precision oncology: origins, optimism, and potential. Lancet Oncol. 2016;17:e81–e86. doi: 10.1016/S1470-2045(15)00620-8. [DOI] [PubMed] [Google Scholar]
- Ritchie ME, Phipson B, Wu D, Hu Y, Law CW, Shi W, Smyth GK. limma powers differential expression analyses for RNA-sequencing and microarray studies. Nucleic Acids Res. 2015;43:e47. doi: 10.1093/nar/gkv007. [DOI] [PMC free article] [PubMed] [Google Scholar]
- Sanchez-Vega F, Mina M, Armenia J, Chatila WK, Luna A, La K, Dimitriadoy S, Liu DL, Kantheti HS, Saghafinia S, et al. Oncogenic Signaling Pathways in The Cancer Genome Atlas. Cell. 2018;173 doi: 10.1016/j.cell.2018.03.035. [DOI] [PMC free article] [PubMed] [Google Scholar]
- Sokolov A, Carlin DE, Paull EO, Baertsch R, Stuart JM. Pathway-Based Genomics Prediction using Generalized Elastic Net. PLoS Comput Biol. 2016;12:e1004790. doi: 10.1371/journal.pcbi.1004790. [DOI] [PMC free article] [PubMed] [Google Scholar]
- Stephen AG, Esposito D, Bagni RK, McCormick F. Dragging ras back in the ring. Cancer Cell. 2014;25:272–281. doi: 10.1016/j.ccr.2014.02.017. [DOI] [PubMed] [Google Scholar]
- Vaske CJ, Benz SC, Sanborn JZ, Earl D, Szeto C, Zhu J, Haussler D, Stuart JM. Inference of patient-specific pathway activities from multi-dimensional cancer genomics data using PARADIGM. Bioinformatics. 2010;26:i237–i245. doi: 10.1093/bioinformatics/btq182. [DOI] [PMC free article] [PubMed] [Google Scholar]
- Vauthey JN, Zimmitti G, Kopetz SE, Shindoh J, Chen SS, Andreou A, Curley SA, Aloia TA, Maru DM. RAS mutation status predicts survival and patterns of recurrence in patients undergoing hepatectomy for colorectal liver metastases. Ann Surg. 2013;258:619–626. doi: 10.1097/SLA.0b013e3182a5025a. [DOI] [PMC free article] [PubMed] [Google Scholar]
- Waskom M, Botvinnik O, Drewokane Hobson P, David Halchenko Y, Lukauskas S, Cole JB, Warmenhoven J, Ruiter JD, et al. Seaborn: V0.7.1. 2016 Jun [Google Scholar]
- Way GP, Allaway RJ, Bouley SJ, Fadul CE, Sanchez Y, Greene CS. A machine learning classifier trained on cancer transcriptomes detects NF1 inactivation signal in glioblastoma. BMC Genomics. 2017;18:127. doi: 10.1186/s12864-017-3519-7. [DOI] [PMC free article] [PubMed] [Google Scholar]
- Weinstein JN, Collisson EA, Mills GB, Shaw KR, Ozenberger BA, Ellrott K, Shmulevich I, Sander C, Stuart JM Cancer Genome Atlas Research Network. The Cancer Genome Atlas Pan-Cancer analysis project. Nat Genet. 2013;45:1113–1120. doi: 10.1038/ng.2764. [DOI] [PMC free article] [PubMed] [Google Scholar]
- Wickham H. Ggplot2: Elegant Graphics for Data Analysis. Springer; 2009. [Google Scholar]
- Wickham H, Francois R, Henry L, Müller K. R package version, 0.7.1. 2017. dplyr: A Grammar of Data Manipulation. [Google Scholar]
- Xu GF, O’Connell P, Viskochil D, Cawthon R, Robertson M, Culver M, Dunn D, Stevens J, Gesteland R, White R, et al. The neurofibromatosis type 1 gene encodes a protein related to GAP. Cell. 1990;62:599–608. doi: 10.1016/0092-8674(90)90024-9. [DOI] [PubMed] [Google Scholar]
- Zou H, Hastie T. Regularization and variable selection via the elastic net. J R Statist Soc B. 2005;67(Part 2):301–320. [Google Scholar]
Associated Data
This section collects any data citations, data availability statements, or supplementary materials included in this article.