

Abstract
OBJECTIVE
Inflammatory macrophages promote the development of atherosclerosis. We have identified the adaptor protein disabled homolog 2 (Dab2) as a regulator of phenotypic polarization in macrophages. The absence of Dab2 in myeloid cells promotes an inflammatory phenotype but the impact of myeloid Dab2 deficiency on atherosclerosis has not been shown.
APPROACH AND RESULTS
To determine the role of myeloid Dab2 in atherosclerosis, Ldlr−/− mice were reconstituted with either Dab2 positive or Dab2-deficient bone marrow and fed a western diet. Consistent with our previous finding that Dab2 inhibits NFκB signaling in macrophages, Ldlr−/− mice reconstituted with Dab2-deficient bone marrow had increased systemic inflammation as evidenced by increased serum IL6 levels and increased inflammatory cytokine expression levels in liver. Serum lipid levels were significantly lower in Ldlr−/− mice reconstituted with Dab2-deficient bone marrow and further examination of livers from these mice revealed drastically increased inflammatory tissue damage as well as massive infiltration of immune cells. Surprisingly, the atherosclerotic lesion burden in Ldlr−/− mice reconstituted with Dab2-deficient bone marrow was decreased compared to Ldlr−/− mice reconstituted with wild-type bone marrow. Further analysis of aortic root sections revealed increased macrophage content and evidence of increased apoptosis in lesions from Ldlr−/− mice reconstituted with Dab2-deficient bone marrow but no difference in collagen or smooth muscle cell content.
CONCLUSIONS
Dab2 deficiency in myeloid cells promotes inflammation in livers and atherosclerotic plaques in a mouse model of atherosclerosis. Nevertheless, decreased serum lipids as a result of massive inflammatory liver damage may preclude an appreciable increase in atherosclerotic lesion burden in mice reconstituted with Dab2-deficient bone marrow.
INTRODUCTION
Macrophages are important mediators of atherosclerosis1. Distinct macrophage phenotypes including pro- and anti-inflammatory M1 and M2 subtypes2-6 as well as Mox macrophages that develop in response to atherogenic phospholipids7-9 have been identified in atherosclerotic plaques, and phenotypic polarization of macrophages has been proposed to impact lesion development10. Decreased atherosclerosis has been observed when levels of anti-inflammatory M2 macrophages are high11-14, while shifting the balance towards more inflammatory M1 macrophages results in increased atherosclerotic lesion burden15,16. Moreover, increased numbers of proinflammatory macrophages within atherosclerotic plaques result in unstable lesions10, 17.
The mechanisms that control the phenotypic switching of macrophages are largely unknown. Recently our lab has shown that the adaptor protein disabled homolog 2 (Dab2) is a key regulator of macrophage phenotypic switching18. Dab2 expression is differentially regulated in macrophage phenotypes, with expression downregulated in proinflammatory M1 macrophages and upregulated in anti-inflammatory M2 macrophages18. Dab2 deficiency in myeloid cells resulted in increased proinflammatory gene expression and macrophage activation in mice treated with sublethal doses of endotoxin. Furthermore mice with myeloid cells deficient in Dab2 demonstrated exacerbated adipose tissue inflammation and decreased glucose tolerance when fed a high fat diet18.
Dab2 is a mitogen-responsive phosphoprotein that is highly evolutionarily conserved19. Functionally, Dab2 has been shown to regulate the trafficking of several cell surface receptors including transforming growth factor (TGF)-β receptor, cystic fibrosis transmembrane conductance regulator (CFTR), vascular endothelial growth factor (VEGF) receptor, and the LDL receptor (LDLR)20-27. Analyses of Dab2 expression in human cancers also suggest that it may function as a tumor suppressor28-32. Interestingly, Dab2 in conjunction with autosomal recessive hypercholesterolemia (Arh) protein, another endocytic adaptor protein, was shown to regulate LDLR-mediated homeostasis of circulatory cholesterol33. We have recently shown that Dab2 controls inflammatory signaling and macrophage phenotypic polarization by inhibiting the NFκB pathway via binding to TNF receptor associated factor (TRAF) 618. Given the important role of inflammatory macrophages in the development of atherosclerosis we investigated whether Dab2 in macrophages would play a role in regulating plaque burden in a mouse model of atherosclerosis. Our results show that myeloid Dab2 deficient LDLR KO mice developed massive liver inflammation and reduced serum lipids, resulting in smaller lesions, with increased macrophage content.
MATERIALS and METHODS
Reagents
LXR agonist T0901317 was purchased from Cayman Chemical. 3H-cholesterol was purchased from Perkin Elmer. Macrophage cholesterol accumulation and efflux were examined as described previously34, 35.
Animal Experiments
All animal experiments were approved by the Institutional Animal Care and Research Advisory Committee of the University of Virginia. Female C57Bl6-Ldl−/− mice were purchased from Jackson Laboratory and transplanted with bone marrow harvested from female Dab2fl/fl and Dab2fl/flLysm-Cre mice18. Female mice were used because aortic root lesions have been reported to be larger in female mice. For bone marrow transplantation, 4 wk old recipient C57Bl/6 mice received 80 mg/ml sulfmethoxazole and 0.37 mM trimethoprim in autoclaved water six days prior to receiving 2 doses of 600 RAD each, 4 hours apart (Shepard Mark irradiator). Bone marrow was harvested from tibias and femurs of donor Dab2fl/fl and Dab2fl/flLysm-Cre mice, and 2 million bone marrow cells were given to each recipient mouse by tail vein injection. Recipient mice were maintained on antibiotics (80 mg/ml sulfmethoxazole and 0.37 mM trimethoprim in autoclaved water) for four weeks to protect them from infection. Further experiments described below were begun a total of 6 weeks post irradiation and transplantation to give sufficient time for reconstitution. Mice were fed a western diet (Research Diets, # D12079B) for up to 20 weeks. Food intake was determined by obtaining serial food weights for a subset of mice from each group. Whole blood was analyzed by Hemavet (Drew Scientific) at 0 and 9 weeks of western diet. Serum was analyzed for IL6 by ELISA (Biolegend). Serum lipid analysis was performed by the University of Virginia Hospital Clinical Laboratory.
Quantification of atherosclerosis
En face analysis of aortas by Sudan IV staining and preparation of frozen aortic root sections were performed as described previously36. Aortic root sections were stained with Oil Red O, Mac2, Caspase-3, Picro-sirius Red, and Smooth Muscle a-Actin. For staining Mac2, active/cleaved Caspase3 and Smooth Muscle a-Actin the aortic root sections were incubated with anti-mouse/human MAC2 (Galectin-3) monoclonal antibody (CC8942AP, 0.1 μg/ml; Cedarlane), rabbit anti-mouse active/cleaved Caspase3 antibody (NB100-56113, Novus Biologicals) and anti-mouse a-Actin antibody (clone 1A4, 0.2 μg/ml; Santa Cruz sc-3883), respectively. Images were acquired using an Olympus CRX41 microscope with an Infinity1 camera, and atherosclerotic root sections were quantified with an image analysis system (Image Pro Plus). On each section, the vessel wall and lesions were outlined in order to determine the area of the entire vessel. For each stain, positive staining was defined by a color-cube based method in Image Pro-Plus, in which a specific range of colors represented positive staining, and this color filter was applied to all images in a uniform manner to determine the positive area within the entire vessel. The percent stained area was calculated by dividing the area of the entire vessel by the stained area. This was performed for 3 sections per animal and the mean percent staining was reported. For total lesion area, the aortic root sections were stained with hematoxylin and eosin (H&E). The images were captured with Olympus BX51 microscope and 4X objective and analyzed using Image J software. Plaque necrotic area was quantified by measuring H&E-negative acellular regions in H&E stained sections as described37.
Quantification of liver triglyceride content
Liver samples (0.1 g) were homogenized in 2 ml Folch (chloroform/methanol, 2:1, v/v) with a polytron homogenizer. The organic phase was separated and then dried under nitrogen. Samples were reconstituted in isopropranol:Triton-X100 (9:1 v/v) and aliquots subjected to colorimetric enzymatic assays for total cholesterol (Thermo Scientific) or triglycerides (Pointe Scientific).
Immunohistochemistry
Murine small intestinal paraffin sections were prepared and stained with hematoxylin and eosin (H & E) as described previously38. Liver samples were fixed in 10 % neutral-buffered formalin, dehydrated through a graded alcohol series and xylene, and then embedded in paraffin blocks. Liver tissues embedded in paraffin were sectioned at 5 μm and stained with H & E, rat anti-mouse CD3 (clone 17A2, cat#100201, BioLegend, 0.1 μg/ml), rat anti-mouse/human CD45R/B220 (clone RA3-6B2, cat# 103202, BioLegend, 0.5 μg/ml), and purified rat anti-mouse/human Mac2 (clone M3/38, cat# CL8942AP, Cedarlane, Canada, 0.1 μg/ml). Aortic root sections were stained with Mac 2 antibody (clone M3/38, Cedarlane; 0.1 μg/ml), rat anti mouse α-Smooth Muscle Actin antibody (clone1A4, 0.2 μg/ml; Santa Cruz, sc-32251) and rabbit anti-mouse Caspase 3 antibody (active/cleaved; NB 100-56113, Novus Biologicals). Rat IgG2a control (CLCR2A00, Cedarlane), rat IgG2b (RTK4530, #400666, BioLegend) and rabbit polyclonal IgG (NBP2-24891, Novus Biologicals) were used as isotype controls. All staining were performed at the University of Virginia Cardiovascular Research Center Histology Core.
Plasma lipoprotein analysis
Plasma lipoprotein levels in pooled plasma samples (100 μl, n=9/group) were separated by FPLC using a Superose G6 10/300 GL column (GE Healthcare). The column was washed with 10 mM Na2HPO4/150 mM NaCl/0.2.mM EDTA, pH 7.5 at a flow rate of 0.4 ml/minute and 0.52 ml fractions were collected. Total cholesterol was measured in each fraction by enzymatic analysis using Infinity Cholesterol Reagent (Thermo Scientific catalog # TR13421).
Oil Red O staining
For Oil Red O staining, frozen liver tissues were cut at 10 μm and were mounted on slides. Brightfield images were captured with a high magnification Olympus BX51 light microscope equipped with Olympus DP70 digital camera using UPlan F1 20×/0.50 or UPlan F1 40×/0.75 objective lenses. We collected at least 10 frames per each liver sample for data image analysis. ORO dye accumulation, which correlates with liver accumulation of neutral lipids was quantified using Image J software. Shortly, the RGD images were converted to 8-bit grayscale images to set the threshold. After image binarization and setting the scale of the image, the amount of the lipids (ORO+ area) was measured by ImageJ software and displayed as (%) of total surface area.
Flow cytometry analysis of spleens
For flow cytometry, freshly isolated spleens were gently mechanically dissociated by passage over 100 μm Falcon cell strainer. The cell suspension was treated with ammonium chloride for 5 min to remove RBC and then resuspended in FACS buffer containing PBS, 2% FBS, 10 mM EDTA, and 0.01% NaN3. Cell suspensions were blocked with anti–mouse CD16/32 followed by incubation with specific mAbs [or fluorescence minus one (FMO)] controls for 20 min at 4°C. Flow cytometry was performed on FACSCanto II flow cytometer (BD), and data were analyzed using FlowJo (Tree Star, Inc.). Antibodies for surface staining: CD19 (FITC), CD3 (PerCP-Cy5.5), CD4 (APC), and CD8 (PE) were all from BD Bioscience.
Western blotting
50 to 100 mg of liver tissue was homogenized in RIPA buffer (50 mM Tris, (pH 7.4), 150 mM NaCl, 1% NP40, 5 mM EDTA, 0.5 mM DTT, 0.2 mM PMSF) with protease and phosphatase inhibitors (both from Roche). Proteins (20 μg/lane) were separated by 10% SDS-PAGE and transferred to a polyvinylidene fluoride (PVDF) membrane (Millipore) using the Bio-Rad transfer system. Membranes were incubated for 90 min at RT with Odyssey blocking buffer (cat#927-40000, LI-COR) prior to incubation with mouse monoclonal antibodies directed against ABCA1 (2 μg/ml; ab18180, ABCAM), rabbit monoclonal against ABCG1 (0.23 μg/ml; ab52617, ABCAM), mouse monoclonal against β-actin (ascites fluid 1:5000; clone AC-15, Sigma), and rabbit monoclonal antibody against β-actin (0.25 μg/ml; cat#926-42210, LICOR) overnight at 4°C. After being washed with 0.1% Tween-20/PBS the membranes were incubated with LI-COR IRDye secondary antibodies: IRDye 680 RD goat anti-rabbit IgG (H+L) (cat#926-32221) and IRDye 800 CW goat anti-mouse IgG (H+L) (cat#926-32210) or IRDye 680 RD goat anti-mouse IgG (cat#926-3220) and IRDye 800 CW goat anti-rabbit IgG (cat#926-32211) for 60 minutes at room temperature (all diluted 1∶5000). Blots were imaged using an Odyssey Infrared Imaging System Scan resolution at 169 μm. Western blot ABCA1 and ABCG1 band intensities were quantified and normalized to internal β-actin band intensities. Quantification was performed on single channels with the Image Studio Analysis Software (LI-COR). Adherent BMDMs from Dab2fl/fl and Dab2fl/flLysm-Cre mice were seeded in 6-well plates (3 × 10⁶ cells/well) and treated for 18 hours with 10 μM T0901317. After treatment BMDMs were lysed in RIPA lysis buffer supplemented with protease and phosphatase inhibitor cocktails (Roche). Cell lysates were centrifuged at 16,000 g for 15 min at 4 °C. Total protein concentration was determined by Pierce BCA protein assay (Thermo Scientific). Proteins (20 μg/lane) in 1× LI-COR sample buffer were separated by 10% SDS-PAGE and transferred to PVDF membrane. Membrane development, analysis and quantification of ABCA1 and ABCG1 protein expression from 3 independent experiments were performed as described above for liver samples.
In vitro efferocytosis assay
Jurkat T cells were cultured in RPMI culture medium supplemented with 10 % FBS. Prior to the induction of apoptosis, the cells were labeled with 10 μM Calcein AM (Invitrogen), according to a previously described method39. In brief, Jurkat cells were suspended in PBS at 2 × 10⁷ cells/mL and incubated for 60 minutes at 37°C with Calcein AM. Cells were washed, re-suspended at 2 × 10⁶ cells/mL in serum-free RPMI culture medium. Apoptosis was induced by exposure of labeled Jurkat cells to ultraviolet (UV Strata-linker 1800) at a dose of 150 mJ. After UV irradiation, cells were cultured for 3 hours at 37°C and then use for the phagocytosis assay. The labeled apoptotic cells (5 × 10⁵) were co-cultured with BMDMs isolated from WT and Dab2-KO mice for 45 minutes at 37°C on glass bottom dishes at 1:1 ratio and uptake was imaged by confocal microscopy. The total number of macrophages and number of macrophages that have internalized green apoptotic bodies were counted using Image J software. The percentage of macrophages that ingested apoptotic Jurkat cells (efferocytosis) was measured as a percentage of macrophages that stained positive for Calcein AM (green fluorescence).
Quantitative real time PCR
RNA was isolated from cells using the RNeasy kit (Qiagen). cDNA was reverse transcribed from RNA using Bio-Rad iScript cDNA Synthesis Kit (BioRad-1708891). PCR Primers were designed using NCBI-Primer Blast (http://www.ncbi.nlm.nih.gov/tools/primer-blast); sequences are shown in Table 1. QRT-PCR was performed using the SYBR GreenER kit (Invitrogen) or SensiMix SYBR Fluorescein kit (Bioline-QT615-02). β2-microglobulin (B2M) was used for normalization. PCR efficiency was determined for each primer pair using a dilution series of a typical sample of cDNA. The relative quantification of gene expression was performed as previously described40. See Table 1 in online-only Data Supplement for primers used.
Statistics
Statistics were performed using Prism software, version 6 (GraphPad Software). A 2-tailed, unpaired Student’s t test was used to compare two groups with Welch’s correction applied if variances were not equal by F test. ANOVA with Tukey’s multiple comparison test was used for comparison of greater than two groups. Mann-Whitney U test was used for analysis of histological quantification in which values could include zero. An F test was performed in Prism to determine whether variances were similar among groups. A P value of less than 0.05 was considered statistically significant. Specific p values and statistical methods used are included in figure legends.
RESULTS
MΦDab2−/−-tp mice have increased serum IL6 and inflammatory cytokine expression in liver compared to WT-tp mice
Our lab previously generated mice which specifically lack Dab2 in the myeloid compartment (Dab2fl/fl LysMCre)18. To determine the contribution of Dab2 in myeloid-derived cells to the development of atherosclerosis, LDLR−/− mice were transplanted with bone marrow from either Dab2fl/fl mice (WT-tp) or Dab2fl/fl LysMCre mice (MɸDab2−/−-tp) and fed a western diet for up to 20 weeks. The absence of Dab2 expression in blood from MɸDab2−/−-tp mice was confirmed by qRT-PCR analysis (Figure IA in the online-only Data Supplement). MɸDab2−/−-tp mice gained slightly less weight on the western diet compared to WT-tp mice (Figure IB in the online-only Data Supplement); however, food intake was equivalent between groups (Figure IC in the online-only Data Supplement). Hemavet analysis of blood leukocyte content revealed no significant differences between WT-tp and MɸDab2−/−-tp mice after transplantation prior to western diet feeding and after 9 weeks of western diet (Figure ID and IE in the online-only Data Supplement), which indicates that there were no abnormalities in engraftment. Histochemistry of duodenal tissue sections demonstrated that there were no morphological differences or visible intestinal tissue damage (Figure IF in the online-only Data Supplement).
Based on our previous studies, we expected that the absence of Dab2 in myeloid cells would exacerbate western diet-induced inflammation18. Indeed, MΦDab2−/−-tp mice had significantly increased levels of IL6 in serum compared to WT-tp mice after 9 weeks of western diet feeding, while at 20 weeks serum IL6 levels were not significantly different between groups (Fig 1A). Expression of Il1β and Il6 mRNA progressively increased in both groups and was significantly higher in livers of MɸDab2−/−-tp mice after 20 weeks of western diet. At 9 weeks Il6 mRNA trended to be higher in livers of MɸDab2−/−-tp mice and there was no difference in Il1β levels. Tnfα mRNA trended to be higher in MɸDab2−/−-tp mice at both 9 and 20 weeks, while Ifnγ expression was not significantly different between MɸDab2−/−-tp and WT-tp mice (Fig 1B). Taken together, these data support a role of myeloid Dab2 in controlling inflammation, specifically that the absence of myeloid Dab2 predisposes mice to exacerbated hepatic inflammation during chronic high fat feeding.
Figure 1. Myeloid Dab2 deficiency exacerbates hepatic inflammation.
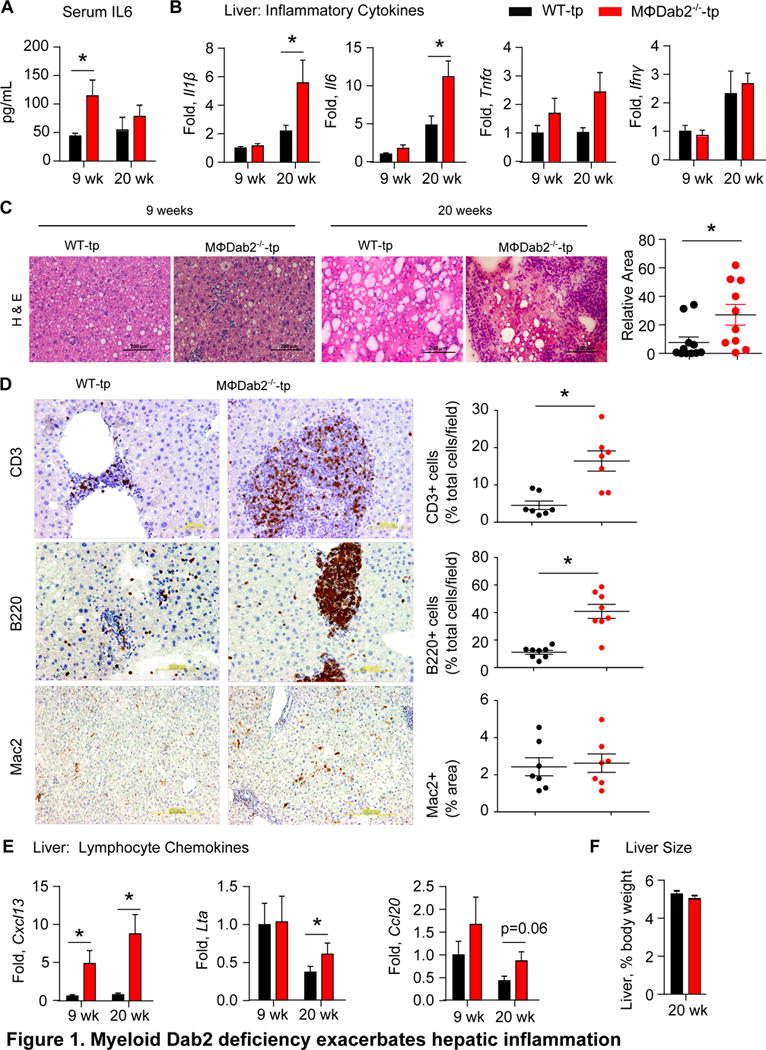
A, Serum IL6 levels were measured by ELISA in WT-tp and MɸDab2−/−-tp female mice were fed a western diet for 9 weeks (n=8 for both groups) and 20 weeks (n=12, n=10). Data are presented as mean +/− s.e.m. *p=0.037 by Student’s t-test with Welch’s correction.
B, Expression of inflammatory cytokines Il1β, Il6, Tnfα, and Ifnγ was assessed by qRT-PCR in liver tissue from WT-tp and MɸDab2−/−-tp mice fed a western diet for 9 (n=8) and 20 weeks (n=12, 10). Data is normalized to 9 week WT-tp samples and presented as mean +/− s.e.m. *p<0.001 by ANOVA with Tukey’s multiple comparison test. For A and B data points greater or less than 2 standard deviations from the mean were excluded.
C, Representative images of hematoxylin and eosin (H&E) stained section of liver from WT-tp and MɸDab2−/−-tp mice fed a western diet for 9 and 20 weeks. Scale bar represents 100 μm. Note aggregate of purple staining immune cells in the center of the 20 week MɸDab2−/−−/−-tp liver image. Quantification of relative area of aggregates in livers from mice fed western diet for 20 weeks is shown at right. Data is presented as mean +/− s.e.m. Each point represents one mouse n=12 and 10.*p=0.01 by Mann-Whitney test.
D, Immunohistochemistry was performed on liver sections from WT-tp and MɸDab2−/−-tp mice. Representative images stained for T cells (CD3), B cells (B220), and macrophages (Mac2) are shown with positive staining appearing brown. Scale bar represents 200 μm for CD3 and B220 images and 500 μm for Mac2 images. Quantification is shown on right. Presence of infiltrating T cells and B cells is shown as the percentage of positive (brown) cells of the total cell number per field of view. Quantification of Mac2 histological staining is shown as percentage of positive (brown) area. Data is presented as mean +/− s.e.m. Each point represents one mouse n=7. *p<0.006 by Student’s unpaired t-test with Welch’s correction for unequal variance.
E, Expression of Cxcl13, Lta, and Ccl20 genes involved in formation of tertiary lymphoid organs was measured by qRT-PCR in liver tissue from WT-tp and MɸDab2−/−-tp mice fed a western diet for 9 (n=8) and 20 weeks (n=12, 10). Data is normalized to 9 week WT-tp samples and presented as mean +/− s.e.m. *p<0.05 by Student’s t-test. Data points greater or less than 2 standard deviations from the mean were excluded.
F, Liver weight as a percentage of total body weight was not different between WT-tp and MɸDab2−/−-tp mice (n=12,10) fed a western diet for 20 weeks. Data is presented as mean +/− s.e.m.
MΦDab2−/−-tp mice show patches of infiltrating immune cells in livers and enlarged spleens
Hematoxylin and eosin staining of liver sections from WT-tp or MΦDab2−/−-tp mice fed a western diet revealed increased infiltration of immune cells in MΦDab2−/−-tp mice at 9 weeks and massive tissue damage and large patches of infiltrating immune cells at 20 weeks (Fig 1C). Quantification of patch area showed significantly increased area of immune cell infiltration in MΦDab2−/−-tp mice compared to WT-tp mice (Fig 1C, right panel). Immunohistochemistry of immune cell patches in livers of MΦDab2−/−-tp mice identified T cells and B cells as well as occasional macrophages (Fig 1D). There were significantly increased numbers of T cells and B cells in livers of MΦDab2−/−-tp mice compared to WT-tp mice (Fig 1D, right panels). Negative control staining included as Figure IV in the online-only Data Supplement. The mRNA levels of several chemokines involved in trafficking of T and B cells were significantly upregulated or trended to be higher in livers of MΦDab2−/−-tp mice compared to WT-tp mice, including Cxcl13, lymphotoxin-alpha, and Ccl20 (Fig 1E). These observations suggest that livers of MΦDab2−/−-tp mice were heavily infiltrated with both T and B cells in response to increased levels of chemokines. We found that spleens were drastically enlarged in MɸDab2−/−-tp mice compared to WT-tp mice fed a western diet for 20 weeks, while we observed no differences in histological appearance (Figure IIA in the online-only Data Supplement). There was no significant difference in percentages of CD19+ B cells, CD4+ T cells, or CD8+ T cells by flow cytometry analysis of spleens from WT-tp and MɸDab2−/−-tp mice (Figure IIB in the online-only Data Supplement).
MΦDab2−/−-tp mice have decreased serum lipids and liver triglycerides
Despite the significant immune cell infiltration observed in MΦDab2−/−-tp mice, liver size as a percent of total body weight was not different between the groups after 20 weeks of western diet (Fig 1F). Examination of serum lipid levels and liver lipid content showed that MΦDab2−/−-tp mice trended towards lower levels of total cholesterol and triglycerides compared to WT-tp after 9 weeks of western diet, and had significantly lower levels of total cholesterol and triglycerides compared to WT-tp mice after 20 weeks of western diet (Fig 2A). LDL cholesterol levels trended to lower levels in both 9 weeks and 20 weeks, while HDL cholesterol was not different between groups (Fig 2A). We speculated that the difference in triglycerides was due to differences in VLDL. FPLC profiling of serum lipoproteins demonstrated decreased VLDL-C in serum of MΦDab2−/−-tp mice, without a discernable difference in LDL-C or HDL-C (Fig 2B). Decreased serum VLDL could be a result of deficient hepatic VLDL production and secretion. Analysis of liver triglyceride levels revealed significantly decreased liver triglyceride content (Fig 2C) and Oil Red O staining of livers showed significantly lower neutral lipid content in livers of MΦDab2−/−-tp compared to WT-tp mice after 20 weeks of western diet (Fig 2D).
Figure 2. Decreased serum VLDL and liver triglycerides in MΦDab2−/−-tp mice.
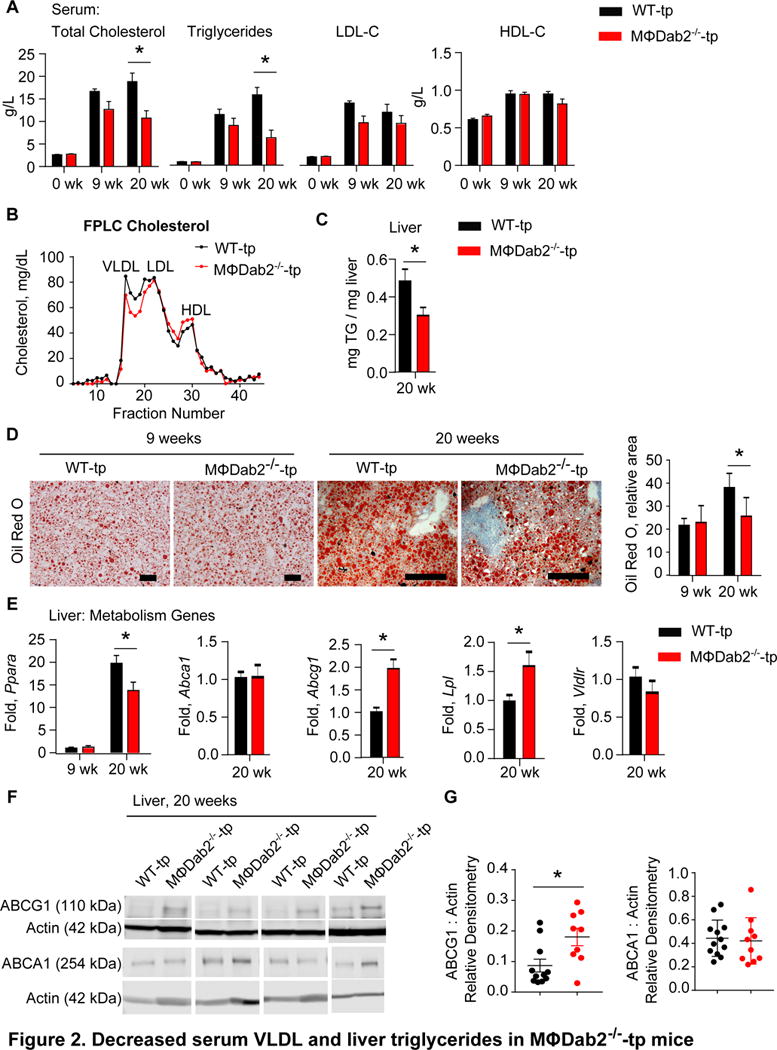
A, Serum lipids were measured in WT-tp and MɸDab2−/−-tp mice before western diet (week 0, n=20) and then 9 (n=8) and 20 (n=12 and 10) weeks after western diet. Data are presented as mean +/− s.e.m. *p< 0.004 by Student’s t-test.
B, FPLC analysis of serum from WT-tp and MɸDab2−/−-tp mice fed western diet for 20 weeks. Each line represents pooled serum samples from 9 mice.
C, Liver triglyceride content was measured in WT-tp and MɸDab2−/−-tp mice fed a western diet 20 weeks (n=12, 10). Data is presented as mean +/− s.e.m. *p=0.036 by Student’s t-test.
D, Oil Red O staining of liver sections from WT-tp and MɸDab2−/−-tp mice fed western diet for 9 and 20 weeks. Quantification at right, n=5 mice with at least 6 sections analyzed per mouse. Data are presented as mean mean +/− s.d. *p=0.02 by 1 way ANOVA with Tukey’s multiple comparison test.
E, Expression of genes involved in liver lipid metabolism Ppara, Abca1, Abcg1, Lpl, and Vldlr was determined by qRT-PCR in liver tissue from WT-tp and MɸDab2−/−-tp mice fed a western diet 20 weeks (n=12, 10). Data is presented as mean +/− s.e.m. *p<0.001 by ANOVA with Tukey’s multiple comparison test for Ppara.*p=0.0006 for Abcg1 and *p=0.03 for Lpl by Student’s t-test with Welch’s correction.
F, Western blot for Abcg1 and Abca1 protein in liver homogenates from representative WT-tp and MɸDab2−/−-tp mice fed a western diet 20 weeks with actin as loading control. Each lane represents one mouse.
G, Quantitation of Abcg1 and Abca1 protein in liver homogenates from representative WT-tp and MɸDab2−/−-tp mice fed a western diet 20 weeks. Normalized to Actin loading control. Each point represents one mouse. (n=12, 10) Data points greater or less than 2 standard deviations from the mean were excluded. Data are presented as mean +/− s.e.m. *p=0.014by Student’s t-test.
Moreover, expression of PPARα mRNA was significantly decreased and expression of Abcg1 and the gene encoding lipoprotein lipase (Lpl) were significantly increased in MΦDab2−/−-tp compared to WT-tp mice after 20 weeks of western diet, while there was no difference in Abca1 or VLDL receptor (Vldlr) expression (Fig 2E). Furthermore, we did not detect any differences in expression of genes encoding liver X receptors, Nr1h3 and Nr1h2, HMG-CoA reductase (Hmgcr), HMG-CoA synthase (Hmgcs), apolipoprotein e (Apoe), microsomal triglyceride transfer protein (Mttp), or diacylglycerol O-acyltransferase 1 (Dgat1) (Fig IIIA in the online-only Data Supplement). Abcg1 and Abca1 protein levels in livers from WT-tp and MΦDab2−/−-tp mice fed western diet for 20 weeks reflected the gene expression data with significantly increased Abcg1 protein and equivalent Abca1 protein in livers from MΦDab2−/−-tp mice compared to WT-tp mice (Fig 2F,G). It is conceivable that the increase in ABCG1 protein is reflective of increased immune cell content in livers of MΦDab2−/−-tp mice. Taken together this data suggests that decreased serum VLDL in MΦDab2−/−-tp mice may be the result of compromised triglyceride production and/or VLDL secretion in the liver.
MΦDab2−/−-tp mice develop smaller atherosclerotic lesions compared to WT-tp mice
Given the increased systemic inflammation present in MɸDab2−/−-tp mice, we expected an increased atherosclerotic lesion burden. Atherosclerotic lesion area was determined by en face staining of aortas with Sudan IV from WT-tp and MɸDab2−/−-tp mice at 9 and 20 weeks of western diet feeding. After 9 weeks of western diet feeding, there was no difference in aortic lesion area between WT-tp and MɸDab2−/−-tp mice; however, after 20 weeks of western diet feeding, MɸDab2−/−-tp mice had significantly decreased lesion area in the aortic arch region (Fig 3A). We also analyzed atherosclerotic lesion area in aortic root sections from WT-tp and MɸDab2−/−-tp mice fed a western diet for 20 weeks. Total lesion area of aortic root sections determined by hematoxylin and eosin staining was not significantly different between WT-tp and MɸDab2−/−-tp mice, and there was also no significant difference between necrotic area within lesions between WT-tp and MɸDab2−/−-tp mice (Fig 3B). However, there was a trend toward decreased area positive for Oil Red O staining in aortic root section lesions from MɸDab2−/−-tp mice compared to WT-tp mice (Fig 3C). Taken together this data show that lack of Dab2 in myeloid cells, despite causing exacerbated inflammation, does not result in increased atherosclerotic lesion burden.
Figure 3. MΦDab2−/−-tp mice have smaller but more inflamed atherosclerotic lesions compared to WT-tp mice.
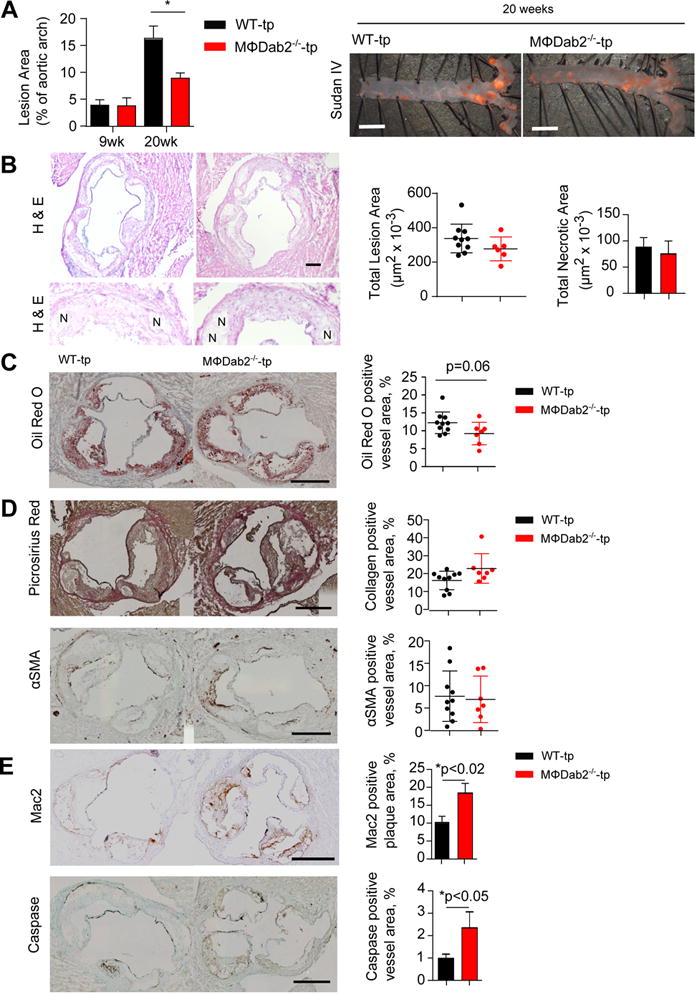
A, WT-tp and MɸDab2−/−-tp female mice were fed a western diet for 9 (n=6,8) and 20 weeks (n=12, 10). Atherosclerotic lesion area in the aortic arch region was determined by quantification of Sudan IV staining. Data are presented as mean +/− s.e.m. *p<0.05 by one-way ANOVA with Tukey’s multiple comparison test. Representative images from mice fed western diet for 20 weeks are shown at right. Scale bar represents 2mm.
B, Representative images of aortic root section from WT-tp and MՓDab2−/−-tp mice stained with H&E. Quantification of lesion area in each group of mice is shown in bar graph. Representative images of necrotic regions (N) in the aortic root lesions. Quantification of necrotic regions is shown in bar graph.
C, Atherosclerotic lesion area from WT-tp (n=12) and MɸDab2−/−-tp (n=10) female mice fed a western diet for 20 weeks was quantified in aortic root sections stained with Oil Red O. Representative images shown on left. Scale bar represents 500 μm. Quantification is shown on right. Data are presented as mean +/− s.e.m. *p=0.06 by Student’s t-test.
D, Representative images for aortic root sections at 20 weeks of WT-tp and MɸDab2−/−-tp (n=12, 10) with picrosirius red staining for detection of collagen and smooth muscle α-actin immunostaining to determine smooth muscle cell content. Quantification of collagen and SMC content per vessel based on picrosirius red and SM α-actin staining, respectively, showed no significant differences between the two chimeric groups. Data are presented as mean +/− s.e.m.
E, Representative images for aortic root sections at 20 weeks of WT-tp and MɸDab2−/−-tp (n=12, 10) with Mac2 immunostaining for detection of macrophages and caspase immunostaining to measure apoptosis within the lesions. Quantification of percent Mac2 staining per lesion and percent caspase staining of vessel area are shown at left. p<0.02 and p<0.05, respectively by 2-tailed Student’s t-test. Data are presented as mean +/− s.e.m.
Aortic root lesions of MΦDab2−/−-tp mice have increased macrophage content and caspase staining
Further characterization of aortic root lesions from WT-tp and MɸDab2−/−-tp mice fed a western diet for 20 weeks revealed that collagen content and alpha-smooth muscle actin content were similar (Fig 3D), while aortic root lesions of MɸDab2−/−-tp mice had significantly increased macrophage content as well as increased caspase staining (Fig 3E). This data suggests that although MɸDab2−/−-tp mice have decreased lesion burden, the atherosclerotic plaques contain more macrophages and apoptotic cells, indicating more active and less stable lesions.
Necrotic core content of lesions was similar between WT-tp and MɸDab2−/−-tp mice (Fig 3B). In addition to apoptosis, efferocytosis is also an important determinant of atherosclerosis41. To determine whether Dab2 deficient macrophages had differences in efferocytosis, we performed in vitro experiments with bone marrow derived macrophages and labelled apoptotic Jurkat T cells. There was no significant difference in efferocytosis between WT and Dab2 deficient macrophages (Figure IIIB in the online-only Data Supplement).
Dab2 regulates LDL receptor endocytosis and inflammatory signaling, and we investigated whether Dab2 had an impact on cholesterol handling by macrophages. There was no difference in the expression of cholesterol transport proteins ABCA1 and ABCG1 at either the mRNA (Figure IIIC in the online-only Data Supplement) or protein level (Figure IIID,E in the online-only Data Supplement) in both the absence and presence of an LXR agonist. However, when WT and Dab2 deficient bone marrow-derived macrophages were incubated with radioactive cholesterol, Dab2 deficient macrophages had a significantly higher content of radioactive cholesterol after incubation and a significantly lower percent cholesterol efflux when incubated with HDL as a cholesterol acceptor molecule (Figure IIIF,G in the online-only Data Supplement). This data suggests that decreased atherosclerotic plaque burden in MɸDab2−/−-tp mice is not due to alterations in cholesterol transport proteins in plaque macrophages. Significantly lower serum lipid levels may account for the smaller atherosclerotic lesion size, while increased inflammation likely causes higher macrophage content in lesions of MΦDab2−/−-tp mice compared to WT-tp mice.
DISCUSSION
In addition to regulating LDL- and TGFβ-receptor endocytosis42, Dab2 controls macrophage phenotypic switching, and the absence of Dab2 in myeloid cells results in predominant M1 macrophage polarization which predisposes mice to an increased inflammatory response18. Indeed, we found that serum levels of IL6 and expression of inflammatory cytokines in livers of western diet-fed Ldlr−/− mice reconstituted with Dab2 deficient bone marrow were significantly increased compared to Ldlr−/− mice reconstituted with wildtype bone marrow. We found drastically enlarged spleens and the livers of MΦDab2−/−-tp mice were heavily infiltrated with both T and B cells, likely in response to increased expression of chemokines including CXCL1343-45. We found these cells clustered into structures resembling secondary lymphoid structures. Ectopic lymphoid structures containing T and B cells have been observed in mouse livers and are more likely to organize in the setting of exuberant inflammation46. We have shown previously that Dab2 exerts control on inflammation by interacting with members of the NFκB signaling pathway18 and the expression of chemokines involved in lymphocyte trafficking such as CXCL13 involves multiple signaling pathways including the NFκB signaling pathway47. We previously showed no difference in Ly6C-high or Ly6C-lo monocyte subsets between WT and myeloid Dab2 deficient animals18 so it is unlikely that differences in monocyte subsets are contributing to differences in systemic and liver inflammation observed in the model of atherosclerosis. Possibly as a result of massive inflammatory damage, livers of MɸDab2−/−-tp mice had a significantly lower lipid content, and serum lipid levels, particularly VLDL, were also decreased compared to WT-tp mice. It has been shown that the overproduction of IL6 lowers blood lipid levels by increasing VLDL receptor expression in various tissues48. However, we detected no difference in VLDL receptor mRNA levels in livers of MɸDab2−/−-tp mice; but we observed increased expression of lipoprotein lipase in livers of MɸDab2−/−-tp mice suggesting that perhaps increased catabolism of VLDL triglycerides may contribute to decreased serum levels in addition to a lack of production due to massive inflammatory liver damage.
The increased macrophage and caspase contents in aortic root lesions from MɸDab2−/−-tp mice compared to WT-tp mice indicates exacerbated inflammation likely caused by the absence of Dab2 in macrophages18. Our expectation was that the exuberant inflammatory response in MɸDab2−/−-tp mice would result in greater atherosclerotic plaque burden as has been observed in other studies (reviewed in1); however, MɸDab2−/−-tp mice had decreased overall lesion area compared to WT-tp mice. Similarly, in an atherosclerosis model in which mice were transplanted with bone marrow null for the cholesterol transport protein ABCA1, increased apoptosis was observed in plaques, and overall lesion area was decreased49. Here we show that Dab2 also regulates cholesterol loading in macrophages, which may contribute to the inflammatory phenotype and the dynamics of lesion development and composition. It is also possible that Dab2 controls apoptosis and/or necrosis of macrophages, and that it plays a role in engulfment of apoptotic cells. Implications for a role of Dab2 in regulating survival comes from our previous studies demonstrating that Dab2 is a regulator of NFκB,18 which is a strong prosurvival mechanism.
Together, we show that myeloid Dab2 is an important regulator of liver inflammation and particularly impacts serum lipid levels and plaque growth and composition in the setting of atherosclerosis.
Supplementary Material
Highlights.
Myeloid Dab2 deficiency in LDLR null mice exacerbates hepatic inflammation.
Myeloid Dab2 deficiency in LDLR null mice results in significantly lower serum lipid levels.
Atherosclerotic lesion burden is decreased in LDLR null mice that lack Dab2 in myeloid cells.
Atherosclerotic lesions in mice that lack Dab2 in myeloid cells contain significantly more macrophages.
Acknowledgments
None
FUNDING SOURCES
This work was funded by the AHA (GIA 12GRNT12040443 to NL; 15GRNT25560038 to IGS; 14PRE20380340 to SEA) and the NIH (R01DK096076 to NL; R01HL096864 to IGS). SEA and RG were supported by an NIH Cardiovascular Training Grant T32HL007284, and SEA and SRB by a Medical Sciences Training Program T32GM007267.
Abbreviations
- ABC
ATP binding cassette transporter
- Arh
autosomal recessive hypercholesterolemia protein
- CCL
CC chemokine ligand
- CFTR
cystic firbrosis transmembrane conductance regulator
- CXCL
chemokine (C-X-C motiv) ligand
- Dab2
disabled homolog 2
- IF
interferon
- IL
interleukin
- LDLR
LDL receptor
- LXR
liver X receptor
- NFκB
nuclear factor kappa-light-chain-enhancer of activated B cells
- PPAR
peroxisome proliferator-activated receptor
- TGF
transforming growth factor
- TGFR
transforming growth factor receptor,
- TNF
tumor necrosis factor
- TRAF
TNF receptor associated factor (TRAF)
- VEGFR
vascular endothelial growth factor receptor
Footnotes
DISCLOSURES
None
References
- 1.Moore KJ, Tabas I. Macrophages in the pathogenesis of atherosclerosis. Cell. 2011;145:341–355. doi: 10.1016/j.cell.2011.04.005. [DOI] [PMC free article] [PubMed] [Google Scholar]
- 2.Leitinger N, Schulman IG. Phenotypic polarization of macrophages in atherosclerosis. Arterioscler Thromb Vasc Biol. 2013;33:1120–1126. doi: 10.1161/ATVBAHA.112.300173. [DOI] [PMC free article] [PubMed] [Google Scholar]
- 3.Mantovani A, Garlanda C, Locati M. Macrophage Diversity and Polarization in Atherosclerosis: A Question of Balance. Arterioscler Thromb Vasc Biol. 2009;29:1419–1423. doi: 10.1161/ATVBAHA.108.180497. [DOI] [PubMed] [Google Scholar]
- 4.Koltsova EK, Hedrick CC, Ley K. Myeloid cells in atherosclerosis: a delicate balance of anti-inflammatory and proinflammatory mechanisms. Curr Opin Lipidol. 2013;24:371–380. doi: 10.1097/MOL.0b013e328363d298. [DOI] [PMC free article] [PubMed] [Google Scholar]
- 5.Ley K, Miller YI, Hedrick CC. Monocyte and macrophage dynamics during atherogenesis. Arterioscler Thromb Vasc Biol. 2011;31:1506–1516. doi: 10.1161/ATVBAHA.110.221127. [DOI] [PMC free article] [PubMed] [Google Scholar]
- 6.Waldo SW, Li Y, Buono C, et al. Heterogeneity of human macrophages in culture and in atherosclerotic plaques. Am J Pathol. 2008;172:1112–1126. doi: 10.2353/ajpath.2008.070513. [DOI] [PMC free article] [PubMed] [Google Scholar]
- 7.Adamson S, Leitinger N. Phenotypic modulation of macrophages in response to plaque lipids. Curr Opin Lipidol. 2011;22:335–342. doi: 10.1097/MOL.0b013e32834a97e4. [DOI] [PMC free article] [PubMed] [Google Scholar]
- 8.Kadl A, Meher AK, Sharma PR, et al. Identification of a Novel Macrophage Phenotype That Develops in Response to Atherogenic Phospholipids via Nrf2. Circ Res. 2010;107:737–746. doi: 10.1161/CIRCRESAHA.109.215715. [DOI] [PMC free article] [PubMed] [Google Scholar]
- 9.Bobryshev YV, Ivanova EA, Chistiakov DA, Nikiforov NG, Orekhov AN. Macrophages and Their Role in Atherosclerosis: Pathophysiology and Transcriptome Analysis. Biomed Res Int. 2016;2016:9582430. doi: 10.1155/2016/9582430. [DOI] [PMC free article] [PubMed] [Google Scholar]
- 10.Tabas I, Bornfeldt KE. Macrophage Phenotype and Function in Different Stages of Atherosclerosis. Circ Res. 2016;118:653–667. doi: 10.1161/CIRCRESAHA.115.306256. [DOI] [PMC free article] [PubMed] [Google Scholar]
- 11.Chinetti-Gbaguidi G, Baron M, Bouhlel MA, et al. Human atherosclerotic plaque alternative macrophages display low cholesterol handling but high phagocytosis because of distinct activities of the PPARgamma and LXRalpha pathways. Circ Res. 2011;108:985–995. doi: 10.1161/CIRCRESAHA.110.233775. [DOI] [PMC free article] [PubMed] [Google Scholar]
- 12.Bouhlel MA, Derudas B, Rigamonti E, et al. PPARgamma activation primes human monocytes into alternative M2 macrophages with anti-inflammatory properties. Cell Metab. 2007;6:137–143. doi: 10.1016/j.cmet.2007.06.010. [DOI] [PubMed] [Google Scholar]
- 13.Singla DK, Singla R, Wang J. BMP-7 Treatment Increases M2 Macrophage Differentiation and Reduces Inflammation and Plaque Formation in Apo E−/− Mice. PLoS One. 2016;11:e0147897. doi: 10.1371/journal.pone.0147897. [DOI] [PMC free article] [PubMed] [Google Scholar]
- 14.Babaev VR, Hebron KE, Wiese CB, et al. Macrophage deficiency of Akt2 reduces atherosclerosis in Ldlr null mice. J Lipid Res. 2014;55:2296–2308. doi: 10.1194/jlr.M050633. [DOI] [PMC free article] [PubMed] [Google Scholar]
- 15.Hanna RN, Shaked I, Hubbeling HG, et al. NR4A1 (Nur77) deletion polarizes macrophages toward an inflammatory phenotype and increases atherosclerosis. Circ Res. 2012;110:416–427. doi: 10.1161/CIRCRESAHA.111.253377. [DOI] [PMC free article] [PubMed] [Google Scholar]
- 16.Ma H, Zhong W, Jiang Y, et al. Increased atherosclerotic lesions in LDL receptor deficient mice with hematopoietic nuclear receptor Rev-erbalpha knock- down. J Am Heart Assoc. 2013;2:e000235. doi: 10.1161/JAHA.113.000235. [DOI] [PMC free article] [PubMed] [Google Scholar]
- 17.Higashi Y, Sukhanov S, Shai SY, et al. Insulin-Like Growth Factor 1 Receptor Deficiency in Macrophages Accelerates Atherosclerosis and Induces an Unstable Plaque Phenotype in Apolipoprotein E Deficient Mice. Circulation. 2016;133:2263–78. doi: 10.1161/CIRCULATIONAHA.116.021805. [DOI] [PMC free article] [PubMed] [Google Scholar]
- 18.Adamson SE, Griffiths R, Moravec R, et al. Disabled homolog 2 controls macrophage phenotypic polarization and adipose tissue inflammation. J Clin Invest. 2016;126:1311–1322. doi: 10.1172/JCI79590. [DOI] [PMC free article] [PubMed] [Google Scholar]
- 19.Albertsen HM, Smith SA, Melis R, et al. Sequence, Genomic Structure, and Chromosomal Assignment of Human DOC-2. Genomics. 1996;33:207–213. doi: 10.1006/geno.1996.0185. [DOI] [PubMed] [Google Scholar]
- 20.Tsai HJ, Huang CL, Chang YW, et al. Disabled-2 is required for efficient hemostasis and platelet activation by thrombin in mice. Arterioscler Thromb Vasc Biol. 2014;34:2404–2412. doi: 10.1161/ATVBAHA.114.302602. [DOI] [PMC free article] [PubMed] [Google Scholar]
- 21.Nakayama M, Nakayama A, van Lessen M, et al. Spatial regulation of VEGF receptor endocytosis in angiogenesis. Nat Cell Biol. 2013;15:249–260. doi: 10.1038/ncb2679. [DOI] [PMC free article] [PubMed] [Google Scholar]
- 22.Madden DR, Swiatecka-Urban A. Tissue-specific control of CFTR endocytosis by Dab2. Communicative & Integrative Biology. 2012;5:473–476. doi: 10.4161/cib.21375. [DOI] [PMC free article] [PubMed] [Google Scholar]
- 23.Teckchandani A, Mulkearns EE, Randolph TW, Toida N, Cooper JA. The clathrin adaptor Dab2 recruits EH domain scaffold proteins to regulate integrin beta1 endocytosis. Mol Biol Cell. 2012;23:2905–2916. doi: 10.1091/mbc.E11-12-1007. [DOI] [PMC free article] [PubMed] [Google Scholar]
- 24.Jiang Y, He X, Howe PH. Disabled-2 (Dab2) inhibits Wnt/beta-catenin signalling by binding LRP6 and promoting its internalization through clathrin. EMBO J. 2012;31:2336–2349. doi: 10.1038/emboj.2012.83. [DOI] [PMC free article] [PubMed] [Google Scholar]
- 25.Penheiter SG, Deep Singh R, Repellin CE, et al. Type II transforming growth factor-beta receptor recycling is dependent upon the clathrin adaptor protein Dab2. Mol Biol Cell. 2010;21:4009–4019. doi: 10.1091/mbc.E09-12-1019. [DOI] [PMC free article] [PubMed] [Google Scholar]
- 26.Maurer ME, Cooper JA. The adaptor protein Dab2 sorts LDL receptors into coated pits independently of AP-2 and ARH. J Cell Sci. 2006;119:4235–4246. doi: 10.1242/jcs.03217. [DOI] [PubMed] [Google Scholar]
- 27.Hocevar BA. Regulation of the Wnt signaling pathway by disabled-2 (Dab2) EMBO J. 2003;22:3084–3094. doi: 10.1093/emboj/cdg286. [DOI] [PMC free article] [PubMed] [Google Scholar]
- 28.Hannigan A, Smith P, Kalna G, et al. Epigenetic downregulation of human disabled homolog 2 switches TGF-beta from a tumor suppressor to a tumor promoter. J Clin Invest. 2010;120:2842–2857. doi: 10.1172/JCI36125. [DOI] [PMC free article] [PubMed] [Google Scholar]
- 29.Tong JH, Ng DC, Chau SL, et al. Putative tumour-suppressor gene DAB2 is frequently down regulated by promoter hypermethylation in nasopharyngeal carcinoma. BMC Cancer. 2010;10:253. doi: 10.1186/1471-2407-10-253. [DOI] [PMC free article] [PubMed] [Google Scholar]
- 30.Karam JA, Shariat SF, Huang H, et al. Decreased DOC-2/DAB2 Expression in Urothelial Carcinoma of the Bladder. Clinical Cancer Research. 2007;13:4400–4406. doi: 10.1158/1078-0432.CCR-07-0287. [DOI] [PubMed] [Google Scholar]
- 31.Bagadi SAR, Prasad CP, Srivastava A, Prashad R, Gupta SD, Ralhan R. Frequent loss of Dab2 protein and infrequent promoter hypermethylation in breast cancer. Breast Cancer Res Treat. 2006;104:277–286. doi: 10.1007/s10549-006-9422-6. [DOI] [PubMed] [Google Scholar]
- 32.Zhou J, Hernandez G, Tu SW, et al. Synergistic induction of DOC-2/DAB2 gene expression in transitional cell carcinoma in the presence of GATA6 and histone deacetylase inhibitor. Cancer Res. 2005;65:6089–6096. doi: 10.1158/0008-5472.CAN-04-3672. [DOI] [PubMed] [Google Scholar]
- 33.Tao W, Moore R, Meng Y, Smith ER, Xu XX. Endocytic adaptors Arh and Dab2 control homeostasis of circulatory cholesterol. J Lipid Res. 2016;57:809–817. doi: 10.1194/jlr.M063065. [DOI] [PMC free article] [PubMed] [Google Scholar]
- 34.Breevoort SR, Angdisen J, Schulman IG. Macrophage-independent regulation of reverse cholesterol transport by liver x receptors. Arteriosclerosis, thrombosis, and vascular biology. 2014;34:1650–1660. doi: 10.1161/ATVBAHA.114.303383. [DOI] [PMC free article] [PubMed] [Google Scholar]
- 35.Ignatova ID, Angdisen J, Moran E, Schulman IG. Differential regulation of gene expression by lxrs in response to macrophage cholesterol loading. Molecular endocrinology. 2013;27:1036–1047. doi: 10.1210/me.2013-1051. [DOI] [PMC free article] [PubMed] [Google Scholar]
- 36.Zhang Y, Breevoort SR, Angdisen J, et al. Liver LXRalpha expression is crucial for whole body cholesterol homeostasis and reverse cholesterol transport in mice. J Clin Invest. 2012;122:1688–1699. doi: 10.1172/JCI59817. [DOI] [PMC free article] [PubMed] [Google Scholar]
- 37.Thorp E, Li G, Seimon TA, Kuriakose G, Ron D, Tabas I. Reduced apoptosis and plaque necrosis in advanced atherosclerotic lesions of Apoe−/− and Ldlr−/− mice lacking CHOP. Cell Metab. 2009;9:474–481. doi: 10.1016/j.cmet.2009.03.003. [DOI] [PMC free article] [PubMed] [Google Scholar]
- 38.Vidrich A, Buzan JM, Brodrick B, et al. Fibroblast growth factor receptor-3 regulates Paneth cell lineage allocation and accrual of epithelial stem cells during murine intestinal development. Am J Physiol Gastrointest Liver Physiol. 2009;297:G168–78. doi: 10.1152/ajpgi.90589.2008. [DOI] [PMC free article] [PubMed] [Google Scholar]
- 39.Seimon TA, Wang Y, Han S, et al. Macrophage deficiency of p38alpha MAPK promotes apoptosis and plaque necrosis in advanced atherosclerotic lesions in mice. J Clin Invest. 2009;119:886–898. doi: 10.1172/JCI37262. [DOI] [PMC free article] [PubMed] [Google Scholar]
- 40.Pfaffl MW. A new mathematical model for relative quantification in real-time RT-PCR. Nucleic Acids Res. 2001;29:e45. doi: 10.1093/nar/29.9.e45. [DOI] [PMC free article] [PubMed] [Google Scholar]
- 41.Kojima Y, Weissman IL, Leeper NJ. The Role of Efferocytosis in Atherosclerosis. Circulation. 2017;135:476–489. doi: 10.1161/CIRCULATIONAHA.116.025684. [DOI] [PMC free article] [PubMed] [Google Scholar]
- 42.Finkielstein CV, Capelluto DGS. Disabled-2: A modular scaffold protein with multifaceted functions in signaling. Inside the Cell. 2015:1–11. doi: 10.1002/bies.201670907. [DOI] [PubMed] [Google Scholar]
- 43.Li Y, Wang W, Tang L, et al. Chemokine (C-X-C motif) ligand 13 promotes intrahepatic chemokine (C-X-C motif) receptor 5+ lymphocyte homing and aberrant B-cell immune responses in primary biliary cirrhosis. Hepatology. 2015;61:1998–2007. doi: 10.1002/hep.27725. [DOI] [PMC free article] [PubMed] [Google Scholar]
- 44.Bigorgne AE, Bouchet-Delbos L, Naveau S, et al. Obesity-induced lymphocyte hyperresponsiveness to chemokines: a new mechanism of Fatty liver inflammation in obese mice. Gastroenterology. 2008;134:1459–1469. doi: 10.1053/j.gastro.2008.02.055. [DOI] [PubMed] [Google Scholar]
- 45.Hargreaves DC, Hyman PL, Lu TT, et al. A coordinated change in chemokine responsiveness guides plasma cell movements. J Exp Med. 2001;194:45–56. doi: 10.1084/jem.194.1.45. [DOI] [PMC free article] [PubMed] [Google Scholar]
- 46.Singh P, Coskun ZZ, Goode C, Dean A, Thompson-Snipes L, Darlington G. Lymphoid neogenesis and immune infiltration in aged liver. Hepatology. 2008;47:1680–1690. doi: 10.1002/hep.22224. [DOI] [PMC free article] [PubMed] [Google Scholar]
- 47.Suto H, Katakai T, Sugai M, Kinashi T, Shimizu A. CXCL13 production by an established lymph node stromal cell line via lymphotoxin-beta receptor engagement involves the cooperation of multiple signaling pathways. Int Immunol. 2009;21:467–476. doi: 10.1093/intimm/dxp014. [DOI] [PubMed] [Google Scholar]
- 48.Hashizume M, Yoshida H, Koike N, Suzuki M, Mihara M. Overproduced interleukin 6 decreases blood lipid levels via upregulation of very-low-density lipoprotein receptor. Ann Rheum Dis. 2010;69:741–746. doi: 10.1136/ard.2008.104844. [DOI] [PubMed] [Google Scholar]
- 49.Calpe-Berdiel L, Zhao Y, de Graauw M, et al. Macrophage ABCA2 deletion modulates intracellular cholesterol deposition, affects macrophage apoptosis, and decreases early atherosclerosis in LDL receptor knockout mice. Atherosclerosis. 2012;223:332–341. doi: 10.1016/j.atherosclerosis.2012.05.039. [DOI] [PubMed] [Google Scholar]
Associated Data
This section collects any data citations, data availability statements, or supplementary materials included in this article.