

Summary
Gene networks are rapidly growing in size and number, raising the question of which networks are most appropriate for particular applications. Here, we evaluate 21 human genome-wide interaction networks for their ability to recover 446 disease gene sets identified through literature curation, gene expression profiling, or genome-wide association studies. While all networks have some ability to recover disease genes, we observe a wide range of performance with STRING, ConsensusPathDB and GIANT networks having the best performance overall. A general tendency is that performance scales with network size, suggesting that new interaction discovery currently outweighs the detrimental effects of false positives. Correcting for size, we find that the DIP network provides the highest efficiency (value per interaction). Based on these results we create a parsimonious composite network with both high efficiency and performance. This work provides a benchmark for selection of molecular networks in human disease research.
eTOC Blurb
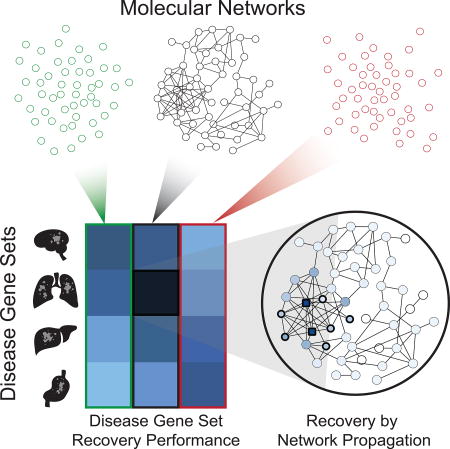
We evaluate 21 human genome-wide interaction networks for their ability to recover 446 disease gene sets. While all networks can recover disease genes, we observe STRING, ConsensusPathDB and GIANT networks having the best performance overall. Performance scales with network size, suggesting that comprehensive interaction inclusion outweighs the detrimental effects of false positives. We create a parsimonious composite network with both high efficiency and performance. This work provides a benchmark for selection of molecular networks in human disease research.
Introduction
Molecular networks capture knowledge of diverse biochemical, statistical and functional interactions that occur between genes and gene products. In a human disease setting, molecular networks augment both gene association and gene expression analysis, enabling the identification of novel genes and pathways associated with a particular disease phenotype (Carter et al., 2013). A common approach has been to leverage molecular network topology to discover new genes of interest that are functionally similar to a starting core of known disease genes (Kim et al., 2014; Lee et al., 2011; Leiserson et al., 2015; Paull et al., 2013; Qian et al., 2014; Vanunu et al., 2010). In this respect, networks enable a systematic “candidate gene approach” (Tabor et al., 2002) to the study of complex traits, in which the candidates are identified by their proximity within molecular network neighborhoods to known genes associated with a particular disease. Many of these candidates might otherwise fall beneath significance thresholds for testing individual SNPs or genes in a genome-wide association analysis.
Using these principles, networks have identified genes functioning in a spectrum of diseases, including neurodevelopmental disorders such as autism (Willsey et al., 2013) and hereditary spastic paraplegia (Novarino et al., 2014), coronary artery disease (CARDIoGRAMplusC4D Consortium et al., 2013), and hypertension (Greene et al., 2015). For example, in hereditary spastic paraplegia three disease candidates identified by network analysis, MAG, CCDC64 and REBP2, were validated as having causal variants (Novarino et al., 2014). See (Carter et al., 2013) for a review of the use of networks in the analysis of genotype-phenotype relationships.
In these types of studies, a network must first be constructed from an existing repository of molecular interactions. However, the number of these networks, as well as the number and types of molecular interactions within them, is rapidly growing. The PathGuide website at present tracks at least 550 pathway and molecular interaction databases available to the general public (Bader et al., 2006). More recently, (Yu et al., 2013) reviewed 9 major human-relevant network resources, and the Network Data Exchange (NDEx) (Pratt et al., 2015) has begun an attempt to provide a common public repository for biological network models of all types. Network databases can contain a variety of interaction types, such as protein-protein interactions, transcriptional regulatory interactions, genetic interactions, co-expression correlations and kinase/phosphatase signaling relations. They can be populated by strategies such as systematic experimental screens, literature curation and computational inference. Even accounting for the fact that most databases are tissue- and disease-context independent (Yeger-Lotem and Sharan, 2015), the diversity in molecular interaction curation and network construction methods can lead to significant differences in database content and utility for different types of analysis. As a consequence, from their very outset network biology studies must face a difficult question of determining which molecular network(s) are the most informative for the particular biological study at hand.
Here, we develop benchmarks to aid in selecting the most appropriate networks for a specific human disease or molecular pathway of interest. Using this framework, we benchmark 21 popular human gene interaction networks by their ability to recover gene sets that characterize a wide variety of diseases. We find that empirical evaluation of networks not only informs current genomic analyses, but it can also inform the creation of future networks as the importance of various sources of network information becomes clear.
Results
Human gene networks are numerous and capture a diversity of data types and sources
We obtained the complete contents of 21 popular human gene-gene interaction network databases, each of which is available for public use and described in previous publications (Table S1). We noted high diversity among these resources in types of interactions and curation methods (Figure 1). Networks such as the Database for Interacting Proteins (DIP) (Xenarios et al., 2000) and the Human Protein Reference Database (HPRD) (Peri et al., 2003) focus wholly on physical protein-protein interactions. Networks such as ConsensusPathDB (Kamburov et al., 2009) and MultiNet (Khurana et al., 2013) concatenate protein interactions from multiple molecular networks with many additional interaction types, such as genetic interactions. Meanwhile, networks such as HumanNet (Lee et al., 2011) and STRING (Snel et al., 2000; Szklarczyk et al., 2016) quantitatively integrate different studies and interaction types into a single integrated score for each gene pair based on the total weight of evidence. We also examined a pair of molecular networks each generated from a single, large-scale, high-throughput protein interaction screen (Huttlin et al., 2015; Rolland et al., 2014). Specific interaction content varied widely, even among repositories that appeared superficially similar (Figures 1 and S1). For example, HumanNet and STRING have less direct overlap in gene-gene interactions than might be expected given they use similar data types and data integration methodologies. These differences in both interaction type and coverage can give rise to large differences in network size and topological structure (Figure 1 and S1).
Figure 1. Comparative Analysis of Gene Network Resources.

The construction methods for each network are marked, along with the types of interactions they contain (yellow) for each molecular interaction network database evaluated. Interactions from the databases that are not used in our evaluation framework due to missing or embargoed data are marked with a grey X. The two interaction networks generated from single, large-scale, high-throughput experiments are marked with red dots. Pairwise similarity of all evaluated networks reveal differences in network edges (red gradient, edge-wise Jaccard index) and network propagation behavior due to varying topologies (blue gradient). Network sizes are shown by numbers of nodes (genes, green bars) and edges (interactions, purple bars). See also Figure S1 and Table S1.
A benchmark for evaluating networks based on gene sets
To benchmark these networks, we developed an approach to score how well each network is able to recover a diverse collection of disease-associated gene sets (Figure 2A–C, STAR Methods). Each gene set was randomly split into two equally-sized subsets. We then calculated the ability of one subset to recover the other within the network, using the technique of network propagation under the random walk with restart model (Köhler et al., 2008). Models were constructed to select optimal parameter values used in the sub-sampling and network propagation steps (Figure 2D–E, STAR Methods). The random walk with restart model is a common technique used for network propagation. While other variations of variations of network propagation, such as heat diffusion, could be used to evaluate networks, previous studies have found that there is no appreciable difference between these variations for most tasks (Köhler et al., 2008; Lee et al., 2011; Paull et al., 2013; Vanunu et al., 2010). After network propagation, recovery was scored using the Area Under Precision-Recall Curve (AUPRC). The average AUPRC over repeated trials was calibrated against a null distribution of AUPRC scores from networks in which individual edges had been shuffled preserving node degrees. Comparison to this null distribution allowed the AUPRC to be expressed as a z-score (Rousseeuw and Croux, 1993), henceforth called the network’s “performance score”.
Figure 2. Set-Based Network Evaluation.

(A) A gene set of interest is sub-sampled (with proportion p) on the molecular network. Each sub-sample of genes is then propagated over the network of interest (with network propagation coefficient ɑ) to recover the remaining genes in the gene set. (B) The area under the precision-recall curve (AUPRC) is calculated to measure the performance of this recovery task. (C) For each network, a set of null models is created by shuffling network edges (while preserving node degree) and repeating steps (A) and (B). The final network performance metric on this gene set is the improvement over the distribution of the null models’ AUPRCs. (D) The subsampling rate p of each gene set was set by a function of the number of genes from the gene set also found in the network. We determined this relationship by fitting the log10-adjusted gene set coverage in the network versus the optimal sampling rate for recovering the mSigDB gene sets (Liberzon et al., 2011). (E) Similarly, the optimal amount of network propagation (ɑ) was fit by a linear model on the log10-adjusted number of edges in the network. For additional details see STAR Methods.
This framework was applied to evaluate the 21 networks for recovery of 446 disease-associated gene sets from the DisGeNET database (Piñero et al., 2015, 2016), which is based on text mining of MEDLINE abstracts (Figure 3A, henceforth called “literature gene sets”, Data S1A). We observed that all networks significantly outperformed their corresponding null models on at least 220 of the literature gene sets (49%), while 118 gene sets (26%) were recovered (at Bonferroni corrected p-value <0.05) by all 21 networks (Figure 3B). For recovering these literature gene sets, we found that STRING had the best overall performance (Figure 3A).
Figure 3. Molecular Network Recovery Performance of Literature Gene Sets.

(A) The network performance score (purple) on 50 selected literature gene sets. (B) The proportion of all 446 literature gene sets versus the number of networks have performed significantly better than their null networks via the network performance score (Bonferroni corrected p-value<0.05). (C) Network performance gain for 50 literature gene sets as shown in (A). This value represents the effect size of the improvement in gene set recovery performance due to using real networks over scrambled null networks. (D) The log10-adjusted network performance score of molecular networks compared to the log10-adjusted network performance score gain by the molecular networks over their respective null molecular networks recovering the literature gene sets. (E) Network size-adjusted performance scores for 50 literature gene sets as shown in (A). The columns (networks) in heatmaps (A), (C), and (E) are sorted by the average rank of the metric being measured (green rows). (F) The average ranked performance of each molecular network on the recovery of the expression gene sets compared to the log10-adjusted number of interactions in the molecular networks. The error bars are one standard deviation of the ranked network performances across the tasks. The methods to calculate the described metrics above (network performance score, network performance gain, network size-adjusted performance score, and average ranked performance) are described in the STAR Methods. See also Figure S3, Figure S4 and Data S1.
We also wanted to confirm that our network evaluation method was not simply scoring a network’s ability to separate disease genes from non-disease genes, but rather its ability to recover specific gene sets. Therefore, we also measured network recovery of the literature gene sets when using a background of only disease genes. We found that these results using a different background were very similar to those obtained when using all genes (Figures S2 and S3). We were also concerned that the null models might have low variance, in which case a network’s performance (z-score) could be high without a large effect size. Therefore, we also calculated an effect size metric, called the “performance gain”, to address this concern (Figure 3C, STAR Methods). This metric was highly correlated with the performance score (Pearson’s R=0.88, p<1.0×10⁻¹⁶) with 58% of the tasks having performance gains of over 50%, confirming that many networks have large effect sizes on the gene recovery tasks (Figure 3D).
Larger networks have improved performance
In these results, we noticed that many of the larger networks appeared to be the best performing. We thus examined how performance rankings change when correcting each network’s performance for the number of interactions in the network (Figure 3E, STAR Methods). We found that the smallest network (DIP) moved to the top of the network-size adjusted rankings, suggesting that, per edge, this network is most efficient. The number of interactions in a network was strongly predictive of its overall average rank in recovery of the literature gene sets (Pearson’s R=0.88, p=1.7×10⁻⁷) (Figure 3F). The full numeric results of network performance, performance gain and size-adjusted network performance are given in Data S1B–D.
We also attempted to determine if other network properties, such as the type of molecular interaction or method of network construction, were correlated with performance. For this purpose we encoded network type descriptors (columns in Figure 1) into a binary vector describing each network and performed ANOVA on the size-adjusted performance. Beyond network size, however, we did not find any additional network properties that significantly correlated with performance in recovery of disease gene sets (Table S2).
Assessing the influence of literature bias
Although no particular type of molecular interaction significantly correlated with network performance, we next asked whether networks that used co-citation information have an unfair advantage over other networks on the literature gene set recovery task. Specifically, some of the co-citation information used in STRING and HumanNet had been determined by mining a compendium of MEDLINE abstracts (Lee et al., 2011; Szklarczyk et al., 2016), which we considered might be similar to how the literature gene sets were mined by DisGeNET (Piñero et al., 2015, 2016). To test the degree to which literature curation might bias our performance results, we removed all interactions in STRING and HumanNet that were based solely on text mining. This filter removed 634,062 of 5,135,768 interactions (12.3%) in STRING and 4,631 of 475,959 interactions (1.0%) in HumanNet. We found that this filtering greatly reduced the performance of HumanNet relative to other networks (Table S3), suggesting that co-citation of genes in MEDLINE abstracts were an important driver of its performance. In contrast, such filtering did not greatly affect the performance of STRING.
As additional controls, we also evaluated all networks on two collections of gene sets which had been constructed independently of literature-mining or other information that could influence network construction. The first of these was a collection of nine expression-based cancer gene sets. These gene sets were derived from a single high-throughput mRNA expression profiling study in an unsupervised manner without any network or literature-based gene selection and were found to correspond with well-known oncogenic pathways (Kim et al., 2017). Furthermore, this study was published very recently, making it impossible for any of the networks to use information from these gene sets. While STRING had the best overall performance for recovering the literature gene sets, we found that GeneMANIA and GIANT were the best performing networks on these expression gene sets, with STRING ranking third. In general, however, we found that the overall rankings of networks between the literature and expression recovery tasks were correlated (Pearson’s R=0.60, p=3.7×10⁻³) (Figure 4A). We also observed that performance gain was correlated with performance score (Figure S4A, Pearson’s R=0.89, p<1.0×10⁻¹⁶) and network performance was correlated with network size (Figure S4B, Pearson’s R=0.62, p<2.8×10⁻³).
Figure 4. Literature-Independent Gene Set Recovery Correlates with Literature Gene Set Recovery.

(A) The average ranked performance of molecular networks recovering literature gene sets is correlated with their average ranked performance on the recovery of expression gene sets (red) (B) as well as their average ranked performance on the recovery of GWAS gene sets (green). The calculation to determine the average ranked performance of a molecular network on a collection of gene sets is described in the STAR Methods. See also Figure S4 and Data S1.
As a second control against literature curation bias, we evaluated each molecular network against 11 gene sets derived from the GWAS Catalog (MacArthur et al., 2017). These gene sets had been constructed from experimental genome-wide association studies (GWAS) of a common disease or trait: nine gene sets were associated with a disease (e.g. Crohn’s Disease or Type 2 Diabetes) and two gene sets were associated with a complex trait (height or body mass index). The genetic loci discovered in these studies had been associated with disease phenotype without any prior expectation from the literature (although one cannot entirely rule out the possibility that literature may have been used to distinguish among multiple candidate genes at a locus). Nonetheless, we found that the performance of the 21 networks on the GWAS gene sets was highly correlated with performance on the literature gene sets (Pearson’s R=0.89, p=5.7×10⁻⁸) (Figure 4B). Performance on the GWAS gene sets was also correlated to the performance gain metric (Figure S4C: Pearson’s R=0.94, p<1.0×10⁻¹⁶), as well as the network size (Figure S4D: Pearson’s R=0.74, p=1.0×10⁻⁴). The gene sets and full numeric results of network performance, performance gain and size-adjusted network performance for the expression and GWAS gene sets are given in Data S1E–L.
Integrating networks improves gene set recovery
Given the good performance of molecular networks that are large and inclusive, we considered that these separate resources might be further improved by combining them to form a single composite network. We explored several approaches for creating this composite, as follows. First, we created a series of composite networks of increasing size, by progressively aggregating individual networks in order of their performance scores in literature gene set recovery (Methods, Table S4). However, such composite networks did not increase performance, regardless of how many individual networks were added together (Figure 5A, Data S1M). Next, we created a series of composite networks of decreasing size, by requiring interactions to be present in ever greater numbers of individual networks (Table S5). By requiring a minimum of two networks supporting each interaction, the performance was significantly improved over the best individual network (STRING) despite having a much smaller network size (Figure 5B–C). This configuration was optimal, since further increasing the minimum number of supporting networks beyond two resulted in a degradation of performance (Figure 5B, Data S1M). This optimal configuration we call the “Parsimonious Composite Network” (PCNet).
Figure 5. Composite Networks Can Gain Performance Despite Smaller Size.

(A) Composite network average performance gain across all 446 literature gene sets compared to STRING (blue line) and composite network size (red line) for additive composite networks and (B) parsimonious composite networks. All error bars are 95% confidence intervals on the average performance gain for a given composite network. PCNet, the parsimonious network with at least two networks supporting each edge, achieved the highest performance, despite having less edges than STRING. The blue dotted line in (A) and (B) represents the performance gain of STRING against itself on the literature gene set recovery task (no gain) and the red dotted line in (A) and (B) is the network size of STRING. See STAR Methods for additional details on how to construct the composite networks. (C) The average performance gain of PCNet across all 446 literature gene sets as compared to each of the 21 selected molecular networks. All error bars are 95% confidence intervals on the average relative gain in performance for PCNet against a given molecular interaction network. (D) The percentage of interactions in PCNet that are found in each of the 21 selected molecular networks. (E) The number of interactions from each of the 21 networks that are supported by exactly one other network in PCNet. The grey dotted line represents the total number of edges in PCNet supported by exactly 2 network sources (1,830,145 interactions). (F) The percentage of interactions from each of the 21 selected molecular networks that can be found in PCNet. See also Data S1.
Many of the interactions from the larger networks were not contained within PCNet, implying that these larger networks contain interactions not reproduced elsewhere (Figure 5D–E). On the other hand, several of the smaller networks had almost all of their interactions covered by PCNet (Figure 5F). Thus, while large networks generally associate with high performance in gene set recovery, carefully designed small networks can efficiently achieve equal or better performance.
A simple explanation for how a smaller network (e.g. PCNet) can lead to increased performance is that it concentrates interactions among genes of the same disease and, conversely, depletes interactions among unrelated genes. To test this hypothesis, we performed a case study of four different networks: a protein-protein interaction network derived from a single experimental study (BioPlex, Figure 6A), a much larger network integrating many different studies (STRING, Figure 6B), the maximal composite network containing the union of interactions from all 21 individual networks (Figure 6C), and, finally, the PCNet parsimonious composite network (Figure 6D). In each case, we examined the relationship between a network’s interaction density within members of a disease gene set and the performance of recovering that gene set. For all four networks, we found that interactions were greatly enriched among known disease genes, with STRING and PCNet showing by far the greatest enrichment (Figure 6E). Moreover, this interaction enrichment was well correlated with performance in gene set recovery (Figure 6F). Thus, density of interactions among disease genes is indeed an important indicator of network performance.
Figure 6. Increased Interaction Density in Relevant Network Neighborhoods Improves Gene Set Recovery.

Interactions among genes associated with the same disease, Pancreatitis, as contained in (A) BioPlex, (B) STRING, (C) the union of all networks, (D) and the Parsimonious Composite Network (PCNet). For each of these the (E) quantitative enrichment of interactions is shown among genes associated with five representative diseases. (F) Scatterplot of gene set recovery performance versus the within-disease enrichment for interactions.
Discussion
Given that the compositions and topologies of popular molecular networks vary greatly (Figure 1), a key question is whether these differences impact downstream studies of disease, and if so, how much? Here we have found that the choice of network can matter greatly. A particularly revealing example is the case of the Lymphopenia gene set, for which the performance gap was a factor of >5000× between the networks with highest and lowest performance (Data S1B). In other instances, the choice of network appears less important, such as in the Measles gene set where the gap in performance was <5× (Data S1B) as measured by performance gain. This variation highlights not only the importance of evaluating networks globally, but in matching the correct network to the disease of interest. When studying a particular disease, one might start with the networks that performed best on that particular gene set, instead of or in addition to the networks that were the best performers overall (Data S1B).
The result that larger networks outperform smaller ones, as a general trend, supports the continued investment in high throughput discovery of biological interaction networks. At the same time, we were able to derive a much smaller PCNet that outperformed a network twice its size on the literature gene set recovery tasks (Figure 5B). This observation suggests at least one straightforward method of contracting the size of a reference network without sacrificing performance: requiring multiple database support for interactions. Moving forward, the principle of network expansion by introduction of new data, followed by network contraction by independent verification, may provide general guidance for network construction. This principle also highlights the importance of cooperation between multiple approaches to network creation and the continued need for community development of human molecular interaction maps.
While systematic, we acknowledge that the evaluation framework used here is but one of several that might have been employed. Random walk with restart, although common, is not the only network distance metric appropriate for molecular networks. Alternate possibilities include diffusion state distance (Cao et al., 2014; Vandin et al., 2011), among others. More broadly, one might employ completely different network analytical engines, such as using networks as priors or regularization constraints for machine learning approaches (Hill et al., 2016; Sokolov et al., 2016) or as the underlying structure for probabilistic graphical models (Vaske et al., 2010). Establishing the generality of our results across a broader selection of network analysis approaches remains for future work.
As ever greater numbers of protein interactions are mapped and verified across a range of biological contexts, database curators will continue making decisions on how and which molecular interactions should be incorporated. This work provides a proof-of-principle for how any network database, or interaction subset, may be evaluated and compared. We hope that the systems biology community will continue to develop other complementary, and especially data-driven, methods of network evaluation to complement to the present approach.
STAR★Methods
CONTACT FOR REAGENT AND RESOURCE SHARING
Further information and requests for resources and reagents should be directed to and will be fulfilled by the Lead Contact, Trey Ideker (tideker@ucsd.edu).
METHOD DETAILS
Raw network data processing
To normalize all networks for comparison, we filtered out all interactors that were not human protein coding genes. Then, the interactors were all mapped to HUGO Gene Symbols using MyGene.Info (Wu et al., 2013; Xin et al., 2016). We kept only interactions where both interactors were mapped to a HUGO Gene Symbol. Many orthologous protein interactions and interactions between human proteins and small molecules/non-human proteins were also removed from analysis. We then removed redundant- and self-interactions in each of the 21 molecular networks. No other filters were applied to the networks except for the GIANT network. For GIANT, we downloaded the file of the top functional interactions across all tissues and filtered the network for only the top 10% of interactions by functional interaction score to extract a network that was comparable in size to the other networks.
Network propagation
Network propagation requires a network and some nodes from that network as input. In this case those nodes represent a sub-sample of genes from a gene set of interest. These nodes were given some initial value (1 in this case), then a smoothing propagation process was applied to those initial values, passing some of the value to neighboring nodes. In this paper, the nodes are genes, and the edges represent various types of functional relationships between genes. These interactions include, for instance, protein binding interactions, transcriptional regulation and signaling by phosphorylation.
We employed a random-walk with restart model as our network propagation method. We used a closed-form version of the method as described by the HotNet2 paper (Leiserson et al., 2015):
| (Equation 1) |
In this formulation, α is the propagation constant, or random walk probability, Anorm is the degree-normalized adjacency matrix, and F0 is the initial binary vector over all genes indicating which genes in the network are in the initial subset of a gene set (Leiserson et al., 2015). Finally, F is a real-valued vector describing the network-smoothed values over all of the nodes in the network (called the “propagation score”). For the purpose of this paper, all networks were treated as undirected simple graphs. If there are multiple connected components in the network being smoothed, each connected component was propagated independently and the results of each connected component concatenated.
Gene set selection for network evaluation
Three collections of gene sets were downloaded as standards to evaluate networks against. The first collection of gene sets was downloaded from the DisGeNET website (http://www.disgenet.org). We used the “BeFree gene-disease associations,” which is a collection of text-mined disease-associated gene sets mined from a collection of MEDLINE abstracts (Piñero et al., 2015, 2016). These gene sets were chosen to remove as much human curation bias as possible from the gene sets. The gene sets were then filtered to only the gene sets that contained less than 300 genes and contained at least 20 genes in each network studied. This yielded a collection of 446 gene sets from DisGeNET referred to as “literature gene sets”.
We also evaluated the networks on two additional collections of gene sets that were constructed independently from the literature gene sets and molecular networks. The first literature-independent collection of gene sets were acquired from a recent Cell Systems paper that determined the pathways involved in treatment response in RAS-induced cancer cell lines (Kim et al., 2017). The authors in this paper defined 9 oncogenic transcriptional components ranging in size from 50–122 genes, each centered on different common cancer pathways. We refer to these sets as “expression gene sets”.
The second literature-independent collection of gene sets was derived from the GWAS Catalog (MacArthur et al., 2017). The GWAS Catalog is a large database of significant SNP-trait associations. We defined each gene set as the genes mapped to significantly disease associated SNPs, with one gene set per trait. We kept only the gene sets that had between 20 and 500 genes present in all 21 networks. Of these, we eliminated gene sets that were unlikely to be generalized outside of the particular study context (e.g. blood cell count, resting heart rate), and kept the 9 gene sets associated with disease and 2 gene sets associated with easily observable quantitative traits: height and body mass index.
Network Evaluation Method
The set-based network evaluation method for a molecular network’s ability to recover disease-associated gene sets was performed with the following steps:
Identify a gene set of interest on the molecular interaction network.
Sub-sample a proportion (~30–60%, see “Propagation and sub-sampling parameters”) of the gene set of interest (Figure 2D).
Propagate this sub-sample of genes from (2) using the random walk model across the molecular interaction network (Hofree et al., 2013; Leiserson et al., 2015; Vanunu et al., 2010) (Figure 2E).
Sort all genes in the network by propagation score and then sweep this list to calculate a precision-recall curve of the list for recovering genes from (1) not contained in (2).
Calculate the area under the precision-recall curve (AUPRC) from (4).
Repeat (2–5) for 50 different sub-samples of the gene set of interest and average these values. This averaged AUPRC is the raw measure of performance for a given molecular network on clustering a gene set of interest.
Repeat steps 1–6 for 50 degree-preserved shuffles of the network on the same gene set of interest to construct a null distribution of average AUPRC values.
Calculate the robust Z-statistic (Rousseeuw and Croux, 1993) using the null distribution of average AUPRC values from (7) of the actual network’s performance on the gene set of interest. This is the performance score of a network for a particular gene set.
Accounting for literature mined interactions
Recognizing the possible effect of co-citation information in both STRING (https://string-db.org/) and HumanNet (http://www.functionalnet.org/humannet/about.html), we removed all interactions in these networks that were supported exclusively from text-mined sources in human studies in these networks. However, we did keep edges with evidence from exclusively text-mined evidence in non-human studies since this evidence was not used for the literature gene sets. These filtered networks were then evaluated using our set-based evaluation method and re-ranked in the context of the performance of the other unmodified networks (Table S4). It is also important to note that the remaining network containing co-citation information, ReactomeFI, does not directly contain information mined from MEDLINE abstracts, nor does its publicly available database indicate which interactions are exclusively determined with literature text mining (Wu et al., 2010). Therefore, we did not perform any interaction filtering and re-evaluation on ReactomeFI.
Composite network analysis
We constructed two sequences of composite networks to study the effect of combining networks on performance. The first sequence of composite networks increases in size starting with the best performing network across the literature gene sets, STRING. Each subsequent composite network was made by adding all unique edges from the next best performing network on the literature gene sets (Figure 5A and Table S4). Then we created a sequence of parsimonious composite networks of decreasing size by requiring increased support of each edge, starting with the additive composite network containing the union of all edges from the 21 networks (Figure 5B and Table S5). The performance of both sequences of composite networks were then evaluated on the same literature gene sets. We found that the network constructed out of edges with at least 2 network sources outperformed STRING on the literature gene sets, and we refer to this network as PCNet.
QUANTIFICATION AND STATISTICAL ANALYSIS
Calculating network topology similarity
We compared the 21 molecular networks to each other with two similarity metrics, one based on the number of shared network edges and one based on the network topology by propagation (Figure 1). To determine the network similarity by shared network edges, we first took the intersection of nodes between the two networks being compared. Then all edges between this set of nodes in both networks were taken to create a subgraph of both networks. The Jaccard index of the number of shared edges between these two subgraphs was then taken as a the network edge similarity. In order to measure the similarity of network topology by propagation, we again took the intersection of nodes between the two networks. Then, each one of these nodes was propagated (Equation 1) across the entire network and we measured the similarity between the propagation scores across all shared nodes by Spearman correlation. The average similarity across all shared nodes between any two networks was the final network topology-by-propagation similarity measure.
Propagation and sub-sampling parameters
In order to calibrate the network propagation method, we constructed a model to estimate the optimal propagation constant (α, Equation 1) as well as a reasonable sub-sampling proportion to use to optimize cohort recovery. In order to establish these parameters, we tested the performance of the 21 networks on recovering the 50 Hallmark MSigDB pathways (Liberzon et al., 2011) so as not to contaminate the parameter selection with the literature gene sets that were used in the actual benchmark. We examined a range of sub-sampling proportions and propagation constants to identify which values for these parameters yields the best results (Figure 2D–E). First, we averaged the resulting network performance scores for each propagation constant α (from 0.05 to 0.95 in increments of 0.05) and fit a model to determine the best sub-sample proportion p for each gene set based on the coverage of that gene set in the network (Figure 2D). Then, using our model for determining p, we fit a second model to determine the optimal α such that the networks had the best performance on recovering the MSigDB Hallmark gene sets. These α constants for each network were then compared against various network properties. We found that a the optimal α constant for each network was predicted by a linear model against the log10-adjusted number of interactions in the network (Figure 2E). These two linear models are then used to set the α constant and sub-sample proportion for all subsequent network evaluation tasks. Note that the determination of these parameters was based on gene sets that were not used in any other evaluation, so overtraining of these parameters is not an issue in our evaluation framework.
Network performance ranks
Three network performance metrics are used here (Figure 3). In order to derive each of these metrics, we compared against a background of degree matched null networks that were created by shuffling the network edges while preserving node degree. We defined the performance score as the robust z-score of the true AUPRC of the gene set recovery task as compared to the background of AUPRCs from the degree matched null networks (Figure 3A). To determine the network rankings by an effect size metric, we defined the performance gain as the difference between the AUPRC of a given network and the median AUPRC of its null networks divided by the median AUPRC of its null networks (Figure 3C). In order to calculate the size-adjusted performance, a linear model was fit to the performance scores of each task against the log10-adjusted network interaction count. The residual values for each performance score were calculated against their respective size-adjusted performance models (Figure 3E).
All networks were ranked on each of these metrics individually for each task in each collection. The overall rankings were determined by the average rank of each network across all tasks in each collection. This value is described as the average ranked performance of a network. The average ranked performance gain as well as the average ranked network size-adjusted performance are calculated in the same manner as the average ranked performance using their respective metric.
Network size-adjusted performance ANOVA Model
In order to determine if any specific network properties were correlated with network performance, we constructed an ANOVA model using the statsmodel package in Python (Seabold and Perktold, 2010). The construction method for each network, along with the types of interactions they contain were considered as independent categorical variables (columns marked with yellow in Figure 1, with the exception of column titled “Physical”). Each column where a network has a yellow indicator without a grey “X” in it was given 1 for that variable and given 0 otherwise. We then used all 14 of these variables to construct a model for predicting the averaged ranked network size-adjusted performance of each network. The formulation of the ANOVA model is as follows:
The resulting ANOVA summary table then gave the strength and significance of the explanation of the network size-adjusted performance by any of the network properties we examined (Table S3, Table S4).
DATA AND SOFTWARE AVAILABILITY
Many of the functions written to perform the network evaluation are contained within an installable Python 2.7 package at https://github.com/huangger/Network_Evaluation_Tools. Documentation and examples of how to evaluate a molecular network for a given collection of gene sets are provided as both Jupyter notebooks and an executable command line script. All of the networks were processed using Jupyter Notebooks also available via this project’s Python package Github repository. The Jupyter Notebooks also should contain the download link for network source data for processing. The raw molecular interaction data used is also described in the Key Resources Table for website links and Table S1 for version numbers and database references. The gene name-normalized networks as well as some of our composite networks are available in collections on NDEx(Pillich et al., 2017; Pratt et al., 2015) http://www.ndexbio.org/#/networkset/e8ebbdde-86dc-11e7-a10d-0ac135e8bacf?accesskey=7fbd23635b798321954e66c63526c46397a3f45b40298cf43f22d07d4feed0fa.
Supplementary Material
Data S1. The tabs in this file are a collection of spreadsheets presenting the gene sets in each of the three collections of gene sets (literature, expression and GWAS) as well as full numeric values of molecular network performance score, performance gain and size-adjusted performance across all gene sets (as presented in Methods) for each collection of gene set recovery tasks. Composite network performance scores on the literature gene sets are also presented here. These data are related to Figure 3, Figure 4, Figure 5 and Figure S4.
Data S1A: Literature gene sets
Data S1B: Molecular network literature gene set performance scores
Data S1C: Molecular network literature gene set AUPRC performance gains
Data S1D: Molecular network literature gene set network size-adjusted performance scores
Data S1E: Expression gene sets
Data S1F: Molecular network expression gene set performance scores
Data S1G: Molecular network expression gene set AUPRC performance gains
Data S1H: Molecular network expression gene set network size-adjusted performance scores
Data S1I: GWAS gene sets
Data S1J: Molecular network GWAS gene set performance scores
Data S1K: Molecular network GWAS gene set AUPRC performance gains
Data S1L: Molecular network GWAS gene set network size-adjusted performance scores
Data S1M: Composite network literature gene set performance scores
Highlights.
We present a benchmarking method for molecular networks recovering disease gene sets
STRING had the best overall performance out of 21 biological network databases
We constructed a composite network and improved performance over any single network
Acknowledgments
This project was supported by grants from the National Institutes of Health to T.I. (U24 CA184427, R01 GM070743, P41 GM103504 and U54 GM085764), P.T. (P30 CA023100, R01 CA154480 and R01 CA121941), J.K.H. (T32 GM008806) and M.K.Y. (T32 GM008806, OT3 TR002026). This project was also supported by a grant from DARPA to D.E.C. (W911-NF-14-1-0397).
We would also like to acknowledge all of the labs and consortiums involved in the continued development and maintenance of all of the network databases we used in this study: Biomoecular Interaction Database (BIND), Biological General Repository for Interaction Datasets (BioGRID), Biophysical Interactions of ORFeome-based comPLEXes network (BioPlex), ConsensusPathDB, Database of Interacting Proteins (DIP), Genome-scale Integrated Analysis of gene Networks in Tissues (GIANT), GeneMANIA, High-quality INTeractomes (HINT), Human Protein Reference Database (HPRD), the Human Interactome Project (now The Human Reference Protein Interactome Mapping Project), HumanNet, iRefIndex, Intomics (InBio Map), IntAct, Mentha, MultiNet, Pathway Interaction Database (PID), Pathway Commons, Reactome (and Reactome Functional Interactions), Search Tool for Recurring Instances of Neighbouring Genes (STRING), the International Molecular Exchange (IMEx) consortium and the Network Data Exchange (NDEx).
Footnotes
Publisher's Disclaimer: This is a PDF file of an unedited manuscript that has been accepted for publication. As a service to our customers we are providing this early version of the manuscript. The manuscript will undergo copyediting, typesetting, and review of the resulting proof before it is published in its final citable form. Please note that during the production process errors may be discovered which could affect the content, and all legal disclaimers that apply to the journal pertain.
Author Contributions
Conceptualization, J.K.H., D.E.C. and T.I.; Methodology, J.K.H., D.E.C. and T.I.; Software, J.K.H., D.E.C., M.K.Y. and W.Z.; Formal Analysis, J.K.H. and D.E.C.; Investigation, J.K.H. and D.E.C., Resources J.K.H., and P.T.; Data Curation, J.K.H., D.E.C., W.Z. and J.F.K.; Writing – Original Draft, J.K.H., D.E.C., J.F.K. and T.I.; Writing – Review & Editing, J.K.H., D.E.C. and T.I.; Visualization, J.K.H. and D.E.C., Supervision, J.K.H., D.E.C., P.T., and T.I.; Funding Acquisition, T.I.
Declaration of Interests
Trey Ideker is co-founder of Data4Cure, Inc. and has an equity interest. Trey Ideker has an equity interest in Ideaya BioSciences, Inc. The terms of this arrangement have been reviewed and approved by the University of California, San Diego in accordance with its conflict of interest policies.
References
- Alfarano C, Andrade CE, Anthony K, Bahroos N, Bajec M, Bantoft K, Betel D, Bobechko B, Boutilier K, Burgess E, et al. The Biomolecular Interaction Network Database and related tools 2005 update. Nucleic Acids Res. 2005;33:D418–D424. doi: 10.1093/nar/gki051. [DOI] [PMC free article] [PubMed] [Google Scholar]
- Aranda B, Achuthan P, Alam-Faruque Y, Armean I, Bridge A, Derow C, Feuermann M, Ghanbarian AT, Kerrien S, Khadake J, et al. The IntAct molecular interaction database in 2010. Nucleic Acids Res. 2010;38:D525–D531. doi: 10.1093/nar/gkp878. [DOI] [PMC free article] [PubMed] [Google Scholar]
- Bader GD, Donaldson I, Wolting C, Ouellette BFF, Pawson T, Hogue CWV. BIND—The Biomolecular Interaction Network Database. Nucleic Acids Res. 2001;29:242–245. doi: 10.1093/nar/29.1.242. [DOI] [PMC free article] [PubMed] [Google Scholar]
- Bader GD, Betel D, Hogue CWV. BIND: the Biomolecular Interaction Network Database. Nucleic Acids Res. 2003;31:248–250. doi: 10.1093/nar/gkg056. [DOI] [PMC free article] [PubMed] [Google Scholar]
- Bader GD, Cary MP, Sander C. Pathguide: a pathway resource list. Nucleic Acids Res. 2006;34:D504–D506. doi: 10.1093/nar/gkj126. [DOI] [PMC free article] [PubMed] [Google Scholar]
- Breitkreutz B-J, Stark C, Tyers M. The GRID: the General Repository for Interaction Datasets. Genome Biol. 2003;4:R23. doi: 10.1186/gb-2003-4-3-r23. [DOI] [PMC free article] [PubMed] [Google Scholar]
- Breitkreutz B-J, Stark C, Reguly T, Boucher L, Breitkreutz A, Livstone M, Oughtred R, Lackner DH, Bähler J, Wood V, et al. The BioGRID Interaction Database: 2008 update. Nucleic Acids Res. 2008;36:D637–D640. doi: 10.1093/nar/gkm1001. [DOI] [PMC free article] [PubMed] [Google Scholar]
- Calderone A, Castagnoli L, Cesareni G. mentha: a resource for browsing integrated protein-interaction networks. Nat. Methods. 2013;10:690–691. doi: 10.1038/nmeth.2561. [DOI] [PubMed] [Google Scholar]
- Cao M, Pietras CM, Feng X, Doroschak KJ, Schaffner T, Park J, Zhang H, Cowen LJ, Hescott BJ. New directions for diffusion-based network prediction of protein function: incorporating pathways with confidence. Bioinformatics. 2014;30:i219–i227. doi: 10.1093/bioinformatics/btu263. [DOI] [PMC free article] [PubMed] [Google Scholar]
- CARDIoGRAMplusC4D Consortium. Deloukas P, Kanoni S, Willenborg C, Farrall M, Assimes TL, Thompson JR, Ingelsson E, Saleheen D, Erdmann J, et al. Large-scale association analysis identifies new risk loci for coronary artery disease. Nat. Genet. 2013;45:25–33. doi: 10.1038/ng.2480. [DOI] [PMC free article] [PubMed] [Google Scholar]
- Carter H, Hofree M, Ideker T. Genotype to phenotype via network analysis. Curr. Opin. Genet. Dev. 2013;23:611–621. doi: 10.1016/j.gde.2013.10.003. [DOI] [PMC free article] [PubMed] [Google Scholar]
- Cerami EG, Gross BE, Demir E, Rodchenkov I, Babur O, Anwar N, Schultz N, Bader GD, Sander C. Pathway Commons, a web resource for biological pathway data. Nucleic Acids Res. 2011;39:D685–D690. doi: 10.1093/nar/gkq1039. [DOI] [PMC free article] [PubMed] [Google Scholar]
- Chatr-Aryamontri A, Breitkreutz B-J, Heinicke S, Boucher L, Winter A, Stark C, Nixon J, Ramage L, Kolas N, O’Donnell L, et al. The BioGRID interaction database: 2013 update. Nucleic Acids Res. 2013;41:D816–D823. doi: 10.1093/nar/gks1158. [DOI] [PMC free article] [PubMed] [Google Scholar]
- Chatr-Aryamontri A, Breitkreutz B-J, Oughtred R, Boucher L, Heinicke S, Chen D, Stark C, Breitkreutz A, Kolas N, O’Donnell L, et al. The BioGRID interaction database: 2015 update. Nucleic Acids Res. 2015;43:D470–D478. doi: 10.1093/nar/gku1204. [DOI] [PMC free article] [PubMed] [Google Scholar]
- Croft D, O’Kelly G, Wu G, Haw R, Gillespie M, Matthews L, Caudy M, Garapati P, Gopinath G, Jassal B, et al. Reactome: a database of reactions, pathways and biological processes. Nucleic Acids Res. 2011;39:D691–D697. doi: 10.1093/nar/gkq1018. [DOI] [PMC free article] [PubMed] [Google Scholar]
- Croft D, Mundo AF, Haw R, Milacic M, Weiser J, Wu G, Caudy M, Garapati P, Gillespie M, Kamdar MR, et al. The Reactome pathway knowledgebase. Nucleic Acids Res. 2014;42:D472–D477. doi: 10.1093/nar/gkt1102. [DOI] [PMC free article] [PubMed] [Google Scholar]
- Das J, Yu H. HINT: High-quality protein interactomes and their applications in understanding human disease. BMC Syst. Biol. 2012;6:92. doi: 10.1186/1752-0509-6-92. [DOI] [PMC free article] [PubMed] [Google Scholar]
- Fabregat A, Sidiropoulos K, Garapati P, Gillespie M, Hausmann K, Haw R, Jassal B, Jupe S, Korninger F, McKay S, et al. The Reactome pathway Knowledgebase. Nucleic Acids Res. 2016;44:D481–D487. doi: 10.1093/nar/gkv1351. [DOI] [PMC free article] [PubMed] [Google Scholar]
- Franceschini A, Szklarczyk D, Frankild S, Kuhn M, Simonovic M, Roth A, Lin J, Minguez P, Bork P, Von Mering C, et al. STRING v9. 1: protein-protein interaction networks, with increased coverage and integration. Nucleic Acids Res. 2013;41:D808–D815. doi: 10.1093/nar/gks1094. [DOI] [PMC free article] [PubMed] [Google Scholar]
- Gilbert D. Biomolecular interaction network database. Brief. Bioinform. 2005;6:194–198. doi: 10.1093/bib/6.2.194. [DOI] [PubMed] [Google Scholar]
- Greene CS, Krishnan A, Wong AK, Ricciotti E, Zelaya RA, Himmelstein DS, Zhang R, Hartmann BM, Zaslavsky E, Sealfon SC, et al. Understanding multicellular function and disease with human tissue-specific networks. Nat. Genet. 2015;47:569–576. doi: 10.1038/ng.3259. [DOI] [PMC free article] [PubMed] [Google Scholar]
- Hermjakob H, Montecchi-Palazzi L, Lewington C, Mudali S, Kerrien S, Orchard S, Vingron M, Roechert B, Roepstorff P, Valencia A, et al. IntAct: an open source molecular interaction database. Nucleic Acids Res. 2004;32:D452–D455. doi: 10.1093/nar/gkh052. [DOI] [PMC free article] [PubMed] [Google Scholar]
- Herwig R, Hardt C, Lienhard M, Kamburov A. Analyzing and interpreting genome data at the network level with ConsensusPathDB. Nat. Protoc. 2016;11:1889–1907. doi: 10.1038/nprot.2016.117. [DOI] [PubMed] [Google Scholar]
- Hill SM, Heiser LM, Cokelaer T, Unger M, Nesser NK, Carlin DE, Zhang Y, Sokolov A, Paull EO, Wong CK, et al. Inferring causal molecular networks: empirical assessment through a community-based effort. Nat. Methods. 2016;13:310–318. doi: 10.1038/nmeth.3773. [DOI] [PMC free article] [PubMed] [Google Scholar]
- Hofree M, Shen JP, Carter H, Gross A, Ideker T. Network-based stratification of tumor mutations. Nat. Methods. 2013;10:1108–1115. doi: 10.1038/nmeth.2651. [DOI] [PMC free article] [PubMed] [Google Scholar]
- Huttlin EL, Ting L, Bruckner RJ, Gebreab F, Gygi MP, Szpyt J, Tam S, Zarraga G, Colby G, Baltier K, et al. The BioPlex Network: A Systematic Exploration of the Human Interactome. Cell. 2015;162:425–440. doi: 10.1016/j.cell.2015.06.043. [DOI] [PMC free article] [PubMed] [Google Scholar]
- Huttlin EL, Bruckner RJ, Paulo JA, Cannon JR, Ting L, Baltier K, Colby G, Gebreab F, Gygi MP, Parzen H, et al. Architecture of the human interactome defines protein communities and disease networks. Nature. 2017;545:505–509. doi: 10.1038/nature22366. [DOI] [PMC free article] [PubMed] [Google Scholar]
- Jensen LJ, Kuhn M, Stark M, Chaffron S, Creevey C, Muller J, Doerks T, Julien P, Roth A, Simonovic M, et al. STRING 8—a global view on proteins and their functional interactions in 630 organisms. Nucleic Acids Res. 2009;37:D412–D416. doi: 10.1093/nar/gkn760. [DOI] [PMC free article] [PubMed] [Google Scholar]
- Joshi-Tope G, Gillespie M, Vastrik I, D’Eustachio P, Schmidt E, de Bono B, Jassal B, Gopinath GR, Wu GR, Matthews L, et al. Reactome: a knowledgebase of biological pathways. Nucleic Acids Res. 2005;33:D428–D432. doi: 10.1093/nar/gki072. [DOI] [PMC free article] [PubMed] [Google Scholar]
- Kamburov A, Wierling C, Lehrach H. ConsensusPathDB—a database for integrating human functional interaction networks. Nucleic Acids. 2009 doi: 10.1093/nar/gkn698. [DOI] [PMC free article] [PubMed] [Google Scholar]
- Kamburov A, Pentchev K, Galicka H, Wierling C, Lehrach H, Herwig R. ConsensusPathDB: toward a more complete picture of cell biology. Nucleic Acids Res. 2011;39:D712–D717. doi: 10.1093/nar/gkq1156. [DOI] [PMC free article] [PubMed] [Google Scholar]
- Kamburov A, Stelzl U, Lehrach H, Herwig R. The ConsensusPathDB interaction database: 2013 update. Nucleic Acids Res. 2013;41:D793–D800. doi: 10.1093/nar/gks1055. [DOI] [PMC free article] [PubMed] [Google Scholar]
- Kerrien S, Alam-Faruque Y, Aranda B, Bancarz I, Bridge A, Derow C, Dimmer E, Feuermann M, Friedrichsen A, Huntley R, et al. IntAct—open source resource for molecular interaction data. Nucleic Acids Res. 2007;35:D561–D565. doi: 10.1093/nar/gkl958. [DOI] [PMC free article] [PubMed] [Google Scholar]
- Kerrien S, Aranda B, Breuza L, Bridge A, Broackes-Carter F, Chen C, Duesbury M, Dumousseau M, Feuermann M, Hinz U, et al. The IntAct molecular interaction database in 2012. Nucleic Acids Res. 2012;40:D841–D846. doi: 10.1093/nar/gkr1088. [DOI] [PMC free article] [PubMed] [Google Scholar]
- Khurana E, Fu Y, Chen J, Gerstein M. Interpretation of genomic variants using a unified biological network approach. PLoS Comput. Biol. 2013;9:e1002886. doi: 10.1371/journal.pcbi.1002886. [DOI] [PMC free article] [PubMed] [Google Scholar]
- Kim H, Park T, Gelenbe E. Identifying disease candidate genes via large-scale gene network analysis. Int. J. Data Min. Bioinform. 2014;10:175–188. doi: 10.1504/ijdmb.2014.064014. [DOI] [PubMed] [Google Scholar]
- Kim JW, Abudayyeh OO, Yeerna H, Yeang C-H, Stewart M, Jenkins RW, Kitajima S, Konieczkowski DJ, Medetgul-Ernar K, Cavazos T, et al. Decomposing Oncogenic Transcriptional Signatures to Generate Maps of Divergent Cellular States. Cels. 2017;5:105–118. e9. doi: 10.1016/j.cels.2017.08.002. [DOI] [PMC free article] [PubMed] [Google Scholar]
- Köhler S, Bauer S, Horn D, Robinson PN. Walking the interactome for prioritization of candidate disease genes. Am. J. Hum. Genet. 2008;82:949–958. doi: 10.1016/j.ajhg.2008.02.013. [DOI] [PMC free article] [PubMed] [Google Scholar]
- Lee I, Blom UM, Wang PI, Shim JE, Marcotte EM. Prioritizing candidate disease genes by network-based boosting of genome-wide association data. Genome Res. 2011;21:1109–1121. doi: 10.1101/gr.118992.110. [DOI] [PMC free article] [PubMed] [Google Scholar]
- Leiserson MDM, Vandin F, Wu H-T, Dobson JR, Eldridge JV, Thomas JL, Papoutsaki A, Kim Y, Niu B, McLellan M, et al. Pan-cancer network analysis identifies combinations of rare somatic mutations across pathways and protein complexes. Nat. Genet. 2015;47:106–114. doi: 10.1038/ng.3168. [DOI] [PMC free article] [PubMed] [Google Scholar]
- Li T, Wernersson R, Hansen RB, Horn H, Mercer J, Slodkowicz G, Workman CT, Rigina O, Rapacki K, Stærfeldt HH, et al. A scored human protein-protein interaction network to catalyze genomic interpretation. Nat. Methods. 2017;14:61–64. doi: 10.1038/nmeth.4083. [DOI] [PMC free article] [PubMed] [Google Scholar]
- Liberzon A, Subramanian A, Pinchback R, Thorvaldsdóttir H, Tamayo P, Mesirov JP. Molecular signatures database (MSigDB) 3.0. Bioinformatics. 2011;27:1739–1740. doi: 10.1093/bioinformatics/btr260. [DOI] [PMC free article] [PubMed] [Google Scholar]
- MacArthur J, Bowler E, Cerezo M, Gil L, Hall P, Hastings E, Junkins H, McMahon A, Milano A, Morales J, et al. The new NHGRI-EBI Catalog of published genome-wide association studies (GWAS Catalog) Nucleic Acids Res. 2017;45:D896–D901. doi: 10.1093/nar/gkw1133. [DOI] [PMC free article] [PubMed] [Google Scholar]
- Matthews L, Gopinath G, Gillespie M, Caudy M, Croft D, de Bono B, Garapati P, Hemish J, Hermjakob H, Jassal B, et al. Reactome knowledgebase of human biological pathways and processes. Nucleic Acids Res. 2009;37:D619–D622. doi: 10.1093/nar/gkn863. [DOI] [PMC free article] [PubMed] [Google Scholar]
- Mishra GR, Suresh M, Kumaran K, Kannabiran N, Suresh S, Bala P, Shivakumar K, Anuradha N, Reddy R, Raghavan TM, et al. Human protein reference database—2006 update. Nucleic Acids Res. 2006;34:D411–D414. doi: 10.1093/nar/gkj141. [DOI] [PMC free article] [PubMed] [Google Scholar]
- Mostafavi S, Ray D, Warde-Farley D, Grouios C, Morris Q. GeneMANIA: a real-time multiple association network integration algorithm for predicting gene function. Genome Biol. 2008;9(Suppl 1):S4. doi: 10.1186/gb-2008-9-s1-s4. [DOI] [PMC free article] [PubMed] [Google Scholar]
- Novarino G, Fenstermaker AG, Zaki MS, Hofree M, Silhavy JL, Heiberg AD, Abdellateef M, Rosti B, Scott E, Mansour L, et al. Exome sequencing links corticospinal motor neuron disease to common neurodegenerative disorders. Science. 2014;343:506–511. doi: 10.1126/science.1247363. [DOI] [PMC free article] [PubMed] [Google Scholar]
- Orchard S, Ammari M, Aranda B, Breuza L, Briganti L, Broackes-Carter F, Campbell NH, Chavali G, Chen C, del-Toro N, et al. The MIntAct project—IntAct as a common curation platform for 11 molecular interaction databases. Nucleic Acids Res. 2014;42:D358–D363. doi: 10.1093/nar/gkt1115. [DOI] [PMC free article] [PubMed] [Google Scholar]
- Paull EO, Carlin DE, Niepel M, Sorger PK, Haussler D, Stuart JM. Discovering causal pathways linking genomic events to transcriptional states using Tied Diffusion Through Interacting Events (TieDIE) Bioinformatics. 2013;29:2757–2764. doi: 10.1093/bioinformatics/btt471. [DOI] [PMC free article] [PubMed] [Google Scholar]
- Peri S, Navarro JD, Amanchy R, Kristiansen TZ, Jonnalagadda CK, Surendranath V, Niranjan V, Muthusamy B, Gandhi TKB, Gronborg M, et al. Development of human protein reference database as an initial platform for approaching systems biology in humans. Genome Res. 2003;13:2363–2371. doi: 10.1101/gr.1680803. [DOI] [PMC free article] [PubMed] [Google Scholar]
- Peri S, Navarro JD, Kristiansen TZ, Amanchy R, Surendranath V, Muthusamy B, Gandhi TKB, Chandrika KN, Deshpande N, Suresh S, et al. Human protein reference database as a discovery resource for proteomics. Nucleic Acids Res. 2004;32:D497–D501. doi: 10.1093/nar/gkh070. [DOI] [PMC free article] [PubMed] [Google Scholar]
- Pillich RT, Chen J, Rynkov V, Welker D, Pratt D. NDEx: A Community Resource for Sharing and Publishing of Biological Networks. Methods in Molecular Biology. 2017:271–301. doi: 10.1007/978-1-4939-6783-4_13. [DOI] [PubMed] [Google Scholar]
- Piñero J, Queralt-Rosinach N, Bravo À, Deu-Pons J, Bauer-Mehren A, Baron M, Sanz F, Furlong LI. DisGeNET: a discovery platform for the dynamical exploration of human diseases and their genes. Database. 2015;2015:bav028. doi: 10.1093/database/bav028. [DOI] [PMC free article] [PubMed] [Google Scholar]
- Piñero J, Bravo À, Queralt-Rosinach N, Gutiérrez-Sacristán A, Deu-Pons J, Centeno E, García-García J, Sanz F, Furlong LI. DisGeNET: a comprehensive platform integrating information on human disease-associated genes and variants. Nucleic Acids Res. 2016 doi: 10.1093/nar/gkw943. [DOI] [PMC free article] [PubMed] [Google Scholar]
- Prasad TSK, Goel R, Kandasamy K, Keerthikumar S, Kumar S, Mathivanan S, Telikicherla D, Raju R, Shafreen B, Venugopal A, et al. Human protein reference database—2009 update. Nucleic Acids Res. 2009;37:D767–D772. doi: 10.1093/nar/gkn892. [DOI] [PMC free article] [PubMed] [Google Scholar]
- Pratt D, Chen J, Welker D, Rivas R, Pillich R, Rynkov V, Ono K, Miello C, Hicks L, Szalma S, et al. NDEx, the Network Data Exchange. Cell Syst. 2015;1:302–305. doi: 10.1016/j.cels.2015.10.001. [DOI] [PMC free article] [PubMed] [Google Scholar]
- Qian Y, Besenbacher S, Mailund T, Schierup MH. Identifying disease associated genes by network propagation. BMC Syst. Biol. 2014;8(Suppl 1):S6. doi: 10.1186/1752-0509-8-S1-S6. [DOI] [PMC free article] [PubMed] [Google Scholar]
- Razick S, Magklaras G, Donaldson IM. iRefIndex: a consolidated protein interaction database with provenance. BMC Bioinformatics. 2008;9:405. doi: 10.1186/1471-2105-9-405. [DOI] [PMC free article] [PubMed] [Google Scholar]
- Rolland T, Taşan M, Charloteaux B, Pevzner SJ, Zhong Q, Sahni N, Yi S, Lemmens I, Fontanillo C, Mosca R, et al. A proteome-scale map of the human interactome network. Cell. 2014;159:1212–1226. doi: 10.1016/j.cell.2014.10.050. [DOI] [PMC free article] [PubMed] [Google Scholar]
- Rousseeuw PJ, Croux C. Alternatives to the Median Absolute Deviation. J. Am. Stat. Assoc. 1993;88:1273–1283. [Google Scholar]
- Salwinski L, Miller CS, Smith AJ, Pettit FK, Bowie JU, Eisenberg D. The Database of Interacting Proteins: 2004 update. Nucleic Acids Res. 2004;32:D449–D451. doi: 10.1093/nar/gkh086. [DOI] [PMC free article] [PubMed] [Google Scholar]
- Schaefer CF, Anthony K, Krupa S, Buchoff J, Day M, Hannay T, Buetow KH. PID: the Pathway Interaction Database. Nucleic Acids Res. 2009;37:D674–D679. doi: 10.1093/nar/gkn653. [DOI] [PMC free article] [PubMed] [Google Scholar]
- Seabold S, Perktold J. Statsmodels: Econometric and statistical modeling with python; Proceedings of the 9th Python in Science Conference; 2010. p. 61. [Google Scholar]
- Snel B, Lehmann G, Bork P, Huynen MA. STRING: a web-server to retrieve and display the repeatedly occurring neighbourhood of a gene. Nucleic Acids Res. 2000;28:3442–3444. doi: 10.1093/nar/28.18.3442. [DOI] [PMC free article] [PubMed] [Google Scholar]
- Sokolov A, Carlin DE, Paull EO, Baertsch R, Stuart JM. Pathway-Based Genomics Prediction using Generalized Elastic Net. PLoS Comput. Biol. 2016;12:e1004790. doi: 10.1371/journal.pcbi.1004790. [DOI] [PMC free article] [PubMed] [Google Scholar]
- Stark C, Breitkreutz B-J, Reguly T, Boucher L, Breitkreutz A, Tyers M. BioGRID: a general repository for interaction datasets. Nucleic Acids Res. 2006;34:D535–D539. doi: 10.1093/nar/gkj109. [DOI] [PMC free article] [PubMed] [Google Scholar]
- Stark C, Breitkreutz B-J, Chatr-Aryamontri A, Boucher L, Oughtred R, Livstone MS, Nixon J, Van Auken K, Wang X, Shi X, et al. The BioGRID Interaction Database: 2011 update. Nucleic Acids Res. 2011;39:D698–D704. doi: 10.1093/nar/gkq1116. [DOI] [PMC free article] [PubMed] [Google Scholar]
- Szklarczyk D, Franceschini A, Kuhn M, Simonovic M, Roth A, Minguez P, Doerks T, Stark M, Muller J, Bork P, et al. The STRING database in 2011: functional interaction networks of proteins, globally integrated and scored. Nucleic Acids Res. 2011;39:D561–D568. doi: 10.1093/nar/gkq973. [DOI] [PMC free article] [PubMed] [Google Scholar]
- Szklarczyk D, Franceschini A, Wyder S, Forslund K, Heller D, Huerte-Cepas J, Simonovic M, Roth A, Santos A, Tsafou KP, et al. STRING v10: protein–protein interaction networks, integrated over the tree of life. Nucleic Acids Res. 2014 doi: 10.1093/nar/gku1003. [DOI] [PMC free article] [PubMed] [Google Scholar]
- Szklarczyk D, Morris JH, Cook H, Kuhn M, Wyder S, Simonovic M, Santos A, Doncheva NT, Roth A, Bork P, et al. The STRING database in 2017: quality-controlled protein--protein association networks, made broadly accessible. Nucleic Acids Res. 2016:gkw937. doi: 10.1093/nar/gkw937. [DOI] [PMC free article] [PubMed] [Google Scholar]
- Tabor HK, Risch NJ, Myers RM. Candidate-gene approaches for studying complex genetic traits: practical considerations. Nat. Rev. Genet. 2002;3:391–397. doi: 10.1038/nrg796. [DOI] [PubMed] [Google Scholar]
- Turner B, Razick S, Turinsky AL, Vlasblom J, Crowdy EK, Cho E, Morrison K, Donaldson IM, Wodak SJ. iRefWeb: interactive analysis of consolidated protein interaction data and their supporting evidence. Database. 2010;2010:baq023. doi: 10.1093/database/baq023. [DOI] [PMC free article] [PubMed] [Google Scholar]
- Vandin F, Upfal E, Raphael BJ. Algorithms for detecting significantly mutated pathways in cancer. J. Comput. Biol. 2011;18:507–522. doi: 10.1089/cmb.2010.0265. [DOI] [PubMed] [Google Scholar]
- Vanunu O, Magger O, Ruppin E, Shlomi T, Sharan R. Associating genes and protein complexes with disease via network propagation. PLoS Comput. Biol. 2010;6:e1000641. doi: 10.1371/journal.pcbi.1000641. [DOI] [PMC free article] [PubMed] [Google Scholar]
- Vaske CJ, Benz SC, Sanborn JZ, Earl D, Szeto C, Zhu J, Haussler D, Stuart JM. Inference of patient-specific pathway activities from multi-dimensional cancer genomics data using PARADIGM. Bioinformatics. 2010;26:i237–i245. doi: 10.1093/bioinformatics/btq182. [DOI] [PMC free article] [PubMed] [Google Scholar]
- Vastrik I, D’Eustachio P, Schmidt E, Joshi-Tope G, Gopinath G, Croft D, de Bono B, Gillespie M, Jassal B, Lewis S, et al. Reactome: a knowledge base of biologic pathways and processes. Genome Biol. 2007;8:R39. doi: 10.1186/gb-2007-8-3-r39. [DOI] [PMC free article] [PubMed] [Google Scholar]
- Von Mering C, Huynen M, Jaeggi D, Schmidt S, Bork P, Snel B. STRING: a database of predicted functional associations between proteins. Nucleic Acids Res. 2003;31:258–261. doi: 10.1093/nar/gkg034. [DOI] [PMC free article] [PubMed] [Google Scholar]
- Von Mering C, Jensen LJ, Snel B, Hooper SD, Krupp M, Foglierini M, Jouffre N, Huynen MA, Bork P. STRING: known and predicted protein--protein associations, integrated and transferred across organisms. Nucleic Acids Res. 2005;33:D433–D437. doi: 10.1093/nar/gki005. [DOI] [PMC free article] [PubMed] [Google Scholar]
- Von Mering C, Jensen LJ, Kuhn M, Chaffron S, Doerks T, Krüger B, Snel B, Bork P. STRING 7—recent developments in the integration and prediction of protein interactions. Nucleic Acids Res. 2007;35:D358–D362. doi: 10.1093/nar/gkl825. [DOI] [PMC free article] [PubMed] [Google Scholar]
- Warde-Farley D, Donaldson SL, Comes O, Zuberi K, Badrawi R, Chao P, Franz M, Grouios C, Kazi F, Lopes CT, et al. The GeneMANIA prediction server: biological network integration for gene prioritization and predicting gene function. Nucleic Acids Res. 2010;38:W214–W220. doi: 10.1093/nar/gkq537. [DOI] [PMC free article] [PubMed] [Google Scholar]
- Willsey AJ, Sanders SJ, Li M, Dong S, Tebbenkamp AT, Muhle RA, Reilly SK, Lin L, Fertuzinhos S, Miller JA, et al. Coexpression networks implicate human midfetal deep cortical projection neurons in the pathogenesis of autism. Cell. 2013;155:997–1007. doi: 10.1016/j.cell.2013.10.020. [DOI] [PMC free article] [PubMed] [Google Scholar]
- Wu C, Macleod I, Su AI. BioGPS and MyGene.info: organizing online, gene-centric information. Nucleic Acids Res. 2013;41:D561–D565. doi: 10.1093/nar/gks1114. [DOI] [PMC free article] [PubMed] [Google Scholar]
- Wu G, Feng X, Stein L. A human functional protein interaction network and its application to cancer data analysis. Genome Biol. 2010;11:R53. doi: 10.1186/gb-2010-11-5-r53. [DOI] [PMC free article] [PubMed] [Google Scholar]
- Xenarios I, Rice DW, Salwinski L, Baron MK, Marcotte EM, Eisenberg D. DIP: the database of interacting proteins. Nucleic Acids Res. 2000;28:289–291. doi: 10.1093/nar/28.1.289. [DOI] [PMC free article] [PubMed] [Google Scholar]
- Xenarios I, Fernandez E, Salwinski L, Duan XJ, Thompson MJ, Marcotte EM, Eisenberg D. DIP: The Database of Interacting Proteins: 2001 update. Nucleic Acids Res. 2001;29:239–241. doi: 10.1093/nar/29.1.239. [DOI] [PMC free article] [PubMed] [Google Scholar]
- Xenarios I, Salwínski L, Duan XJ, Higney P, Kim S-M, Eisenberg D. DIP, the Database of Interacting Proteins: a research tool for studying cellular networks of protein interactions. Nucleic Acids Res. 2002;30:303–305. doi: 10.1093/nar/30.1.303. [DOI] [PMC free article] [PubMed] [Google Scholar]
- Xin J, Mark A, Afrasiabi C, Tsueng G, Juchler M, Gopal N, Stupp GS, Putman TE, Ainscough BJ, Griffith OL, et al. High-performance web services for querying gene and variant annotation. Genome Biol. 2016;17:91. doi: 10.1186/s13059-016-0953-9. [DOI] [PMC free article] [PubMed] [Google Scholar]
- Yeger-Lotem E, Sharan R. Human protein interaction networks across tissues and diseases. Front. Genet. 2015;6:257. doi: 10.3389/fgene.2015.00257. [DOI] [PMC free article] [PubMed] [Google Scholar]
- Yu D, Kim M, Xiao G, Hwang TH. Review of biological network data and its applications. Genomics Inform. 2013;11:200–210. doi: 10.5808/GI.2013.11.4.200. [DOI] [PMC free article] [PubMed] [Google Scholar]
- Zuberi K, Franz M, Rodriguez H, Montojo J, Lopes CT, Bader GD, Morris Q. GeneMANIA prediction server 2013 update. Nucleic Acids Res. 2013;41:W115–W122. doi: 10.1093/nar/gkt533. [DOI] [PMC free article] [PubMed] [Google Scholar]
Associated Data
This section collects any data citations, data availability statements, or supplementary materials included in this article.
Supplementary Materials
Data S1. The tabs in this file are a collection of spreadsheets presenting the gene sets in each of the three collections of gene sets (literature, expression and GWAS) as well as full numeric values of molecular network performance score, performance gain and size-adjusted performance across all gene sets (as presented in Methods) for each collection of gene set recovery tasks. Composite network performance scores on the literature gene sets are also presented here. These data are related to Figure 3, Figure 4, Figure 5 and Figure S4.
Data S1A: Literature gene sets
Data S1B: Molecular network literature gene set performance scores
Data S1C: Molecular network literature gene set AUPRC performance gains
Data S1D: Molecular network literature gene set network size-adjusted performance scores
Data S1E: Expression gene sets
Data S1F: Molecular network expression gene set performance scores
Data S1G: Molecular network expression gene set AUPRC performance gains
Data S1H: Molecular network expression gene set network size-adjusted performance scores
Data S1I: GWAS gene sets
Data S1J: Molecular network GWAS gene set performance scores
Data S1K: Molecular network GWAS gene set AUPRC performance gains
Data S1L: Molecular network GWAS gene set network size-adjusted performance scores
Data S1M: Composite network literature gene set performance scores