

Abstract
Many neuropsychiatric disorders are thought to result from subtle changes in neural circuit formation. We used human embryonic stem cells (hESCs) and induced pluripotent stem cells (hiPSCs) to model mature, postmitotic excitatory neurons and examine effects of FGF2. FGF2 gene expression is known to be altered in brain regions of major depressive disorder (MDD) patients and FGF2 has anti-depressive effects in animal models of depression. We generated stable inducible neurons (siNeurons) conditionally expressing human neurogenin 2 (NEUROG2) to generate a homogenous population of post-mitotic excitatory neurons and study the functional as well as the transcriptional effects of FGF2. Upon induction of NEUROG2 with doxycycline, the vast majority of cells are post-mitotic, and the gene expression profile recapitulates that of excitatory neurons within 6 days. Using hES cell lines that inducibly express NEUROG2 as well as GCaMP6f, we were able to characterize spontaneous calcium activity in these neurons and show that calcium transients increase in the presence of FGF2. The FGF2-responsive genes were determined by RNA-Seq. FGF2-regulated genes previously identified in non-neuronal cell types were upregulated (EGR1, ETV4, SPRY4, and DUSP6) as a result of chronic FGF2 treatment of siNeurons. Novel neuron specific genes were also identified that may mediate FGF2-dependent increases in synaptic efficacy including NRXN3, SYT2, and GALR1. Since several of these genes have been implicated in MDD previously, these results will provide the basis for more mechanistic studies of the role of FGF2 in MDD.
Keywords: FGF2, stem cells, Neurogenin-2, glutamatergic, neuronal
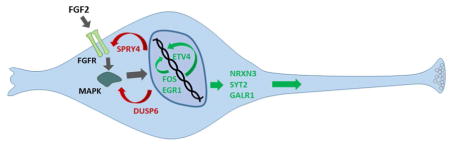
Graphical Abstract
Alterations in Fibroblast Growth Factor (FGF) signaling have been implicated in Major Depressive Disorder (MDD). In this article, human stem cells are differentiated into glutamatergic neurons. FGF2 treatment of these neurons increases activity as determined using calcium imaging. RNAseq studies implicate a number of genes in this regulation of neuronal activity by FGF2 including SYT2, NRXN3 and GALR1.
Introduction
Major depressive disorder (MDD) is one of the most common psychiatric disorders affecting about 28% of the US population during their lifetime (Vandeleur et al. 2017). Due to the clinical and genetic heterogeneity of MDD, its pathophysiology remains elusive (Tanti & Belzung 2010). Previous research has shown that various neurotransmitters such as serotonin and neurotrophic factors such as brain derived neurotrophic factors (BDNF) contribute to MDD (Duman & Aghajanian 2012). More recently, reduced glutamatergic signaling has been linked to MDD (Eisch & Petrik 2012). Brain imaging of MDD patients suggests a volume reduction in hippocampus, dorsolateral prefrontal cortex (DLPFC) and anterior cingulate cortex (ACC) (Sacher et al. 2012). Post-mortem analyses of these same brain regions implicate several genes correlating with MDD but the most significantly dysregulated genes in MDD patients belong to the fibroblast growth factor (FGF) family (Turner et al. 2016). Microarray hybridization studies of the DLPFC region of MDD patients show that the ligand FGF9 is upregulated relative to controls while the ligand FGF2 and the FGF receptors (FGFR2 and FGFR3) are downregulated (Evans et al. 2004).
Animal studies using various models of depression in rodents have shown anti-depressant effects of FGF2 (Jarosik et al. 2011). Rats undergoing social defeat stress showed decreased hippocampal FGF2 expression and administration of FGF2 reversed the behavioral correlates of depression (Elsayed et al. 2012). Furthermore, treatment of adult rats with anti-depressants resulted in increased FGF2 expression in cerebral cortex and hippocampus (Mallei et al. 2002, Bachis et al. 2008). FGF2 knockout mice displayed increased anxiety and the phenotype was completely rescued upon treatment with FGF2 in adulthood (Salmaso et al. 2016). It has also been established that FGF2 treatment of rat cortical neurons in culture enhances of glutamatergic signaling (Li et al. 2002). These reports together implicate a role for FGF2 regulation of fully developed neurons in mediating anti-depressant effect.
FGF2 is the most abundant ligand in the developing brain (Vaccarino et al. 1999, Ford-Perriss et al. 2001) and the human genome contains 22 genes encoding FGF ligands as well as 4 genes encoding receptors, most of which are expressed in the developing nervous system (Guillemot & Zimmer 2011). All four FGFR genes encode single transmembrane protein with extracellular immunoglobulin domain and intracellular tyrosine kinase domains. The binding of an FGF ligand to FGFR causes dimerization resulting in autophosphorylation and activation of four major intracellular pathways: Ras/MAP kinase, PLC/PKA, STAT, and/or PI3 kinase signaling pathway. Once activated, these pathways phosphorylate transcription factors to alter the expression of FGF dependent genes (Ornitz & Itoh 2015).
In order to better understand the specific role of FGF2 in human neuronal function, we investigated the global transcriptional effects of FGF2 in post-mitotic human glutamatergic neurons and the biochemical signaling mechanisms that control these transcriptional changes. We generated doxycycline (dox) inducible stable human stem cell clones and differentiated them into excitatory cortical-like neurons by morphology and a gene expression profile. We characterized the effect of FGF2 treatment on calcium signaling of the neuronal population and found that FGF2 treatment enhanced spontaneous calcium activity. Finally, we used RNA-Seq analysis of FGF2-treated neurons to characterize gene expression changes that may mediate FGF2-enhanced human glutamatergic neuronal activity.
Materials and Methods
Cell Culture and Transfection of Human Embryonic Stem Cells
H9 ESCs were obtained from WiCell Research Resources (WiCell, WI; RRID: CVCL_9773); the control iPSC line was derived from commercially available human foreskin fibroblasts (Stem Cell Genetics) and reprogrammed using episomal plasmids as described (Okita et al. 2011). Both ESCs and iPSCs were maintained in feeder-free conditions using Matrigel substrate (Corning), mTeSR8 medium (Stem Cell Technologies), and passaged every 4–5 days with EDTA as described (Beers et al. 2012). All human cell culture experiments were approved by the University of Michigan Human Pluripotent Stem Cell Research Oversight Committee and the University of Michigan Institutional Review Board.
Generation of siNeuron hES and hiPSC lines using Tol2 recombinase
Stem cells were plated onto Matrigel coated plates at a density of 1–5 × 10⁴ cells per well in the presence of 1 μM Y-26732 (Tocris Bio) in E8 media. The following day, the media was changed to E8 alone, and cells were transfected with a total of 2.5 μg of Tol2-plasmids (Balciunas et al. 2006). Plasmids to be chromosomally integrated contained the Tol2 arms and were derived from the pMiniTol2 parental plasmid (Balciunas et al. 2006). These plasmids included the pMT-US2-TetOn-IRES-EGFP (20% of transfected DNA), pMT-TRE-hNeurog2 (20% of transfected DNA), and pMT-US2-puro (5–10%) which were generated from previously described plasmids lacking the minitol integration arms (Huang et al. 2015, Huang et al. 2010). In addition to the integrating plasmids, the transfected DNA contained 40–50% of the pUS2-Tol2 plasmid which expresses the Tol2 recombinase with high efficiency in human stem cells. pUS2-Tol2 was generated by excising the Tol2 coding region from pCMV-Tol2 (Balciunas et al. 2006) and inserting it into the multiple cloning site of the pUS2 plasmid containing the human ubiquitin C promoter.
Following transfection of 2.5 μg of mixed plasmid DNA using Mirus LT1, the cells were fed with E8 media after 24h. At 72h after transfection, cells were treated with 0.8 μg/ml puromycin in E8 media for 24 to 48 hours followed by growth in E8 media. Approximately one week later, colonies of approximately 500 cells were picked manually into individual wells of a 24-well plate. The clones were expanded and replicate cultures were tested for differentiation in the presence of dox.
Induction of siNeurons from human ESCs and iPSC siN lines
hESCs and iPSCs were plated on Matrigel-coated 6-well plates in mTeSR8 media with 1μM Y-27632. The following day the cells were treated with 1 μg/ml dox to induce NEUROG2 gene expression. On day 3 when the majority of cells ceased proliferation, the cells were passed into 3N differentiation media (1:1 DMEM:F-12/Neurobasal, 1 mM Glutamax, 5 μg/ml Insulin, N2 supplement, B27 supplement, 1 mM Minimum Essential Amino acids, s-mercaptoethanol) (Shi et al. 2012) in presence of 1 μg/ml dox. Cells were fed daily with 3N media until analysis.
Immunocytochemistry
Cells were fixed and immunostained as described(Huang et al. 2015). The following primary antibodies were used: rabbit anti-Neurog2 (1:1000; Santa Cruz; RRID: AB_2149513), rabbit anti-Map2 (1:1000; Cell Signaling Technology; RRID: AB_1069372), mouse anti-TuJ1 (1:1000; Covance; RRID: AB_2313773), rabbit anti-Syn (1:1000; Cell Signaling Technology; RRID: AB_2200102), rabbit anti-PSD95 (1:1000; Cell Signaling Technology; RRID: AB_2292883), rabbit anti-GAPDH (1:5000; Cell Signaling Technology; RRID: AB_16422005). Secondary antibodies used were goat anti-mouse Alexa Fluor 594 (1:1000; Invitrogen), goat anti-rabbit Alexa Fluor 594 (1:1000; Invitrogen), goat anti-mouse Cy5 (1:1000; Molecular Probes), goat anti-rabbit Cy5 (1:1000; Molecular Probes). For EdU staining, cells were pulsed with 1 mM EdU for 2.5h and visualized using the cocktail containing 100 mM Tris buffered saline, 4 mM CuSO4, 2 μM Sulfo-Cyanine 5 azide (Lumiprobe), and 100 mM sodium ascorbate. Nuclear counterstaining was performed with DAPI.
qRT-PCR
Total RNA was isolated using Direct-zol™ RNA Mini prep kit (Zymo Research), reverse transcribed by using SuperScript II Reverse Transcriptase (Life Technologies) with random hexamer, and qPCR performed with either Viia7™ Real-Time PCR system or QuantStudio 3 Real-Time PCR system using SYBR green Absolute Blue master mix (Thermo Fisher). The primer sequences used to amplify target genes are outlined in Supplementary Table 1. Each sample was assayed in triplicate, and the R-RCT method was used to calculate relative expression levels normalized to GAPDH.
Protein Extraction and Western Blotting analysis
Proteins were extracted as previously described (Huang et al. 2015). Equal amounts of protein were electrophoresed and transferred onto a 0.2 μm Nitrocellulose membrane (Whatman). Membranes were blocked using 5% non-fat dry milk in PBS containing 2% polyvinylpyrolidone (PVP-40) and 0.1% Triton X-100 for 2h at room temperature. Primary antibodies were diluted in PBS supplemented with 0.5% bovine serum albumin and 0.1% Triton X-100 overnight at 4°C. Horseradish peroxidase (HRP)-conjugated secondary antibodies were used and chemiluminescence was assayed using Lumi-Light Western Blotting Substrate (Roche), Super Signal West Femto Chemiluminescent Substrate (Thermo Scientific), and the FluorChem M gel documentation system (ProteinSimple) equipped with the AlphaView software (Alpha Innotech).
Calcium (Ca2+)- signaling experiments
H9-N2 and H9-N3 hES cells were maintained and differentiated as described above for H9-N1 cells. The cells were induced with 1 μg/ml dox after plating in mTesR8 media. Two days later, the media was changed to 3N differentiation media. At day 6–12 after induction, H9-N2 and H9-N3 siNeurons were analyzed. Spontaneous activity of the H9-N2 and H9-N3 siNeurons was recorded using fluorescent calcium imaging of the GCaMP6f transgene. Prior to imaging, cultures were incubated for 45 min in External Medium (EM) consisting of 128 mM NaCl, 1 mM CaCl2, 1 mM MgCl2, 45 mM sucrose,10 mM Glucose, and 0.01M HEPES, treated to pH 7.4 (Tibau et al. 2013). GCaMP6f fluorescence was measured using an EVOS FL Auto Cell Imaging system with 488-nm excitation. Images were taken under a 20× objective every 5 sec for 5 min. The camera and microscope settings were optimized to minimize photo-bleaching and provide best signal to noise ratio throughout the measurements. Images were analyzed using FIJI software to identify the percentage of cells showing calcium level changes over time. There was no blinding done for the image analysis.
RNA-Seq (Illumina Sequencing)- cDNA synthesis and library preparation
RNA quality and quantity were assessed using TapeStation (Agilent Technologies) and NanoDrop ND1000 (Thermo Fischer Scientific), respectively. Samples with RNA Integrity Numbers (RINs) of 8 or greater were prepared using the Illumina TruSeq RNA Library Prep Kit v2 (Illumina) following manufacturer’s instructions, where 0.1–3 μg of total RNA was converted to mRNA using polyA purification. The mRNA was then fragmented and copied into first strand cDNA using reverse transcriptase and random primers. The 3′ end of the cDNA was then adenylated and adapters were ligated. One of the ligated adapters had a 6-nt barcode that was unique for each sample and allowed sequencing more than one sample in each lane of HiSeq Flow Cell (Illumina). The products were purified and enriched by PCR to create the final cDNA library. Final libraries were checked for quality and quantity by TapeStation (Agilent Technologies) and qPCR using Kapa’s Library Quantification kit for Illumina sequencing platforms (Kapa Biosystems). The libraries were clustered on the cBot (Illumina) and sequenced 4 samples per lane on a 50 cycle single end on a HiSeq 2500 (Illumina) in High Output mode using version 4 reagents according to manufacturers recommended protocols.
Data Analysis
Sequence alignment and gene level read count
RNA-Seq reads were aligned to the human genome (hg19) using the SubRead aligner (Liao et al. 2013). Gene-level RNA-Seq counts summaries for each sample were derived by the featureCounts program (Liao et al. 2014) based on GenCode 24 annotation (http://www.gencodegenes.org/releases/24.html). Differentially expressed gene lists for FGF2 treatment data sets were derived from the consensus of limma-voom (Ritchie et al. 2015) and DESeq2 (Love et al. 2014) analysis results at multiple testing corrected pval ≤ 0.05. The online DAVID Bioinformatics Resources 6.8 was used to annotate gene lists derived from RNA-Seq analysis (https://david.ncifcrf.gov/) (Huang et al. 2009, Sherman et al. 2007). We assigned the Gene Ontology terms using DAVID analysis to compute the functional categories in “Biological processes”, “Molecular function”, and “Cell component”.
Hierarchical clustering was performed using the CRAN R hclust function using default parameters (https://cran.r-project.org/).
Statistical Analysis
Statistical analysis of calcium imaging and qRT-PCR data was done with Microsoft Excel.
Standard deviations of the mean were reported. Statistical significance was assessed with two-tailed Student’s t-test with p<0.01.
Multi-well MEA plates and cell culture
The multielectrode array (MEA) recording protocol was followed as described (Bardy et al. 2015). Briefly, 96-well MEA plates were used with each well containing 8 microelectrodes and 4 ground electrodes for a total of 768 channels (Axion Biosystems). Prior to culture, each well was coated with filter sterilized 0.2% polyethyleneimine (PEI) in 0.1M sodium borate buffer pH 8.4. The PEI solution was removed and washed with sterile water four times.
H9-N2 cells were plated at a density of 2 ×10⁵ cells/ml on Matrigel coated 6-well plates in mTESR1 media with 1μM Y-27632. The cells were treated with 0.5 μg/ml dox to generate neurons and 2 days later passaged onto PEI coated MEA plates. A 5 μl droplet of cell suspension (150,000 cells) containing 10 μg/ml laminin was added to the center of each well directly over the electrode area. The cells were incubated for 1 h prior to addition of 3N media. The media was replaced daily with 3N+dox. After seven days, the media was switched to BrainPhys media (StemCell Technologies) with 25 ng/ml BDNF and 25 ng/ml GDNF and half of the media was replaced every other day.
Spontaneous activity was recorded daily for 5 min at 37°C using the MEA system (Axion) and the associated software Axis 2.1. All the channels were sampled together and recorded. Standard settings were used with the threshold spike detector set at 6× standard deviation (Bardy et al. 2015).
Data Accessibility
RNA-Seq data is available at NCBI GEO (GSE92971).
Results
Generation of stable inducible glutamatergic neurons from hESCs
Previous methods to generate post-mitotic glutamatergic neurons from human pluripotent stem cells have used either small molecule induction or overexpression by viral transduction. In order to minimize experimental variability, we used a Tol2 transposon based gene transfer system widely used in zebrafish to generate stable human cell lines essentially as described previously (Meir et al. 2011). We sought to generate hESC lines with chromosomally integrated vector sequences that would allow for doxycycline (dox) induction of human NEUROG2 gene expression. Lipid transfection of H9 hESCs showed that the transient co-expression of an expression vector for the Tol2 recombinase increased the generation of stable puromycin resistant colonies 100-fold and the majority of these colonies stably expressed a co-transfected EGFP marker protein after puromycin selection (Supplementary Fig. 1). Furthermore, the expression of EGFP was stable for at least 20 passages in the absence of puromycin (data not shown).
In order to generate stable stem cell clones capable of differentiating into glutamatergic neurons (siNeurons), we constructed three pMini-tol2 derived vectors containing the minimal inverted terminal repeats required for gene transfer (Fig. 1a). The MT-US2-TetON-iRES-EGFP plasmid expresses the TetON transcriptional regulator protein and also EGFP (Huang et al. 2015). The MT-TRE-hNeurog2 plasmid expresses the human NEUROG2 protein with its 3′UTR in a dox-dependent manner while the MT-US2-puro contains the coding region for puromycin N-acetyl-transferase. These plasmids were used to generate stable puromycin resistant H9 clones as described (Materials and Methods).
Figure 1. Generation of stable inducible Neurons from human ES cells.

(a) Design of Tol2-recombinase based vectors for conversion of hESCs to neurons. Cells are transfected with the three plasmids along with a transiently expressed to l2 recombinase that allows for gene transfer and stable integration. (b) Schematic showing the time course of generation of siNeurons that includes plating at day -1, dox treatment in E8 media for 2 d and then a media changes to 3N with dox for additional days until analysis. (c) q-RT-PCR analysis showing the time course of Neurogenin 2 expression following Dox treatment. (d) The presence of NEUROG2 protein following dox treatment is shown by Western blot. (e) Representative images of control and siNeurons at day 11 illustrating nuclear immunoreactivity for NEUROG2. The results are a representative of three independent experiments (n=3).
Colonies of puromycin resistant H9 cells demonstrating homogenous EGFP expression were isolated and screened for differentiation after treatment with dox. Of the 24 clones isolated, 16 showed at least partial inhibition of cell growth after two days of dox treatment and four clones showed extensive neurite generation. One of these clones designated as H9-N1 was studied in greater detail. The H9-N1 clone showed expression levels of key pluripotency genes (NANOG, POU5F1 and SSEA4) that were indistinguishable from parental H9 cells (data not shown). This H9-N1 line was also euploid as determined by SNP-ChIP hybridization analysis (data not shown).
Upon treatment with dox, the H9-N1 cell line showed reduced cell growth and morphological changes after two days. After 11 days of dox treatment, the cells adopted a neuronal morphology with long processes. During the 11-day time-course, there was a dox-dependent activation of NEUROG2 mRNA and protein (Fig. 1c–e) that preceded rapid differentiation of the H9-N1 stem cells as demonstrated by the loss of pluripotency markers such as POU5F1 and NANOG (Supplementary Fig. 2). At the end of 11 days of dox treatment, the cells also positively immunostained for neuronal markers including MAP2, NEUN, MAPT (TAU), SYN, and PSD95 genes (data not shown).
To understand the specific transcriptional alterations that were involved in the dox-induced differentiation, time course samples (Fig. 2a) were subjected to RNASeq analysis. This analysis identified over 2600 genes that were induced and over 1900 genes repressed by dox treatment (fold change > 5). The untreated H9-N1 cells showed very low expression of genes commonly associated with neural development, synaptic signaling, and neuronal differentiation. In contrast, many neuronal marker genes were significantly upregulated in the dox-treated H9-N1 siNeurons. For example, MAP2 and SYN genes demonstrated 50 and 20 fold increases, respectively. A selected list of highly induced and repressed genes over the time course is shown in Table 1. Among the induced genes were glutamate receptors (GRIA2, GRIK1), neuron-specific microtubule associated genes (DCX, MAPT, GAP43), synaptic vesicle associated genes (SLC17A6), and voltage gated sodium channel gene (SCN3A). Many of the highly repressed genes were associated with the pluripotency markers (NANOG, POU5F1), inhibition of transcription (ID3), and cell adhesion genes (CDH1, EPHA1, ITGB5).
Figure 2. RNA-Seq and Gene Ontology analysis.

(a) Experimental diagram showing the time points of RNA-Seq analysis of control and siNeurons at day 5 and day 11. (b) Gene ontology terms for the transcripts that were induced 50-fold or higher compared to the day 0 control using DAVID analysis and p-value as criteria for selection. (c) Pie-chart showing the GO term distribution at the biological process among the 2600 genes with GO terms, most notable of which are the nervous system development genes. (d) RNA-Seq data showing the normalized gene expression counts of bHLH transcription factor NEUROG2 as dox-dependent induction with minimal basal expression in hESCs. (e) Normalized gene expression of SLC17A6 (vGLUT2) showing the enrichment of marker upon induction whereas the hESCs are almost devoid of the glutamatergic marker.
Table 1.
Selected induced or repressed genes by RNASeq analysis at various time points following Neurog2 induction
| INDUCED | ||
|---|---|---|
| Gene Symbol | Fold Induction at day 5 | Fold Induction at day 11 |
| GRIA2 | 3396.57 | 5057.72 |
| SCN3A | 2100.76 | 1500.40 |
| SLC17A6 | 1097.29 | 947.55 |
| NTRK2 | 157.19 | 752.25 |
| CDK5R2 | 318.45 | 353.92 |
| CAMK2B | 174.92 | 353.90 |
| MAPT | 258.11 | 305.12 |
| GRIK1 | 193.77 | 249.42 |
| DCX | 306.76 | 229.58 |
| GAP43 | 189.09 | 144.41 |
| REPRESSED | ||
| Gene Symbol | Fold Repression at day 5 | Fold Repression at day 11 |
| NANOG | 0.0035 | 0.0034 |
| FGF19 | 0.0000 | 0.0029 |
| ITGB5 | 0.0067 | 0.0024 |
| CDH1 | 0.0052 | 0.0022 |
| TDGF1 | 0.0035 | 0.0013 |
| LCK | 0.0007 | 0.0008 |
| CLDN7 | 0.0022 | 0.0023 |
| POU5F1 | 0.0058 | 0.0044 |
| ID3 | 0.0060 | 0.0053 |
| EPHA1 | 0.0128 | 0.0029 |
Fold change from uninduced day 0 level is indicated
Gene ontology (GO) enrichment analysis demonstrated that the most highly induced genes (50-fold or greater) were associated with nervous system development genes (e.g., SCN3B, NEUROD2, NEURL1, DCX), axon guidance (e.g., RELN, EPHA5, NTRK1, CDK5R2) and chemical synaptic transmission (e.g., GRIK1, GRIK2, SYT5, SCNG) (Fig. 2b–c, Supplementary Table 2). The p-values associated with processes occurring later in maturation of neurons such as glutamate secretion and synapse assembly were highly significant (Fig. 2b). These results demonstrate that NEUROG2 drives an extended program of neuronal differentiation of hESCs. The GO analysis for the genes that were induced 5-fold or higher in the hESCs was most significantly associated with cell-cell signaling (e.g., FGF17, FGF21, MLN), cell adhesion (e.g., ACAN, CDH15, FREM3), and cell differentiation (e.g., ONECUT3, GADD45G, SOX15). The normalized gene expression values of NEUROG2 and vGLUT2 from the RNA-Seq analysis showed significant expression of NEUROG2 and vGLUT2 only after dox treatment (Fig. 2d–e).
Guided by the RNA-Seq analysis, the highly induced transcripts for neural fate commitment, synaptic machinery components, and glutamatergic markers were confirmed using real time quantitative PCR as shown in Fig. 3a. The synaptic gene SYN was induced 50-fold over the time course of 11 days whereas vGLUT2 was increased over a 1000-fold. The neuron-specific cytoskeletal genes DCX and MAPT were also highly induced with 500-fold and 250-fold inductions, respectively. The proneural activity of NEUROG2 initiates a gene transcriptional program directing the cells to exit the cell cycle and activate other downstream transcription factors, such as NEUROD1, converting stem cells to a homogenous population of glutamatergic neurons. Genes associated with synapse assembly (NRXN1, NLGN1), release of transmitters (BSN/CHGA-B), and voltage gated sodium and potassium channel genes (SCN1A, KCNQ2) were also highly induced in H9-N1 siNeurons over the time course (data not shown). Consistent with the transcriptional changes, differential protein expression of the neuronal proteins vGLUT2, SYN, PSD95, and MAPT was also observed by immunoblot analyses (Fig. 3b).
Figure 3. Verification of gene expression changes and glutamatergic fate of siNeurons.

(a) Quantification of selected mRNA levels in H9-N1 cells with (Dox) or without (Control) doxycycline induction to generate siNeurons over a time course from day 0-day 11. Levels are normalized to GAPDH mRNA levels as an endogenous control. Data is represented as means and bars indicate the standard deviation between triplicate samples. Induction of glutamate transporter gene SLC17A6 (vGLUT2), human synapsin-1 (SYN), calcium/calmodulin-dependent protein kinase II alpha (Camk2a), Microtubule associated protein tau (MAPT ;TAU), DCX, and MAP2 is shown. (b) Immunoblot analyses of proteins vGLUT2, SYN, PSD95, and MAPT (TAU) extracted from induced (+dox) or uninduced (-dox) siNeuron samples at day 5 and day 11. GAPDH served as a loading control.
Characterization of siNeurons expressing GCaMP6F to monitor real time calcium changes in culture
Genetically encoded calcium sensors are important tools to study the functional activity of neurons. In order to probe the functionality of the siNeurons, GCaMP6f was used as a calcium indicator and the vector MT-CAG-GCaMP6f-MT and a MT-US2-TetON-IRES-mCherry plasmid (Fig. 4a) was used to generate stable lines in the H9 hESCs in a manner similar to that described above for the H9-N1 cell line. Among the 24 clones selected based on uniform mCherry expression, we selected two clones (H9-N2 and H9-N3) that also showed high uniform GCaMP6f expression for further analysis. A similar differentiation scheme to that used for H9-N1 differentiation (Fig. 1b) was used to study the H9-N2 and H9-N3 siNeurons derived from these cells except that dox treatment was discontinued after six days (Fig. 4b). Immunostaining of these cells showed that at the end of 11 days of differentiation 100% of the cells were MAP2+/TUJ1+ (Fig. 4c). A hallmark of neuronal identity is the post-mitotic nature of the cells. As dox treatment induces NEUROG2 and activates a transcriptional program, the cells exit the cell cycle after two days of dox treatment while committing to a neural fate. By the end of day six, the vast majority (98.8%) of cells were post-mitotic as quantified by the number of cells capable of incorporating 5-ethynyl-2′-deoxyuridine (EdU) during the cell cycle (Fig. 4d–e). Upon qRT-PCR characterization of these cells for gene expression, the cells homogenously expressed the proneural transcription factor (NEUROG2), neuronal markers (DCX), synaptic markers (SYN), signaling markers (CAMKIIA, CAMKIIB), and glutamatergic markers (vGLUT1, vGLUT2) in the two independent cell lines (Figure 4f and data not shown).
Figure 4. Generation of stable inducible neurons expressing GCaMP6f for calcium imaging.

(a) Schematic of the pMinitol2-derived vectors that allow for generation of stable clones with the GCaMP6f under a CAG promoter, which allows for monitoring calcium status of cells. (b) Time-course of differentiation showing the generation of siNeurons that includes plating at day-1, dox treatment in E8 media for 2 days, media change to 3N with dox for additional 4 days, and finally removal of dox for analysis. (c) Brightfield, MAP2 (red), DAPI (blue) and MAP2/DAPI composite images of siNeurons differentiated with dox for 11 days. (d) Tuj1 (green), and EdU (red) staining after EdU labelling for 2.5h. (e) Quantification of number of cells incorporating EdU in the time course showing 98.8% cells are post-mitotic at day 6. The data is representative of three independent experiments (n=3) (f) Quantitative mRNA expression showing high inductions of NEUROG2, SYN and vGLUT1 upon induction with dox as normalized to GAPDH internal control for two independent cell lines. Error bars represent the standard deviation between the triplicate samples and are representative of three independent experiments.
To study the functional activity of the siNeurons, calcium signaling in the cells was examined. Very little change in siNeuron cytoplasmic calcium was observed by fluorescence microscopy in the 3N differentiation media. However, beginning at day seven following dox treatment a greater number of cells displayed spontaneous calcium transients in an imaging buffer (EM buffer) used previously for calcium imaging of rat cortical neurons in culture (Tibau et al. 2013) (Fig. 5a–b). This increase in the number of calcium transients correlated with increased activity observed on multi electrode array (MEA) recordings, which was first observed after five days of dox treatment. The MEA spontaneous activity increased gradually up to 21 days following dox treatment (Fig. 5c). While only a low percentage of siNeurons showed spontaneous calcium transients in EM buffer (<3%) at 12 days of differentiation, the fraction of cells displaying spontaneous calcium transients increased 20-fold following a pre-incubation with 2.5 mM glutamine (Gln). This increase in observed calcium transients was dependent on extracellular calcium in the imaging buffer (Fig. 5b). Furthermore, these calcium transients were partially blocked with kynurenic acid, suggesting that the calcium transients induced by Gln pretreatment are at least partially mediated by NMDA receptors (Fig. 5b). This finding is also consistent with an increase in transcription of the GRIA2, GRIA3, GRIA4, GRIK1, GRIK2, GRIK3, and GRIN3A genes in siNeurons observed by RNA-Seq (Supplementary Table 2). If cells incubated with 2.5 mM glutamine and EM buffer were allowed to recover in 3N media, a time-dependent induction of FOS was seen after the spontaneous calcium transients were observed (Fig. 5d) suggesting that the calcium transients resulted in transcriptional regulation of FOS. This notion would be consistent with the induction of CAMKIIA and CAMKIIB in siNeurons (Fig. 3).
Figure 5. Calcium imaging of stable inducible neurons and the effect of FGF2.

(a). GCamp6f fluorescent images of siNeurons at day 12 in EM buffer with 2.5 mM Gln showing fluorescence at the times indicated. Arrows indicate two neurons that show intermittent simultaneous spiking of calcium fluorescence. (b) Quantitation of the fraction of siNeurons at day 12 showing spontaneous calcium transients over a 20 min recording period in control EM media, EM media containing 2.5 mM Gln, EM media containing 2.5 mM Gln but lacking calcium, and EM media containing 2.5 mM Gln (*) and 2 mM kynurenic acid (**). Data representative of three independent experiments (n=3). (c) MEA measurements of spontaneous spike frequency in siNeurons as a function of differentiation time. (d) Induction of FOS protein at various times following calcium imaging experiments in EM buffer containing 2.5 mM Gln. Control indicates siNeurons incubated for 2h in EM buffer without Gln. (e) Effect of FGF2 treatment on spontaneous calcium activity of neurons incubated with or without 2 ng/ml FGF2 for 6 days and imaged at day 6 or treated for days 7–12 and imaged at day 12 (*). Statistical significance using Student’s t-test is shown as *, p<0.05; **, p<0.01.
Functional effects of FGF2 treatment of siNeurons
In order to determine if FGF2 treatment altered the spontaneous calcium transients, we included 20 ng/ml FGF2 in the culture media during differentiation. When FGF2 was included for the first six days of dox treatment and the cells were imaged with 2.5 mM Gln pre-treatment, no significant difference in calcium transients was observed between the control and FGF2-treated cells (Fig. 5e). However, when H9-N2 and H9-N3 cells were differentiated for six days in the absence of FGF2 and then FGF2 was added to the media for an additional six days, a significant increase in spontaneous calcium transients was observed. The fraction of the post-mitotic siNeurons showing calcium transients increased from 21% in the absence of FGF2 to 44% in the presence of FGF2 (Fig. 5e). MEA recordings show that the H9-N2 cells in presence of FGF2 have a significantly higher spike frequency (Fig. 5e).
Synaptic signaling genes are activated in siNeurons upon treatment with FGF2
To determine the molecular basis of FGF2-enhanced spontaneous activity observed in siNeurons, the H9-N2 and H9-N3 cells were treated with dox in the absence or presence of FGF2 over a time course similar to that used in the calcium imaging studies (Fig. 6a). One treatment of siNeurons (H9-N2 and H9-N3) was for six days with dox in the presence or absence of 20 ng/ml FGF2. A second set of siNeurons was grown for six days with dox only and then cultured for an additional six days in the presence or absence of FGF2. RNA was isolated from these eight samples (H9-N2 at 6 days with and without FGF2, H9-N2 at 12 days with and without FGF2, H9-N3 at 6 days with and without FGF2, and H9-N3 at 12 days with and without FGF2). Bioinformatic analysis of the RNA-Seq from the 6d damples showed that no genes were significantly altered in the two cell lines by FGF2 treatment. However, for the 12 d samples, 834 genes were found to be differentially expressed after FGF2 treatment by DESeq2 analysis (p<0.05). A selected list of highly induced and repressed genes are outlined in Table 2. The induced genes have been categorized into three broad categories: a) widely expressed FGF2 signaling component genes that includes the immediate early gene EGR1, transcription factors upregulated by FGF2 signaling such as ETV4 and ETV5, and negative regulators of FGF2 signaling including SPRY4 and DUSP6; b) FGF-regulated genes previously characterized in selected tissues other than brain including KITLG and PI3KAP1; c) FGF2-regulated genes in synaptic signaling that have not been previously reported including a novel presynaptic gene NRXN3, synaptic vesicle membrane gene SYT2, and a galanin receptor GALR1.
Figure 6. Global transcription effects of FGF2 on siNeurons.

(a) Experimental design to study the transcriptional gene changes upon treatment of siNeurons with 20 ng/ml FGF2 for different durations over 12 days during or after Dox treatment. (b) Gene Ontology terms attributed to highly induced gene transcripts (fold change >5) in the presence of FGF2. (c) Pie-chart showing the GO biological process term distribution among the 834 differentially expressed genes. (d–f) Normalized gene expression levels reported by RNA-Seq for the induced genes, PEA3 (ETV4), SPRY4, and NRXN3 in two independent cell lines at day 6 and day 12 respectively. No significant difference was seen at day 6 but the expression level increased (ETV4, NRXN3) or decreased (SPRY4) significantly in presence of FGF2 at day 12. (g–i) Quantification of mRNA levels for the genes PEA3 (ETV4), SPRY4, and NRXN3 in biological triplicates of two independent cell lines showing a significant increase in expression in the presence of FGF2; **, p<0.01.
Table 2.
Selected induced or repressed genes by RNA-Seq analysis at day 12 following FGF treatment to siNeurons
| INDUCED | ||
|---|---|---|
| Gene Symbol | Fold Induction | Category |
| ETV4 | 66.73 | FGF signaling |
| DUSP6 | 8.25 | FGF signaling |
| SPRY4 | 10.69 | FGF signaling |
| EGR1 | 7.69 | FGF signaling |
| ETV5 | 2.51 | FGF signaling |
| KITLG | 8.9 | FGF regulation in other tissues |
| PI3KAP1 | 16.71 | FGF regulation in other tissues |
| NRXN3 | 3.43 | Synaptic signaling |
| SYT2 | 4.45 | Synaptic signaling |
| SYNDIG1L | 33 | Synaptic signaling |
| REPRESSED | ||
| Gene Symbol | Fold Repression | Category |
| CYP26A1 | 0.18 | Retinoic Acid Binding |
| ANOS1 | 0.32 | Axonal migration |
| CHRNB3 | 0.35 | Nicotinic Acetylcholine Receptor |
| HTR7 | 0.41 | Serotonin Receptor |
| NF1B | 0.41 | Transcription Factor |
| P2RY1 | 0.48 | Purinergic Receptor |
| DGKK | 0.5 | Diacylglycerol kinase activity |
| PDZRN3 | 0.55 | Differentiation in other tissues |
| SSTR1 | 0.53 | Somatostatin Receptor |
| TACR1 | 0.47 | Tachykinin Receptor |
| TMEM132C | 0.47 | ND |
Fold change from uninduced day 0 level is indicated
Gene ontology enrichment analysis was done for the genes that were induced 5-fold or higher in response to FGF2 treatment using DAVID. The GO terms with the highest p-values and fold enrichments were attributed to signal transduction, positive regulation of transcription, MAPK cascade, and receptor tyrosine kinase signaling (Fig. 6b–c). Normalized gene expression of the highly induced transcription factor gene ETV4 as determined by RNA-Seq showed that there was no significant change in the normalized counts during differentiation and the induction was mediated by FGF2 at day 12 (Fig. 6d). In contrast, the normalized counts for SPRY4 expression decreased during differentiation. It has been reported previously that the SPRY2 and SPRY4 genes of the sprouty gene family are highly expressed in hESCs and decrease with differentiation (Felfly & Klein 2013). However, in the presence of FGF2 at day 12, expression of SPRY4 was induced (Fig. 6e). The neuronal specific gene NRXN3 increased with differentiation but the fold induction was significantly higher when treated with FGF2 (Fig. 6f). The regulation of these genes was confirmed by qRT-PCR in biological triplicates in the two independent cell lines (Fig. 6g–i). The regulation of NRXN3 by FGF2 was small but it was replicated in our experiments with statistical significance (Student’s t test; p<0.01). Other genes that were found to be regulated by FGF2 are DUSP6, SYT2, and GALR1 that were also confirmed by qRT-PCR (Supplementary Fig 3).
FGF2 regulates gene transcription via Ras/MAP kinase pathway
In order to characterize the signal transduction pathway leading to gene regulation of the candidate genes identified by RNA-Seq after FGF2 treatment, we used a shorter 24 h time course of FGF2 treatment. The observed induction of EGR1 and NXF1 in the RNA-Seq analysis suggested that immediate early genes were regulated by FGF2 in siNeurons. As a critical immediate early gene, transcription of FOS has been studied extensively and it has been clearly established that FOS plays a critical role in establishment of neuronal circuits (Flavell & Greenberg 2008). Upon acute treatment of H9-N2 and H9-N3 siNeurons with 2 ng/ml FGF2 for up to 24 h (Fig. 7a–b), we found by qRT-PCR that the immediate early gene transcription factors FOS, EGR1, and NXF were induced 2000-fold, 500-fold and 15-fold, respectively, within 60 min of treatment with FGF2. These transcription factors preceded a later 200-fold induction of SPRY4 after 8 h, and ETV4 as well as KITLG were induced after 12 h of FGF2 treatment. The neuron-specific genes that we identified from our RNA-Seq analysis, NRXN3, SYT2, and GALR1, showed a 3–4-fold induction after 12 h of FGF2 treatment. The immediate early gene expression changes with FGF2 treatment by qRT-PCR were correlated with the protein products seen after western blotting as well as immunostaining (Fig. 7c, Supplementary Fig. 4). The FGF2-mediated increase in NRXN3 mRNA was reproducible and replicated in our study, but no increase in NRXN3 protein was observed by either western blotting or immunostaining (data not shown). The neurexins NRXN1 and NRXN2 also increase in expression in siNeurons over the differentiation time course but only the expression of NRXN3 is increased by FGF2 treatment (Supplementary Fig. 5). These acute responses to FGF2 treatment were also confirmed using a completely independent control iPSC siNeuron line generated in a manner identical to H9-N2 and H9-N3 cells (Supplementary Fig. 6).
Figure 7. FGF2 regulation in siNeurons affect the downstream MAPK signaling pathway.

(a,b) Time-course induction of genes responsive to 2 ng/ml FGF2 over 24h. The IEGs FOS, EGR1 and NXF are induced within 60 min, SPRY4 within 8h and ETV4, NRXN3, GALR1 within 12 h. (c) Immunoblot analyses of FOS and EGR1 protein over a 24 h treatment with 2 ng/ml FGF2. GAPDH is used as a loading control. (d) Inhibition of FOS gene expression upon treatment with PD173074 (red bars), a FGFR1 inhibitor. (e) Inhibition of FOS gene expression upon treatment with PD098059 (red bars), a MAPK inhibitor. (f) Induction of FOS gene expression only in H9-N2 siNeurons (+dox) and not in undifferentiated H9-N2 hESCs (-dox).
The strong induction of FOS in the presence of FGF2 was essentially abolished by pre-treating the cells with a FGFR1 inhibitor, PD173074, or by pre-treating with the MAPK inhibitor, PD098059 (Fig, 7d–e). These results suggest that the immediate early gene induction by FGF2 in siNeurons is mediated through the classical FGFR activation pathway and the downstream Ras/MAPK pathway. FOS mRNA was also induced by feeding siNeurons with fresh media in the absence of any external growth factor. A maximal induction of FOS by FGF2, required that the media remain unchanged prior to FGF2 addition (Supplementary Fig. 7). Importantly, the FGF2-induced FOS activation was significantly enhanced in differentiated siNeurons compared to the undifferentiated cells in 3N media (Fig 7f). The siNeurons showed a maximal 600-fold induction of FOS mRNA with FGF2 treatment while the undifferentiated cells showed only a 5-fold induction of FOS mRNA. This increased sensitivity of siNeurons to FGF2 suggests that a fundamental change in FGF2 signaling occurred during siNeuron differentiation.
Discussion
MDD is a human brain disorder without a clear molecular mechanism, however the potential role of FGF2 in MDD is supported by postmortem human studies and animal behavioral experiments (Turner et al. 2016). The number of genes contributing to MDD susceptibility and their relative contribution is still highly debated (Flint & Kendler 2014). In any human brain disorder, a molecular level analysis of gene expression can be the key to understanding the underlying pathophysiology of the disease. The use of hiPSCs in monogenic disorders like Rett syndrome has been advantageous in understanding the role of the gene, identifying potential druggable targets, and developing drug screening systems (Marchetto et al. 2010). However, in a polygenic mood disorder like MDD, the combinatorial interactions of participating genes can be difficult to study. Furthermore, the multiple cell types seen during in vitro neural differentiation of human stem cells and the variability in their yields can confound genetic analysis. Here, we decided to focus on the effects of FGF2 on a single cell type to determine the possible neurochemical consequences of the altered FGF2 expression levels seen in postmortem human brain studies.
Directed neuronal differentiation using transcription factors has been widely applied to generate induced neurons (iNs) to study human neurological disorders. These iN cultures are generally more homogeneous and more rapidly differentiating than neuronal cultures derived with small molecules altering endogenous signaling components (Masserdotti et al. 2016). Zhang and colleagues described a method of generating a relatively pure population of excitatory neurons by lentiviral transduction of both the rtTA transcriptional regulator and tetracycline responsive promoter into hESCs (Zhang et al. 2013). Viral transduction of NEUROG2 together with puromycin selection to increase purity of cultures yielded populations of iNs that were TUJ1/MAP2+ (90%) within 14 days. iNs exhibited excitatory functional synapses when co-cultured with mouse cortical neurons after three weeks. Single cell qRT-PCR analysis demonstrated induced expression of many neuronal genes that are not expressed in stem cells, including genes for glutamate receptors, vesicular glutamate transporters, and synaptic proteins.
In this study, a Tol2 transposon system (Meir et al. 2011) was used for gene transfer of NEUROG2 in H9 hESCs and hiPSCs. The vectors containing the Tol2 transposon inverted terminal repeats were designed for integration into the chromosome in the presence of a Tol2 recombinase. The use of Tol2-based chromosomal integration allows for easy generation of clones that are stable over >20 passages. After treatment with dox, the cells adopted a neuronal morphology within two days, exited the cell cycle, and showed detectable spontaneous calcium activity and action potentials within a week. RNA-Seq analysis of differentiated siNeurons showed large increases in the expression of pan-neuronal markers (DCX, MAP2), neuronal signaling proteins (CAMKIIA, CAMKIIB), synaptic proteins (SYN, DLG4), and cell-type specific glutamatergic neurotransmission proteins (vGLUT2, GRIA2, GRIK1). Furthermore, specific cortical neuronal markers such as FOXG1 and SATB2 were also induced.
In calcium imaging experiments, the siNeurons (H9-N2 and H9-N3) displayed spontaneous intracellular calcium fluctuations which were enhanced after Gln pre-treatment. The spontaneous calcium fluctuations resulted in induction of mRNA for the immediate early gene, FOS. The spontaneous calcium fluctuations of differentiated H9-N2 and H9-N3 siNeurons were partially mediated by glutamate receptors since the spontaneous calcium activity was reduced significantly by kynurenic acid.
We used the spontaneous calcium activity of siNeurons to determine if FGF2 altered their function. We hypothesized that FGF2 would increase the glutamatergic signaling in human neurons based on the previous literature that shows FGF2 increases glutamatergic signaling in rat neurons (Li et al. 2002). Our results revealed that FGF2 treatment enhanced the spontaneous calcium activity of postmitotic H9-N2 and H9-N3 neurons at day 12 after initiation of differentiation. While FGF2 has been demonstrated to have profound effects on neurogenesis, the majority of these effects are on mitotic neural stem cells and neuronal precursors (Palmer et al. 1995). In our experiments, FGF2 effects are on post-mitotic siNeurons and FGF2 alters their synaptic function.
To understand the transcriptional changes that regulate the increase in synaptic activity of neurons in the presence of FGF2, we identified genes that were responsive to FGF2 as well as the signaling mechanism of action of FGF2. In agreement with the time course of FGF2 effects on calcium imaging, no genes were responsive to FGF2 in RNASeq analysis after six days. However, after 12 days, over 800 genes were found to be differentially regulated by FGF2. The gene that showed the highest induction by FGF2 was ETV4 (PEA3) which encodes a transcription factor that has been shown to be regulated by FGFs in mouse development, zebrafish development, and NIH3T3 cells (Mao et al. 2009, Vinothkumar et al. 2008). A second highly induced gene in siNeurons was a member of the sprouty family, SPRY4, which is an antagonist of RTK signaling (Mason et al. 2006). The expression of SPRY4 is known to decrease with differentiation of hESCs into neurons (Felfly & Klein 2013, Lee et al. 2016). Possibly due to the low expression of SPRY4 in differentiated neurons, the H9-N2 and H9-N3 siNeurons showed increased sensitivity to FGF2 in terms of FOS gene induction. Decreased SPRY4 is expected to cause increased RTK signaling in response to growth factors (Felfly & Klein 2013). Like SPRY4, the down regulation of DUSP6 during siNeuron development and induction by FGF2 at day 12 was also seen in our studies. FGF2 regulation of DUSP6 has also been shown in NIH3T3 cells, zebrafish and mouse development (Li et al. 2007). The induction of DUSP6 is through the MAPK pathway and it produces feedback inhibition of FGF signaling (Ekerot et al. 2008).
Another FGF2-regulated gene that was identified by RNA-Seq was ANOS1 encoding an extracellular matrix-associated protein. ANOS1 was repressed upon FGF2 treatment. Mutations in ANOS1 (KAL1) gene cause X-linked Kallmann syndrome type I and mutations in the FGFR1 gene cause Kallmann syndrome type II. A strong similarity of patient phenotypes has suggested a functional interaction between ANOSI and FGFR1 genes (Salenave et al. 2008, Sarfati et al. 2015). The precise mechanism remains unclear but the functional interaction has been shown in developing optic nerve and olfactory neuroblasts (Hu et al. 2009).
A distinct set of FGF2-regulated genes that were expressed only in neurons and have not been reported previously included NRXN3, SYT2, and GALR1. The NRXN3 gene encodes a receptor molecule that acts as a presynaptic organizer of synapse function. This gene has been associated in GWAS studies with ASD (Vaags et al. 2012), schizophrenia (Novak et al. 2009, Brown et al. 2011), bipolar I disorder (Kuo et al. 2014) and MDD (Shyn et al. 2011). Neurexins have been widely studied for their activities in presynaptic vesicle release and post synaptic density assembly. Their impact has also been shown on glutamatergic and GABAergic synapses (Graf et al. 2004). It is possible that the transcriptional induction of NRXN3 is at least partially responsible for the enhancement of spontaneous activity of siNeurons upon treatment with FGF2. A second neuronal gene that was found to be regulated by FGF2 is the galanin receptor I gene (GALR1). Rodent experiments suggest that the neuropeptide galanin (GAL) and its three G-protein coupled receptors GALR1–3 are involved in mood regulation (Juhasz et al. 2014). Human genetic studies have shown the involvement of the galanin system in pshychiatric disorders and MDD (Barde et al. 2016). GAL and GALR1 have CRE binding sites (Zachariou et al. 2001) which could respond to the FGF2 activated Ras/MAP kinase pathway and phosphorylation of CREB.
There is evidence that FGF2 treatment improves long term memory in rats (Graham & Richardson 2009), enhances neurogenesis (Raballo et al. 2000), and improves behavior in models of MDD (Turner et al. 2008). In general, the intracellular mechanisms of action and the cell types involved in these effects remain unclear. The aim of our study was to identify the potential signaling mechanisms and target genes that are specifically altered by FGF2 in postmitotic excitatory neurons. Our findings suggest that siNeurons represent a tractable model to further explore the detailed mechanisms of FGF2 regulation of neuronal gene expression and synaptic function.
Supplementary Material
Acknowledgments
This work was funded by the Pritzker Neuropsychiatric Disorders Research Consortium, which is supported by the Pritzker Neuropsychiatric Disorders Research Fund L.L.C. A shared intellectual property agreement exists between this philanthropic fund and the University of Michigan, Stanford University, the Weill Medical College of Cornell University, the University of California at Irvine, and the Hudson Alpha Institute for Biotechnology to encourage the development of appropriate findings for research and clinical applications.
Abbreviations used
- MDD
Major depressive disorder
- FGF
Fibroblast growth factor
- FGFR
Fibroblast growth factor receptor
- BDNF
Brain-derived neurotrophic factor
- GDNF
Glial cell line-derived neurotrophic factor
- DLPFC
dorsolateral prefrontal cortex
- ACC
anterior cingulate cortex
- ESCs
Embryonic stem cells
- iPSCs
Induced pluripotent stem cells
- EDTA
Ethylenediaminetertaacetic acid
- Dox
Doxycycline
- MAPK
Mitogen-activated protein kinase
- PLC/PKA
Phospholipase C/Protein kinase A
- STAT
Signal Transducer and Activator of Transcription
- TRE
Tetracycline response elements
- IRES
Internal ribosome entry site
- EGFP
Enhanced green fluorescent protein
- EdU
5-ethynyl-2′-deoxyuridine
- qRT-PCR
Quantitative real-time PCR
- MEA
Multielectrode array
- PEI
Polyethyleneimine
- GO
Gene ontology
- RTK
Receptor tyrosine kinase
- GWAS
Genome-wide association studies
Footnotes
Conflict of interest disclosure
All authors declare no actual or potential conflicts of interest.
References
- Bachis A, Mallei A, Cruz MI, Wellstein A, Mocchetti I. Chronic antidepressant treatments increase basic fibroblast growth factor and fibroblast growth factor-binding protein in neurons. Neuropharmacology. 2008;55:1114–1120. doi: 10.1016/j.neuropharm.2008.07.014. [DOI] [PMC free article] [PubMed] [Google Scholar]
- Balciunas D, Wangensteen KJ, Wilber A, et al. Harnessing a high cargo-capacity transposon for genetic applications in vertebrates. PLoS Genet. 2006;2:e169. doi: 10.1371/journal.pgen.0020169. [DOI] [PMC free article] [PubMed] [Google Scholar]
- Barde S, Ruegg J, Prud’homme J, et al. Alterations in the neuropeptide galanin system in major depressive disorder involve levels of transcripts, methylation, and peptide. Proc Natl Acad Sci U S A. 2016;113:E8472–E8481. doi: 10.1073/pnas.1617824113. [DOI] [PMC free article] [PubMed] [Google Scholar]
- Bardy C, van den Hurk M, Eames T, et al. Neuronal medium that supports basic synaptic functions and activity of human neurons in vitro. Proc Natl Acad Sci U S A. 2015;112:E2725–2734. doi: 10.1073/pnas.1504393112. [DOI] [PMC free article] [PubMed] [Google Scholar]
- Beers J, Gulbranson DR, George N, Siniscalchi LI, Jones J, Thomson JA, Chen G. Passaging and colony expansion of human pluripotent stem cells by enzyme-free dissociation in chemically defined culture conditions. Nat Protoc. 2012;7:2029–2040. doi: 10.1038/nprot.2012.130. [DOI] [PMC free article] [PubMed] [Google Scholar]
- Brown SM, Clapcote SJ, Millar JK, et al. Synaptic modulators Nrxn1 and Nrxn3 are disregulated in a Disc1 mouse model of schizophrenia. Mol Psychiatry. 2011;16:585–587. doi: 10.1038/mp.2010.134. [DOI] [PubMed] [Google Scholar]
- Duman RS, Aghajanian GK. Synaptic dysfunction in depression: potential therapeutic targets. Science. 2012;338:68–72. doi: 10.1126/science.1222939. [DOI] [PMC free article] [PubMed] [Google Scholar]
- Eisch AJ, Petrik D. Depression and hippocampal neurogenesis: a road to remission? Science. 2012;338:72–75. doi: 10.1126/science.1222941. [DOI] [PMC free article] [PubMed] [Google Scholar]
- Ekerot M, Stavridis MP, Delavaine L, et al. Negative-feedback regulation of FGF signalling by DUSP6/MKP-3 is driven by ERK1/2 and mediated by Ets factor binding to a conserved site within the DUSP6/MKP-3 gene promoter. Biochem J. 2008;412:287–298. doi: 10.1042/BJ20071512. [DOI] [PMC free article] [PubMed] [Google Scholar]
- Elsayed M, Banasr M, Duric V, Fournier NM, Licznerski P, Duman RS. Antidepressant effects of fibroblast growth factor-2 in behavioral and cellular models of depression. Biol Psychiatry. 2012;72:258–265. doi: 10.1016/j.biopsych.2012.03.003. [DOI] [PMC free article] [PubMed] [Google Scholar]
- Evans SJ, Choudary PV, Neal CR, et al. Dysregulation of the fibroblast growth factor system in major depression. Proc Natl Acad Sci U S A. 2004;101:15506–15511. doi: 10.1073/pnas.0406788101. [DOI] [PMC free article] [PubMed] [Google Scholar]
- Felfly H, Klein OD. Sprouty genes regulate proliferation and survival of human embryonic stem cells. Sci Rep. 2013;3:2277. doi: 10.1038/srep02277. [DOI] [PMC free article] [PubMed] [Google Scholar]
- Flavell SW, Greenberg ME. Signaling mechanisms linking neuronal activity to gene expression and plasticity of the nervous system. Annu Rev Neurosci. 2008;31:563–590. doi: 10.1146/annurev.neuro.31.060407.125631. [DOI] [PMC free article] [PubMed] [Google Scholar]
- Flint J, Kendler KS. The genetics of major depression. Neuron. 2014;81:484–503. doi: 10.1016/j.neuron.2014.01.027. [DOI] [PMC free article] [PubMed] [Google Scholar]
- Ford-Perriss M, Abud H, Murphy M. Fibroblast growth factors in the developing central nervous system. Clin Exp Pharmacol Physiol. 2001;28:493–503. doi: 10.1046/j.1440-1681.2001.03477.x. [DOI] [PubMed] [Google Scholar]
- Graf ER, Zhang X, Jin SX, Linhoff MW, Craig AM. Neurexins induce differentiation of GABA and glutamate postsynaptic specializations via neuroligins. Cell. 2004;119:1013–1026. doi: 10.1016/j.cell.2004.11.035. [DOI] [PMC free article] [PubMed] [Google Scholar]
- Graham BM, Richardson R. Acute systemic fibroblast growth factor-2 enhances long-term extinction of fear and reduces reinstatement in rats. Neuropsychopharmacology. 2009;34:1875–1882. doi: 10.1038/npp.2009.14. [DOI] [PubMed] [Google Scholar]
- Guillemot F, Zimmer C. From cradle to grave: the multiple roles of fibroblast growth factors in neural development. Neuron. 2011;71:574–588. doi: 10.1016/j.neuron.2011.08.002. [DOI] [PubMed] [Google Scholar]
- Hu Y, Guimond SE, Travers P, Cadman S, Hohenester E, Turnbull JE, Kim SH, Bouloux PM. Novel mechanisms of fibroblast growth factor receptor 1 regulation by extracellular matrix protein anosmin-1. J Biol Chem. 2009;284:29905–29920. doi: 10.1074/jbc.M109.049155. [DOI] [PMC free article] [PubMed] [Google Scholar]
- Huang DW, Sherman BT, Lempicki RA. Systematic and integrative analysis of large gene lists using DAVID bioinformatics resources. Nat Protoc. 2009;4:44–57. doi: 10.1038/nprot.2008.211. [DOI] [PubMed] [Google Scholar]
- Huang HS, Kubish GM, Redmond TM, Turner DL, Thompson RC, Murphy GG, Uhler MD. Direct transcriptional induction of Gadd45gamma by Ascl1 during neuronal differentiation. Mol Cell Neurosci. 2010;44:282–296. doi: 10.1016/j.mcn.2010.03.014. [DOI] [PMC free article] [PubMed] [Google Scholar]
- Huang HS, Redmond TM, Kubish GM, Gupta S, Thompson RC, Turner DL, Uhler MD. Transcriptional regulatory events initiated by Ascl1 and Neurog2 during neuronal differentiation of P19 embryonic carcinoma cells. J Mol Neurosci. 2015;55:684–705. doi: 10.1007/s12031-014-0408-2. [DOI] [PubMed] [Google Scholar]
- Jarosik J, Legutko B, Werner S, Unsicker K, von Bohlen Und Halbach O. Roles of exogenous and endogenous FGF-2 in animal models of depression. Restor Neurol Neurosci. 2011;29:153–165. doi: 10.3233/RNN-2011-0588. [DOI] [PubMed] [Google Scholar]
- Juhasz G, Hullam G, Eszlari N, Gonda X, Antal P, Anderson IM, Hokfelt TG, Deakin JF, Bagdy G. Brain galanin system genes interact with life stresses in depression-related phenotypes. Proc Natl Acad Sci U S A. 2014;111:E1666–1673. doi: 10.1073/pnas.1403649111. [DOI] [PMC free article] [PubMed] [Google Scholar]
- Kuo PH, Chuang LC, Liu JR, et al. Identification of novel loci for bipolar I disorder in a multi-stage genome-wide association study. Prog Neuropsychopharmacol Biol Psychiatry. 2014;51:58–64. doi: 10.1016/j.pnpbp.2014.01.003. [DOI] [PubMed] [Google Scholar]
- Lee JY, Park S, Kim KS, Ko JJ, Lee S, Kim KP, Park KS. Novel Function of Sprouty 4 as a Regulator of Stemness and Differentiation of Embryonic Stem Cells. Dev Reprod. 2016;20:171–177. doi: 10.12717/DR.2016.20.2.171. [DOI] [PMC free article] [PubMed] [Google Scholar]
- Li AJ, Suzuki S, Suzuki M, Mizukoshi E, Imamura T. Fibroblast growth factor-2 increases functional excitatory synapses on hippocampal neurons. Eur J Neurosci. 2002;16:1313–1324. doi: 10.1046/j.1460-9568.2002.02193.x. [DOI] [PubMed] [Google Scholar]
- Li C, Scott DA, Hatch E, Tian X, Mansour SL. Dusp6 (Mkp3) is a negative feedback regulator of FGF-stimulated ERK signaling during mouse development. Development. 2007;134:167–176. doi: 10.1242/dev.02701. [DOI] [PMC free article] [PubMed] [Google Scholar]
- Liao Y, Smyth GK, Shi W. The Subread aligner: fast, accurate and scalable read mapping by seed-and-vote. Nucleic Acids Res. 2013;41:e108. doi: 10.1093/nar/gkt214. [DOI] [PMC free article] [PubMed] [Google Scholar]
- Liao Y, Smyth GK, Shi W. featureCounts: an efficient general purpose program for assigning sequence reads to genomic features. Bioinformatics. 2014;30:923–930. doi: 10.1093/bioinformatics/btt656. [DOI] [PubMed] [Google Scholar]
- Love MI, Huber W, Anders S. Moderated estimation of fold change and dispersion for RNA-seq data with DESeq2. Genome Biol. 2014;15:550. doi: 10.1186/s13059-014-0550-8. [DOI] [PMC free article] [PubMed] [Google Scholar]
- Mallei A, Shi B, Mocchetti I. Antidepressant treatments induce the expression of basic fibroblast growth factor in cortical and hippocampal neurons. Mol Pharmacol. 2002;61:1017–1024. doi: 10.1124/mol.61.5.1017. [DOI] [PubMed] [Google Scholar]
- Mao J, McGlinn E, Huang P, Tabin CJ, McMahon AP. Fgf-dependent Etv4/5 activity is required for posterior restriction of Sonic Hedgehog and promoting outgrowth of the vertebrate limb. Dev Cell. 2009;16:600–606. doi: 10.1016/j.devcel.2009.02.005. [DOI] [PMC free article] [PubMed] [Google Scholar]
- Marchetto MC, Carromeu C, Acab A, Yu D, Yeo GW, Mu Y, Chen G, Gage FH, Muotri AR. A model for neural development and treatment of Rett syndrome using human induced pluripotent stem cells. Cell. 2010;143:527–539. doi: 10.1016/j.cell.2010.10.016. [DOI] [PMC free article] [PubMed] [Google Scholar]
- Mason JM, Morrison DJ, Basson MA, Licht JD. Sprouty proteins: multifaceted negative-feedback regulators of receptor tyrosine kinase signaling. Trends Cell Biol. 2006;16:45–54. doi: 10.1016/j.tcb.2005.11.004. [DOI] [PubMed] [Google Scholar]
- Masserdotti G, Gascon S, Gotz M. Direct neuronal reprogramming: learning from and for development. Development. 2016;143:2494–2510. doi: 10.1242/dev.092163. [DOI] [PubMed] [Google Scholar]
- Meir YJ, Weirauch MT, Yang HS, Chung PC, Yu RK, Wu SC. Genome-wide target profiling of piggy Bac and Tol2 in HEK 293: pros and cons for gene discovery and gene therapy. BMC Biotechnol. 2011;11:28. doi: 10.1186/1472-6750-11-28. [DOI] [PMC free article] [PubMed] [Google Scholar]
- Novak G, Boukhadra J, Shaikh SA, Kennedy JL, Le Foll B. Association of a polymorphism in the NRXN3 gene with the degree of smoking in schizophrenia: a preliminary study. World J Biol Psychiatry. 2009;10:929–935. doi: 10.1080/15622970903079499. [DOI] [PubMed] [Google Scholar]
- Okita K, Matsumura Y, Sato Y, et al. A more efficient method to generate integration-free human iPS cells. Nat Methods. 2011;8:409–412. doi: 10.1038/nmeth.1591. [DOI] [PubMed] [Google Scholar]
- Ornitz DM, Itoh N. The Fibroblast Growth Factor signaling pathway. Wiley Interdiscip Rev Dev Biol. 2015;4:215–266. doi: 10.1002/wdev.176. [DOI] [PMC free article] [PubMed] [Google Scholar]
- Palmer TD, Ray J, Gage FH. FGF-2-responsive neuronal progenitors reside in proliferative and quiescent regions of the adult rodent brain. Mol Cell Neurosci. 1995;6:474–486. doi: 10.1006/mcne.1995.1035. [DOI] [PubMed] [Google Scholar]
- Raballo R, Rhee J, Lyn-Cook R, Leckman JF, Schwartz ML, Vaccarino FM. Basic fibroblast growth factor (Fgf2) is necessary for cell proliferation and neurogenesis in the developing cerebral cortex. J Neurosci. 2000;20:5012–5023. doi: 10.1523/JNEUROSCI.20-13-05012.2000. [DOI] [PMC free article] [PubMed] [Google Scholar]
- Ritchie ME, Phipson B, Wu D, Hu Y, Law CW, Shi W, Smyth GK. limma powers differential expression analyses for RNA-sequencing and microarray studies. Nucleic Acids Res. 2015;43:e47. doi: 10.1093/nar/gkv007. [DOI] [PMC free article] [PubMed] [Google Scholar]
- Sacher J, Neumann J, Funfstuck T, Soliman A, Villringer A, Schroeter ML. Mapping the depressed brain: a meta-analysis of structural and functional alterations in major depressive disorder. J Affect Disord. 2012;140:142–148. doi: 10.1016/j.jad.2011.08.001. [DOI] [PubMed] [Google Scholar]
- Salenave S, Chanson P, Bry H, et al. Kallmann’s syndrome: a comparison of the reproductive phenotypes in men carrying KAL1 and FGFR1/KAL2 mutations. J Clin Endocrinol Metab. 2008;93:758–763. doi: 10.1210/jc.2007-1168. [DOI] [PubMed] [Google Scholar]
- Salmaso N, Stevens HE, McNeill J, et al. Fibroblast Growth Factor 2 Modulates Hypothalamic Pituitary Axis Activity and Anxiety Behavior Through Glucocorticoid Receptors. Biol Psychiatry. 2016;80:479–489. doi: 10.1016/j.biopsych.2016.02.026. [DOI] [PMC free article] [PubMed] [Google Scholar]
- Sarfati J, Bouvattier C, Bry-Gauillard H, Cartes A, Bouligand J, Young J. Kallmann syndrome with FGFR1 and KAL1 mutations detected during fetal life. Orphanet J Rare Dis. 2015;10:71. doi: 10.1186/s13023-015-0287-9. [DOI] [PMC free article] [PubMed] [Google Scholar]
- Sherman BT, Huang da W, Tan Q, et al. DAVID Knowledgebase: a gene-centered database integrating heterogeneous gene annotation resources to facilitate high-throughput gene functional analysis. BMC Bioinformatics. 2007;8:426. doi: 10.1186/1471-2105-8-426. [DOI] [PMC free article] [PubMed] [Google Scholar]
- Shi Y, Kirwan P, Smith J, Robinson HP, Livesey FJ. Human cerebral cortex development from pluripotent stem cells to functional excitatory synapses. Nat Neurosci. 2012;15:477–486. S471. doi: 10.1038/nn.3041. [DOI] [PMC free article] [PubMed] [Google Scholar]
- Shyn SI, Shi J, Kraft JB, et al. Novel loci for major depression identified by genome-wide association study of Sequenced Treatment Alternatives to Relieve Depression and meta-analysis of three studies. Mol Psychiatry. 2011;16:202–215. doi: 10.1038/mp.2009.125. [DOI] [PMC free article] [PubMed] [Google Scholar]
- Tanti A, Belzung C. Open questions in current models of antidepressant action. Br J Pharmacol. 2010;159:1187–1200. doi: 10.1111/j.1476-5381.2009.00585.x. [DOI] [PMC free article] [PubMed] [Google Scholar]
- Tibau E, Valencia M, Soriano J. Identification of neuronal network properties from the spectral analysis of calcium imaging signals in neuronal cultures. Front Neural Circuits. 2013;7:199. doi: 10.3389/fncir.2013.00199. [DOI] [PMC free article] [PubMed] [Google Scholar]
- Turner CA, Eren-Kocak E, Inui EG, Watson SJ, Akil H. Dysregulated fibroblast growth factor (FGF) signaling in neurological and psychiatric disorders. Semin Cell Dev Biol. 2016;53:136–143. doi: 10.1016/j.semcdb.2015.10.003. [DOI] [PMC free article] [PubMed] [Google Scholar]
- Turner CA, Gula EL, Taylor LP, Watson SJ, Akil H. Antidepressant-like effects of intracerebroventricular FGF2 in rats. Brain Res. 2008;1224:63–68. doi: 10.1016/j.brainres.2008.05.088. [DOI] [PMC free article] [PubMed] [Google Scholar]
- Vaags AK, Lionel AC, Sato D, et al. Rare deletions at the neurexin 3 locus in autism spectrum disorder. Am J Hum Genet. 2012;90:133–141. doi: 10.1016/j.ajhg.2011.11.025. [DOI] [PMC free article] [PubMed] [Google Scholar]
- Vaccarino FM, Schwartz ML, Raballo R, Rhee J, Lyn-Cook R. Fibroblast growth factor signaling regulates growth and morphogenesis at multiple steps during brain development. Curr Top Dev Biol. 1999;46:179–200. doi: 10.1016/s0070-2153(08)60329-4. [DOI] [PubMed] [Google Scholar]
- Vandeleur CL, Fassassi S, Castelao E, et al. Prevalence and correlates of DSM-5 major depressive and related disorders in the community. Psychiatry Res. 2017;250:50–58. doi: 10.1016/j.psychres.2017.01.060. [DOI] [PubMed] [Google Scholar]
- Vinothkumar S, Rastegar S, Takamiya M, Ertzer R, Strahle U. Sequential and cooperative action of Fgfs and Shh in the zebrafish retina. Dev Biol. 2008;314:200–214. doi: 10.1016/j.ydbio.2007.11.034. [DOI] [PubMed] [Google Scholar]
- Zachariou V, Georgescu D, Kansal L, Merriam P, Picciotto MR. Galanin receptor 1 gene expression is regulated by cyclic AMP through a CREB-dependent mechanism. J Neurochem. 2001;76:191–200. doi: 10.1046/j.1471-4159.2001.00018.x. [DOI] [PubMed] [Google Scholar]
- Zhang Y, Pak C, Han Y, et al. Rapid single-step induction of functional neurons from human pluripotent stem cells. Neuron. 2013;78:785–798. doi: 10.1016/j.neuron.2013.05.029. [DOI] [PMC free article] [PubMed] [Google Scholar]
Associated Data
This section collects any data citations, data availability statements, or supplementary materials included in this article.
Supplementary Materials
Data Availability Statement
RNA-Seq data is available at NCBI GEO (GSE92971).