Abstract
INTRODUCTION
The interaction among cell-autonomous circadian oscillators—daily cycles of activity–rest and feeding–fasting—produces diurnal rhythms in gene expression in almost all animal tissues. These rhythms control the timing of a wide range of functions across different organs and brain regions, affording optimal fitness. Chronic disruption of these rhythms predisposes to and are hallmarks of numerous diseases and affective disorders.
RATIONALE
Time-series gene expression studies in a limited number of tissues from rodents have shown that 10 to 40% of the genome exhibits a ~24-hour rhythm in expression in a tissue-specific manner. However, rhythmic expression data from diverse tissues and brain regions from humans or our closest primate relatives is rare. Such multitissue diurnal gene expression data are necessary for gaining mechanistic understanding of how spatiotemporal orchestration of gene expression maintains normal physiology and behavior. We used a RNA sequencing technique to assess gene expression in major tissues and brain regions from baboons (a primate closely related to humans) housed under a defined 24-hour light– dark and feeding–fasting schedule.
RESULTS
We assessed gene expression in 64 different tissues and brain regions of male baboons, collected every 2 hours over the 24-hour day. Tissue-specific transcriptomes in baboon were comparable with that from humans (Human GTEx data set). We detected >25,000 expressed transcripts, including protein-coding and -noncoding RNAs. Nearly 11,000 genes were commonly expressed in all tissues. These universally expressed genes (UEGs) encoded for basic cellular functions such as transcription, RNA processing, DNA repair, protein homeostasis, and cellular metabolism. The remainders were expressed in distinct sets of tissues, with ~1500 genes expressed exclusively in a single tissue.
Rhythmic transcripts were found in all tissues, but the number of cycling transcripts varied from ~200 to >3000 in a given tissue, with only limited overlap in the repertoire of rhythmic transcripts between tissues. Of the 11,000 UEGs, the vast majority (96.6%) showed 24-hour rhythmicity in at least one tissue. A majority (>80%) of the 18,000 protein-coding genes detected also exhibited 24-hour rhythms in expression. The most enriched rhythmic transcripts across tissues were core clock components and their immediate output targets. However, their relative abundance and robustness of daily rhythms varied across tissues. Considered at the organismal level, global rhythmic transcription in 64 tissues organized into bursts of peak transcription, during early morning and late afternoon (when 11,000 transcripts reach their peak level). By contrast, during a relative “quiescent phase” in early evening that coincides with the onset of sleep and no food intake, only 700 rhythmic transcripts reach their peak expression level.
CONCLUSION
The daily expression rhythms in >80% of protein-coding genes, encoding diverse biochemical and cellular functions, constitutes by far the largest regulatory mechanism that integrates diverse biochemical functions within and across cell types. From a translational point of view, rhythmicity may have a major impact in health because 82.2% of genes coding for proteins that are identified as druggable targets by the U.S. Food and Drug Administration show cyclic changes in transcription.
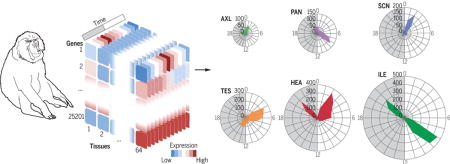
Graphical abstract
Spatiotemporal gene expression atlas of a primate. (Left) Gene expression analysis across 64 tissues of a diurnal primate sampled over the 24-hour day shows that 82% of protein-coding genes are rhythmic in at least one tissue. (Right) Rhythmic expression is tissue-specific and confers an additional layer of regulation and identity to the transcriptome of a given tissue.
Daily cycles in behavior, physiology, and metabolism are presumed to arise from coordinated gene expression rhythms in multiple tissues and brain regions. Gene expression rhythms have been cataloged in a handful of tissues in model organisms (1–3). Among these, the mouse, which is nocturnal and evolutionarily diverged from humans 75 million years ago, is considered as a representative model for mammalian gene expression rhythms. However, these data sets are primarily collected from the laboratory mouse (Mus musculus), which is active mainly at night, generally fed ad libitum, and has fragmented daytime sleep. Although standard laboratory mouse strains do not produce melatonin, wild mice secrete both melatonin and cortisol during the night time. By contrast, diurnal primates, including humans, are active and eat discrete meals during the daytime, produce melatonin at night during their phase of consolidated sleep, and show a daytime peak in corticosteroids (4). Despite these differences in timing of behavior, a study of deoxy-glucose uptake has led to the view that the phase of the master circadian oscillator in the suprachiasmatic nucleus (SCN) is similar in nocturnal rodents and diurnal primates (5). However, limited gene expression data from human blood (6) and post mortem cortex samples (7) have indicated that expression, phase, and amplitude of daily gene expression rhythms in primates differ from that in mice. We therefore analyzed diurnal gene expression profiles of 768 samples across 64 different central and peripheral tissues (Fig. 1 and table S1) from young male baboons (Papio anubis), a close primate relative of humans (diverged 24 million years ago).
Fig. 1. Tissue collection.
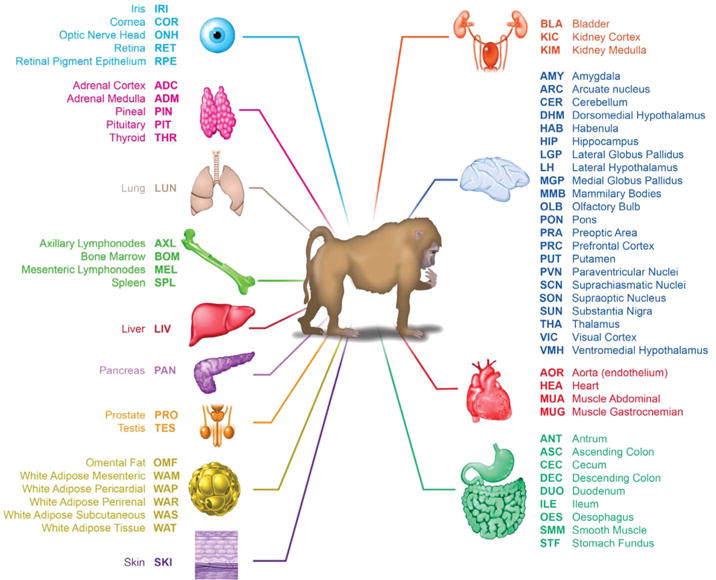
List of the 64 tissues collected, according to system and functional types (including 22 brain regions and nuclei).
Transcriptional complexity across tissues
Animals housed individually in seminatural conditions under a 12 hours light–12 hours dark cycle showed highly stable and synchronous phases of activity, body temperature, and cortisol concentration in the blood across the 24-hour cycle (Fig. 2A and fig. S1, A to E). Tissues were collected every 2 hours across the 24-hour day (ZT0, -2, -4, -6, -8, -10, -12, -14, -16, -18, -20, and -22, where ZT0 is the time when light is ON and ZT12 is when light is OFF) and were flash frozen within 2 hours of collection. Poly A+ RNA− sequencing performed on an Illumina platform (8) produced an average of 15.4 million 50–base pair single-end (SE50) mapped reads per sample (table S2). The sequence reads were mapped to the P. anubis genome data set (PapAnu2.0, International Nucleotide Sequence Database Collaboration Assembly, GenBank Assembly ID GCA_000264685, version 88) and annotated with Ensembl (Full genebuild, released July 2014). This ensemble annotation comprises 19,210 protein-coding genes (PCGs), 9272 noncoding RNAs [including 5888 small nuclear RNA (snRNA), 1669 long non-coding RNA (lncRNA), and 1715 miscellaneous RNA (miscRNA)] and 720 pseudogenes. At a threshold of 0.1 FPKM (fragments per kilobase of transcript per million mapped reads) for gene expression (9), 97.3% of PCGs (18,684) and 89.6% of lncRNAs (1495) were detected in at least one organ (Fig. 2B). Principal component analyses of transcriptome from all 768 samples revealed multidimensional clustering or hierarchical clustering of samples from similar tissues and tissue types (Fig. 2E and fig. S2, A and B). Overall, the relative distance between tissue clusters was similar to that observed for comparable samples in the Nonhuman Primate Reference Transcriptome Resource database (13 tissues from one female baboon) (fig. S2C) (10) and in 41 human tissue transcriptomes (9, 11). Although brain regions showed little separation in multidimensional clustering, hierarchical clustering of these tissues revealed grouping of distinct clusters of eye, basal ganglia, hypothalamus, thalamus (THA), and cortices (fig. S2B). The unbiased clustering of ontologically related organs and brain nuclei validated dissection, sampling, and analyses protocols.
Fig. 2. Transcriptome complexity.
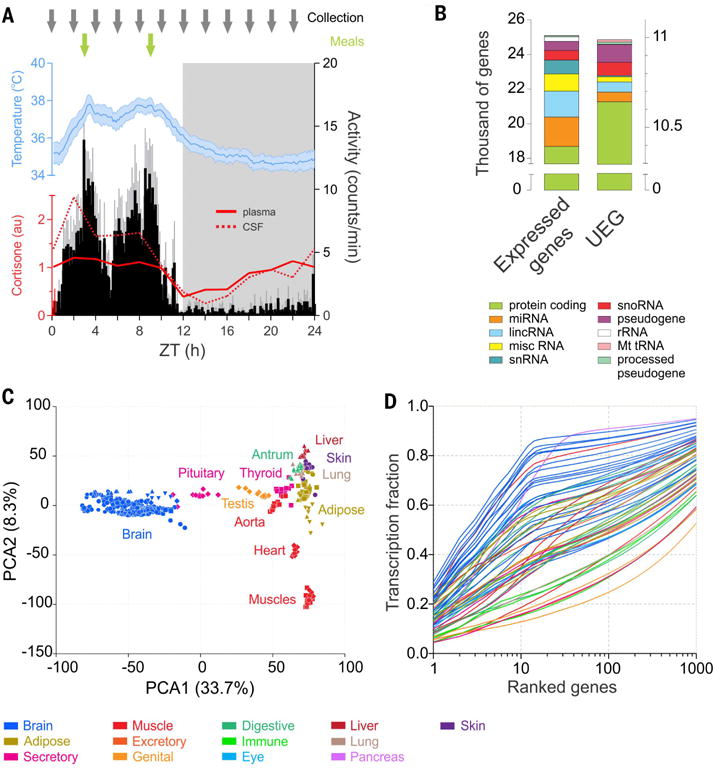
(A) Timing of sampling (gray arrows) across the 24-hour cycle (dark phase in gray shading) and timing of meals (green arrows) superimposed on the daily cycles of locomotor activity (black), body temperature (blue) (averages for 12 animals, ± 95% confidence interval, over the 14 days preceding the sample collection, average activity and temperature periods respectively 23.98 ± 0.02 and 23.97 ± 0.07 hours), and cortisone (plasma, solid red line; cerebrospinal fluid, dotted red line). (B) Number of genes expressed (average FPKM of the 12 time points >0.1) in at least one of the 64 tissues (25,098, left) or present in all the tissues sampled (UEG, 10,989, right). Different colors indicate the gene types. (C) Principal component analysis performed on the 12 time points of 36 representative tissues shows clustering of similar tissues groups based on gene expression profiles. The 22 tissues constituting the brain group clustered very tightly apart from the peripheral organs. (D) Cumulative distribution of the average fraction of total transcription contributed by genes when sorted from most to least expressed in each tissue (x axis). In all figures, each tissue is color-coded according to its system or functional group presented in Fig. 1.
Out of the 25,098 transcripts detected in at least one organ, 10,989 transcripts were common to all 64 tissues. These ubiquitously expressed genes (UEGs) encode gene products necessary for basic cellular functions, including basic transcription, RNA processing, DNA repair, protein homeostasis, and secretory function (table S3). The remaining 14,109 genes were expressed in distinct sets of tissues, with 1473 genes expressed exclusively in one tissue (table S4 and fig. S2D). Tissues differed in the number of expressed genes; the top quartile included highly heterogeneous tissues such as the arcuate nucleus (ARC), supra optic nucleus (SON), ventromedial regions of the hypothalamus (VMH), and the testis (TES). Each of these tissues expressed >17,000 genes, whereas the bottom quartile included relatively fewer heterogeneous tissues such as the abdominal and gastrocnemian muscles (MUA and MUG, respectively) and expressed 14,000 to 16,000 genes (table S1). The number of expressed genes does not entirely represent the complexity of expression. Indeed, transcriptional complexity, expressed as the fraction of total RNAs accounted for by the 10 or 100 most frequently expressed genes (table S5) (9), showed wide distribution. The pancreas (PAN) was the least complex tissue (top 10 expressed genes, accounting for >60% of all sequenced tags), whereas the TES transcriptional output was the most complex (Fig. 2D). Although several brain regions are among the top quartile in terms of number of expressed genes, they showed a relatively low complexity of gene expression. In 16 out of 24 brain regions, the 10 most highly expressed genes accounted for >50% of all genes expressed (Fig. 2D). Thus, transcriptome signature confers tissue identity in this primate as it does in humans (9, 11).
Diurnal gene expression across tissues
Diurnal rhythms of gene expression from the 12 time points for all tissues were analyzed with MetaCycle (12), an R package that integrates multiple algorithms to determine periodicity and rhythmicity. Transcripts with ~24-hour rhythms are discussed further. All 64 tissues examined showed rhythmic genes (Fig. 3A and table S6), but there was a clear difference between tissue-specific gene expression and tissue-specific rhythmic gene expression. In general, the number of rhythmic transcripts in a given tissue was not correlated to the number of genes expressed in the same tissue (fig. S3A). Furthermore, the fraction of the transcriptome detected as rhythmic and the extent of rhythmic genes shared among tissues were more complex than spatial gene expression signatures of tissues (Fig. 3C and table S7). In thyroid (THR), stomach fundus (STF), gastrocnemian muscle (MUG), paraventricular nucleus (PVN), and prefrontal cortex (PRC), more than 3000 genes were detected to cycle, whereas in the pineal (PIN), mesenteric lymphonodes (MEL), supraoptic nucleus (SON), lateral hypothalamus (LH), and bone marrow (BOM), less than 200 genes had 24-hour rhythms of expression (Fig. 3, A and B). More than 50% of genes detected in a given tissue were also expressed in all 64 tissues. However, even among tissues with >1000 rhythmic genes, less than 1% (<10) rhythmic genes were shared. Becuse of this limited overlap of rhythmic genes between tissues, and even though <4000 genes cycle in most tissues, 16,442 genes (65.5% of all expressed genes) (table S8) were rhythmic, with a ~24-hour period in at least one tissue (Fig. 3, A and C). Rhythmic transcripts were particularly enriched in PCGs (fig. S3, B and C), accounting for 81.7% of expressed PCGs (15,269 of 18,684). Thus, as seen in rodents (1, 13, 14) and insects (2), rhythmic transcription is tissue-specific. More importantly, more than two-thirds of the transcriptome showed ~24-hour rhythms in expression.
Fig. 3. Rhythmic gene expression across tissues.
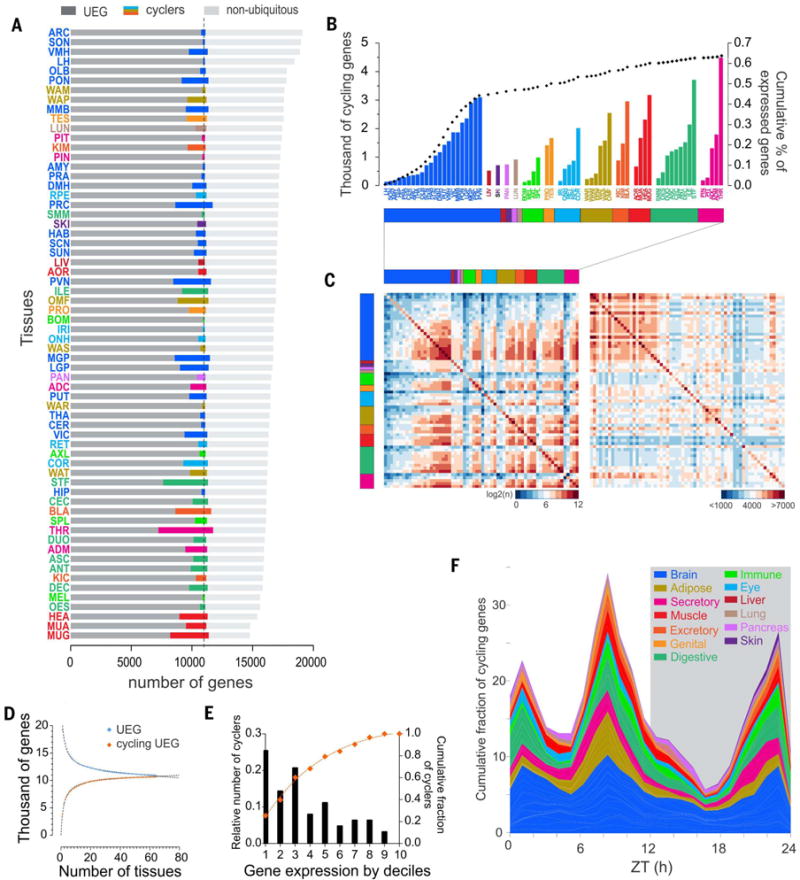
(A) Number of rhythmic genes (colored bars) and their distribution in each tissue between the pool of genes expressed in all tissues (UEGs, dark gray) and the pool of genes expressed more specifically (light gray). (B) Rhythmic identity. Shown are the number of cycling genes per tissue (grouped according to type) and their relative contribution to the total pool of genes (dotted black line). (C) Tissue by tissue of the overlap of the cycling genes (left) and of expressed genes (right).The color coding represents the degree of the overlap: from blue, few common genes, to red, high number of shared genes [on the left, log2 (common cycling genes), and on the right <1000 to >7000 commonly expressed genes (excluding UEGs)]. Raw data is provided in table S6. (D) Number of UEGs and rhythmic UEGs detected as a function of the number of tissues sampled. Best-fit function is overlaid (R2 = 0.9909 and 0.9944, respectively) (E) Weights of rhythmic transcription. Shown is distribution according to deciles of expressed genes (from most expressed to least expressed) indicating where the highest proportion of rhythmic genes are located. The curve indicates the cumulative fraction of cycling genes according to their level of expression. (F) Cumulative distribution of the peak phases of gene expression in the different tissues (grouped by systems and functions) throughout the day–night cycle. Peak phases of gene expression were normalized to the maximum in each tissue.
Tissue-specific rhythmic expression is not a function of tissue-specific gene expression. Surprisingly, in nearly all tissues, the majority of cycling genes were UEGs (76.7% on average) (Fig. 3A). Of the total 10,989 UEGs, the vast majority (10,607 genes, 97%) cycled in at least one organ (Fig. 3D), leaving only 382 UEGs not detected as rhythmic in any of the 64 tissues (table S9). Comparison of the number of cycling and noncycling UEGs as a function of the number of tissues analyzed indicated that with an increased sampling of cell and tissue types, all UEGs may indeed cycle in at least one organ (Fig. 3D). This implies that although the rhythmic transcriptome is tissue-specific, the majority of rhythmic genes is still expressed in each tissue but may not cycle in other tissues. This suggests that rhythmic genes undergo tissue-specific transcriptional regulation. Because UEGs participate in fundamental cell biological processes, circadian regulation of subsets of these genes in different organs may reflect a mechanism for organ-specific modulation of basic cellular function. For example, in endocrine organs, the diurnal regulation of exocytosis specifically alters basic cellular functions to produce rhythmic release of endocrine factors.
Because MetaCycle detects rhythmic genes regardless of transcript abundancy (12), we also examined the relation between gene rhythmicity and amount of expression. By calculating the fraction of rhythmic genes in each decile of average expression values, we found that in 60% of the tissues, the most rhythmic genes are among the genes that account for the top three deciles of transcriptional output (the 30% most expressed genes), whereas less than 1% of rhythmic genes were found in the decile of the least expressed genes (Fig. 3E). Such rhythmic expression of highly expressed genes supports the hypothesis that rhythmic transcription reduces or optimizes energy expenditure in gene expression (15).
We analyzed the times of peak expression (phase) of rhythmic genes. The phases in each tissue were not randomly distributed throughout the 24-hour day. The peak phases of expression of rhythmic genes for nearly all organs were largely clustered in one or two narrow temporal windows (of <6 hours) (Fig. 4). In tissues such as amygdala (AMY), habenula (HAB), optic nerve head (ONH), PVN, SCN, VMH, LH, lateral globus pallidus (LGP), substantia nigra (SUN), PAN, PRC, prostate (PRO), and spleen (SPL), more than two-thirds of rhythmic genes peaked within a narrow (<6 hour) interval, whereas some tissues— including adrenal gland cortex (ADC), aorta (AOR), cerebellum (CER), dorsomedial hypothalamus (DMH), THA, and putamen (PUT)—had genes that peaked within two distinct time intervals. However, even for anatomically adjacent tissues these phase clusters were temporally distinct. For example, in the kidney cortex (KIC) the main phase cluster was at ZT2, whereas in the medulla (KIM), it appeared at ZT7. Similarly, along the digestive track the phase clusters of esophagus (OES), STF, antrum (ANT), duodenum (DUO), ileum (ILE), ascending colon (ASC), and descending colon (DSC) were distinct (Fig. 4). A compilation of peak phases of expression across all rhythmic genes in all tissues revealed two major peaks, early afternoon (11,146 genes peak at ZT8) and late night or dawn (5127 genes peak at ZT22), with a distinct trough around midnight (696 genes peak at ZT16) (Fig. 3F and fig. S3D). This relative “quiescent zone” in the first half of the night (ZT14 to -19) is thus a distinct feature of rhythmic transcriptional output in the diurnal primate.
Fig. 4. Tissue-specific rhythmic gene expression.
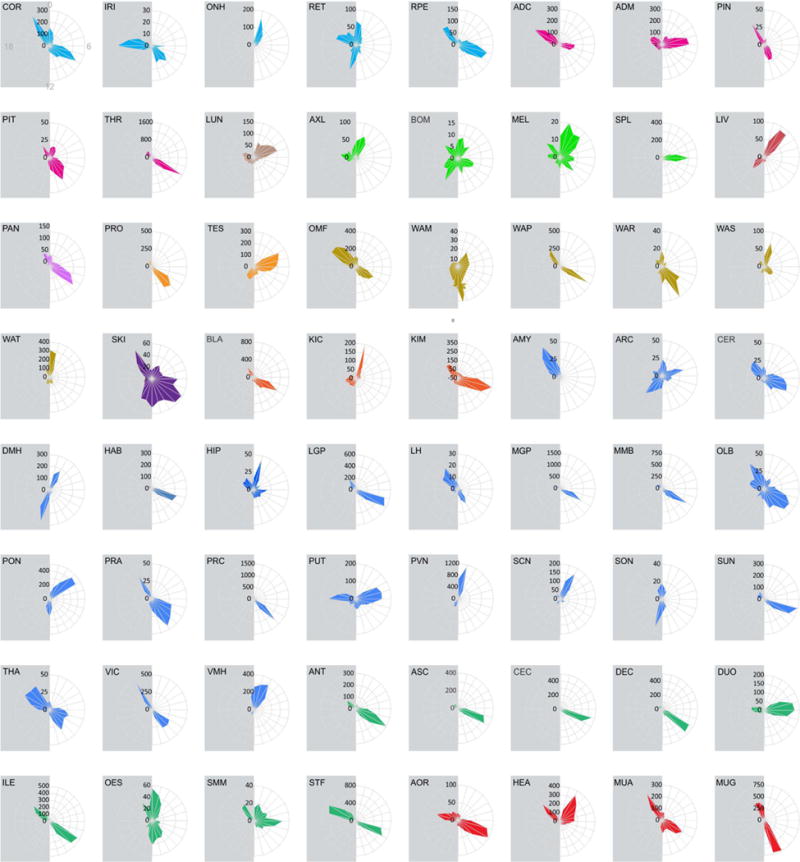
Radial plot of the distribution of the peak phase of expression of the cycling genes in each of the 64 tissues of the present atlas. On the first plot, gray indicates ZT, and number of gene peaks of expression are listed in black.
Tissue-specific features of the molecular clock
Because the number of common rhythmic genes between tissues is rather limited, we examined which genes were most widely detected as rhythmic in multiple tissues. No single transcript was scored significantly rhythmic in all 64 tissues. Genes encoding for the core circadian clock components and their immediate output targets were among the genes detected as rhythmic in most (but not all) tissues (Fig. 5A and table S10). The recently described circadian repressor gene Ciart [Circadian-associated transcriptional repressor (or Chrono)] was detected cycling in the most number of tissues (52 tissues) (Fig. 5A and fig S4A). For the 13 transcriptional regulators considered canonical components of the circadian clock (Per1-3, Cry1-2, Clock, Bmal1, Npas2, Rora, Rorb, Rorc and Nr1d1-2), their relative abundance and robustness of daily rhythms varied across tissues. Of the 13 components, 11 were detected in all 64 tissues, whereas Rorb and Rorc were expressed in 60 and 62 tissues, respectively. The median expression of clock components also varied across tissues, with paralog pairs (Cry1 and Cry2; Nr1d1 and Nr1d2) exhibiting mutually complementary expression in different tissues (Fig. 5B and fig. S4B). Within the hypothalamus, the SCN, PVN, preoptic area (PRA), and DMH showed a distinctive feature: Both Cry and Nr1d paralogous pairs were expressed in equivalent amounts (Fig. 5B), whereas in most other brain regions and organs, one of the members was expressed in higher amounts. Although core clock genes did not oscillate in all tissues, nine of the clock components showed daily rhythms in more than 20 tissues (Fig. 5A). Furthermore, the amplitude of oscillation of core clock components varied between tissues (Fig. 5B). The heterogeneity in the overall transcript abundance and rhythmicity of expression of circadian clock components implies different composition of core activators, repressors, and modulators in different tissues, generating tissue-specific characteristics of core oscillators and input and output mechanisms.
Fig. 5. The molecular clock across tissues.
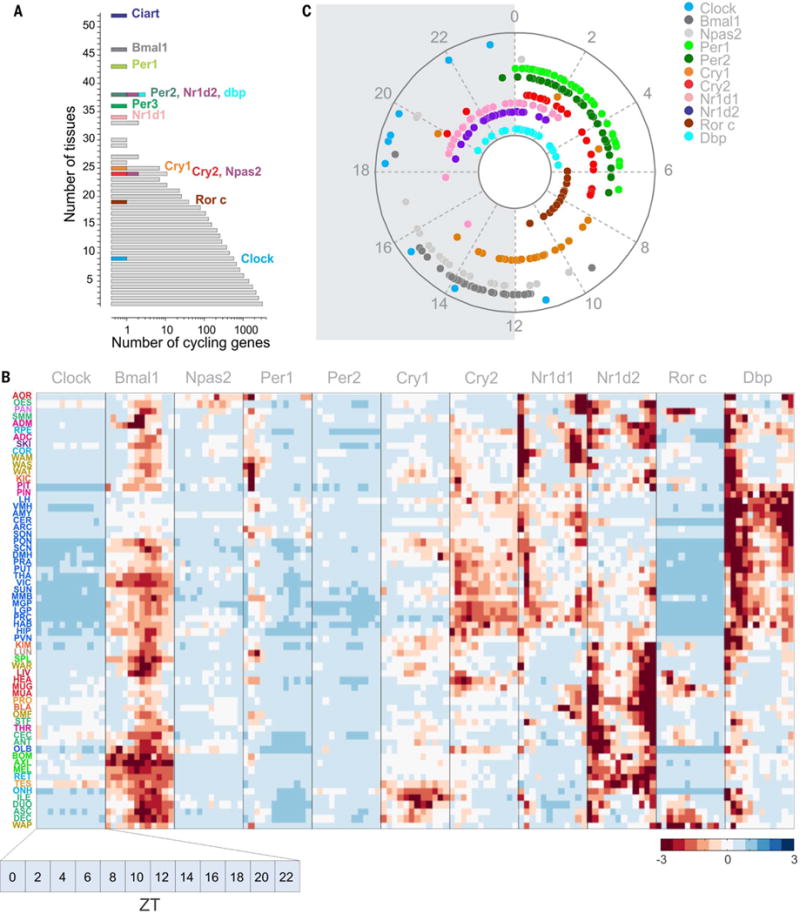
(A) Distribution of the cycling genes ranked according to the number of tissues in which they cycle. The most frequent cycling clock component is Ciart, cycling in 52 tissues, followed by Bmal1 and Per. The contributions of the core clock components and output (Dbp) to this distribution are highlighted. (B) Detailed transcript abundance time course of the molecular clock components in the 64 tissues examined [log2(1 + FPKM)]. (C) Distribution of the peak phases of core clock components in the tissues where they are detected as cycling.
Although the transcript abundance and rhythmic properties of clock gene expression varied across tissues, the peak phase of expression of each clock component was mostly restricted to a roughly 6-hour window (Fig. 5C, fig. S4C, and table S8). The mean peak times of expression for Bmal1 and Npas2 were similar (Bmal1, ZT13.3 ± 0.2; NPAS2, ZT14.3 ± 0.5). Although Bmal1 (heterodimerized with CLOCK or NPAS2) is considered to activate Per, Cry, Nr1d, and Ror expression, the peak phases of expression of these targets were not identical. Per1, Per2, and Cry2 shared similar peak phases of expression (ZT2.4, -2.9, and -2.5, respectively), whereas Cry1 peaked around ZT11. Nr1d1 and Nr1d2 peaked around ZT22 to ZT23, and Rorc peaked around ZT8 (fig. S4D and table S11). Although different combinations of paralogous clock components and their abundance provide evidence for tissue-specific characteristics of the core oscillator, the relative phases of expression of these components are remarkably conserved across tissues.
Basic cellular functions are rhythmic
Because tissues differed in the number of rhythmic genes and shared only a limited number of them (Fig. 3, B and C), even in terms of the circadian clock components (Fig. 5A), it is likely that different components of a given metabolic or signaling pathway were rhythmic in different tissues. To examine this, we used Gene Ontology (GO)–based annotation of rhythmic genes in different tissue types (16) and compared the ontology terms that were significantly overrepresented in at least 10 organs. As expected, among the 32 Kyoto Encyclopedia of Genes and Genomes (KEGG) biochemical pathways shared by at least 10 organs, circadian rhythmicity was the most frequently overrepresented. Other highly overrepresented pathways were those implicated in DNA replication, DNA repair, protein ubiquitination, the mTOR (mechanistic target of rapamycin) pathway, lysosomal function, amino-sugar metabolism, pyruvate metabolism, and oxidative phosphorylation (Fig. 6A and fig. S5). Overall, basic energy metabolism pathways and pathways that ensure the integrity of DNA, protein, and other macromolecules showed daily rhythms in multiple tissues. Phase set enrichment analysis (PSEA) (17) allowed us to calculate the peak phase of various ontology groups. Although DNA damage repair and lysosomal function groups showed peak expression during the afternoon (Fig. 6B), other functional groups were relatively more dispersed. Genes in the mTOR pathway peaked mostly when animals ate, whereas the protein ubiquitination pathways components were expressed before those of the mTOR pathway and were mainly active between midnight and noon. Annotation along cellular compartments also complemented the pathway-centric annotation. Specifically, cellular transcripts that encode components participating in protein synthesis, protein degradation, autophagy, and mitochondrial function commonly showed daily variation in abundance (Fig. 6C). Golgi-related GO terms were enriched within the cellular compartments rhythmic in the most number of tissues. In particular, components of the cis side of the Golgi apparatus, such as the endoplasmic reticulum– Golgi intermediate compartment, were the most represented among the most widely regulated (Fig. 6D). By contrast, tissues showing daily rhythms in components of the distal Golgi complexes were relatively few in number (Fig. 6D), which possibly reflects the fact that rhythmic regulation of the secretory pathway is more important for earlier stages of secretory machinery.
Fig. 6. Rhythmic transcription drives coordinated cellular organization and rhythmic physiology.
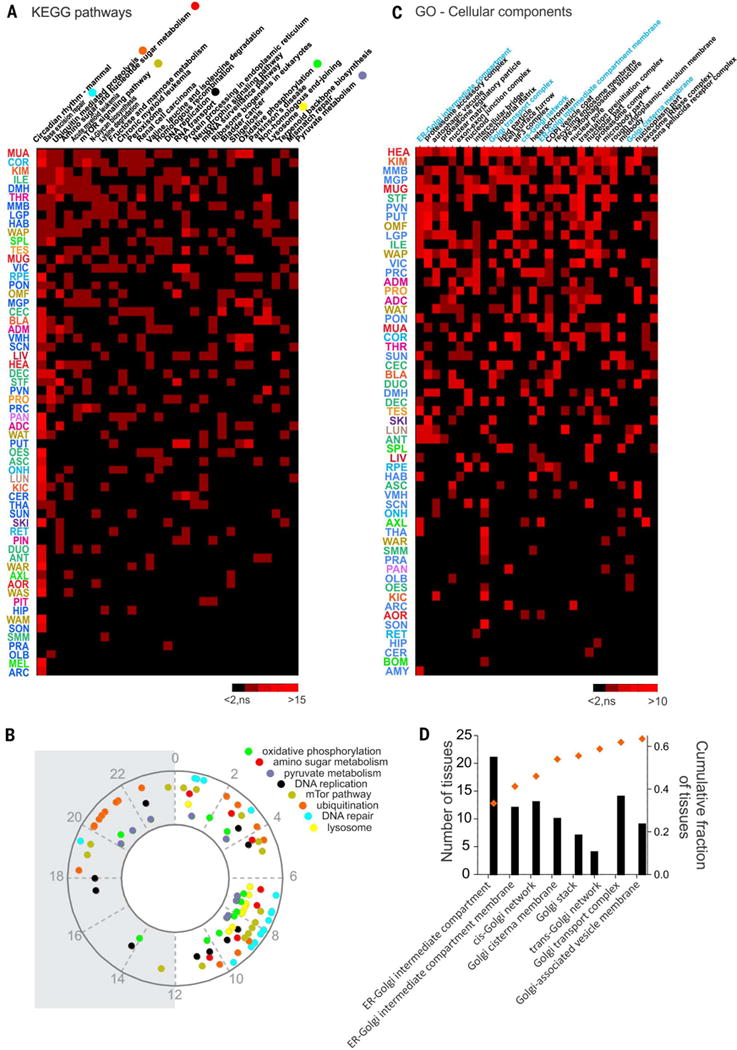
(A) Heatmap of the KEGG pathways enriched for cycling genes in more than 10 tissues. Pathways satisfying the criteria of overrepresentation analysis (ORA) (gene number > 2, z score > 2, and permuted P < 0.05) are shown in red (red intensity codes for the z score). Insignificantly enriched pathways are represented in black. (B) Phase distribution over the 24-hour cycle of representative KEGG pathways. Phases were calculated and statistically tested with the PSEA tool. (C) Heat-map of the GO cell components terms enriched for cycling genes in more than 10 tissues. Red indicates the pathways satisfying the criteria of overrepresentation analysis as described for (A). (D) Histogram of the number of tissues showing overrepresentation for Golgi-related GO-cellular component terms sorted from the cis to the trans side of the Golgi apparatus. Superimposed is the cumulative fraction of the rhythmic regulation for each GO term in the 45 tissues (out of 64) in which at least one of these GO terms that are related to the Golgi apparatus was cycling.
Comparative rhythmic transcriptomes between mouse and baboon
The data set allowed comparison between diurnal baboon and nocturnal mouse in the phases of circadian clock components and rhythmic transcriptome in the SCN and other tissues. We selected 11 tissue data sets from rodents (1, 18) for which we obtained comparable data sets in the baboon [including liver (LIV), lungs (LUN), heart (HEA), kidney (KID), adrenal gland (ADR), muscle (MUS), AOR, white adipose tissue (WAT), CER, brainstem (BST), pituitary (PIT), and SCN]. These data sets are from a young male C57BL/6 mouse strain fed a standard laboratory diet ad libitum. Although these data were collected from mice that were released into constant darkness for 1 to 2 days before tissue collection, the phase of expression of clock genes under such conditions deviate <1 hour from that observed under a normal light–dark cycle (13). We compared the phase of the core clock components in baboons and mice and found that the peak phase of expression of each clock component was shifted by ~12 hours between mouse and baboon tissues (with the notable exception of the SCN). This is evident for Bmal1 and Per1 (Fig. 7, A and B), which showed peaks of expression in the baboon in evening and morning, respectively, whereas in mice, the peak phases occurred in morning and evening, respectively. The peak phase of expression of other clock components similarly showed opposite phases in most organs. However, the expression of Cry1 was distinct. In the baboon, the median phase for Cry1 expression was during late afternoon, whereas in mice, its expression is delayed by only 7 hours, to peak after midnight (Circadian Time 18). In the SCN, unlike other tissues, the phase of expression of circadian clock components was not systematically opposite to that of their baboon orthologs. The peak phase of Bmal1 was similar between baboon and mouse SCN—that is, peaking in early evening—whereas Per1 and Cry2 phases were 6 and 12 hours apart, respectively (Fig. 7C). This implies a complex diurnal-nocturnal switch downstream of circadian clock components of the SCN.
Fig. 7. Comparison of rhythmic transcriptome organization in the diurnal primate and nocturnal rodent.
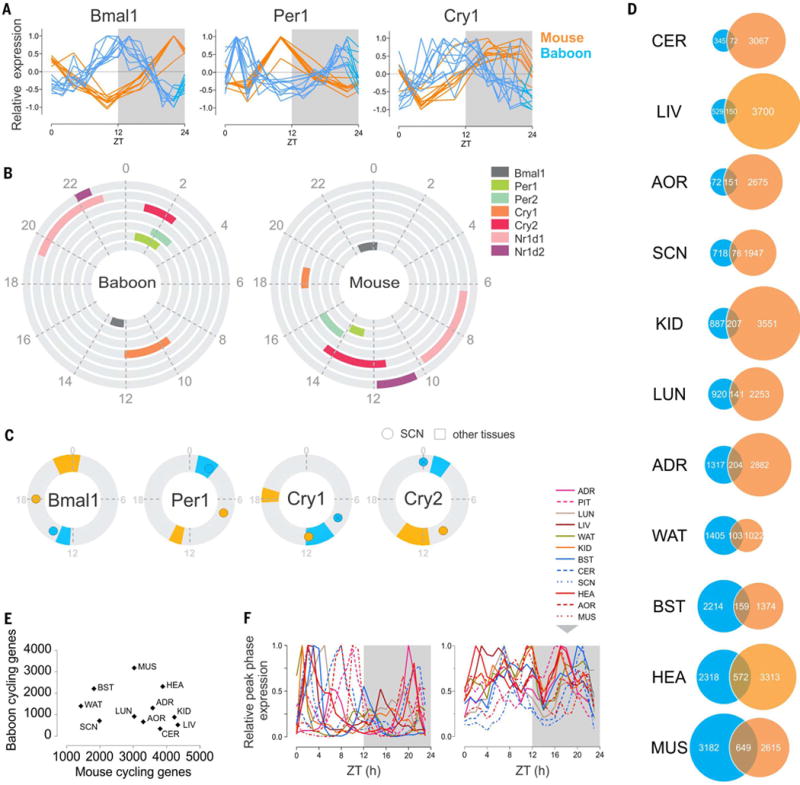
(A) Normalized daily expression profiles of Bmal1, Per1, and Cry1 across 10 tissues in mouse and baboon (ADR, AOR, BST, CER, HEA, KID, LIV, LUN, MUS, and WAT). (B) Phase distribution of the main clock genes in the baboon (left) and the mouse (right). The colored fraction of the rings corresponds to the confidence interval (95%) of the phases of the corresponding clock genes in the tissues in which these genes were detected as cycling. (C) Comparison of the phase of Bmal1, Per1, Cry1, and Cry2 in the SCN (dot) and in the other the tissues (95% confidence interval) in mouse (orange) and baboon (blue). Baboon Cry1 and Cry2 are not detected as cycling in the SCN; their maximum expression is represented (crossed circle). (D) Numbers of cycling genes in selected tissues compared in the baboon and the mouse and overlap of common cycling genes in the two species. (E) A tissue-by-tissue comparison showing the lack of correlation of the number of cycling genes in the baboon and in the mouse (R2 = 0.086, P = 0.38). (F) Normalized peak phases of gene expression in 12 tissues throughout the day (left in the baboon, right in the mouse).
Because the peak phases of expression of core clock components are ~12 hours apart between mouse and baboon, we tested whether other rhythmic genes in the same tissues shared similar phase differences. Given the differences in sampling (day–night in baboon versus constant dark in mice, timed eating in baboon versus ad lib eating in rodents, and differences in sampling frequency), we anticipated a limited number of common cyclers between baboon and mouse. Indeed, although the number of genes expressed in baboon and mouse tissues showed a positive correlation [coefficient of determination (R2) = 0.6, P = 0.0145, except for the liver] (fig. S6A), the absolute numbers of cycling genes were not correlated (R2 = 0.14, P = 0.29), with relatively few common rhythmic genes (Fig. 7, D and E, and fig. S6, B and C). The peak phases of expression of rhythmic genes in corresponding tissues in baboon and mouse showed distinctive features. Specifically, the primate showed a consolidated period of transcription during the day and a transcriptionally quiescent period during the night (when the animals are asleep), whereas there was no such period in rodents (Fig. 7F). Furthermore, among the common cyclers between mouse and baboon in the different tissues, we did not observe a consistent 12-hour difference in the peak phases of expression. This is in contrast to what would be expected from the hypothesis of a simple nocturnal-diurnal “switch” downstream of the SCN. For example, in HEA, 47% of shared rhythmic genes cycled with <6-hour phase difference between mouse and baboon, whereas in other organs, such as CER, 65% of shared genes cycled with a 10- to 15-hour phase difference (fig. S6D). This suggests a very diverse and autonomous temporal organization across peripheral tissues.
Our study provides a comprehensive spatiotemporal gene expression atlas in a diurnal primate, allowing the investigation of both tissue-specific and diurnal expression patterns underlying physiology and behavior. Although it has been assumed that almost every tissue in mammals harbors daily rhythms in gene expression, this study specifies the identities of rhythmic genes in a wide range of tissues covering all major functions. The abundance and complexity of gene expression in a given tissue had little correlation with the number or diversity of rhythmic genes in the same tissue. The temporal patterns of expression add a distinctive dimension to tissue and organ functional specializations that cannot be inferred from the tissue’s transcriptome signature alone. The tissue-specific genes are the less likely to be circadianly expressed. Across tissues, the majority of rhythmic genes are among UEGs. At the organismal level, two-thirds of rhythmic genes are from the 10,989 UEGs. Similar to UEGs, the majority of core circadian clock components were detected in nearly all tissues, but only a few out of the 13 component showed rhythmic expression in any given tissue. The phase of expression of any clock component, when rhythmic, was similar across tissues. This would imply that a core circadian clock in a given tissue is composed of a specific combination of different paralogous pairs of activators and repressors, each oscillating at their respective phases. Such tissue-specific organization of the core clock and tissue-specific oscillations of UEGs lends support to the idea that a primordial circadian system, as found in unicellular cyanobacteria, tuned the rhythmic expression of a vast majority of the genome to orchestrate daily rhythms in almost all essential biochemical and cellular processes. With the evolution of metazoans and tissue specialization, the basic set of genes necessary for cellular function is expressed in all tissues, and the circadian clock still continues to oscillate in similar phase, but it recruits a tissue-specific gene repertoire among the UEGs for rhythmic expression.
The daily rhythms expressed in >80% of the PCGs, encoding diverse biochemical and cellular functions, constitutes by far the largest regulatory mechanism that integrates diverse biochemical functions within and across cell types. From a translational point of view, rhythmicity may have a major impact because 82.2% of genes coding for proteins that have been identified as druggable targets by the U.S. Food and Drug Administration (www.drugbank.ca) (19) show cyclic changes in transcription in at least one tissue (table S12). These percentages may be underestimations because it is likely that in heterogeneous tissue such as lymph nodes, genes oscillating in only a subset of cell types may not be scored as rhythmic. Because daily rhythms arise from interactions between the circadian clock, light–dark cycle, temperature cycles, and daily eating and sleeping patterns (fig. S7), the data set—which was collected under defined conditions known to contribute to daily rhythms— establishes a reference atlas to understand how genetic and environmental factors may contribute to circadian rhythm disruptions and lead to specific pathologies in humans.
Supplementary Material
Acknowledgments
The data discussed in this study have been deposited in the National Center for Biotechnology Information’s Gene Expression Omnibus (GEO) and are accessible through GEO Series accession no. GSE98965. Peripheral tissue samples are available from S.P. under a materials transfer agreement with Salk Institute. This work was supported by the Salk Institute Innovation and U.S. Department of Defense grant W81XWH-15-1-0169 to S.P.; Next Generation Sequencing Core Facility of the Salk Institute, with funding from NIHNational Cancer Institute Cancer Center Support Grant P30 014195; the Chapman Foundation and the Helmsley Charitable Trust grant; and ANR-09-MNPS-040-01 to H.M.C. G.B. was partly supported by Glenn Center for Aging Research, and L.M. was partially supported by Fyssen and Catharina foundations. We thank the veterinarians and animal technicians at the IPR for their assistance and J. A. Cooper for custom designing a baboon brain matrix for sectioning the brain, D. O’Keefe for manuscript editing, and J. Simon for his help with the illustrations.
Footnotes
SUPPLEMENTARY MATERIALS
www.sciencemag.org/content/359/6381/eaao0318/suppl/DC1
Materials and Methods
References (20–25)
Databases 1 and 2
REFERENCES AND NOTES
- 1.Zhang R, Lahens NF, Ballance HI, Hughes ME, Hogenesch JB. A circadian gene expression atlas in mammals: Implications for biology and medicine. Proc Natl Acad Sci USA. 2014;111:16219–16224. doi: 10.1073/pnas.1408886111. [DOI] [PMC free article] [PubMed] [Google Scholar]
- 2.Ceriani MF, et al. Genome-wide expression analysis in Drosophila reveals genes controlling circadian behavior. J Neurosci. 2002;22:9305–9319. doi: 10.1523/JNEUROSCI.22-21-09305.2002. [DOI] [PMC free article] [PubMed] [Google Scholar]
- 3.Harmer SL, et al. Orchestrated transcription of key pathways in Arabidopsis by the circadian clock. Science. 2000;290:2110–2113. doi: 10.1126/science.290.5499.2110. [DOI] [PubMed] [Google Scholar]
- 4.Oster H, et al. The functional and clinical significance of the 24-h rhythm of circulating glucocorticoids. Endocr Rev. 2016;38:er20151080. doi: 10.1210/er.2015-1080. [DOI] [PMC free article] [PubMed] [Google Scholar]
- 5.Schwartz WJ, Reppert SM, Eagan SM, Moore-Ede MC. In vivo metabolic activity of the suprachiasmatic nuclei: A comparative study. Brain Res. 1983;274:184–187. doi: 10.1016/0006-89938390538-3. [DOI] [PubMed] [Google Scholar]
- 6.Möller-Levet CS, et al. Effects of insufficient sleep on circadian rhythmicity and expression amplitude of the human blood transcriptome. Proc Natl Acad Sci USA. 2013;110:E1132–E1141. doi: 10.1073/pnas.1217154110. [DOI] [PMC free article] [PubMed] [Google Scholar]
- 7.Li JZ, et al. Circadian patterns of gene expression in the human brain and disruption in major depressive disorder. Proc Natl Acad Sci USA. 2013;110:9950–9955. doi: 10.1073/pnas.1305814110. [DOI] [PMC free article] [PubMed] [Google Scholar]
- 8.Vollmers C, et al. Circadian oscillations of protein-coding and regulatory RNAs in a highly dynamic mammalian liver epigenome. Cell Metab. 2012;16:833–845. doi: 10.1016/j.cmet.2012.11.004. [DOI] [PMC free article] [PubMed] [Google Scholar]
- 9.Melé M, et al. The human transcriptome across tissues and individuals. Science. 2015;348:660–665. doi: 10.1126/science.aaa0355. [DOI] [PMC free article] [PubMed] [Google Scholar]
- 10.Pipes L, et al. The Non-Human Primate Reference Transcriptome Resource (NHPRTR) for comparative functional genomics. Nucleic Acids Res. 2013;41(D1):D906–D914. doi: 10.1093/nar/gks1268. [DOI] [PMC free article] [PubMed] [Google Scholar]
- 11.GTEx Consortium. The Genotype-Tissue Expression (GTEx) pilot analysis: Multitissue gene regulation in humans. Science. 2015;348:648–660. doi: 10.1126/science.1262110. [DOI] [PMC free article] [PubMed] [Google Scholar]
- 12.Wu G, Anafi RC, Hughes ME, Kornacker K, Hogenesch JB. MetaCycle: An integrated R package to evaluate periodicity in large scale data. Bioinformatics. 2016;32:3351–3353. doi: 10.1093/bioinformatics/btw405. [DOI] [PMC free article] [PubMed] [Google Scholar]
- 13.Ueda HR, et al. A transcription factor response element for gene expression during circadian night. Nature. 2002;418:534–539. doi: 10.1038/nature00906. [DOI] [PubMed] [Google Scholar]
- 14.Storch KF, et al. Extensive and divergent circadian gene expression in liver and heart. Nature. 2002;417:78–83. doi: 10.1038/nature744. [DOI] [PubMed] [Google Scholar]
- 15.Wang GZ, et al. Cycling transcriptional networks optimize energy utilization on a genome scale. Cell Reports. 2015;13:1868–1880. doi: 10.1016/j.celrep.2015.10.043. [DOI] [PMC free article] [PubMed] [Google Scholar]
- 16.Zambon AC, et al. GO-Elite: A flexible solution for pathway and ontology over-representation. Bioinformatics. 2012;28:2209–2210. doi: 10.1093/bioinformatics/bts366. [DOI] [PMC free article] [PubMed] [Google Scholar]
- 17.Zhang R, Podtelezhnikov AA, Hogenesch JB, Anafi RC. Discovering biology in periodic data through Phase Set Enrichment Analysis (PSEA) J Biol Rhythms. 2016;31:244–257. doi: 10.1177/0748730416631895. [DOI] [PubMed] [Google Scholar]
- 18.Hatori M, et al. Lhx1 maintains synchrony among circadian oscillator neurons of the SCN. eLife. 2014;3:e03357. doi: 10.7554/eLife.03357. [DOI] [PMC free article] [PubMed] [Google Scholar]
- 19.Uhlén M, et al. Proteomics. Tissue-based map of the human proteome. Science. 2015;347:1260419. doi: 10.1126/science.1260419. [DOI] [PubMed] [Google Scholar]
Associated Data
This section collects any data citations, data availability statements, or supplementary materials included in this article.


