

Abstract
While the brain’s high energy demands are largely met by glucose, brain is also equipped with the ability to oxidize fatty acids for energy and metabolism. The brain expresses the carnitine palmitoyltransferases (CPTs) that mediate carnitine-dependent entry of long-chain acyl-CoAs into the mitochondrial matrix for β-oxidation – CPT1a and CPT2 located on the outer and inner mitochondrial membranes, respectively. Their developmental profile, regional distribution and activity as well as cell type expression remain unknown.
We determined that brain CPT1a RNA and total protein expression were unchanged throughout post-natal development (PND0, PND7, PND14, PND21 and PND50); however, CPT2 RNA peaked at PND 21 and remained unchanged through PND50 in all regions studied (cortex, hippocampus, midbrain, and cerebellum). Both long-chain acyl CoA dehydrogenase (ACADL) and medium acyl-CoA dehydrogenase (ACADM) showed a similar developmental profile to CPT2. Acylcarnitines, generated as result of CPT1a activity, significantly increased with age and peaked at PND21 in all brain regions, concurrent with the increased expression of enzymes involved in mitochondrial β-oxidation. The CPT system is highly enriched in vivo in hippocampus and cerebellum, relative to cortex and midbrain, and is exclusively present in astrocytes and neural progenitor cells, while absent in neurons, microglia, and oligodendrocytes. Using radiolabeled oleate, we demonstrate regional differences in brain fatty acid oxidation that may be blocked by the irreversible CPT1a inhibitor etomoxir. This study contributes to the field of knowledge of brain cell-specific metabolic pathways, which are important for understanding normal brain development and aging, as well as pathophysiology of neurological diseases.
Keywords: fatty acid oxidation, Carnitine palmitoyltransferase, mitochondria, development
Graphical abstract
The high metabolic demands of mammalian brain are largely met by glucose, but brain can also oxidize fatty acids. Here we describe the expression profiles of the enzymes required for mitochondrial β-oxidation of fatty acids across early postnatal development in rat brain. We observed increased expression of the β-oxidation enzymatic machinery through postnatal day 21, and these enzymes are enriched in astrocytes and neural progenitor cells. This work contributes to a better understanding of cell-type-specific brain metabolism during normal development.
Introduction
The brain has high energy demands which account for approximately 20% of the body’s resting metabolic rate (Kety 1957; Rolfe and Brown 1997). While glucose is the principal bioenergetic substrate for adult brain, the flexibility to utilize other fuels such as ketones during fasting or physiological stress is an important adaptation (Owen et al. 1967). Ketones and lactate are particularly important bioenergetic substrates during early postnatal brain development (Cremer 1982), when glucose preferentially supports biosynthesis via the pentose phosphate pathway, independent of its oxidative degradation within mitochondria as pyruvate (Baquer et al. 1977; Brekke et al. 2015; Hakim et al. 1980). The oxidative metabolism of glucose and other substrates is also highly compartmentalized in brain. Diverse cell types may vary in terms of bioenergetic needs and preferences, often in a region-specific and activity-dependent manner (McKenna et al. 2015).
In addition to its constant high energy requirements, the brain is also characterized by a unique lipid composition (Lynen 1957). Numerous studies, including those highlighted in Table 1, suggest the importance of lipid metabolic flux within the brain (Blankman et al. 2007; Ellis et al. 2013; Inloes et al. 2014; Kamat et al. 2015; Lee et al. 2015; Long et al. 2011; Nguyen et al. 2014; Wolfgang et al. 2006; Wolfgang et al. 2008). Although it is unclear why glucose has been selected over other substrates as the principal bioenergetic source in adult brain (Schonfeld and Reiser 2013), the ability of brain to oxidize fatty acids has been well known for decades (Bernoud et al. 1998; VIGNAIS et al. 1958). Despite this, there is still much to be learned about which cell types oxidize fatty acids in vivo and under what conditions, particularly during early postnatal development when lipid-rich milk is the principal source of nutrition.
Table 1.
Examples of lipid metabolizing enzymes and transporters that are enriched in brain
| References | Gene Symbol |
Substrate or Enzymatic Activity |
Localization | Additional Details |
|---|---|---|---|---|
| Long et al., 2011 | ABHD3 | Medium-chain phospholipid lipase | Brain, kidney, liver; integral membrane protein | The ABHD enzymes are serine hydrolases named for their α/β hydrolase domain. ABHD3 may cleave oxidatively-truncated phospholipids. |
| Lee et al., 2015 | ABHD4 | N-acyl phospholipid lipase | Brain—soluble fraction | Generates N-acyl-lysophospholipids from N-acyl-phosphatidylserine and N-acyl-phosphatidylethanolamine |
| Blankman et al., 2007 | ABHD6 | 2-arachidonoylglycerol (2-AG) hydrolase | Brain; integral membrane protein with cytosolic orientation | Participates in endocannabinoid signaling by regulating 2-AG levels in conjunction with MAGL and ABHD12 activities |
| Blankman et al., 2007; Kamat et al., 2015 | ABHD12 | Lyso-phosphatidylserine lipase | Brain; integral membrane protein with extracellular/lumenal orientation | Null mutations in ABHD12 result in the neurological disease PHARC (polyneuropathy, hearing loss, ataxia, retinitis pigmentosa and cataract); Abhd12−/−mice have neurodegenerative disease with increased microglial activation in cerebellum |
| Kamat et al., 2015 | ABHD16 | Phosphatidylserine lipase | Brain; enriched in cerebellum | Generates lyso-phosphatidylserine which is a substrate for ABHD12; also expressed in macrophages |
| Ellis et al., 2013 | ACOT7 | Acyl-CoA thioesterase 7, a long-chain acyl-CoA hydrolase | Neuronal; cytosolic | Brain has highest cytosolic long-chain acyl-CoA thioesterase activity of tissues tested; Mice with nervous system-specific deletion of Acot7 exhibit neurodegeneration, hyperexcitability, loss of lean mass and dyslipidemia |
| Wolfgang et al., 2006; Wolfgang et al., 2008 | CPT1c | Carnitine palmitoyltransferase 1c; does not catalyze acyl transfer to carnitine but does bind malonyl-CoA | Neuronal; integral membrane protein | Participates in regulating energy homeostasis: Cpt1c knockout mice have lower food intake, lower body weight, and are prone to high-fat diet-induced obesity |
| Inloes et al., 2014 | DDHD2 | Brain triglyceride lipase | Brain | DDHD domain containing 2; Ddhd2−/− mice exhibit age-dependent triglyceride accumulation in brain and lipid droplet accumulation in neurons; deleterious DDHD2 mutations associated with hereditary spastic paraplegia |
| Nguyen et al., 2014 | MFSD2A | Docosahexaenoic acid (DHA) transporter in brain | Endothelium of blood-brain barrier microvessels | Major facilitator superfamily domain containing 2a; promotes DHA uptake as lyso-phosphatidylcholine DHA as well as other long-chain lyso-phosphatidylcholine species; Mfsd2a knockout mice have microcephaly, neuronal cell loss and cognitive defects |
Several studies performed in vitro have demonstrated that cultured astrocytes can oxidize fatty acids completely to carbon dioxide (CO2) and water, while fatty acid oxidation could not be detected in primary cultures of neurons or oligodendrocytes (Auestad et al. 1991a; Edmond et al. 1987). Astrocytic fatty acid oxidation was also found to generate ketones in vitro (Blazquez et al. 1998). Astrocytes are capable of oxidizing both medium-chain fatty acids (octanoate) and long-chain fatty acids (such as palmitate) (Edmond et al. 1987). Medium-chain fatty acids (C6-C12) can directly cross the mitochondrial inner membrane in order to be metabolized to acetyl-CoA via β-oxidation in the mitochondrial matrix; however, long-chain fatty acids must be transported into the matrix via the carnitine shuttle system. Indeed, it was observed that carnitine supplementation increased palmitate oxidation in cultured astrocytes (Edmond et al. 1987). Long-chain fatty acids must be esterified as acyl-CoA intermediates in order to gain access to the mitochondrial matrix via the subsequent transacylation reactions of the carnitine palmitoyltransferases (CPT) of the outer and inner mitochondrial membranes, CPT1 and CPT2, respectively (Fig. 1). CPT1 resides on the outer mitochondrial membrane and converts long-chain acyl-CoAs to acylcarnitines and free CoASH. Acylcarnitines likely traverse the mitochondrial outer membrane through the voltage-dependent anion channel (VDAC), as CPT1A was found to form hetero-oligomeric complexes with VDAC and long-chain acyl-CoA synthetase (Lee et al. 2011). The acylcarnitine is then transported across the inner mitochondrial membrane via the carnitine-acylcarnitine translocase, and the inner membrane-associated acyltransferase CPT2 converts the long-chain acylcarnitine back to an acyl-CoA that is primed for the β-oxidation enzymatic machinery of the matrix. CPT1 is the rate-limiting enzyme in mitochondrial β-oxidation of long-chain fatty acids, and CPT1a is the predominant isozyme in brain. As the rate-determining step, CPT1a is regulated by endogenously produced malonyl-CoA, an intermediate in fatty acid synthesis (Blazquez et al. 1998). Brain-specific CPT1c is closely related to CPT1a. While it also binds malonyl-CoA, CPT1c lacks detectable acyltransferase activity and therefore does not participate in the β-oxidation of long-chain fatty acids (Wolfgang et al. 2006; Wolfgang et al. 2008). Due to the importance of the carnitine shuttle in fatty acid catabolism throughout all tissues, deficiencies in either CPT1a or CPT2 result in severe metabolic derangements characterized by hypoketotic hypoglycemia and sudden death. Clinical presentation, however, depends on severity of the deficiency and hypoglycemic events (CPT1A OMIM #255120; CPT2 OMIM# 600649, 608836, 255110). Administration of medium-chain triglycerides can relieve hypoglycemia associated with defects in long-chain fatty acid oxidation. Interestingly, it has been calculated via 13C-labeling studies that the medium-chain fatty acid octanoate can provide up to 20% of brain oxidative energy production in vivo in adult rat (Ebert et al. 2003), although the relative bioenergetic contribution of medium-chain and long-chain fatty acids has not been determined. In addition, it is unclear the extent to which fatty acid oxidation contributes to brain energy metabolism during early postnatal development, a period characterized by high bioenergetic and biosynthetic demands met by a high-fat, low-carbohydrate milk diet.
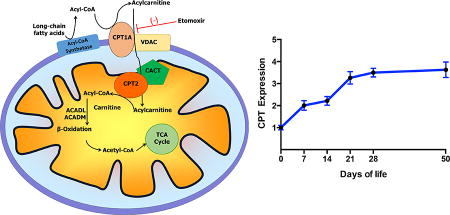
Fig. 1. Carnitine is essential for the transport of long-chain fatty acids into the mitochondrial matrix for β-oxidation.

Acyl-CoA is produced from long-chain fatty acids via acyl-CoA synthetase. Carnitine palmitoyltransferase 1a (CPT1A) transfers acyl groups from acyl-CoA to L-carnitine, producing acylcarnitine esters. The voltage-dependent anion channel (VDAC) and the carnitine/acylcarnitine translocase (CACT) transport acylcarnitines across the outer and inner mitochondrial membranes, respectively. Carnitine palmitoyltransferase II (CPT2) converts acylcarnitines to acyl-CoAs in the mitochondrial matrix where acyl-CoA dehydrogenases (ACAD), including ACADL and ACADM for long- and medium-chains respectively, facilitate β-oxidation.
In order to gain insight into the role of mitochondrial β-oxidation of long-chain fatty acids during development, we characterized the expression of the carnitine palmitoyltransferase (CPT) enzymes in developing rat brain. We sought to address the following questions: 1) are CPTs present in the brain throughout development? 2) are there regional differences in CPT expression? 3) which cells in vivo express CPTs?. We report that CPT1a and CPT2 expression increases during brain development and is enriched in hippocampus relative to the cortex, midbrain, and cerebellum. We specifically show that in vivo astrocytes and Nestin-expressing progenitor cells express CPT1a, while no CPT1a was detected in neurons, microglia, or oligodendrocytes. These data suggest that there are profound regional, cell-specific, and age-dependent differences in the brain’s ability to oxidize long-chain fatty acids.
Materials and Methods
Animals
All animal procedures were approved by the Johns Hopkins University Institutional Animal Care and Use Committee and conducted in accordance with the National Institutes of Health Guide for the Care and Use of Laboratory Animals. Male Sprague-Dawley rats (Charles River Laboratories, Wilmington, MA RRID:RGD_10395233) were housed in a temperature controlled room (20–23°C) on a 12-hr light:12-hr dark cycle and provided with food and water ad libitum. Rats were sacrificed on postnatal days (PND) 0, 7, 14, 21, 28, and 50. Rats were weaned from the dam on PND 19 and fed a standard NIH rat chow diet.
RNA Isolation, Purification, and Quantitative Real-Time-Polymerase Chain Reaction (qRT-PCR)
Total RNA was isolated from cortex, hippocampus, midbrain, and cerebellum using TRIzol (Life Technologies, Grand Island NY) and further purified using the RNeasy Mini Kit (Qiagen, Valencia, CA). RNA was quantified by NanoDrop spectrophotometer, and cDNA was synthesized using 1.8µg of total RNA, random primers, and MultiScribe High-Capacity cDNA reverse transcription kit according to manufacturer’s instructions (Life Technologies; Cat# 4368814). RT-PCR was performed using 10 ng of template cDNA and Bio-Rad (Hercules, CA) SsoAdvanced SYBR Green master mix (Cat# 1725274) with primers specific to the genes of interest (Table 2). PCR reactions were carried out in a Bio-Rad CFX Connect thermocycler (95°C for 3 min; (95°C for 10 sec, 56°C for 30 sec) × 40 cycles; melt curve determination by denaturation at 95°C for 10 sec and temperature ramp from 56–95°C at 0.5°C/5 sec). All data were normalized to average Ct values for the mean of 18S and Rpl22, and data is expressed as 2−dCt. Values are shown as mean ± SEM (n=4–7 per age), and one-way ANOVA with Tukey post-hoc testing was used to test for statistically significant differences across ages using GraphPad Prism (La Jolla, California).
Table 2.
RT-PCR primers for rat genes involved in mitochondrial β-oxidation of long-chain fatty acids
| Gene | Ref Seq ID | Forward primer (5’→3’) | Reverse primer (5’→3’) |
|---|---|---|---|
| 18S RNA | NR_046237.1 | GCAATTATTCCCCATGAACG | GGCCTCACTAAACCATCCAA |
| Rpl22 | NM_031104.1 | AGCAGGTTTTGAAGTTCACCC | CAGCTTTCCCGTTCACCTTGA |
| Cpt1a | NM_031559.2 | TGGGGAAGAGACAGACACCA | ATCGTGGTAGAGCCAGACCT |
| Cpt2 | NM_012930.1 | CAACTCGTATACCCAGACCCAATC | GTTCCCATCTTGATCGAGGACATC |
| Acadl | NM_012819.1 | TTTCCTCAGAGCATGACATTTT | GCCAGCTTTTTCCCAGAGCT |
| Acadm | NM_016986.2 | GGCATATGGGTGTACAGGGG | ACGCAGTAGGCACACATCAT |
| Octn2; Slc22a5 | NM_019269.1 | TACCTTGGTGCCTATGATCGC | CACCAAAGCTCTCTGGGAAG |
Western Blotting
Tissue samples from cortex, hippocampus, midbrain, and cerebellum were homogenized in RIPA buffer containing protease inhibitor. A bicinchoninic acid (BCA) assay (Thermo Scientific, Rockford, IL) was used to determine total protein concentration for each sample. 20µg of total protein was loaded on NuPage 4–5% bis tris gels (Life Technologies, Carlsbad, CA) for electrophoresis. Proteins were transferred to nitrocellulose membranes for immunodetection. The membranes were blocked for 1 hour in 1X casein blocking buffer (Sigma, St. Louis, MO). Membranes were incubated in the following primary antibodies: CPT1a 1:500 (Abcam; Cat# ab128568, RRID:AB_11141632), ACADM (GeneTex; Cat# GTX100488, RRID:AB_1949559), and ACADL (GeneTex; Cat# GTX81189, RRID:AB_11177205) diluted in 1X casein. HSC70 (Thermo; 1:3,000; RRID:AB_2544813) was used as a loading control. Following washes with TBS-T, membranes were incubated in anti-mouse or anti-rabbit secondary antibodies (1:2,000) for 1 hour in 1X casein. Immunoreactivity was detected by chemiluminescence. Band intensity was determined using Image J and all data were normalized to the loading control, HSC70. Values shown are mean ± SEM (n=7–9 per age) and an unpaired t-test was used to test for significant differences between pre-weaning (PND 7&14) and post-weaning (PND 21, 21, &50). For PND0 tissue, cerebellum and hippocampus from 3 rats were pooled together to obtain a sufficient quantity of protein for western blotting. HSC70 was found to be developmentally regulated at PND0 only. Therefore, PND0 was not included in analysis for developmental differences, but was instead graphed separately in order to illustrate regional differences using one-way ANOVA with Tukey post-hoc testing. All statistical analyses were conducted using GraphPad Prism (La Jolla, CA).
Carnitines and Acylcarnitines
Blood levels of acylcarnitines were quantified using a well-established method of testing dry blood (DBS) with modifications as previously described (Lee et al. 2016). Punched 1/8″ DBS samples were submerged in 100 µl of methanol solution containing internal standards acyl carnitines (NSK B- Cambridge Isotopes). Samples were incubated at 4°C for 20min, dried under the nitrogen and then 60 µl 3N HCl in n-butanol was added. The samples were incubated for 15 min at 65 °C. After incubation the samples were evaporated to dryness under nitrogen, and the residue containing butylated acyl carnitines was reconstituted in 100 µl of mobile phase acetonitrile/water/formic acid (H2O:CH3CN:HCOOH; 80:19.9:0.1 v/v%). Samples were vortexed, transferred to a centrifuge filter and spun. Collected filtrate was transferred to an injection vial.
All tissue samples were prepared using well described methods with modifications. Briefly, all brain samples were weighed and collected in liquid nitrogen. Frozen tissue was homogenized in methanol solution containing internal standards of acyl carnitines (NSK B, Cambridge Isotopes), sonicated for 10min at room temperature, and centrifuged for 4min at 13,000rpm at 4°C. Following centrifugation, the liquid phase was transferred to the clean glass tube and evaporated to dryness under nitrogen. Dried samples were resuspended by adding 60 µl 3N HCl in n-butanol. The samples were incubated for 15 min at 65 °C and, following incubation, evaporated under nitrogen. Butylated acylcarnitines were reconstituted in 100 µl of mobile phase acetonitrile/water/formic acid (H2O:CH3CN:HCOOH; 80:19.9:0.1 v/v%). Samples were vortexed, transferred to a centrifuge filter and spun. The obtained filtrates were transferred to injection vials.
Acylcarnitines were analyzed employing an API 3200 mass spectrometer (AB SCIEX, Foster City, CA) operated in positive ion mode employing precursor ion scan for m/z 85, which is generated as a characteristic product ion of butyl ester of acyl carnitine species. Quantitation of acyl carnitines was achieved by Chemoview (AB SCIEX) application. All blood samples are reported as nmol/ml, and tissue samples as pmol/mg.
Fatty Acid Oxidation
Hippocampus and cortex were rapidly dissected, placed in separate stoppered tubes with labeling media containing 0.12 µCi [1-14C] oleic acid (Moravek Biochemicals, Brea, CA), and incubated at 37°C with gentle shaking for 3 hours. Labeling media was composed of 20% Neurobasal medium (Gibco; Cat#21103-049) and 80% glucose-, glutamine-, and pyruvate-free DMEM (Gibco#A14430) supplemented such that final concentrations were 5mM glucose, 25µM glutamine, 50µM pyruvate, and 0.2% (w/v) bovine serum albumin (BSA) (Sigma A9647). Etomoxir-treated samples were incubated with 100µM etomoxir (Sigma E1905) in the labeling media, administered at the time of initiating the assay. 14CO2 was trapped on a filter paper suspended in the headspace of the flask by addition of 200µL 70% perchloric acid to the flask and 150µL 1M NaOH to the filter paper and incubating the samples at 55°C for 1 hour. The filter paper was placed in scintillation fluid and counted. Counts were normalized to wet tissue weight (mg). Rat primary cortical astrocytes (Invitrogen) were cultured in 85% DMEM, 15% fetal bovine serum, and 1% penicillin/streptomycin antibiotic (Invitrogen) at 37°C in a humidify-controlled incubator at 10% CO2. For the [1-14C] oleate oxidation experiments, 400,000 cells were seeded in a T-25 stoppered flask. All assays were conducted between passage 3 and 5. Cells were labeled with same amount of [1-14C] oleate and same media composition as was used with the brain samples, in the presence or absence of 100µM etomoxir.
Immunofluorescence
Free floating 50µm coronal brain sections underwent antigen retrieval by incubation in 1XSSC buffer (pH 8.5–9) for 30 min. in a 80°C water bath, and were blocked for 1hr and 15 min in 20% natural goat serum, 1% BSA and 0.3% TX-100 in PBS Primary antibodies used were CPT1a 1:150 (Abcam; Cat# ab128568), CPT2 1:250 (Abcam; Cat# ab110293, RRID:AB_10860357), GFAP 1:750 (Abcam; Cat# ab4674, RRID:AB_304558), Iba1 1:750 (Wako; Cat# 019-19741, RRID:AB_839504), NeuN 1:1,000 (Millipore; Cat# MAB377, RRID:AB_2298772), Olig2 1:100(Millipore; Cat# AB9610, RRID:AB_10141047), and laminin 1:25 (Sigma; L9393, RRID:AB_477163). Secondary antibodies raised in goat (FITC anti-rabbit, TRITC anti-mouse, and Alexa Fluor 647 anti-chicken) were applied for 1.25 hrs at 1:200. Sections were incubated in To-Pro-3 1:750 (Molecular Probes; Cat#T3605) for 1 hour. Images were obtained using a Zeiss LSM 510 Meta confocal microscope.
Statistical Analysis
All data were analyzed using GraphPad Prism 6.0 (GraphPad Software). Multiple comparisons were calculated using one-way ANOVA with Tukey post-hoc correction. Acylcarnitines were analyzed using two-way ANOVA with Bonferroni post-hoc correction. Results were presented as mean ± standard error of the mean (SEM). Significance was determined as *p<0.05; **p<0.01; ***p<0.001.
Results
Regional and developmental changes in expression of brain carnitine palmitoyltransferases (CPTs)
CPT1a is the rate-determining step and CPT2 is an obligate step for mitochondrial β-oxidation of long-chain fatty acids by mediating the carnitine-dependent entry of acyl-CoAs into the mitochondrial matrix (Fig.1). CPT1a and CPT2 expression was evaluated across development with particular interest in pre-weaning (PND 0, 7 & 14) compared to post-weaning (PND 21, 28 &50) time periods. Using qRT-PCR, we quantified the expression of CPT1a and CPT2 mRNA across development in four brain regions (cortex, hippocampus, midbrain, and cerebellum), and data is displayed relative to PND 0 (Fig.2A). There were no significant developmental changes in CPT1a RNA expression in the hippocampus, midbrain, and cerebellum. In the cortex, CPT1a RNA expression was significantly elevated at PND 14 relative to PND 7. In contrast, CPT2 transcript abundance was highly developmentally regulated in the cortex, midbrain, and cerebellum, and significantly increased with age. No age differences were detected in CPT2 mRNA expression in hippocampus. CPT2 mRNA was more dynamically regulated than CPT1a across development in cortex, midbrain and cerebellum (Fig 2A).
Fig.2. Developmental Profile of CPT Expression.

A) CPT1a RNA expression was significantly greater at PND14 relative to PND7 in the cortex (* =p<0.05). No other significant differences in CPT1a RNA expression were identified at PND 7, 14, 21, 28, or 50 in cortex, midbrain, and cerebellum. CPT2 RNA expression is developmentally regulated in the cortex, midbrain, and cerebellum (* =p<0.05, ** =p<0.01 relative to PND7, + =p<0.05, ++ =p< .01 relative to PND14). B) Total protein expression as measured using western blotting revealed no significant differences in CPT1a expression developmentally. Regional differences were evaluated at PND0 (C) and both the hippocampus (Hip) and cerebellum (CB) had increased expression of CPT1a relative to the cortex (*=p< 0.05, **=p< 0.01). CPT1a total protein was greater in the cerebellum than the midbrain as well (*=p< 0.05). Values are shown as mean ± SEM and data were analyzed across ages using one-way ANOVA with Tukey post-hoc testing (A&C) or a t-test to compare pre-weaning (PND 7&14) and post-weaning (PND 21, 28& 50) (C). In all experiments, N=5 per group.
Developmental expression of total CPT1a protein was measured by western blotting, and no significant differences were detected in pre-weaning ages vs. post-weaning ages (Fig.2B). CPT1a protein was enriched in hippocampus and cerebellum in all ages studied (Fig. 2C, data shown for CPT1a at PND 0, *p<0.05, **p<0.01).
Once long-chain fatty acids are transferred across the mitochondrial inner membrane, they undergo β-oxidation—a process that is initiated by acyl-CoA dehydrogenases. Specifically, long-chain acyl-CoA dehydrogenase (ACADL) initiates β-oxidation of C14-C20 acyl-CoAs, where medium-chain acyl-CoA dehydrogenase (ACADM) acts on C6-C12 substrates. Hence, we quantified regional and developmental regulation of ACADL and ACADM in developing rat brain at the level of mRNA and protein abundance (Fig.3). ACADL transcript abundance did not change with age in hippocampus and cerebellum. There was, however, an age-associated increase in cortex and midbrain, which was highest at PND 50 (p<0.05) (Fig.3A). Western blot analyses revealed that ACADL is significantly higher at PND 21, 28 and 50 compared to PND 7 and 14 (*p< 0.05, **p< 0.01) (Fig.3 B&E).
Fig. 3. Developmental Profile of Acyl-CoA Dehydrogenases.

A) RNA expression of ACADL was increased in the cortex at PND50 relative to PND7. B) Western blot analysis for total ACADL showed significant effects of development on expression for all brain regions (N=5/group; * =p<0.05, ** =p<0.01, *** =p<0.001, ****=p<0.0001 pre vs. post weaning t-test). C) RNA expression of ACADM increases with age such that PND7 ACADM expression is significantly less than PND 21, 28, and 50 in the cortex and cerebellum. PND14 expression of ACADM was also reduced compared to PND50 in the cortex and cerebellum. Values (A&C) are shown as mean ± SEM and data were analyzed across ages using one-way ANOVA with Tukey post-hoc testing (N=5/group; * =p<0.05, ** =p<0.01, *** =p<0.001 relative to PND7, + =p<0.05 relative to PND14). D) Western blot analysis for ACADM showed significant effects of development on expression for all brain regions (N=5/group; * =p<0.05, ** =p<0.01, *** =p<0.001, ****=p<0.0001 pre vs. post weaning t-test). E) Representative western blots of ACADL and ACADM.
In cortex and cerebellum, ACADM RNA expression increased significantly with age such that expression at PND7 is significantly less than that at PND50 (*p<0.05); there were no differences observed between PND 21 vs. 28 vs. 50 (Fig 3C). Total protein expression of ACADM peaked in all brain regions at PND 28 and 50, and there were significant differences between pre- and post-weaning ages (***p< 0.001, ****p< 0.0001) in all four regions studied (Fig.3 D&E).
Developmental profile of acylcarnitine levels in different brain regions
The function of CPT1a is to generate acylcarnitines, which become transferable across the mitochondrial inner membrane via the carnitine-acylcarnitine translocase. Plasma acylcarnitines are commonly used to screen and diagnose inborn errors of metabolism of fatty acid oxidation. The developmental profile of free carnitine, palmitoylcarnitine (C16), stearoylcarnitine (C18), and oleoylcarnitine (C18:1) was characterized both in plasma (Fig.4A) and in brain regions (Fig. 4B). The full panel of acylcarnitines measured in plasma and brain regions are provided in Supplemental Tables 1–4. In plasma, C18 peaked at PND 0&7, whereas maximum concentrations of C18:1, C16, and free carnitine peaked at PND7, PND7&14, and PND 14&21 respectively (Fig.4A). For all measures, there were significant effects of age (****= p< 0.0001) as determined using one-way ANOVA. Brain free carnitine, C16, C18, and C18:1 concentrations showed significant main effects of age, brain region, and significant interactions as analyzed using two-way ANOVA (Fig. 4B) (****= p< 0.0001,*= p< 0.05). In particular, free carnitine, C16, C18, C18:1 peaked at PND21 in all brain regions (n=5/group; ****= p< 0.0001,*= p< 0.05). Interestingly, mRNA abundance of the plasma membrane carnitine transporter OCTN2 had a similar pattern of increased expression in all brain regions across the time points studied (Supplemental Figure 1) which may support an increased capacity for acylcarnitine synthesis. We observed that plasma levels of acylcarnitines did not reflect acylcarnitine profiles in normal developing brain. In fact, the highest tissue acylcarnitine levels corresponded to lower concentrations of plasma acylcarnitines, perhaps indicative of higher uptake and utilization of plasma acylcarnitines at later developmental time points.
Fig.4. Developmental profile of free carnitine, C16, C18, and C18:1 in plasma and brain.

Plasma (A) and brain (B) samples were analyzed using tandem mass spectrometry. In plasma (A), there was a significant effect of age on free carnitine and C16, C18, and C18:1 acylcarnitines. Within the brain (B), cortex (Cx), hippocampus (Hp), midbrain (MB), and cerebellum (CB) regions were analyzed, and there were significant main effects of age, brain region, and interaction (****=p< 0.0001, *=p< 0.05). Values are shown as mean ± SEM (N=5/group) and data were analyzed using one-way (A) and two-way (B) ANOVAs.
CPT1a-dependent fatty acid oxidation in hippocampus and cortex
The peak of acylcarnitine abundance in all brain regions profiled at PND 21 corresponded with the maximal expression of CPT2 mRNA (Fig. 2A) and elevated expression of ACADL and ACADM at PND 21 (Fig. 3). To determine whether PND 21 brain is capable of oxidizing long-chain fatty acids, we measured [1-14C] oleate oxidation to 14CO2 in dissected brain. We chose to focus on cortex and hippocampus since these regions contained highest concentrations of C18 and C18:1 acylcarnitines at PND 21 (Fig. 4B). Hippocampus had two-fold higher complete oxidation of oleate to CO2 than cortex (Fig. 5), and fatty acid oxidation in both regions was sensitive to the CPT1a inhibitor etomoxir. Importantly, the assay media was not supplemented with free carnitine so that oleate oxidation reflected endogenous capacity for fatty acid oxidation. Indeed, P21 hippocampus had higher free carnitine than cortex (Fig. 4B). It is important to note that oleate oxidation was conducted in the presence of a physiologically-relevant glucose concentration (5mM), unlike some early fatty acid oxidation experiments in brain which were conducted in glucose-free perfusion media (Rossiter 1957). The finding that P21 brain readily oxidizes oleate in a CPT1a-dependent manner provides a functional output for the observed concomitant increase in acylcarnitine concentrations and CPT2, ACADL, and ACADM expression.
Fig. 5. CPT1a-dependent fatty acid oxidation in hippocampus and cortex.

Oxidation of [1-14C] oleate to 14CO2 in P21 cortex (Cx) and hippocampus (Hp) was measured in the presence or absence of CPT1a inhibitor etomoxir (100 µM, ETOX). Assay was conducted in the presence of 0.12µCi [1-14C] oleate in modified Neurobasal medium containing 5mM glucose, 25µM glutamine, 50µM pyruvate, and 0.2% (w/v) bovine serum albumin (BSA) (N=5–6/group).
CPT1a and CPT2 are expressed exclusively by astrocytes
In order to characterize the capacity for fatty acid oxidation in vivo with cellular resolution, brain sections were stained for CPT1a at all the ages studied. In the brain, CPT1a is selectively expressed by astrocytes (GFAP), not neurons (NeuN), microglia (Iba1), or oligodendrocytes (Olig2) (Fig.6, A–D). Representative images from PND21 rat brain (Fig.6) were taken from the dentate gyrus of the hippocampus. CPT1a was also expressed in astrocytes in the cortex, midbrain, and cerebellum (data not shown). High magnification (Fig. 6E) further demonstrates co-localization of CPT1a with GFAP, and not with endothelial cells (laminin). Fig. 6F confirms that CPT2 is also expressed by astrocytes. To test the functionality of astrocytic expression of CPT1a and CPT2, we measured [1-14C] oleate oxidation by primary astrocytes in vitro (Supplemental Figure 2). Primary astrocytes readily oxidized fatty acids to CO2 while etomoxir treatment blocked fatty acid oxidation, similar to dissected brain regions. Another population of cells that have been shown to have the capacity to oxidize fatty acids is the GFAP-positive/Nestin-positive neural stem/progenitor cells that give rise to new neurons and glia in the adult brain (Stoll et al. 2015). We observed that CPT1a co-localized with Nestin-positive neural precursor cells in the subventricular zone of the lateral ventricles and dentate gyrus of the hippocampus (Fig.7). These results indicate that only select cell populations are able to use fatty acids for energy and metabolism.
Fig.6. CPTs are selectively expressed by astrocytes, not neurons, microglia, or oligodendrocytes.

Panels A–C show representative images of CPT1a and the nuclear marker To-Pro-3, labeled with GFAP, NeuN, Iba1, and Olig2 in the dentate gyrus of the hippocampus of PND 21 day old rat. CPT1a co-localizes with GFAP (A), not NeuN (B), Iba1 (C), or Olig2 (D). E) High magnification further illustrates co-localization of CPT1a with astrocytes (red arrowheads). CPT1a is not expressed in endothelial cells (white arrow heads). Basement membrane of blood vessels is labeled with laminin (magenta). CPTII is also expressed by astrocytes (F).
Fig. 7. CPT1a co-localized with Nestin positive cells in the subventricular zone of the lateral ventricles and dentate gyrus of the hippocampus.

Upper panel shows representative images sub-ventricular zone (SVZ) of lateral ventricle. Lower panel shows representative images of dentate gyrus (DG) of hippocampus. CPT1a co-localizes with GFAP, Nestin, but not with DAPI. Subventricular zone (SVZ); Lateral ventricle (LV); Ependymal cell layer (ECL); Dentate gyrus (DG); Molecular layer (ML); Granular cell layer (GCL).
Discussion
Current dogma posits that the brain is incapable of using long-chain fatty acids as a bioenergetic substrate (Schonfeld and Reiser 2013), despite the evidence that medium-chain and, to a greater extent, long-chain fatty acids cross the blood-brain barrier (Ebert et al. 2003; Magret et al. 1996; Spector 1988). As a result, many studies have focused on delineating the effects of liver fatty acid oxidation disturbances on brain metabolism. The loss of liver fatty acid oxidation, however, is confounded by the loss of ketone body synthesis by the liver (Lee et al. 2016), which provides a significant source of alternative substrates for neuronal and glial metabolism, especially during early postnatal development, fasting, and stress (McKenna et al. 2015; Owen et al. 1967). In this study, we sought to characterize the brain’s endogenous capacity to oxidize long-chain fatty acids, as well as developmental regulation of the enzymes involved in mitochondrial β-oxidation of long-chain fatty acids. We have determined that CPT1a and CPT2 are present in vivo throughout the brain and are highly expressed in hippocampus and cerebellum compared to cortex and midbrain. In addition, Cpt1a co-localized in astrocytes throughout the brain and Nestin (+) neural progenitor cells localized in subventricular zone of lateral ventricle and subgranular zone of dentate gyrus. The expression of enzymes required for mitochondrial long-chain fatty acid oxidation was found to increase across development, and the correlation with brain and plasma acylcarnitine levels suggests an increased capacity for fatty acid oxidation in brain of weaned rats. Our data is consistent with findings by Guest and colleagues (Guest et al. 2013) that C16, C18, and C18:1 are the most abundant fatty acids in human cerebrospinal fluid and are major acyl-chain components of the white matter, with oleic acid being the highest, followed by stearic and palmitic acids (O'Brien and Sampson 1965a; O'Brien and Sampson 1965b). Furthermore, Guest and colleagues (2013) demonstrated that oleic acid concentrations are inversely associated between plasma and cerebrospinal fluid, not unlike our observation that C18:1 acylcarnitine levels in plasma decrease concomitantly with an increase in brain C18:1 acylcarnitines. Altogether, these data provide evidence that oleate is an abundant fatty acid that is readily oxidized by astrocytes in vivo. Specifically, oleic acid (and not any other long chain, i.e. palmitic acid) stimulates cAMP/protein kinase pathways, which leads to activation of SIRT1/PGC1α transcriptional complex and results in increased fatty acid oxidation (Lim et al. 2013).
Accumulating evidence in recent years demonstrates that fatty acid oxidation, and CPT1A in particular, is involved in many pathological conditions of the nervous system. Specifically, Escartin et al. (2007) showed that CPT1A is increased in reactive astrocytes following local ciliary neurotrophic factor stimulation, while Shriver and Manchester (2011) demonstrated that pharmacological inhibition of CPT1A reduced disease severity in a mouse model of multiple sclerosis and reduced inflammatory cytokine production by encephalitogenic T-cells (Shriver and Manchester, 2011). Lin et al. (2016) reported that human glioblastoma cells express CPT1A and animals treated with the CPT1A inhibitor etomoxir exhibited decreased tumor growth and longer survival in a syngeneic model of glioma (Lin et al. 2016).
Recent advances in the field of stem cell biology highlighted the contribution of mitochondrial CPTs in fueling progenitor cell survival. Xie and colleagues showed that decrease of CPT1A during embryonic period disrupts homeostasis of neural stem cells resulting in abnormal differentiation (Xie et al. 2016), while Stoll and colleagues demonstrated that neural stem/progenitor cells in the adult sub-ventricular zone oxidize fatty acids, and pharmacological inhibition of CPT1A resulted in decreased proliferation of neural stem/progenitor cells in culture and in the subventricular zone in adult mice (Stoll et al. 2015). Our observation of CPT1A co-localization with Nestin in both the subventricular zone and the subgranular zone of the hippocampal dentate gyrus corroborate these findings.
We have found that CPT expression increases with age in a region-specific manner, suggesting that fully formed adult brain is capable of using fatty acids as fuel for energy production. Consistent with that, Schulz et al. (2015) demonstrated that loss of CPT2 in Drosophila resulted in triacylglyceride accumulation in the brain and shorter life span. Re-expression of CPT2 in glial cells alone was sufficient to rescue the loss-of-function phenotype and restore triacylglyceride homeostasis. Mammalian brain has low capacity for neutral lipid storage, so it is likely that brain fatty acid oxidation exerts other metabolic effects apart from protecting against neutral lipid accumulation. Indeed, in the Drosophila model of CPT2 deficiency, the authors suggested that adult brain may use fatty acids for local production of ketone bodies (Schulz et al. 2015). This is consistent with Auestad et al. (1991), who previously showed in vitro that cultured astrocytes are able to generate ketones, which may serve as a fuel for the neuron (Auestad et al. 1991b).
In summary, the mitochondrial enzymes required for β–oxidation of long-chain fatty acids are expressed throughout the brain and increase with age until brain maturation, despite regional differences in the developmental regulation of particular components of the fatty acid oxidative machinery. CPTs are present specifically in astrocytes and neural progenitor cells, and may fulfill different roles in these cells – in astrocytes, to support not only astrocytic bioenergetic needs but also neuronal metabolism by providing ketones, while fueling cell autonomous bioenergetic needs in progenitor cells. Better delineating changes in these cell-specific metabolic pathways is essential in understanding development and aging of the normal brain, as well as alterations in many pathological conditions.
Involves human subjects: No
If yes: Informed consent & ethics approval achieved:
⇒ if yes, please ensure that the info "Informed consent was achieved for all subjects, and the experiments were approved by the local ethics committee." is included in the Methods.
ARRIVE guidelines have been followed:
Yes
⇒ if No or if it is a Review or Editorial, skip complete sentence ⇒ if Yes, insert "All experiments were conducted in compliance with the ARRIVE guidelines." unless it is a Review or Editorial
Conflicts of interest: none
⇒ if 'none', insert "The authors have no conflict of interest to declare."
⇒ otherwise insert info unless it is already included
Supplementary Material
Supplemental Figure 1. Developmental RNA expression of carnitine transporter in rat brain.
OCTN2 RNA expression was significantly greater at PND 50 relative to PND7 and PND 14 in the cortex, hippocampus and mibrain. RNA expression of OCTN2 increases with age such that PND7 OCTN2 expression is significantly less than PND 21, 28, and 50 in the cerebellum (n=5 per group * =p<0.05, ** =p<0.01 relative to PND7, + =p<0.05, ++ =p< .01 relative to PND14).
Supplemental Figure 2. CPT1a-dependent fatty acid oxidation in cultured rat astrocytes. Oxidation of [1-14C] oleate to 14CO2 in cultured rat astrocytes was measured in the presence or absence of CPT1a inhibitor etomoxir (100 µM, ETOX). Assay was conducted in the presence of 0.12µCi [1-14C] oleate in modified Neurobasal medium containing 5mM glucose, 25µM glutamine, 50µM pyruvate, and 0.2% (w/v) bovine serum albumin (BSA). N=5 per group.
Supplemental Table 1. Blood acylcarnitines levels measured at post-natal day 0, 7, 14, 21, 28 and 50 (N=5/group).
Supplemental Table 2. Developmental acylcarnitine profile in the rat cortex at post-natal day (PND) 0, 7, 14, 21, 28, 50 (N=5/group).
Supplemental Table 3. Developmental acylcarnitine profile in the rat hippocampus at PND 0, 7, 14, 21, 28, 50 (N=5/group).
Supplemental Table 4. Developmental acylcarnitine profile in the rat midbrain at PND 0, 7, 14, 21, 28, 50 (N=5/group).
Supplemental Table 5. Developmental acylcarnitine profile in the rat cerebellum at PND 0, 7, 14, 21, 28, 50 (N=5/group).
Tables symbols and significances.
| Symbol | Significance |
|---|---|
| a | 0 vs.7; ap<0.05; aap<0.01; aaap<0.001; aaaap<0.0001 |
| b | 0 vs.14; bp<0.05; bbp<0.01; bbbp<0.001; bbbbp<0.0001 |
| c | 0 vs.21; cp<0.05; ccp<0.01; cccp<0.001; ccccp<0.0001 |
| d | 0 vs.28; dp<0.05; ddp<0.01; dddp<0.001; ddddp<0.0001 |
| e | 0 vs.50; ep<0.05; eep<0.01; eeep<0.001; eeeep<0.0001 |
| f | 7 vs.14; fp<0.05; ffp<0.01; fffp<0.001; ffffp<0.0001 |
| g | 7 vs.21; gp<0.05; ggp<0.01; gggp<0.001; ggggp<0.0001 |
| h | 7 vs.28; hp<0.05; hhp<0.01; hhhp<0.001; hhhhp<0.0001 |
| i | 7 vs. 50; ip<0.05; iip<0.01; iiip<0.001; iiiip<0.0001 |
| j | 14 vs.21; jp<0.05; jjp<0.01; jjjp<0.001; jjjjp<0.0001 |
| k | 14 vs.28; kp<0.05; kkp<0.01; kkkp<0.001; kkkkp<0.0001 |
| l | 14 vs.50; lp<0.05; llp<0.01; lllp<0.001; llllp<0.0001 |
| m | 21 vs.28; mp<0.05; mmp<0.01; mmmp<0.001; mmmmp<0.0001 |
| n | 21 vs.50; np<0.05; nnp<0.01; nnnp<0.001; nnnnp<0.0001 |
| o | 28 vs.50; op<0.05; oop<0.01; ooop<0.001; oooop<0.0001 |
Data were analyzed with the assistance of GraphPad Prism (version 6). Significance was determined using one-way ANOVA with Bonferroni post hoc correction for multiple variable experiments (n=5/age group).
Acknowledgments
This work was supported in part by a National Institutes of Health grant K08NS069815 to S.S. and R01NS072241 to M.J.W. C.E.B. was supported in part by a fellowship from the American Heart Association 15PRE25090309. The authors thank Yana Sandlers, Ph.D. (Hugo W. Moser Research Institute at Kennedy Krieger) for acyl-CoA quantification and analysis.
List of Abbreviations
- ACADL
long-chain acyl CoA dehydrogenase
- ACADM
medium acyl-CoA dehydrogenase
- ANOVA
analysis of variance
- BCA
bicinchoninic acid
- BSA
bovine serum albumin
- CACT
carnitine/acylcarnitine translocase
- CB
cerebellum
- CPT
carnitine palmitoyltransferase
- Cx
cortex
- DBS
dried blood spot
- DMEM
Dulbecco's modified eagle medium
- ETOX
etomoxir
- FITC
fluorescein isothiocyanate
- GFAP
glial fibrillary acidic protein
- Hp
hippocampus
- HSP
heat shock cognate
- Iba1
ionized calcium binding adaptor molecule 1
- MB
midbrain
- NeuN
neuronal nuclei
- Olig2
oligodendrocyte transcription factor 2
- PND
postnatal day
- qRT-PCR
quantitative real-time polymerase chain reaction
- RIPA
radioimmunoprecipitation assay buffer
- SEM
standard error of the mean
- TBS-T
tris-buffered saline, 0.1% tween 20
- TRITC
tetramethylrhodamine
- VDAC
voltage-dependent anion channel
Footnotes
Conflict of interest statement
The authors have no conflicts of interest to declare.
References
- Auestad N, Korsak RA, Morrow JW, Edmond J. Fatty acid oxidation and ketogenesis by astrocytes in primary culture. J. Neurochem. 1991a;56:1376–1386. doi: 10.1111/j.1471-4159.1991.tb11435.x. [DOI] [PubMed] [Google Scholar]
- Auestad N, Korsak RA, Morrow JW, Edmond J. Fatty acid oxidation and ketogenesis by astrocytes in primary culture. J. Neurochem. 1991b;56:1376–1386. doi: 10.1111/j.1471-4159.1991.tb11435.x. [DOI] [PubMed] [Google Scholar]
- Baquer NZ, Hothersall JS, McLean P, Greenbaum AL. Aspects of carbohydrate metabolism in developing brain. Dev. Med. Child Neurol. 1977;19:81–104. doi: 10.1111/j.1469-8749.1977.tb08027.x. [DOI] [PubMed] [Google Scholar]
- Bernoud N, Fenart L, Benistant C, Pageaux JF, Dehouck MP, Moliere P, Lagarde M, Cecchelli R, Lecerf J. Astrocytes are mainly responsible for the polyunsaturated fatty acid enrichment in blood-brain barrier endothelial cells in vitro. J. Lipid Res. 1998;39:1816–1824. [PubMed] [Google Scholar]
- Blankman JL, Simon GM, Cravatt BF. A comprehensive profile of brain enzymes that hydrolyze the endocannabinoid 2-arachidonoylglycerol. Chem. Biol. 2007;14:1347–1356. doi: 10.1016/j.chembiol.2007.11.006. [DOI] [PMC free article] [PubMed] [Google Scholar]
- Blazquez C, Sanchez C, Velasco G, Guzman M. Role of carnitine palmitoyltransferase I in the control of ketogenesis in primary cultures of rat astrocytes. J. Neurochem. 1998;71:1597–1606. doi: 10.1046/j.1471-4159.1998.71041597.x. [DOI] [PubMed] [Google Scholar]
- Brekke E, Morken TS, Sonnewald U. Glucose metabolism and astrocyte-neuron interactions in the neonatal brain. Neurochem. Int. 2015;82:33–41. doi: 10.1016/j.neuint.2015.02.002. [DOI] [PubMed] [Google Scholar]
- Cremer JE. Substrate utilization and brain development. J. Cereb. Blood Flow Metab. 1982;2:394–407. doi: 10.1038/jcbfm.1982.45. [DOI] [PubMed] [Google Scholar]
- Ebert D, Haller RG, Walton ME. Energy contribution of octanoate to intact rat brain metabolism measured by 13C nuclear magnetic resonance spectroscopy. J. Neurosci. 2003;23:5928–5935. doi: 10.1523/JNEUROSCI.23-13-05928.2003. [DOI] [PMC free article] [PubMed] [Google Scholar]
- Edmond J, Robbins RA, Bergstrom JD, Cole RA, de Vellis J. Capacity for substrate utilization in oxidative metabolism by neurons, astrocytes, and oligodendrocytes from developing brain in primary culture. J. Neurosci. Res. 1987;18:551–561. doi: 10.1002/jnr.490180407. [DOI] [PubMed] [Google Scholar]
- Ellis JM, Wong GW, Wolfgang MJ. Acyl coenzyme A thioesterase 7 regulates neuronal fatty acid metabolism to prevent neurotoxicity. Mol. Cell. Biol. 2013;33:1869–1882. doi: 10.1128/MCB.01548-12. [DOI] [PMC free article] [PubMed] [Google Scholar]
- Guest J, Garg M, Bilgin A, Grant R. Relationship between central and peripheral fatty acids in humans. Lipids Health. Dis. 2013;12 doi: 10.1186/1476-511X-12-79. 79-511X-12-79. [DOI] [PMC free article] [PubMed] [Google Scholar]
- Hakim AM, Moss G, Scuderi D. The pentose phosphate pathway in brain during development. Biol. Neonate. 1980;37:15–21. doi: 10.1159/000241251. [DOI] [PubMed] [Google Scholar]
- Inloes JM, Hsu KL, Dix MM, Viader A, Masuda K, Takei T, Wood MR, Cravatt BF. The hereditary spastic paraplegia-related enzyme DDHD2 is a principal brain triglyceride lipase. Proc. Natl. Acad. Sci. U. S. A. 2014;111:14924–14929. doi: 10.1073/pnas.1413706111. [DOI] [PMC free article] [PubMed] [Google Scholar]
- Kamat SS, Camara K, Parsons WH, Chen DH, Dix MM, Bird TD, Howell AR, Cravatt BF. Immunomodulatory lysophosphatidylserines are regulated by ABHD16A and ABHD12 interplay. Nat. Chem. Biol. 2015;11:164–171. doi: 10.1038/nchembio.1721. [DOI] [PMC free article] [PubMed] [Google Scholar]
- Kety SS. The general metabolism of the brain in vivo. In: Richter D, editor. Metabolism of the nervous system. London: Pergamon Press; 1957. p. 221. [Google Scholar]
- Lee HC, Simon GM, Cravatt BF. ABHD4 regulates multiple classes of N-acyl phospholipids in the mammalian central nervous system. Biochemistry. 2015;54:2539–2549. doi: 10.1021/acs.biochem.5b00207. [DOI] [PMC free article] [PubMed] [Google Scholar]
- Lee J, Choi J, Scafidi S, Wolfgang MJ. Hepatic Fatty Acid Oxidation Restrains Systemic Catabolism during Starvation. Cell. Rep. 2016;16:201–212. doi: 10.1016/j.celrep.2016.05.062. [DOI] [PMC free article] [PubMed] [Google Scholar]
- Lee K, Kerner J, Hoppel CL. Mitochondrial carnitine palmitoyltransferase 1a (CPT1a) is part of an outer membrane fatty acid transfer complex. J. Biol. Chem. 2011;286:25655–25662. doi: 10.1074/jbc.M111.228692. [DOI] [PMC free article] [PubMed] [Google Scholar]
- Lim JH, Gerhart-Hines Z, Dominy JE, Lee Y, Kim S, Tabata M, Xiang YK, Puigserver P. Oleic acid stimulates complete oxidation of fatty acids through protein kinase A-dependent activation of SIRT1-PGC1alpha complex. J. Biol. Chem. 2013;288:7117–7126. doi: 10.1074/jbc.M112.415729. [DOI] [PMC free article] [PubMed] [Google Scholar]
- Lin H, Patel S, Affleck VS, Wilson I, Turnbull DM, Joshi AR, Maxwell R, Stoll EA. Fatty acid oxidation is required for the respiration and proliferation of malignant glioma cells. Neuro Oncol. 2016 doi: 10.1093/neuonc/now128. [DOI] [PMC free article] [PubMed] [Google Scholar]
- Long JZ, Cisar JS, Milliken D, Niessen S, Wang C, Trauger SA, Siuzdak G, Cravatt BF. Metabolomics annotates ABHD3 as a physiologic regulator of medium-chain phospholipids. Nat. Chem. Biol. 2011;7:763–765. doi: 10.1038/nchembio.659. [DOI] [PMC free article] [PubMed] [Google Scholar]
- Lynen F. Fatty acid metabolism. In: Richter D, editor. Metabolism of the nervous system. Pergamon Press; London: 1957. p. 381. [Google Scholar]
- Magret V, Elkhalil L, Nazih-Sanderson F, Martin F, Bourre JM, Fruchart JC, Delbart C. Entry of polyunsaturated fatty acids into the brain: evidence that high-density lipoprotein-induced methylation of phosphatidylethanolamine and phospholipase A2 are involved. Biochem. J. 1996;316(Pt 3):805–811. doi: 10.1042/bj3160805. [DOI] [PMC free article] [PubMed] [Google Scholar]
- McKenna MC, Scafidi S, Robertson CL. Metabolic Alterations in Developing Brain After Injury: Knowns and Unknowns. Neurochem. Res. 2015;40:2527–2543. doi: 10.1007/s11064-015-1600-7. [DOI] [PMC free article] [PubMed] [Google Scholar]
- Nguyen LN, Ma D, Shui G, Wong P, Cazenave-Gassiot A, Zhang X, Wenk MR, Goh EL, Silver DL. Mfsd2a is a transporter for the essential omega-3 fatty acid docosahexaenoic acid. Nature. 2014;509:503–506. doi: 10.1038/nature13241. [DOI] [PubMed] [Google Scholar]
- O'Brien JS, Sampson EL. Fatty acid and fatty aldehyde composition of the major brain lipids in normal human gray matter, white matter, and myelin. J. Lipid Res. 1965a;6:545–551. [PubMed] [Google Scholar]
- O'Brien JS, Sampson EL. Lipid composition of the normal human brain: gray matter, white matter, and myelin. J. Lipid Res. 1965b;6:537–544. [PubMed] [Google Scholar]
- Owen OE, Morgan AP, Kemp HG, Sullivan JM, Herrera MG, Cahill GF., Jr Brain metabolism during fasting. J. Clin. Invest. 1967;46:1589–1595. doi: 10.1172/JCI105650. [DOI] [PMC free article] [PubMed] [Google Scholar]
- Rolfe DF, Brown GC. Cellular energy utilization and molecular origin of standard metabolic rate in mammals. Physiol. Rev. 1997;77:731–758. doi: 10.1152/physrev.1997.77.3.731. [DOI] [PubMed] [Google Scholar]
- Rossiter RJ. Lipid metabolism. In: Richter D, editor. Metabolism of the nervous system. Pergamon Press; London: 1957. p. 355. [Google Scholar]
- Schonfeld P, Reiser G. Why does brain metabolism not favor burning of fatty acids to provide energy? Reflections on disadvantages of the use of free fatty acids as fuel for brain. J. Cereb. Blood Flow Metab. 2013;33:1493–1499. doi: 10.1038/jcbfm.2013.128. [DOI] [PMC free article] [PubMed] [Google Scholar]
- Schulz JG, Laranjeira A, Van Huffel L, Gartner A, Vilain S, Bastianen J, Van Veldhoven PP, Dotti CG. Glial beta-oxidation regulates Drosophila energy metabolism. Sci. Rep. 2015;5:7805. doi: 10.1038/srep07805. [DOI] [PMC free article] [PubMed] [Google Scholar]
- Spector R. Fatty acid transport through the blood-brain barrier. J. Neurochem. 1988;50:639–643. doi: 10.1111/j.1471-4159.1988.tb02958.x. [DOI] [PubMed] [Google Scholar]
- Stoll EA, Makin R, Sweet IR, Trevelyan AJ, Miwa S, Horner PJ, Turnbull DM. Neural Stem Cells in the Adult Subventricular Zone Oxidize Fatty Acids to Produce Energy and Support Neurogenic Activity. Stem Cells. 2015;33:2306–2319. doi: 10.1002/stem.2042. [DOI] [PMC free article] [PubMed] [Google Scholar]
- Vignais PM, Gallagher CH, Zabin I. Activation and oxidation of long chain fatty acids by rat brain. J. Neurochem. 1958;2:283–287. doi: 10.1111/j.1471-4159.1958.tb12375.x. [DOI] [PubMed] [Google Scholar]
- Wolfgang MJ, Cha SH, Millington DS, Cline G, Shulman GI, Suwa A, Asaumi M, Kurama T, Shimokawa T, Lane MD. Brain-specific carnitine palmitoyl-transferase-1c: role in CNS fatty acid metabolism, food intake, and body weight. J. Neurochem. 2008;105:1550–1559. doi: 10.1111/j.1471-4159.2008.05255.x. [DOI] [PMC free article] [PubMed] [Google Scholar]
- Wolfgang MJ, Kurama T, Dai Y, Suwa A, Asaumi M, Matsumoto S, Cha SH, Shimokawa T, Lane MD. The brain-specific carnitine palmitoyltransferase-1c regulates energy homeostasis. Proc. Natl. Acad. Sci. U. S. A. 2006;103:7282–7287. doi: 10.1073/pnas.0602205103. [DOI] [PMC free article] [PubMed] [Google Scholar]
- Xie Z, Jones A, Deeney JT, Hur SK, Bankaitis VA. Inborn Errors of Long-Chain Fatty Acid beta-Oxidation Link Neural Stem Cell Self-Renewal to Autism. Cell. Rep. 2016;14:991–999. doi: 10.1016/j.celrep.2016.01.004. [DOI] [PMC free article] [PubMed] [Google Scholar]
Associated Data
This section collects any data citations, data availability statements, or supplementary materials included in this article.
Supplementary Materials
Supplemental Figure 1. Developmental RNA expression of carnitine transporter in rat brain.
OCTN2 RNA expression was significantly greater at PND 50 relative to PND7 and PND 14 in the cortex, hippocampus and mibrain. RNA expression of OCTN2 increases with age such that PND7 OCTN2 expression is significantly less than PND 21, 28, and 50 in the cerebellum (n=5 per group * =p<0.05, ** =p<0.01 relative to PND7, + =p<0.05, ++ =p< .01 relative to PND14).
Supplemental Figure 2. CPT1a-dependent fatty acid oxidation in cultured rat astrocytes. Oxidation of [1-14C] oleate to 14CO2 in cultured rat astrocytes was measured in the presence or absence of CPT1a inhibitor etomoxir (100 µM, ETOX). Assay was conducted in the presence of 0.12µCi [1-14C] oleate in modified Neurobasal medium containing 5mM glucose, 25µM glutamine, 50µM pyruvate, and 0.2% (w/v) bovine serum albumin (BSA). N=5 per group.
Supplemental Table 1. Blood acylcarnitines levels measured at post-natal day 0, 7, 14, 21, 28 and 50 (N=5/group).
Supplemental Table 2. Developmental acylcarnitine profile in the rat cortex at post-natal day (PND) 0, 7, 14, 21, 28, 50 (N=5/group).
Supplemental Table 3. Developmental acylcarnitine profile in the rat hippocampus at PND 0, 7, 14, 21, 28, 50 (N=5/group).
Supplemental Table 4. Developmental acylcarnitine profile in the rat midbrain at PND 0, 7, 14, 21, 28, 50 (N=5/group).
Supplemental Table 5. Developmental acylcarnitine profile in the rat cerebellum at PND 0, 7, 14, 21, 28, 50 (N=5/group).