

Abstract
In this study, we present a medium throughput siRNA screen platform to identify inflammation genes that regulate cancer cell stemness. We identified several novel candidates that decrease OCT4 expression and reduce the ALDH+ subpopulation both of which are characteristic of stemness. Furthermore, one of the novel candidates ICAM3 up-regulates in the ALDH+ subpopulation, the side population and the developed spheres. ICAM3 knockdown reduces the side population, sphere formation and chemo-resistance in MDA-MB-231 human breast cancer cells and A549 lung cancer cells. In addition, mice bearing MDA-MB-231-shICAM3 cells develop smaller tumors and fewer lung metastases versus control. Interestingly, ICAM3 recruits and binds to Src by the YLPL motif in its intracellular domain which further activates the PI3K-AKT phosphorylation cascades. The activated p-AKT enhances SOX2 and OCT4 activity and thereby maintains cancer cell stemness. Meanwhile, the p-AKT facilitated p50 nuclear translocation/activation enhances p50 feedback and thereby promotes ICAM3 expression by binding to the ICAM3 promoter region. On this basis, Src and PI3K inhibitors suppress ICAM3-mediated signaling pathways and reduce chemo-resistance which results in tumor growth suppression in vitro and in vivo. In summary, we identify a potential CSC regulator and suggest a novel mechanism by which ICAM3 governs cancer cell stemness and inflammation.
Keywords: SiRNA screen, ICAM3, Cancer cell stemness, Inflammation, Chemo-resistance
1. Introduction
The cancer stem cell (CSC) is the chief culprit in tumor initiation and malignancy whereby the maintenance of cancer cell stemness largely depends on the surrounding environment or “niche” [1–5]. Although the highly tumorigenic CSCs play a role in tumor initiation/metastasis and might therefore be a good clinical therapy target, CSCs unfortunately demonstrate a relative resistance to conventional chemotherapy and radiotherapy.
In addition, tumor-associated inflammation factors within the tumor niche play a pivotal role in the maintenance of cancer cell stemness and the resultant tumor initiation/malignancy [6, 7]. However, tumor-associated inflammation genes or pathways that govern cancer cell stemness remain poorly understood.
The intercellular adhesion molecule (ICAM) family is a subfamily of immunoglobulin (Ig) superfamily with five known ICAM family members (ICAM1-ICAM5) which play a role in inflammation, immune responses, and intracellular signaling [8]. All ICAMs are type I transmembrane glycoproteins that contain a N-terminus extracellular domain, a single transmembrane domain, and a C-terminus cytoplasmic domain. ICAMs possess 2-9 Ig-like C2-type domains in extracellular region and bind to the leukocyte adhesion protein LFA-1 [9–12]. The extracellular domain of ICAMs show a striking homology, but the transmembrane domain and cytoplasmic domain show little conservation. Important differences may exist among various ICAMs in regards to cell surface localization, cytoskeletal interactions, and signaling. ICAMs are found in epithelium, endothelium, leukocytes, fibroblasts, erythrocytes, platelets, and neurons. Previous reports indicate that ICAM-1 is found in prostate, breast, liver and esophageal cancers and probably acts in the progression of these cancers [13–16]. Although elevated levels of other ICAM family members occur in certain carcinomas, the role of ICAMs in the clinical outcomes and prognosis of cancer patients remains unclear.
Numerous reports suggest that ICAM3 is involved in immune cell interactions and T lymphocyte activation [10, 17]. Recently, several studies have suggested that ICAM3 exerts strong stimulatory activity in tumor drug resistance [18], radiation resistance, and cancer cell migration/invasion/proliferation [19, 20]. ICAM3 contains two tyrosine residues in the cytoplasmic domain. The sequence motif (called the Ag recognition activation motif) arranges in the general pattern YXXL and plays a critical role in signal transduction. The tyrosine residues in the Ag recognition activation motif (YXXL) are phosphorylated after receptor stimulation, probably by Src kinase family members [12]. This phosphorylation plays a role in other tyrosine kinase phosphorylation events, for example, in human neutrophils.
In this study, we performed a medium throughput siRNA screening system to identify inflammation genes involved in OCT4 expression. Primary gene hits were further validated in a secondary screen and the ALDH activity assay which identified 10 high confidence hits. We further characterized the inflammation gene ICAM3 in detail and found that ICAM3 shows a significant involvement in cancer cell stemness in vitro and in vivo. Also, blockage of the Src-PI3K-AKT signal pathway inhibits the expression of ICAM3 and disturbs the interaction between inflammation and stemness pathways which thereby results in impaired CSCs identities. Our results may provide novel targets to CSCs and new strategies for cancer treatment.
2. Materials and Methods
2.1 Vector Construction
ShRNA targeting human ICAM3 and scrambled control sequence were summarized in Supplemental Table 1. The palindromic DNA oligos were annealed to each other to form a double-strand oligo and ligated to the linearized pLV-H1-EF1α-puro (cat. #SORT-B19, Biosettia Inc.) vector to generate circled pLV-H1-shRNA-Puro. Specific primers for ICAM3 or mutant types were summarized in Supplemental Table 1. The amplified fragments were finally ligated into pLV-EF1α-MCS-IRES-Bsd (cat. #cDNA-pLV 03, Biosettia Inc.) expression vector.
2.2 Cell culture
HMLE-snail cells were cultured in mammary epithelial basal medium supplement with BPE, hEGF, hybrocortisone, GA-1000, insulin (Lonza). Human lung cancer cell line A549 and breast cancer cell line MDA-MB-231 cells were purchased from ATCC. All the cell lines were recently authenticated by cellular morphology and the short tandem repeat analysis at Microread Inc. (Beijing, China; May 2014) according to the guideline from ATCC. A549 and 231 cells were infected with lentivirus carrying pLV-H1-shICAM3-puro or pLV-EF1α-ICAM3-puro plasmids, followed by selection using 2 μg/ml puromycin to generate polyclonal cell populations.
2.3 Medium-throughput siRNA screen, data analysis and hit selection
The human siGENOME SMART pool library targeting 1027 inflammation-related genes were obtained from Dharmacon. For the siRNA screens, transfection mixtures were 50nM siRNA, 100ng OCT4 reporter constructs (QIAGEN) and 0.3 ul Lipofectamine 2000 (Invitrogen) in 50 ul opti-MEM medium (Invitrogen), three replicates were used for each siRNA. In each plate, we used both POU5FI (5460) siRNA-SMART pool Dharmacon M-019591-03-0005 and SiGENOME Human PRDM14 (63978) siRNA-SMART pool as positive controls [21]. HMLE-snail cell were plated in 50ul opti-MEM medium with a density of 10000 cells per well in 96-well plate. Dual Luciferase reporter assay was carried out for medium-throughput readout (Promega), and the level of OCT4 reporter gene expression was measured using a microplate reader (Mithras LB941, Berthold Technologies). OCT4 reporter values were normalized to the expression of the Renilla luciferase reporter. Fold change value of each siRNA sample was calculated. The distribution of the datasets was determined to be closed to normal distribution, so the Student pair-t test between each siRNA group and the relative negative control group was performed. The cut-off values for the screen are Fold change <0.5 or >2.0, and P<0.05.
2.4 DAVID Bioinformatics analysis
DAVID Bioinformatics Tool [22, 23] was used to identify functional enrichment of the 10 genes, which could be performed gene ontology analysis to explore the biological process correlated with these genes. The p-value was defined by <0.05.
2.5 Immunohistochemistry
Immunohistochemistry was performed on 80 paraffin-embedded human lung cancer, breast cancer, colon cancer and prostate cancer tissue microarray (cat. # MC8010 & cat. # Top4-240a, Alenabio Company, Shanxi, China). Primary antibody raised against ICAM3 at a 1:100 dilution overnight. The expression levels of ICAM3 were scored according to the percentage of ICAM3-positive cells in the each tumors tissues and their staining intensity. Specifically, 0%–25%, 26%–50%, 51-75% and 76-100% were scored as 1, 2, 3 and 4 respectively; non-significant brown, slight brown, moderate brown and deep brown staining intensities were scored as 1, 2, 3 and 4, respectively. The two scores were multiplied. Evaluation was carried out by two independent observers. The images were recorded by Olympus BX51 Epi-fluorescent microscopy under a 20× or 40×objective (Olympus Co, Tokyo, Japan).
2.6 Immunofluorescence
Cells grow on glass slides, tumor tissue slices were fixed in 4% paraformaldehyde and labeled with primary antibodies overnight at 4°C, followed by incubation with species-appropriate secondary antibodies at room temperature for 1h. Nuclei were stained with DAPI, and Images were obtained using a Leica DM4000 upright microscope or confocal fluorescence microscopy (Nikon, Tokyo, Japan).
2.7 Immunoprecipitation
Cell protein lysates were incubated with protein A/G agarose beads (Life technology) and antibody overnight at 4°C. Then centrifuge at 2500 rpm for 30s and wash the pellets carefully pre-chilled PBS buffer. Finally, binding proteins were boiled to proceed SDS-PAGE. Immunoprecipitates were analyzed with the specific antibody by Western blot. Antibodies used in this assay are listed in supplementary Table S2.
2.8 Western blotting
Cell lysates from different cell lines were prepared with RIPA buffer in the presence of protease inhibitor cocktails and Phosphatase Inhibitor Cocktail 2 and 3 (P8340, P5726 and P0044, Sigma-Aldrich, St Louis, MO, USA). Protein (20-50μg) was separated by 8–15% Tris-acrylamide gels and blotted with primary antibodies at 4°C overnight followed by incubation with horseradish peroxidase-conjugated secondary antibodies. The results were detected by ECL reagent (cat. #17153, Millipore, Billerica, MA, USA). Primary antibodies used in this assay are listed in supplementary Table S2. Images were acquired using the BioRad Chemi Doc MP Imaging System (BioRad, Hercules, CA, USA). All Western blots were a representative image of three separate experiments. The results were analyzed using Image J software (National Institutes of Health, Baltimore, MD).
2.9 Chromatin immunoprecipitation assay
The assay was performed with an EZ-Zyme Chromatin Prep Kit (Millipore), according to the manufacturer’s protocol. Anti-P50 antibody was used to precipitate DNA cross-linked with P50, and normal rabbit IgG was used in parallel as a control. Enriched DNA was then used as a template to assess the binding intensity of P50 to putative binding sites in the ICAM3 promoter. Primers used in this assay are listed in supplementary Table S1.
2.10 Luciferase assay
The luciferase reporter vectors, the OCT4, ICAM3 gene promoter fragments were amplified from human genomic DNA and cloned into the firefly luciferase plasmid pGL3-basic-IRES. For reporter assays, above constructs along with pRL-TK plasmid (internal reference) were co-transfected into MDA-MB-231 or A549 cells. Then cells lysates were collected and analyzed with Dual-luciferase reporter assay system following its manual (Promega, E1910). And the reporter activity was measured using a microplate reader (Mithras LB941, Berthold Technologies).
2.11 Sphere formation assay
Cells were collected and rinsed to remove serum, then dissociated to single-cell suspension in serum-free DMEM/F12 medium supplemented with 100 IU/ml penicillin, 100 μg/ml streptomycin, 20 ng/ml human recombinant epidermal growth factor (hREGF), 20 ng/ml human recombinant basic fibroblast growth factor (bFGF), 2% B27 supplement (Invitrogen). Cells were subsequently cultured in ultra-low attachment 24-well plates at a density of 500 cells per well.
2.12 Flow cytometry
The apoptosis assay: The 231 and A549 cells were treated with DDP (10ug/ml) for 24h, then harvested and resuspended in pre-warmed staining buffer (PBS buffer added 2% FBS) at a density of 1.0×10⁶ cells/ml. Apoptotic cells were stained with propidium iodide and Annexin-V-FITC (BD Biosciences). Flow cytometry analysis was performed by FACS Calibur cytometer (BD Biosciences), in which a minimum of 10, 000 events were recorded.
The ICAM3-ALDH1 double staining assay: The 231 and A549 cells were harvested and resuspended in pre-warmed staining buffer at a density of 1.0×10⁶ cells/ml. ICAM3 antibody (1ug/ul) and ALDH1 antibody (1ug/ul) was added for 2h. Flow cytometry analysis was performed by FACS Calibur cytometer (BD Biosciences).
Side population assay: 231, A549 cells were harvested and resuspended in pre-warmed staining buffer at a density of 1.0×10⁶ cells/ml. Hoechst 33342 dye was added at a final concentration of 7 μg/ml (231), 8 μg/ml (A549) in the presence or absence of 10 μM fumitremorgin C (FTC). Cell samples were placed in a 37°C for 60 min and mixed every 10 min. At the end of the staining period, cells were resuspended in cold staining buffer containing 1 μg/ml propidium iodide (PI) for dead cell discrimination. The Hoechst dye was excited with a UV laser at 355 nm, and its fluorescence measured with a 460/50 BP filter (Hoechst Blue) and a 670/30 BP filter (Hoechst Red) on flow cytometer BD Biosciences (San Jose, CA, USA) FACS ARIA II.
2.13 Animal study
NOD/SCID mice at 6–8 weeks were separated randomly into several groups (n ≥3). Cells were inoculated s.c into each mouse. Tumor volume (mm3) was measured with calipers and calculated by using the standard formula: length × width2/2. The individual measuring the mice was unaware of the identity of the group measured. Two months after implantation, primary tumors were harvested and analyzed by in vivo molecular imaging technology. Lungs were fixed in formalin, and embedded in paraffin, and sections were analyzed by H&E staining.
For inhibitor treatment assay, 15 days after tumor cells injection, mice were first treated with Src inhibitor (a new specific high efficient Src inhibitor [24], 20mg/kg), PI3K inhibitor (LY294002, 70mg/kg) or NF-KB inhibitor (PDTC, 40mg/kg), respectively. DMSO used as the control.
In the chemo-resistance assay, 12 days after tumor cells injection the mice were treated with DDP (2.5mg/kg), Src inhibitor (10mg/kg), PI3K inhibitor (40mg/kg), DDP+Src inhibitor and DDP+PI3K inhibitor separately every two days. DMSO used as the control.
2.14 Statistical analysis
Values were expressed as means±s.e.m. Significance was determined by χ2 test, others were determined by Student’s t-test. A value of P<0.05 was used as the criterion for statistical significance. *Indicates significant difference with P<0.05, **indicates significant difference with P<0.01, ***indicates significant difference with P<0.001 [25, 26].
3. Results
3.1 The screen for new inflammation-related CSCs regulators via a medium throughput siRNA library
We constructed a medium throughput RNAi screen platform in order to systemically investigate the correlation between inflammation and CSCs. The stem-like cell line, HMLE-snail (immortalized human mammary epithelial cells by ectopic expression of Snail) was chosen as a CSC model for the screen [27–30]. We chose the HMLE-snail cell line because this cell line demonstrates important properties of stem cell markers, for example, stable expression (Fig S1A), sphere formation (Fig S1B), high percentage of ALDH positive cells (Fig S1C) and stable ability for screening (Fig S1D). A dual-luciferase reporter construct driven by the OCT4 promoter was transfected into HMLE-snail cells [21]. Using the reporter system, we screened a siRNA library targeting 1027 human inflammation genes (Fig 1A). These genes were identified by ingenuity pathway analysis and were assembled into 17 functional sub-pathways involved in one or multiple phases of inflammation (Fig S2A). We set a cut-off for genes with a fold change of ≥ 2 or ≤ 0.5 and an adjusted P value of < 0.05 to be considered as potential candidates. These cut-off parameters yielded in 156 candidate genes. These 156 candidate genes were re-screened in triplicate which resulted in 72 candidate genes that may function in the control of OCT4 expression (Fig 1B, Supplemental table 3). The signaling pathway distribution of the 72 candidate genes narrowed down to mainly the Adhesion-Extravasation-Migration pathway, followed by the MAPK pathway, cytokine pathway, and finally the NF-κB pathway (Fig S2B).
Figure 1. ICAM3, identified from RNAi library screen, was associated with tumor malignancy.
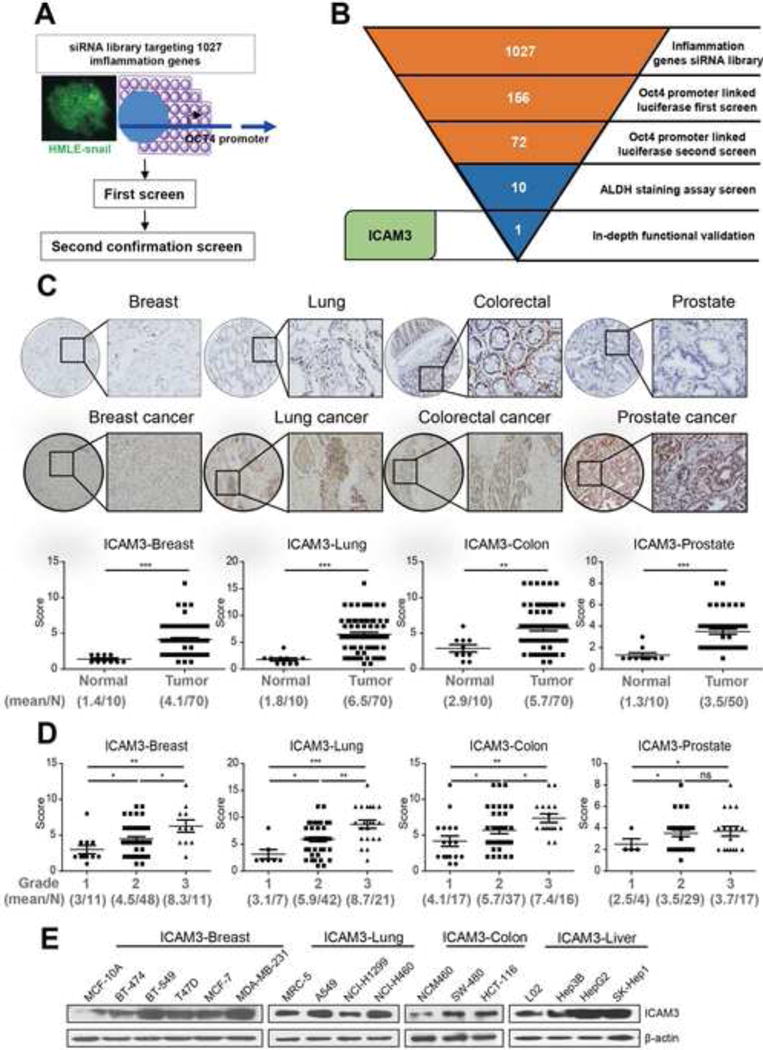
(A) Schematic representation of the siRNA screen. (B) Summary of the results from the RNAi screen. Results from high-throughput RNAi screen are in red while follow up screens are in blue. (C) Up: representative IHC images of ICAM3 staining in multi-tissue array containing breast cancer, lung cancer, colon cancer, prostate cancer and corresponding normal tissues. Scar bar, 100 μm. Down: statistical analysis of the relationship of ICAM3 expression with tissue status. (D) Statistical analysis of ICAM3 expression with cancer tissue pathological grades. The data were in the form of mean ± SEM, and statistical significance was indicated as *p<0.05; **p<0.01, *** p<0.001 by student t test. (E) Western blot was performed to detect the expression of ICAM3 in normal breast (MCF-10A)/breast cancer, normal lung (MRC-5)/lung cancer, normal colon (NCM460)/colorectal cancer, normal liver (L02)/liver cancer cell lines.
We ascertained that the knockdown of 10 genes (NFKB1, IL-1α, IL-1β, p50, p130, TRAF6, PRTN3, PDE3A, ICAM3 and CCL16) decreases the ALDH+ subpopulation in HMLE-snail cells using the ALDH+ staining assay (Fig S2C). We analyzed the candidate genes by DAVID Bioinformatics to further investigate the candidate genes related signaling pathways. This analysis revealed that the 10 candidate genes show a direct or indirect involvement in the PI3K-AKT, Notch, Wnt/SHH, and BMP signaling pathways which are known CSC-related pathways (Fig S1D). Together, these results indicate that the 10 candidate genes demonstrate a close linkage with cancer cell stemness which suggests a role in CSCs maintenance.
3.2 The selected inflammatory genes were highly expressed in malignant tumors
Of the 10 candidate genes, ICAM3 has been previously reported to show little association with CSC characteristics. Therefore, to fully appreciate the correlation of ICAM3 with cancer cell stemness, we examined the expression levels of ICAM3 using tissue microarrays consisting of 300 patient biopsies from four different cancer types (breast, lung, colon and prostate) and normal controls. The tissue microarray results showed that expression levels of ICAM3 increase in tumor biopsies versus comparable normal tissues (Fig 1C). Since the clinical pathological grade of a tumor closely correlates to tumor malignancy/differentiation, we explored the correlation between the expression levels of ICAM3 and the pathological grade of the tumor biopsies. We found a positive correlation between elevated expression levels of ICAM3 and high grade tumor biopsies (Fig 1D). In brief, ICAM3 fulfill all screening criteria. We checked the expression level of ICAM3 in human cancer cell lines from four cancer types (breast, lung, colon, and liver) and relatively normal cell lines. The results showed that ICAM3 had high expression levels in the cancer cell lines, especially in malignant breast cancer cells MDA-MB-231, lung cancer cells A549 (Fig 1E, Fig S3A). Based on the above-mentioned findings, we decided to focus specifically on ICAM3 as a cross-talk protein that mediates cancer cell stemness and inflammation at this time.
3.3 ICAM3 plays a vital role in the maintenance of CSC identity
We examined the mechanism by which ICAM3 regulates CSCs using various experimental approaches. We first knocked down ICAM3 expression in MDA-MB-231, A549, and HepG2 cancer cells by stable expression of either two ICAM3 shRNAs or control (sc). We found that ICAM3 knockdown consistently decreases expression levels of stemness markers, including OCT4, SOX2, NANOG, β-catenin (Fig 2A, Fig S3B).
Figure 2. ICAM3 mediates the capacities of CSCs in vitro and in vivo.
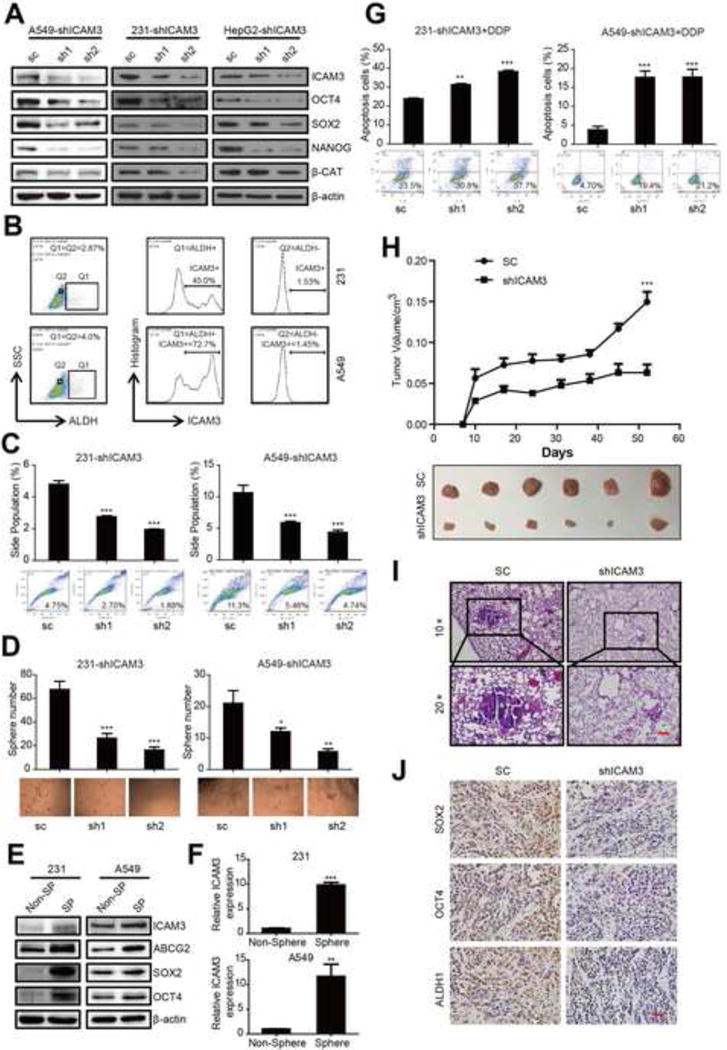
(A) Western blot to detect the expression of pluripotency factors OCT4, SOX2, NANOG and β-catenin in ICAM3 deficiency cells. (B) ALDH-ICAM3 double staining was performed to check ICAM3 expression in ALDH− or ALDH+ cells. In the left plot, we gated ALDH+ cells as well as the same percentage of ALDH- cells (like in 231 cell line, Q1=ALDH+, Q2=ALDH-, Q1=Q2=2.87%). The middle plot shows the histogram of ICAM3 expression in ALDH+ cells. The right plot shows the histogram of ICAM3 expression in ALDH− cells. (C) Side population assay shows silencing of ICAM3 in MDA-MB-231 and A549 cells decrease SP cells proportion (upper panel). The typical flow images were exhibited correspondently (Lower panel). (D) Quantification of tumor sphere numbers derived from MDA-MB-231 and A549 cells transduced with sc or shICAM3 (upper panel). Representative images of tumor spheres were displayed (Lower panel). (E) Western blot was performed to check ICAM3 expression in non-SP or SP cells. (F) qPCR was performed to detect ICAM3 mRNA expression in non-sphere or sphere cells. (G) FACS was performed to detect cell resistance to cisplatin, the percentage of apoptotic cells (upper panel) and pictures (Lower panel) were shown. (H) Tumor growth curve of 231-sc or shICAM3 and several tumors separated from each group were shown, ICAM3-sh2 and sc were used to injection. (I) H&E staining was used to analysis lung metastasis. Representative images were shown. Scar bar, 100 μm. (J) Representative IHC images of SOX2 staining, OCT4 staining and ALDH1 staining were shown. Scar bar, 100 μm.
We next analyzed ICAM3 expression in ALDH− and ALDH+ cells using FACS. We found that ICAM3 expression was obvious in ALDH+ cells using the same amount of ALDH− or ALDH+ cells (Fig 2B). In addition, the loss of ICAM3 significantly decreases the proportion of side population (SP) cells and restrains tumor sphere formation in MDA-MB-231 and A549 cancer cells (Fig 2C, 2D).
We also analyzed ICAM3 expression in SP cells (evaluated by ABCG2, SOX2, and OCT4 protein expression) and in cultured tumor spheres (evaluated by SOX2 and OCT4 mRNA expression). We found elevated ICAM3 expression levels in SP cells and tumor sphere versus non-SP cells or non-spheres (Fig 2E, 2F, Fig S3C).
We further investigated whether ICAM3 expression mediates cisplatin (DDP) resistance and metastases by analyzing apoptosis after DDP treatment of MDA-MB-231 and A549 cancer cells. We found that ICAM3 knockdown attenuates cisplatin resistance and induces apoptosis (Fig 2G).
To verify our in vitro findings, we performed tumor xenograft studies in NOD/SCID mice injected with either 231-shICAM3 or 231-sc cells. We found a marked reduction in tumor growth in the 231-shICAM3 group versus the 231-sc control (Fig 2H). In addition, a suppression of lung metastasis occurs in the 231-shICAM3 group versus the 231-sc control (Fig 2I). Finally, a decreased immunocytochemical staining of stemness markers (SOX2, OCT4 and ALDH1) occurs in the 231-shICAM3 group versus the 231-sc control (Fig 2J, Fig S3D). We suggest that these results collectively indicate that ICAM3 silencing abates cancer cell stemness in vitro and in vivo.
3.4 ICAM3 facilitates the expression of pluripotency factors by interacting with Src kinase followed by PI3K-AKT pathway activation
We detected PI3K pathway signals based on our previous bio-informatic analysis of the screen candidates to determine the mechanism by which ICAM3 mediates CSC identities. We found that the loss of ICAM3 reduces the expression levels of p-PI3K and p-AKT (Fig 3A, Fig S4A).
Figure 3. ICAM3 facilitate pluripotency factors expression through interacting with Src kinase and activating PI3K-AKT pathway.
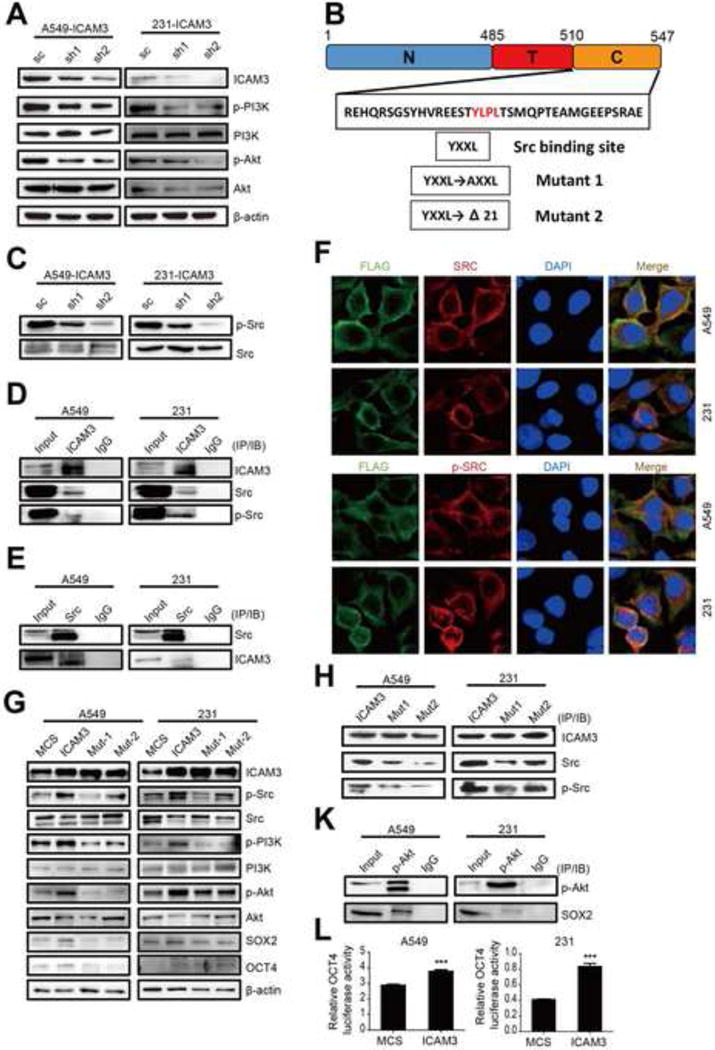
(A) Western blot was used to confirm PI3K and AKT activation in ICAM3 deficient MDA-MB-231 and A549 cells. (B) Sketch of the Src binding site in the intracellular domain of ICAM3, and the two mutation forms of ICAM3, the Delta21 is a defective form of ICAM3 which lacks the area from the YXXL motif to the end amino acid. (C) Src activation was detected by western blot in ICAM3 deficient MDA-MB-231 and A549 cells. (D) & (E) IP-immunoblot was performed to confirm ICAM3 and Src co-interaction. (F) Co-localization of ICAM3 and Src were examined in MDA-MB-231 and A549 cells by immunofluorescence staining. Scale bar, 10um. (G) Western to detect the expression of ICAM3, p-Src, p-PI3K, p-AKT, SOX2 and OCT4 in ICAM3 and two mutant expression cells. MCS (multiple cloning sites) was used as the empty vector control. (H) IP-immunoblot was performed in ICAM3 and two mutation expression cells to check the expression level of Src/p-Src based on the same expression of ICAM3. (I) IP-immunoblot was performed to confirm p-AKT and SOX2 co-interaction. (J) Dual-luciferase assay was performed to test OCT4 promoter activity of MDA-MB-231 and A549 expressed ICAM3 cells. The data was in the form of mean ± SEM, and statistical significance was indicated as *p<0.05; **p<0.01, *** p<0.001 by student t test.
We next investigated the mechanism by which ICAM3 affects the PI3K pathway. In this regard, previous reports indicate that ICAM3 contains an activation motif in the cytoplasmic domain with the general YXXL pattern. The cytoplasmic domain is phosphorylated on the tyrosine residue and associates with tyrosine kinase activity in human neutrophils [31] (Fig 3B). Src is a non-receptor protein tyrosine kinase which undergoes activation after engaging many different classes of cellular receptors, including integrin and other adhesion receptors. Therefore, we decided to explore the interaction between ICAM3 and Src in cancer cells.
We found that ICAM3 silencing suppresses Src phosphorylation (p-Src) in MDA-MB-231 and A549 cancer cells (Fig 3C). We also showed a definitive interaction between ICAM3 and Src in MDA-MB-231 and A549 cancer cells using co-immunoprecipitation and ICAM3 or Src antibodies (Fig 3D, 3E). We finally showed that ICAM3 co-localizes with Src in MDA-MB-231 and A549 cancer cells using double fluorescent staining (Figure 3F).
We examined the contribution of Src in delivering the signal from ICAM3 to the PI3K-AKT pathway through the ICAM3 YLPL motif by transfecting MCS, ICAM3, and two active mutations (Mut1 and Mut2 with mutant or deficient Src binding sites) into MDA-MB-231 and A549 cancer cells. We found that the expression levels of p-Src, p-PI3K, p-Akt, SOX2, and OCT4 increase in the ICAM3-transfected cancer cells versus the MCS-transfected control cells (Fig 3G, Fig S4B). We also found that the expression levels of SOX2 and OCT4 decrease in Mut1- and Mut2-transfected cancer cells since Src failed to bind ICAM3 due to the YLPL motif mutation thereby restraining Src phosphorylation and a downstream cascade of PI3K-AKT phosphorylation reactions (Fig 3G,3H).
The above-mentioned findings raise the question: Does AKT phosphorylation directly mediate the expression levels of the pluripotency transcription factors SOX2 and OCT4? To address this question, we performed immunoprecipitation (IP) with anti-p-AKT antibody and immunoblotting with anti-SOX2 antibody in MDA-MB-231 and A549 cancer cells. We discovered that p-AKT interacts with stemness factor SOX2 in MDA-MB-231 and A549 cancer cells (Fig 3I). In addition, in order to identify the final target of the signaling pathway and to verify our initial screen results, we performed the dual-luciferase assay using a ICAM3 overexpression vector and the OCT promoter driven luciferase construct co-transfected into MDA-MB-231 and A549 cancer cells. We found that ICAM3 overexpression promotes OCT4 promoter activity (Fig 3J). These findings collectively suggest that ICAM3 interacts with Src and accelerates Src phosphorylation which then activates the PI3K pathway.
3.5 The ICAM3-Src-PI3K-AKT pathway enhances cancer cell stemness in vivo
We examined whether the ICAM3-Src-PI3K-AKT signaling pathway plays a role in cancer cell stemness in vivo by transfecting MCS, ICAM3, and two active mutations (Mut1 and Mut2 with mutant or deficient Src binding sites) into A549 cancer cells and then implanting the transfected cells into NOD/SCID mice. We observed that tumor growth was reduced in the Mut1 and Mut2 groups versus the ICAM3 group, but similar to the MCS group (Fig 4A). We also observed by Western blot that the expression levels of p-Src, p-PI3K, p-Akt, SOX2, and OCT4 decrease in Mut1- and Mut2-transfected A549 cancer cells (Fig 4B, Fig S4C). Moreover, we observed a decreased immunocytochemical staining of p-Src, p-PI3K, p-Akt, SOX2, and OCT4 in Mut1- and Mut2-transfected A549 cancer cells versus ICAM3-transfected A549 cancer cells (Fig 4C, 4D). We observed a decreased immunofluorescence staining of OCT4 in Mut1- and Mut2-transfected A549 cancer cells since Src binding to ICAM3 is abolished in these cells (Fig 4E). Together, these findings suggest that ICAM3 interacts with Src and accelerates Src phosphorylation which then activates the PI3K pathway in vivo.
Figure 4. The ICAM3-Src-PI3K-AKT pathway enhances tumor malignance in vivo.
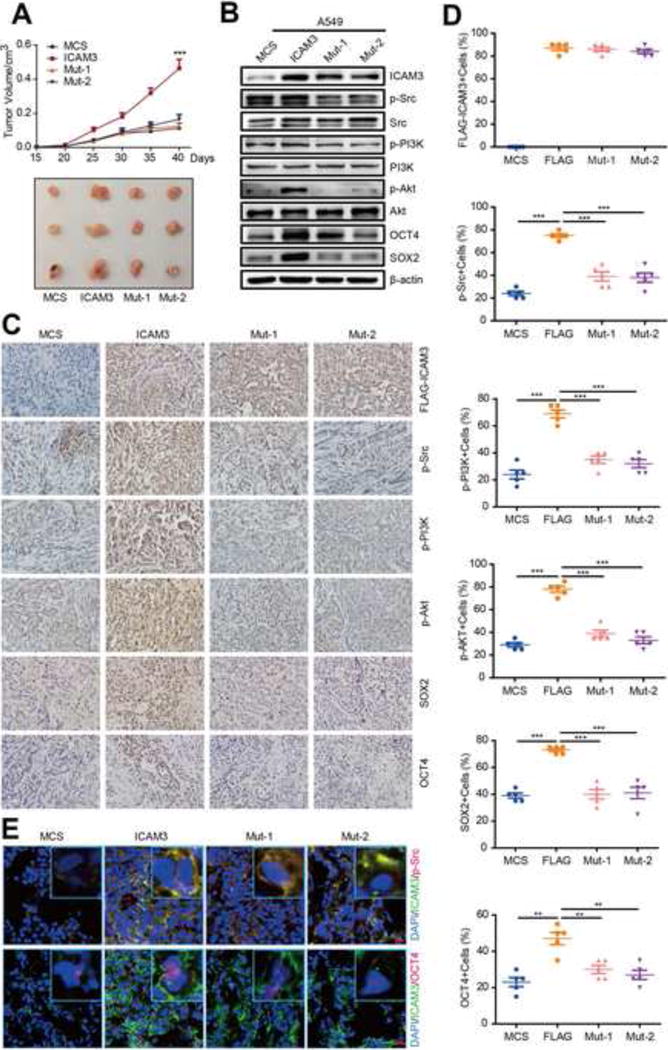
(A) Tumor growth curve of A549-MCS, ICAM3, Mut1, Mut2 and several tumors separated from each group were shown. (B) Western blot analysis of tumor tissue lysates from mice of different treatment by ICAM3, p-Src, p-PI3K, p-AKT, SOX2 and OCT4 antibodies. (C) The images show IHC staining of ICAM3, p-Src, p-PI3K, p-AKT, SOX2 and OCT4 in paraffin-embedded tumor tissue sections. Scale bar, 10um. (D) Data was presented as the mean±SEM, n=5. (E) Representative immunofluorescence pictures of double staining of ICAM3/Src or ICAM3/OCT4 in frozen tissue sections. Scale bar, 10μm.
3.6 Inhibitors targeted ICAM3 mediated signaling pathways suppressed cancer cell stemness in vitro and in vivo
We investigated the effects of a novel high potent Src inhibitor (13an) and a PI3K inhibitor (LY294002) in ICAM3-transfected MDA-MB-231 and A549 cancer cells. We found that Src inhibition decreases expression levels of SOX2 and OCT4 and blunts ICAM3-induced Src-PI3K-AKT pathway activation in ICAM3-transfected MDA-MB-231 and A549 cancer cells (Fig 5A, Fig S5B). To ensure that the observed downstream effects are not due to off-target effects of the new Src inhibitor, we used the typical Src inhibitor (dasatinib) (0.1uM) and 13an (0.1uM) to treat cells and found that Src inhibitors suppressed Src and PI3K/AKT activation further to inhibit OCT4 expression. Moreover, our inhibitor 13an was more effective than dasatinib (Fig S5A). We also found that PI3K inhibition decreases expression levels of SOX2 and OCT4 and blunts ICAM3-induced PI3K-AKT pathway activation in ICAM3-transfected MDA-MB-231 and A549 cancer cells (Fig 5B, Fig S5C).
Figure 5. Inhibitors targeted ICAM3 mediated signaling pathways suppressed cancer cell stemness in vitro and in vivo.
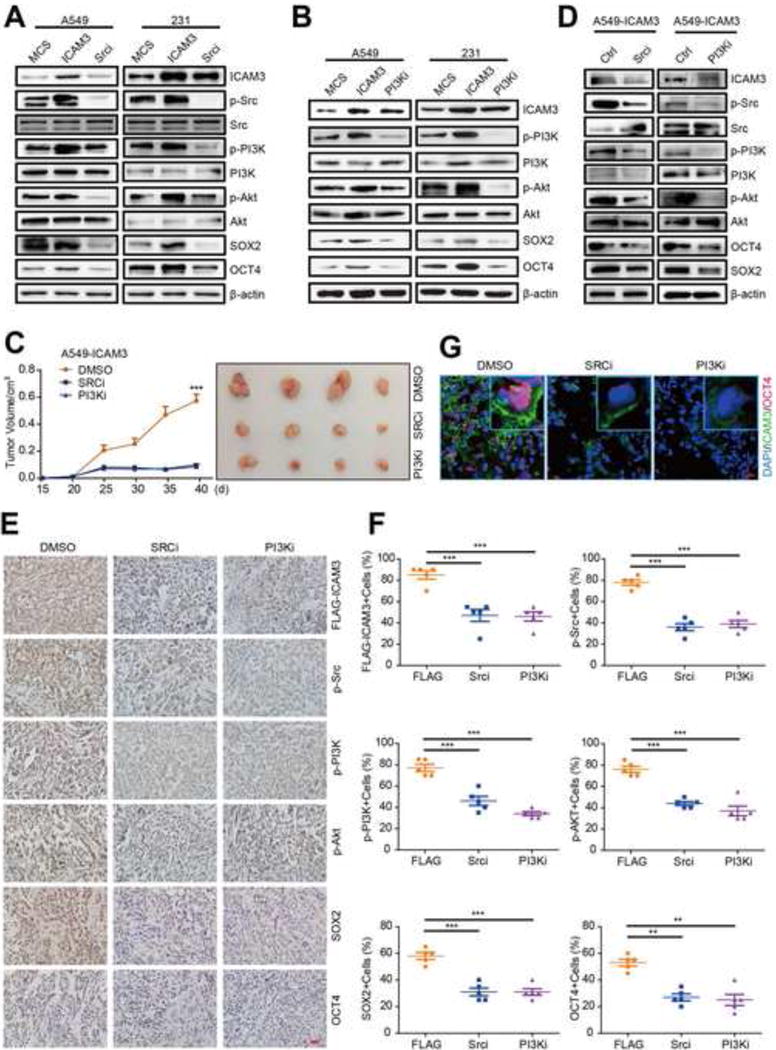
(A) & (B) Cells expressed ICAM3 then treated with Src or PI3K inhibitor for 24h, western blot to detect the expression of ICAM3, p-Src, p-PI3K, p-AKT, SOX2 and OCT4. MCS was used as a control. The concentration of the Src inhibitor (13an) was 0.1uM, the concentration of the PI3K inhibitor (LY294002) was 10uM. (C) Tumor growth curve of DMSO, Srci, PI3Ki and several tumors separated from each group were shown. Significantly larger tumor in mice treated with Src or PI3K inhibitor versus DMSO control. (D) Western blot analysis of tumor tissue lysates from mice of different treatment by ICAM3, p-Src, p-PI3K, p-AKT, SOX2 and OCT4 antibodies. (E) The images show IHC staining of ICAM3, p-Src, p-PI3K, p-AKT, SOX2 and OCT4 in paraffin-embedded tumor tissue sections. Scale bar, 10um. (F) Data was presented as the mean±SEM, n=5. (G) Representative immunofluorescence pictures of double staining of ICAM3/OCT4 in frozen tissue sections. Scale bar, 10μm.
We next studied the effects of a novel high potent Src inhibitor (13an) and a PI3K inhibitor (LY294002) in ICAM3-transfected A549 cancer cells 15 days after implantation into NOD/SCID. We found that tumor growth was reduced by Src inhibition and PI3K inhibition versus the DMSO control group in ICAM3-transfected A549 cancer cells (Fig 5C). In addition, we found that the Src inhibitor (13an) and the PI3K inhibitor (LY294002) modulate in vivo the phosphorylation of the PI3K-AKT pathway and the expression levels of SOX2 and OCT4 in ICAM3-transfected A549 cancer cells (Fig 5D, Fig S5D). We also observed a decreased immunocytochemical staining of p-Src, p-PI3K, p-Akt, SOX2, and OCT4 after treatment with the Src inhibitor (13an) and the PI3K inhibitor (LY294002) versus DMSO (control) treatment in ICAM3-transfected A549 cancer cells (Fig 5E, 5F). Analogously, we also observed a decreased immunofluorescence staining of cell membrane-associated ICAM3 and nuclear-associated OCT4 after treatment with the Src inhibitor (13an) and the PI3K inhibitor (LY294002) versus DMSO (control) treatment in ICAM3-transfected A549 cancer cells (Fig 5G). Taken together, these data indicated that inhibitors targeted ICAM3 mediated signaling pathways suppressed cancer cell stemness in vitro and in vivo.
3.7 The feedback loop of ICAM3 promotes the transcriptional activity of p50 via Src-PI3K-AKT pathway in vitro and in vivo
In order to explore whether the tumor inflammatory niche triggers or feedbacks to ICAM3 expression, we used the inflammatory mediator LPS or cytokine IL-1 and treated MDA-MB-231 cancer cells for 0, 0.5, 1, 2, 6, or 24 hours. We found that both LPS and IL-1 enhance ICMA3 expression in a time-dependent manner (Fig 6A, Fig S6A). Since the entry of p50 into the nucleus plays a key role in determining NF-κB transcriptional activity, we investigated whether ICAM3 regulates p50 transcriptional activity via the Src-PI3K-AKT pathway using immunofluorescence staining of p50 in ICAM3-transfected MDA-MB-231 and A549 cancer cells. We found that ICAM3 overexpression facilitates p50 nuclear translocation (Fig 6B).
Figure 6. ICAM3 promoting the p50 transcriptional activity to make a positive feedback via Src-PI3K-AKT pathway in vitro and in vivo.
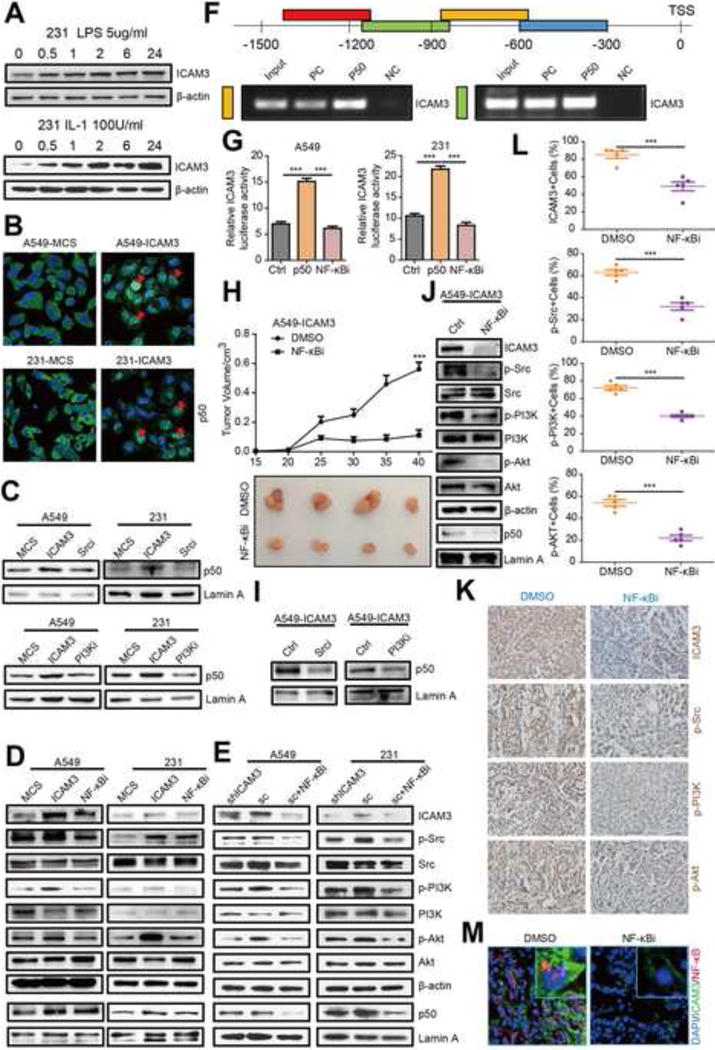
(A) Western blot analyzed the expression of ICAM3 in MDA-MB-231 cells after treated with 5ug/ml LPS or 100U/ml IL-1 for 0, 0.5, 1, 2, 6, 24 hours. (B) Immunofluorescence staining of p50 in MDA-MB-231 and A549 cells after ICAM3 overexpression, MCS as the control. (C) Western blot analyze p50 expression in nuclear in MDA-MB-231 and A549 cells expressed ICAM3 then treated with Src inhibitor or PI3K inhibitor. (D) Western blot analyze the expression of ICAM3, p-Src, p-PI3K, p-AKT and p50 in the nucleus in MDA-MB-231 and A549 cells expressed ICAM3 then treated with NF-κB inhibitor, the concentration of the NF-κB inhibitor (PDTC) was 10uM. (E) Western blot analysis of the endogenous expression of ICAM3, p-Src, p-PI3K, p-AKT and p50 in the nucleus of MDA-MB-231 and A549 shICAM3 cells, sc cells and sc cells treated with NF-κB inhibitor. (F) CHIP was performed to analyze the p50-binding sites on ICAM3 gene promoter. (G) Dual-luciferase assay was performed to detect ICAM3 promoter activity after p50 overexpression. The data was in the form of mean ± SEM, and statistical significance was indicated as *p<0.05; **p<0.01, *** p<0.001 by student t test. (H) Tumor growth curve of DMSO or NF-κBi and several tumors separated from each group were shown. (I-J) Western was performed to check ICAM3, p-Src, p-PI3K, p-AKT and p50 expression in different tumor tissues. (K) Representative images show IHC staining of ICAM3, p-Src, p-PI3K, p-AKT, p50 in paraffin-embedded tumor tissue sections. Scale bar, 10μm. (L) Data was presented as the mean±SEM, n=5. (M) Representative immunofluorescence photographs of double staining of ICAM3 and p50 in frozen tissue sections. Scale bar, 10μm.
To further explore whether ICAM3 regulates p50 transcriptional activity via the Src-PI3K-AKT pathway, we investigated the effect of the Src inhibitor (13an) and the PI3K inhibitor (LY294002) in ICAM3-transfected MDA-MB-231 and A549 cancer cells using Western blot. We found that ICAM3 overexpression increases nuclear p50 and that both inhibitors (13an and LY294002) decrease nuclear p50 (Fig 6C, Fig S6B).
In addition, to explore whether p50 possesses a feedback loop that regulates ICAM3 expression and Src-PI3K-AKT activation, we investigated the effect of the NF-κB inhibitor (PDTC) in ICAM3-transfected MDA-MB-231 and A549 cancer cells using Western blot. PDTC inhibits I-κB phosphorylation which prevents NF-κB nuclear translocation/activation [32, 33]. We found that PDTC reduces the activation of the Src-PI3K-AKT pathway in ICAM3-transfected MDA-MB-231 and A549 cancer cells (Fig 6D, Fig S6C). In order to further validate whether p50 possesses a feedback loop that regulates ICAM3 expression, we studied the effect of PDTC in MDA-MB-231 and A549 sc cells (sh-control like WT cells). Our results showed that PDTC decreases ICAM3 expression and Src signaling activation which indicates a p50 feedback loop in the regulation of the Src-PI3K-AKT pathway exists (Fig 6E).
We next investigated whether p50 regulates ICAM3 gene transcription using the CHIP assay. We verified that p50 binds to the ICAM3 gene promoter at approximately the 600-1200bp region upstream of the transcription start site (TSS) (Fig 6F).
In order to complement the CHIP assay, we co-transfected a ICAM3 promoter driven luciferase reporter construct and a p50 overexpressed vector in MDA-MB-231 and A549 cancer cells and used the luciferase assay. We found that p50 overexpression heightens ICAM3 promoter activity. However, when cells overexpression the p50 expression then treated with PDTC, the ICAM3 promoter transcription activity was reduced (Fig 6G).
We next studied the effects of the PDTC in ICAM3-transfected A549 cancer cells 15 days after implantation into NOD/SCID. We found that the PDTC reduces tumor growth versus the DMSO control group (Fig 6H). We also observed that the Src inhibitor (13an) and the PI3K inhibitor (LY294002) prevents p50 translocation into the nucleus in ICAM3-transfected A549 cancer cells using Western blot analysis (Fig 6I). Furthermore, the PDTC suppressed ICAM3 expression and Src-PI3K-AKT pathway activation in ICAM3-transfected A549 cancer cells using Western blot analysis (Fig 6J, Fig S6D). Similarly, the PDTC reduced the immunostaining of ICAM3, p-Src, p-PI3K, and p-AKT versus DMSO control in ICAM3-transfected A549 cancer cells using immunocytochemistry (Fig 6K, 6L). The PDTC also reduced the immunostaining of ICAM3 and NF-κB versus DMSO control in ICAM3-transfected A549 cancer cells using double immunofluorescence staining (Fig 6M). These findings collectively demonstrated that the regulation of ICAM3-Src-PI3K-AKT-p50 forms a feedback loop.
3.8 Inhibitors targeted ICAM3 mediated signaling pathways reduced chemo-resistance in vitro and in vivo
As chemo-resistance was one of the major obstacles in cancer therapy, also ICAM3 enhanced cancer cell chemo-resistance (Fig 2G). We investigated whether the inhibitors we used above contributed to chemotherapy. We chose A549 multi-drug-resistance (MDR) cells and western results showed that the expression of MDR, ICAM3, p-Src, p-PI3K, OCT4 in A549-MDR cells were increased compared with A549-WT cells (Fig 7A, Fig S6E). We next detected the effects of Src or PI3K inhibitors to DDP resistance in A549-MDR cells. FACS (PI-Annexin V) results showed that the inhibitors attenuates cisplatin resistance and induces apoptosis (Fig 7B). We also observed the inhibitors reduced ICAM3, MDR, OCT4 expression, increased cleaved caspase 3 expression (Fig 7C, Fig S6F).
Figure 7. Inhibitors targeted ICAM3 mediated signaling pathways reduced chemo-resistance in vitro and in vivo.
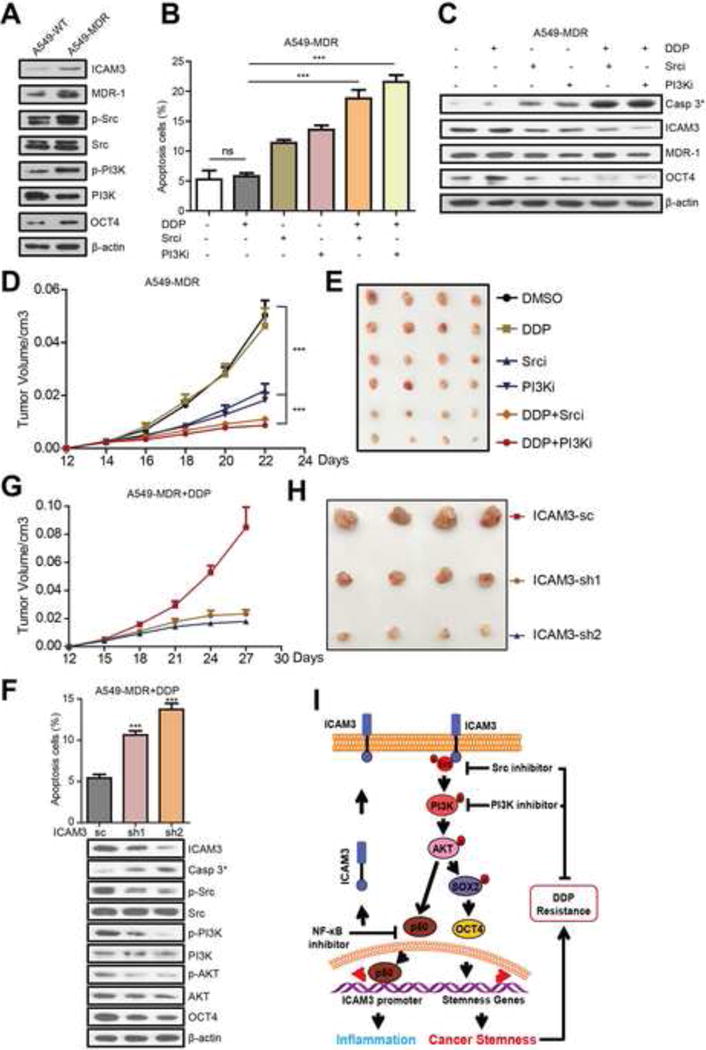
(A) Western blot analyzed the expression of ICAM3, MDR, p-Src, p-PI3K and OCT4 in A549-WT or MDR cells. (B) Statistical results of the percentage of apoptotic cells were shown, the concentration of the DDP was 20ug/ul. (C) The relative expression of cleaved caspase-3, ICAM3, MDR and OCT4 was shown. (D) Tumor growth curve of different groups and several tumors separated from each group were shown. (E) Representative images show IHC staining of ICAM3, MDR, p-Src, p-PI3K, OCT4 in paraffin-embedded tumor tissue sections. Scale bar, 10μm. (F) Data was presented as the mean±SEM, n=5. (G) Statistical results of the percentage of apoptotic cells were shown (up), the relative expression of cleaved caspase-3 and ICAM3 related signal proteins was shown (down). (H) Tumor growth curve of different groups (A549-MDR-sc, sh1, sh2) and several tumors separated from each group were shown. (I) The schematic model of ICAM3 in mediating cancer stemness and inflammation.
We next studied the effects of Src or PI3K inhibitors in A549-MDR cancer cells 12 days after implantation into NOD/SCID mice followed by DDP treatment. We found that DDP did not affect tumor volume versus the DMSO control. However, the Src or PI3K inhibitor only groups demonstrated a decreased tumor volume. Most importantly, the Src or PI3K inhibitor plus DDP groups demonstrated a decreased tumor volume versus the DDP or inhibitors only controls (Fig 7D, 7E).
To further identify the role of ICAM3 in chemo-resistance of A549-MDR to DDP, we established A549-MDR-shICAM3 cells and treated with DDP. We found that ICAM3 deficiency reduced chemo-resistance of A549-MDR to DDP (Fig 7F, up) as well as increased the expression of cleaved caspase 3, decreased the expression of p-Src, p-PI3K, p-AKT and OCT4 (Fig 7F, down, Fig S6G). Moreover, the in vivo results showed that ICAM3 deficiency reduced chemo-resistance of A549-MDR to DDP finally induced smaller tumors developed (Fig 7G, 7H). These findings collectively indicated that inhibitors targeted ICAM3 mediated signaling pathways reduced chemo-resistance in vitro and in vivo.
3.9 Proposed model of ICAM3 in mediating inflammation and cancer stemness
When ICAM3 is over-expressed in cancer cells, ICAM3 binds and phosphorylates Src which then activates the PI3k-AKT-p50 pathway. Meanwhile, p50 feedbacks to maintain elevated ICAM3 expression levels which strongly suggests that ICMA3 mediates the cancer cell stemness especially enhancing chemo-resistance. Inhibitors targeted ICAM3 mediated signaling pathways suppressed cancer stemness as well as reduced chemo-resistance (Fig 7I).
4. Discussion
We described a medium-throughput siRNA screening and identified 72 candidate genes that reproducibly decrease the expression of stemness factor OCT4. Among these 72 candidate genes, genes that control cancer cell stemness (including NF-κB1 [34], IL-1β [35], and CCR7 [36, 37]) and that scored significantly in the screen were selected, thereby demonstrating the effectiveness of the screen. However, genes that control pluripotency (including IL-6, and STAT3 [38]) did not score significantly in the screen possibly reflecting insufficient knockdown, redundancy, or that their role in CSC identity did not involve OCT4 expression.
In addition, 10 of the 72 candidate genes showed a close association with cancer cell stemness using ALDH staining. In particular, ICAM3 showed a strong linkage to the development of cancers. Although previous studies from other labs have illustrated the basic function of ICAM3, little is known about their role in CSC identity. We found that ICAM3 expression levels correlate with the pathological grade of the human tumors which implies that these genes may be utilized for tumor diagnosis or as a therapy target.
We verified that ICAM3 facilitates various CSCs properties. However, in order to elucidate the mechanism by which ICAM3 facilitates various CSCs properties, the role of the PI3K pathway was specifically explored due to our previous bio-informatic analysis and previous reports. Our studies demonstrate that ICAM3 promotes PI3K-AKT activation to mediate cancer stemness, both potentially to mediate inflammation.
We also demonstrated that ICAM3 binds Src at its YLPL motif followed by Src phosphorylation which then activates downstream factors in the PI3K/AKT pathway. In this process, the tyrosine (Y) and the YLPL motif are both indispensable for Src binding and downstream signal activation. This particular motif is absent in the intracellular domain of other ICAMs which suggests a unique relationship between ICAM3 and Src.
NF-κB is a classic transcription factor that affects the expression of numerous target genes. Our studies conclusively show that ICAM3 facilitates NF-κB trans-nuclear location and activation. Interestingly, NF-κB targets the promoter region then promotes expression of the ICAM3 gene. This suggests that ICAM3 mediates a positive inflammation feedback loop to promote cancer stemness. More importantly, this provides proof for ‘inflammation promoting cancer stemness’.
Chemo-resistance is one of typical properties of CSCs, also is the major obstacles for successful cancer treatment. Cisplatin (DDP) is often used for lung cancer chemotherapy and DDP resistance is the common problem in clinical treatment. We demonstrated that ICAM3 expression enhanced DDP resistance of cancer cells. The inhibitors (Src/PI3K inhibitors) targeted ICAM3 mediated signaling pathway decreased ICAM3 expression as well as reduced DDP resistance. These finds provide new insights for cancer chemotherapy.
In this work, we identified the inflammation-related gene ICAM3 regulates cancer cell stemness in vitro and in vivo. Interestingly, ICAM3 recruits and binds Src at the YLPL motif of its intracellular domain which then activates PI3K-Akt phosphorylation cascades. In this regard, we explained the relationship between ICAM3 and PI3K-Akt that influences cancer cell stemness and focused mainly on ICAM3 and Src activation. We report that activated p-AKT maintains cancer cell stemness by enhancing SOX2 and OCT4 activity. We suggest the mechanism involves p-AKT facilitation of NF-κB nuclear translocation and activation which increases ICAM3 expression by binding to the ICAM3 promoter region. We also verified that inhibitors (Src/PI3K inhibitors) targeted ICAM3 mediated signaling pathway decreased ICAM3 expression as well as reduced DDP resistance. These results provided a potential targets for cancer therapy.
Supplementary Material
Acknowledgments
We would like to thank our funding sources: the National Basic Research Program (973) of China (No. 2013CB967202) (Y. Luo), the National Natural Science Foundation of China (NSFC) (No. 81472654) (Y. Luo), (No.81502562) (C. Chen) and (No. 81273331) (R. Xiang), the International Science and Technology Cooperation Program of China (KY201501006) (R. Xiang) and the National Natural Science Foundation Oversea Collaboration fund (No. 31428013) (P. Sun).
Footnotes
Conflict of interest
The authors declare no conflict of interest.
Author’s contribution
SWZ, XJL and DRL designed the experiments, ZST and LXH did bio-informatics, HHW, JS, HN, CC and GCL analyzed the data, LYH and CYN prepared the materials for experiments, SPQ, YSY and LN provided methods or small inhibitors, XR and LYP prepared and repaired the manuscripts.
References
- 1.Adams GB, Scadden DT. A niche opportunity for stem cell therapeutics. Gene therapy. 2008;15:96–99. doi: 10.1038/sj.gt.3303063. [DOI] [PubMed] [Google Scholar]
- 2.Chen C, Cao F, Bai L, Liu Y, Xie J, Wang W, Si Q, Yang J, Chang A, Liu D, Liu D, Chuang TH, Xiang R, Luo Y. IKKbeta Enforces a LIN28B/TCF7L2 Positive Feedback Loop That Promotes Cancer Cell Stemness and Metastasis. Cancer research. 2015;75:1725–1735. doi: 10.1158/0008-5472.CAN-14-2111. [DOI] [PubMed] [Google Scholar]
- 3.Jones DL, Wagers AJ. No place like home: anatomy and function of the stem cell niche. Nature reviews Molecular cell biology. 2008;9:11–21. doi: 10.1038/nrm2319. [DOI] [PubMed] [Google Scholar]
- 4.Prewitz MC, Seib FP, von Bonin M, Friedrichs J, Stissel A, Niehage C, Muller K, Anastassiadis K, Waskow C, Hoflack B, Bornhauser M, Werner C. Tightly anchored tissue-mimetic matrices as instructive stem cell microenvironments. Nature methods. 2013;10:788–794. doi: 10.1038/nmeth.2523. [DOI] [PubMed] [Google Scholar]
- 5.Visvader JE, Lindeman GJ. Cancer stem cells: current status and evolving complexities. Cell stem cell. 2012;10:717–728. doi: 10.1016/j.stem.2012.05.007. [DOI] [PubMed] [Google Scholar]
- 6.van der Zee M, Sacchetti A, Cansoy M, Joosten R, Teeuwssen M, Heijmans-Antonissen C, Ewing-Graham PC, Burger CW, Blok LJ, Fodde R. IL6/JAK1/STAT3 Signaling Blockade in Endometrial Cancer Affects the ALDHhi/CD126+ Stem-like Component and Reduces Tumor Burden. Cancer research. 2015;75:3608–3622. doi: 10.1158/0008-5472.CAN-14-2498. [DOI] [PubMed] [Google Scholar]
- 7.Yang J, Liao D, Chen C, Liu Y, Chuang TH, Xiang R, Markowitz D, Reisfeld RA, Luo Y. Tumor-associated macrophages regulate murine breast cancer stem cells through a novel paracrine EGFR/Stat3/Sox-2 signaling pathway. Stem Cells. 2013;31:248–258. doi: 10.1002/stem.1281. [DOI] [PubMed] [Google Scholar]
- 8.Xiao X, Mruk DD, Cheng CY. Intercellular adhesion molecules (ICAMs) and spermatogenesis. Human reproduction update. 2013;19:167–186. doi: 10.1093/humupd/dms049. [DOI] [PMC free article] [PubMed] [Google Scholar]
- 9.de Fougerolles AR, Klickstein LB, Springer TA. Cloning and expression of intercellular adhesion molecule 3 reveals strong homology to other immunoglobulin family counter-receptors for lymphocyte function-associated antigen 1. The Journal of experimental medicine. 1993;177:1187–1192. doi: 10.1084/jem.177.4.1187. [DOI] [PMC free article] [PubMed] [Google Scholar]
- 10.Estecha A, Aguilera-Montilla N, Sanchez-Mateos P, Puig-Kroger A. RUNX3 regulates intercellular adhesion molecule 3 (ICAM-3) expression during macrophage differentiation and monocyte extravasation. PloS one. 2012;7:e33313. doi: 10.1371/journal.pone.0033313. [DOI] [PMC free article] [PubMed] [Google Scholar]
- 11.Greenwood J, Amos CL, Walters CE, Couraud PO, Lyck R, Engelhardt B, Adamson P. Intracellular domain of brain endothelial intercellular adhesion molecule-1 is essential for T lymphocyte-mediated signaling and migration. Journal of immunology (Baltimore, Md : 1950) 2003;171:2099–2108. doi: 10.4049/jimmunol.171.4.2099. [DOI] [PMC free article] [PubMed] [Google Scholar]
- 12.Skubitz KM, Ahmed K, Campbell KD, Skubitz AP. CD50 (ICAM-3) is phosphorylated on tyrosine and is associated with tyrosine kinase activity in human neutrophils. Journal of immunology (Baltimore, Md : 1950) 1995;154:2888–2895. [PubMed] [Google Scholar]
- 13.Guo P, Huang J, Wang L, Jia D, Yang J, Dillon DA, Zurakowski D, Mao H, Moses MA, Auguste DT. ICAM-1 as a molecular target for triple negative breast cancer. Proc Natl Acad Sci U S A. 2014;111:14710–14715. doi: 10.1073/pnas.1408556111. [DOI] [PMC free article] [PubMed] [Google Scholar]
- 14.Tsai ST, Wang PJ, Liou NJ, Lin PS, Chen CH, Chang WC. ICAM1 Is a Potential Cancer Stem Cell Marker of Esophageal Squamous Cell Carcinoma. PloS one. 2015;10:e0142834. doi: 10.1371/journal.pone.0142834. [DOI] [PMC free article] [PubMed] [Google Scholar]
- 15.Yu HS, Lin TH, Tang CH. Involvement of intercellular adhesion molecule-1 up-regulation in bradykinin promotes cell motility in human prostate cancers. International journal of molecular sciences. 2013;14:13329–13345. doi: 10.3390/ijms140713329. [DOI] [PMC free article] [PubMed] [Google Scholar]
- 16.Zhu PP, Yuan SG, Liao Y, Qin LL, Liao WJ. High level of intercellular adhesion molecule-1 affects prognosis of patients with hepatocellular carcinoma. World journal of gastroenterology. 2015;21:7254–7263. doi: 10.3748/wjg.v21.i23.7254. [DOI] [PMC free article] [PubMed] [Google Scholar]
- 17.Montoya MC, Sancho D, Bonello G, Collette Y, Langlet C, He HT, Aparicio P, Alcover A, Olive D, Sanchez-Madrid F. Role of ICAM-3 in the initial interaction of T lymphocytes and APCs. Nature immunology. 2002;3:159–168. doi: 10.1038/ni753. [DOI] [PubMed] [Google Scholar]
- 18.Ahn KC, Choi JY, Kim JS, Hwang SG, Kim WJ, Park JK, Um HD. ICAM-3 endows anticancer drug resistance against microtubule-damaging agents via activation of the ICAM-3-AKT/ERK-CREB-2 pathway and blockage of apoptosis. Biochemical and biophysical research communications. 2013;441:507–513. doi: 10.1016/j.bbrc.2013.10.096. [DOI] [PubMed] [Google Scholar]
- 19.Park JK, Park SH, So K, Bae IH, Yoo YD, Um HD. ICAM-3 enhances the migratory and invasive potential of human non-small cell lung cancer cells by inducing MMP-2 and MMP-9 via Akt and CREB. Int J Oncol. 2010;36:181–192. [PubMed] [Google Scholar]
- 20.Zhang X, Ling MT, Wang Q, Lau CK, Leung SC, Lee TK, Cheung AL, Wong YC, Wang X. Identification of a novel inhibitor of differentiation-1 (ID-1) binding partner, caveolin-1, and its role in epithelial-mesenchymal transition and resistance to apoptosis in prostate cancer cells. The Journal of biological chemistry. 2007;282:33284–33294. doi: 10.1074/jbc.M705089200. [DOI] [PubMed] [Google Scholar]
- 21.Chia NY, Chan YS, Feng B, Lu X, Orlov YL, Moreau D, Kumar P, Yang L, Jiang J, Lau MS, Huss M, Soh BS, Kraus P, Li P, Lufkin T, Lim B, Clarke ND, Bard F, Ng HH. A genome-wide RNAi screen reveals determinants of human embryonic stem cell identity. Nature. 2010;468:316–320. doi: 10.1038/nature09531. [DOI] [PubMed] [Google Scholar]
- 22.da Huang W, Sherman BT, Lempicki RA. Bioinformatics enrichment tools: paths toward the comprehensive functional analysis of large gene lists. Nucleic acids research. 2009;37:1–13. doi: 10.1093/nar/gkn923. [DOI] [PMC free article] [PubMed] [Google Scholar]
- 23.Zhao S, Fang S, Liu Y, Li X, Liao S, Chen J, Liu J, Zhao L, Li H, Zhou W, Shen W, Dong X, Xiang R, Wang L, Zhao Y. The long non-coding RNA NONHSAG026900 predicts prognosis as a favorable biomarker in patients with diffuse large B-cell lymphoma. Oncotarget. 2017;8:34374–34386. doi: 10.18632/oncotarget.16163. [DOI] [PMC free article] [PubMed] [Google Scholar]
- 24.Zhang CH, Chen K, Jiao Y, Li LL, Li YP, Zhang RJ, Zheng MW, Zhong L, Huang SZ, Song CL, Lin WT, Yang J, Xiang R, Peng B, Han JH, Lu GW, Wei YQ, Yang SY. From Lead to Drug Candidate: Optimization of 3-(Phenylethynyl)-1H-pyrazolo[3,4-d]pyrimidin-4-amine Derivatives as Agents for the Treatment of Triple Negative Breast Cancer. Journal of medicinal chemistry. 2016;59:9788–9805. doi: 10.1021/acs.jmedchem.6b00943. [DOI] [PubMed] [Google Scholar]
- 25.Shen W, Chang A, Wang J, Zhou W, Gao R, Li J, Xu Y, Luo X, Xiang R, Luo N, Stupack DG. TIFA, an inflammatory signaling adaptor, is tumor suppressive for liver cancer. Oncogenesis. 2015;4:e173. doi: 10.1038/oncsis.2015.30. [DOI] [PMC free article] [PubMed] [Google Scholar]
- 26.Shen W, Du R, Li J, Luo X, Zhao S, Chang A, Zhou W, Gao R, Luo D, Wang J, Hao N, Liu Y, Chen Y, Luo Y, Sun P, Yang S, Luo N, Xiang R. TIFA suppresses hepatocellular carcinoma progression via MALT1-dependent and -independent signaling pathways. Signal Transduction and Targeted Therapy. 2016;1:16013. doi: 10.1038/sigtrans.2016.13. [DOI] [PMC free article] [PubMed] [Google Scholar]
- 27.Azmi AS, Bollig-Fischer A, Bao B, Park BJ, Lee SH, Yong-Song G, Dyson G, Reddy CK, Sarkar FH, Mohammad RM. Systems analysis reveals a transcriptional reversal of the mesenchymal phenotype induced by SNAIL-inhibitor GN-25. BMC systems biology. 2013;7:85. doi: 10.1186/1752-0509-7-85. [DOI] [PMC free article] [PubMed] [Google Scholar]
- 28.Battula VL, Evans KW, Hollier BG, Shi Y, Marini FC, Ayyanan A, Wang RY, Brisken C, Guerra R, Andreeff M, Mani SA. Epithelial-mesenchymal transition-derived cells exhibit multilineage differentiation potential similar to mesenchymal stem cells. Stem Cells. 2010;28:1435–1445. doi: 10.1002/stem.467. [DOI] [PMC free article] [PubMed] [Google Scholar]
- 29.Mani SA, Guo W, Liao MJ, Eaton EN, Ayyanan A, Zhou AY, Brooks M, Reinhard F, Zhang CC, Shipitsin M, Campbell LL, Polyak K, Brisken C, Yang J, Weinberg RA. The epithelial-mesenchymal transition generates cells with properties of stem cells. Cell. 2008;133:704–715. doi: 10.1016/j.cell.2008.03.027. [DOI] [PMC free article] [PubMed] [Google Scholar]
- 30.Taube JH, Herschkowitz JI, Komurov K, Zhou AY, Gupta S, Yang J, Hartwell K, Onder TT, Gupta PB, Evans KW, Hollier BG, Ram PT, Lander ES, Rosen JM, Weinberg RA, Mani SA. Core epithelial-to-mesenchymal transition interactome gene-expression signature is associated with claudin-low and metaplastic breast cancer subtypes. Proc Natl Acad Sci U S A. 2010;107:15449–15454. doi: 10.1073/pnas.1004900107. [DOI] [PMC free article] [PubMed] [Google Scholar]
- 31.Serrador JM, Vicente-Manzanares M, Calvo J, Barreiro O, Montoya MC, Schwartz-Albiez R, Furthmayr H, Lozano F, Sanchez-Madrid F. A novel serine-rich motif in the intercellular adhesion molecule 3 is critical for its ezrin/radixin/moesin-directed subcellular targeting. The Journal of biological chemistry. 2002;277:10400–10409. doi: 10.1074/jbc.M110694200. [DOI] [PubMed] [Google Scholar]
- 32.Kotian S, Zhang L, Boufraqech M, Gaskins K, Gara SK, Quezado M, Nilubol N, Kebebew E. Dual Inhibition of HDAC and Tyrosine Kinase Signaling Pathways with CUDC-907 Inhibits Thyroid Cancer Growth and Metastases. Clinical cancer research : an official journal of the American Association for Cancer Research. 2017;23:5044–5054. doi: 10.1158/1078-0432.CCR-17-1043. [DOI] [PMC free article] [PubMed] [Google Scholar]
- 33.He C, Wang L, Zhang J, Xu H. Hypoxia-inducible microRNA-224 promotes the cell growth, migration and invasion by directly targeting RASSF8 in gastric cancer. Molecular cancer. 2017;16:35. doi: 10.1186/s12943-017-0603-1. [DOI] [PMC free article] [PubMed] [Google Scholar]
- 34.Karin M, Greten FR. NF-kappaB: linking inflammation and immunity to cancer development and progression. Nature reviews Immunology. 2005;5:749–759. doi: 10.1038/nri1703. [DOI] [PubMed] [Google Scholar]
- 35.Li Y, Wang L, Pappan L, Galliher-Beckley A, Shi J. IL-1beta promotes stemness and invasiveness of colon cancer cells through Zeb1 activation. Molecular cancer. 2012;11:87. doi: 10.1186/1476-4598-11-87. [DOI] [PMC free article] [PubMed] [Google Scholar]
- 36.Leventhal DS, Gilmore DC, Berger JM, Nishi S, Lee V, Malchow S, Kline DE, Kline J, Vander Griend DJ, Huang H, Socci ND, Savage PA. Dendritic Cells Coordinate the Development and Homeostasis of Organ-Specific Regulatory T Cells. Immunity. 2016;44:847–859. doi: 10.1016/j.immuni.2016.01.025. [DOI] [PMC free article] [PubMed] [Google Scholar]
- 37.Pang MF, Georgoudaki AM, Lambut L, Johansson J, Tabor V, Hagikura K, Jin Y, Jansson M, Alexander JS, Nelson CM, Jakobsson L, Betsholtz C, Sund M. TGF-beta1-induced EMT promotes targeted migration of breast cancer cells through the lymphatic system by the activation of CCR7/CCL21-mediated chemotaxis. 2016;35:748–760. doi: 10.1038/onc.2015.133. [DOI] [PMC free article] [PubMed] [Google Scholar]
- 38.Fouse SD, Costello JF. Cancer Stem Cells Activate STAT3 the EZ Way. Cancer cell. 2013;23:711–713. doi: 10.1016/j.ccr.2013.05.016. [DOI] [PMC free article] [PubMed] [Google Scholar]
- 39.Kim YG, Kim MJ, Lim JS, Lee MS, Kim JS, Yoo YD. ICAM-3-induced cancer cell proliferation through the PI3K/Akt pathway. Cancer letters. 2006;239:103–110. doi: 10.1016/j.canlet.2005.07.023. [DOI] [PubMed] [Google Scholar]
Associated Data
This section collects any data citations, data availability statements, or supplementary materials included in this article.