

Abstract
Polymerization of intracellular sickle hemoglobin induced by low oxygen tension has been recognized as a primary determinant of the pathophysiologic manifestations in sickle cell disease. Existing flow cytometry techniques for detection of sickle cells are typically based on fluorescence markers or cellular morphological analysis. Using microfluidics and electrical impedance spectroscopy, we develop a new, label-free flow cytometry for non-invasive measurement of single cells under controlled oxygen level. We demonstrate the capability of this new technique by determining the electrical impedance differential of normal red blood cells obtained from a healthy donor and sickle cells obtained from three sickle cell patients, under normoxic and hypoxic conditions and at three different electrical frequencies, 156 kHz, 500 kHz and 3 MHz. Under normoxia, normal cells and sickle cells can be separated completely using electrical impedance at 156 kHz and 500 kHz but not at 3 MHz. Sickle cells, intra-patient and inter-patient show significantly different electrical impedance between normoxia and hypoxia at all three frequencies. This study shows a proof of concept that electrical impedance signal can be used as an indicator of the disease state of a red blood cell as well as the cell sickling events in sickle cell disease. Electrical impedance-based microflow cytometry with oxygen control is a new method that can be potentially used for sickle cell disease diagnosis and monitoring.
Keywords: Electrical impedance, Microfluidics, Flow cytometry, Label-free, Oxygen control, Sickle cell disease
1. Introduction
Sickle cell disease (SCD) is a common inherited blood cell disorder that affects hemoglobin. A mutation in the β-globin gene changes the hydrophilic glutamic acid to a strongly hydrophobic valine amino acid, resulting in abnormal hemoglobin S (HbS) [1]. At low oxygen tension, HbS polymerizes and forms rigid fibers, giving rise to rigid red blood cells with distorted cell membranes, known as cell sickling [2,3]. These rigid sickled cells adversely affect blood circulation and oxygen transport efficiency [4,5], and have been associated with severity of anemia and vasoocclusive manifestations in various sickling syndromes [6], such as pain and tissue damage [7]. The standard diagnosis of SCD is based on hemoglobin analysis, which typically requires a hemolysate using a Hb analyzer [8], such as electrophoresis, ion-exchange high performance liquid chromatography, or enzymatic assays. These techniques can only provide mean values for laboratory parameters, e.g. mean concentrations/percentages of Hb variants, mean corpuscular Hb concentration. Thus, it necessarily averages out the behavior of millions of RBCs.
The state-of-the-art research engaged in searching for a better means to monitor SCD has been focused on a variety of hematological and rheological abnormalities associated with cell sickling, ranging from sub-cellular level to the whole blood level. Presence of fetal hemoglobin (HbF) in sickle cells can dilute the HbS concentration, then help delay the rate of HbS polymerization. Higher level of HbF has been associated with reduced clinical complications, such as leg ulcers and frequency in acute chest syndromes [9]. Techniques such as photon upconverting nanoparticles [10] have been reported for detecting point mutation of the gene associated with SCD. Using engineering methods such as micro-pipette aspiration [11], optical tweezers [12], atomic force microscopy [13], diffraction phase microscopy [14,15], and microfluidics [16], abnormal biomechanical characteristics have been identified as potential markers of SCD, such as cell membrane properties, rheology of single cells, whole blood, and cell–cell adhesion etc. See reference [5] for a comprehensive review. Other identified biophysical markers of SCD include but are not limited to intracellular HbS polymers [17] and morphologic characteristics of sickled cells [18]. However, these measurements typically rely on direct microscopic observations or video processing and cannot be readily applied to portable measurements.
Electrical impedance spectroscopy has been utilized in combination with microfluidics as an emerging label-free technology with good efficiency and sensitivity [19,20] to differentiate cell populations [21–24], single droplets [25], and diseased blood cells [26,27] as well as to monitor cellular pathological conditions [28]. This method is based on cellular dielectric properties [19], size and composition [26,29,30] and does not require any biochemical and fluorescence markers. During the process of hypoxia-induced cell sickling, the phase of HbS molecules changes from soluble state to rigid fibers. We hypothesize that such HbS phase change, occurring inside sickle cells and the associated cellular properties results in a variation in the electrical properties of whole-cells and can be detected using electrical impedance signal. In this paper, we develop a new electrical impedance-based microflow cytometer with oxygen control. We explore the capability of this new technique to discriminate sickle cells from normal cells under normoxia, as well as to monitor the hypoxia-induced cell sickling events using the relative shift in collective electrical impedance data.
2. Materials and methods
2.1. Microfluidic chip
The microfluidic device (Fig. 1) consists of a triple Ti/Au electrode set for electrical impedance measurement and a double-layer microfluidic channel for microflow with oxygen control, adapted from our previous design for the study of sickle cell morphology and rheology [31]. The Ti/Au electrode (Fig. 1b) is 10 nm/100 nm thick, 20 μm wide and 20 μm gap, deposited on a glass substrate (700 μm thick) using E-beam vaporization and standard microfabrication techniques. The double-layer microfluidic channel consists of a 100 μm deep serpentine gas channel and a 5 μm deep straight cell channel, which are separated by a 150 μm thick PDMS film (Fig. 1c). Both channels were casted using poly (dimethylsiloxane) PDMS with SU-8/silicon master fabricated using standard photolithography and followed with 2-h surface passivation using fluorinated silane vapor (Trichloro (1H,1H,2H,2H-perfluorooctyl) silane; Sigma Aldrich, MO). Air plasma was used to generate a permanent bonding between the two channel layers as well as between the double-layer structure and the electrode chip. The cell channel was primed with phosphate-buffered saline (PBS) before loading cells for measurement.
Fig. 1.
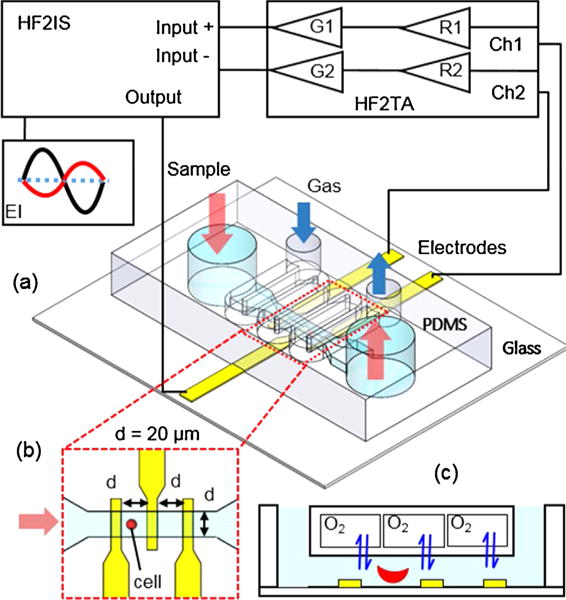
Schematic of the experimental setup for EI microflow cytometry with oxygen control.
2.2. Electric impedance microflow cytometry with oxygen control
Electrical impedance of single red blood cells (RBCs) under normoxia and hypoxia was measured using a commercial impedance spectroscope HF2IS (Zurich Instruments, AG, Switzerland) through a microfluidic device (Fig. 1a). A flow of cell suspension was generated by applying an exterior pressure difference between two water columns to the inlet and outlet chambers of the cell channel using a flexible Tygon microbore tubing (0.02-inch ID). This allows a reduced hydrodynamic disturbance for electrical impedance measurement in a steady flow condition. Normoxic environment in the cell channel was created by exposing the entire system to the atmosphere during experiment. Hypoxia in the cell channel was created by flowing a hypoxic gas mixture (5% CO2 balanced with N2) at 4.5 psi during the measurement. Fig. S1 shows representative images of RBCs captured in the developed microfluidic device at the broad section of the device with 60 × magnification (left panels) and the narrow section of the channel with 20 × magnification (right panels). Under normoxia, RBCs from normal blood samples exhibited biconcave disc shape; RBCs from sickle blood samples displayed a remarkable heterogeneity in cell shapes, such as disc shape, ellipsoid shape to crescent shape (classic sickle shape). Under hypoxia, RBCs from sickle blood samples exhibited marked visual variations in cell shapes and textures due to the polymerized sickle hemoglobin inside cell membrane. The loaded microfluidic device was mounted on an inverted microscope (Olympus IX-81, Olympus America, Inc., PA) for visualization. Microscopic video was recorded trough a details camera (The Imaging Source, Charlotte, NC) to verify the detected electrical impedance signals.
Measurement of electrical impedance was conducted at room temperature. Voltages of 1 Vpp at three frequencies, 156 kHz, 500 kHz, and 3 MHz were applied to the central microelectrode simultaneously. The resulting currents at these frequencies were measured through the two outer electrodes and converted into voltages by a current amplifier HF2TA (Zurich Instruments, AG, Switzerland) and then demodulated with a lock-in amplifier integrated in the HF2IS. Electrical impedance value of the microfluidic channel was recorded with a fixed sampling rate 112 sa/s for post-processing. Selection of the electrical frequencies of interest was based on the frequency sweeps (100 kHz to 50 MHz) of normal and sickle RBC suspensions (Fig. S2), using a microfluidic chamber embedded with interdigitated electrodes [32]. An arbitrary parameter was developed to assess the relative difference between normal and sickle RBC suspensions under normoxia, as well as between normoxia sickle RBC suspension and hypoxia sickle RBC suspension. In the former comparison, both magnitude and phase angle values were scaled using the values of normal RBC suspension measured at 100 kHz, marked as , , , and , respectively; the arbitrary parameter was defined as . In the latter comparison, both magnitude and phase angle values were scaled using normoxia values of sickle RBC suspension at 100 kHz, marked as , , , and , respectively; the arbitrary parameter was then defined as . The frequency of 156 kHz was selected, where normal RBCs deviate most from sickle RBCs while hypoxia sickle RBCs deviate least from normoxia sickle RBCs. The intermediate frequency, 500 kHz was selected for maximum differences between sickle RBCs and normal RBCs as well as between hypoxia and normoxia sickle RBCs. Furthermore, the frequency of 3 MHz was selected as it suggests a moderate difference for both comparisons.
2.3. RBC sample preparation
De-identified blood samples from three patients ages 17–18 years (2 males and 1 female) affected by SCD (2 participants have SS and 1 participant has Sβ+ thalassemia) were obtained for this study, following institutional review board (IRB) approvals from Florida Atlantic University and University of Miami and required consent process (and assent as appropriate for minors). Participants were at baseline, pain-free and were not hypoxic when blood samples were obtained. Because samples were de-identified the laboratory personnel were blinded regarding the patient genotype. A de-identified normal blood sample obtained from a local blood bank was tested as control. Blood samples were washed twice by centrifugation at 2000 rpm for 2 min at room temperature using PBS buffer. RBC pellet of 6 μL was aspirated from the bottom of the Eppendorf tube and diluted in 1000 μL PBS buffer on the same day of the electrical impedance measurement. All blood samples were tested within 1 week after extraction.
2.4. Data analysis
The recorded electrical signals were analyzed using a custom MATLAB script (MathWorks, Inc., Natick, MA). Complex electrical impedance, was determined from the ratio of the excitation signals over the measured currents, using Ohm’s law,
| (1) |
where with U = 1V in the present study, with the real and imaginary components, X and Y recorded by the impedance spectroscope. The corresponding magnitude, |Z| and phase, θ are derived as,
| (2) |
| (3) |
Passage of RBCs over the microelectrodes caused peaks in the corresponding impedance signals of |Z| and θ. The triple microelectrode set provided a dual measurement of each traversal RBCs through the narrowest portion of the channel. Fig. 2 shows the electrical impedance signals of two representative sickle RBCs traversing through the microfluidic channel under normoxia and hypoxia, respectively.
Fig. 2.
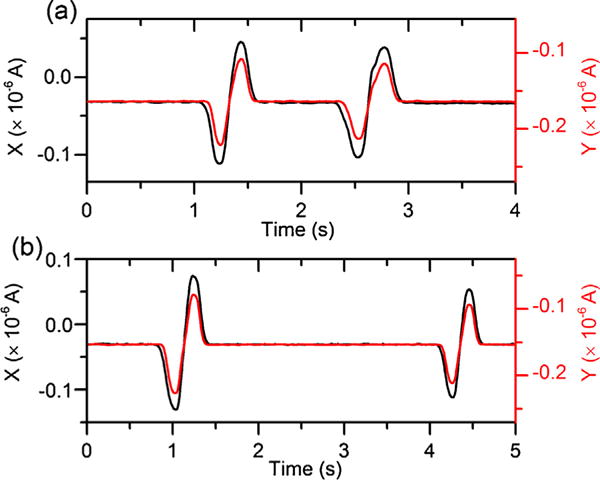
Electrical impedance signals of two representative sickle RBCs traversing through the microchannel under (a) normoxia and (b) hypoxia.
Subsequently, electrical impedance differential was defined as the maximum height of the peaks in magnitude, Δ|Z| and in phase, Δθ, caused by cell passage through the detection zone. Microscopic video was recorded to verify the traversed cells. All the peaks of traversal ghost cells and overlapped cells were excluded. Electrical impedance differential values were averaged from the dual measurement for each individual RBCs. In this study, sickle RBCs under both normoxia and hypoxia were analyzed to test our hypothesis that hypoxia-induced intracellular HbS polymerization can lead to changes in cellular electrical impedance. Normal RBCs were analyzed under only normoxia as it is known that HbA does not polymerize as HbS in response to hypoxia.
Cellular morphology analysis of cell sickling events in sickle RBCs was carried out using ImageJ [33]. We quantified cell sickling events using two parameters: (a) fraction of sickled cells, defined as the fraction of all sickle RBCs in a sample that display features of morphological change; (b) cellular area reduction, defined as the percentage of reduction in the projected area of cells by tracking individual sickle RBCs before and after hypoxia-induced cell sickling.
Statistical analyzes were performed using OriginPro (Northampton, MA). Student’s t-test was used. Significance was set as p < 0.05, or specified otherwise. “n” represents the count of cells. Results are expressed as mean ± standard deviation, or scatter plots (horizontal line, mean value if not specified otherwise) and box plots (interquartile range, horizontal line, median).
3. Results and discussion
3.1. Electrical impedance differential of sickle RBCs and normal RBCs under normoxia
As previously stated 2 participants have SS. Either sample sickle-2 or sickle-3 has Sβ+ with HbA < 20%. Under normoxia, normal and sickle RBCs were significantly different in both Δ|Z| and Δθ values at all three electrical frequencies, 156 kHz, 500 kHz, and 3 MHz. All RBCs were randomly selected for analysis, including 109 normal RBCs from the normal sample and 223 sickle RBCs from the 3 sickle samples. Scatter plot of Δ|Z| versus Δθ of normal RBCs (n = 109) and sickle RBCs (n = 223) under normoxia are shown in Fig. 3.
Fig. 3.
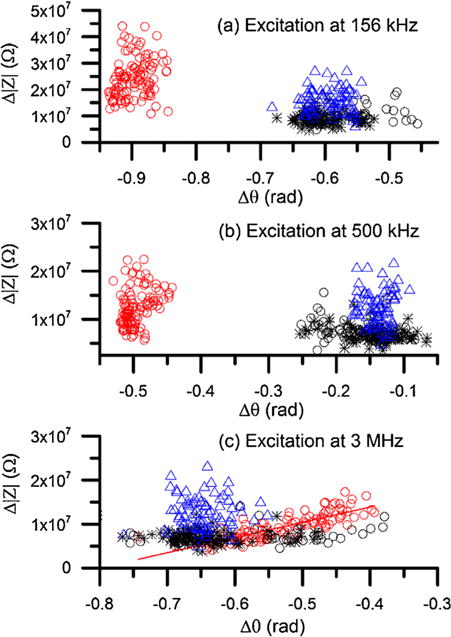
Scatter plot of Δ|Z| versus Δθ of normal RBCs and sickle RBCs under normoxia at (a) 156 kHz, (b) 500 kHz, and (c) 3 MHz. Red open circles represent normal RBCs (n = 109), black open circles represent sickle RBCs in sample sickle-1 (n = 42), black stars represent sickle RBCs in sample sickle-2 (n = 76), and blue triangles represent sickle RBCs in sample sickle-3 (n = 108). The solid curve in (c) represents linear fitting between Δ|Z| and Δθ for normal RBCs (R2 = 0.7). (For interpretation of the references to colour in this figure legend, the reader is referred to the web version of this article.)
At the relatively lower frequency (156 kHz), the measured Δ|Z| values of normal RBCs were 2.4 × 10⁷ ± 0.75 × 10⁷ Ω that is significantly higher than sickle RBCs 1.1 × 10⁷ ± 0.45 × 10⁷ Ω. The corresponding values of Δθ were −0.90 ± 0.02 rad and −0.59 ± 0.31 rad for normal RBCs and sickle RBCs, respectively. At this frequency, normal RBCs and sickle RBCs can be completely separated while sickle RBCs from the 3 different patients overlap notably. This is very interesting because one of the samples belonged to a subject with Hb S-thalassemia+ with Hb A < 20% and there was no obvious difference with the other samples corresponding to subjects with Hb SS. At the intermediate frequency (500 kHz), similar trends were found between normal RBCs and sickle RBCs. The values in Δ|Z| were 1.2 × 10⁷ ± 0.38 × 10⁷ Ω that is significantly higher than sickle RBCs 0.89 × 10⁷ ± 0.36 × 10⁷ Ω. The corresponding values of Δθ were −0.50 ± 0.02 rad and −0.15 ± 0.04 rad for normal RBCs and sickle RBCs, respectively. At higher electrical frequency, 3 MHz, normal RBCs and sickle RBCs did not show notable separation. Interestingly, they showed distinct patterns in the scatter plot. For normal RBCs, a strong linear correlation (R2 = 0.7) was found between Δ|Z| and Δθ, in agreement with our previous measurement [31]. In contrast, no similar trend was observed in sickle RBCs; instead, they scatter toward higher Δ|Z| values. The values of Δ|Z| for normal RBCs were 0.93 × 10⁷ ± 0.30 × 10⁷ Ω that is significantly lower than sickle RBCs, 1.1 × 10⁷ ± 0.45 × 10⁷ Ω (p < 0.001); while the values of Δθ of normal RBCs were −0.53 ± 0.07 rad, which is significantly higher than sickle RBCs, −0.59 ± 0.38 rad (p < 0.001).
The results of single cell impedance (Fig. 3) are consistent with the impedance of cell suspensions (Fig. S2a), in that the difference between normal RBCs and sickle RBCs is relatively greater at 156 kHz and 500 kHz than 3 MHz. These results suggest that electrical impedance differential can serve as a new biomarker of SCD that does not require advanced image processing as in image-based flow cytometry [34] or biochemical, fluorescence labelling in fluorescence-activated cell sorting (FACS) systems. This technique provides a new capability for rapid, label-free, non-invasive counting of sickle RBCs from normal RBCs under normoxia using electrical impedance differential at low and intermediate frequencies.
3.2. Electrical impedance differential of hypoxia-induced cell sickling
To link hypoxia-induced cell sickling and the electrical impedance differential of sickle RBCs, we analyzed the cell sickling events by recourse to morphology analysis of sickle RBCs in response to hypoxia, as discussed in our previous work [31]. Low oxygen tension induces polymerization of intracellular HbS. Thus, cell membranes are distorted by the rigid hemoglobin fibers, known as cell sickling. Cell sickling was visually identified from the changes in cell morphology, such as distorted cell membranes with spiky edges and dark coarse texture (Fig. S1). Morphological analysis showed that sickled fraction was 92% ± 6% for all the 3 sickle samples in present study, indicating the variations in electrical impedance differential of sickle RBCs in response to hypoxia is primarily attributed to the hypoxia-induced cell sickling.
Fig. 4 shows the electrical impedance differentials of sickle RBCs randomly selected from the 3 sickle blood samples. Shifts in either Δ|Z| or Δθ or a combination of both parameters in response to deoxygenation can be recognized at all the excitation frequencies. At 156 kHz and 500 kHz, distribution of the hypoxia sickle RBCs shifted to lower ranges of Δ|Z| and Δθ (Fig. 4a and b). The values of Δ|Z| were 0.8 × 10⁷ ± 0.2 × 10⁷ Ω and 0.6 × 10⁷ ± 0.15 × 10⁷ Ω at 156 kHz and 500 kHz, respectively. Comparing to the values obtained under normoxia, Δ|Z| decreased significantly, about 26% and 31%, respectively. Regarding to the phase change, values of Δθ decreased to −0.62 ± 0.05 rad and −0.20 ± 0.03 rad at the two frequencies, about 4% and 30%, respectively, comparing to the normoxia values. At the higher frequency, 3 MHz, a marked shift in Δ|Z| distribution was observed (Fig. 4c). The mean value of Δ|Z| was 0.58 × 10⁷ ± 0.13 × 10⁷ Ω, about 47% lower than the normoxia value. However, distributions of Δθ values under both conditions were very close with no statistical significance. The mean value of Δθ was about −0.63 ± 0.09 rad, about 6% lower than the normoxia value. These single cell measurements are in agreement with the results of cell suspension for sickle RBCs (Fig. S2b), in that the intermediate frequency, 500 kHz provided greatest separation between the hypoxia and normoxia conditions than the other two frequencies. These results confirmed that electrical impedance differential can be used as a marker of hypoxia-induced cell sickling.
Fig. 4.
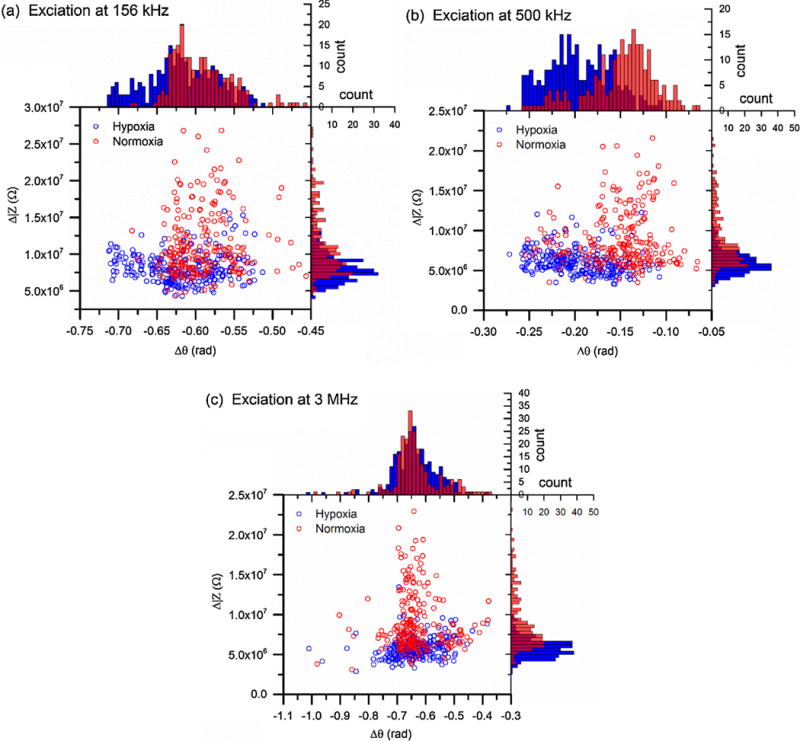
Scatter plots of Δ|Z| versus Δθ of sickle RBCs under normoxia (n = 226, red open circles) and hypoxia (n = 260, blue open circles) determined from electrical excitations at (a) 156 kHz, (b) 500 kHz, and (c) 3 MHz. Corresponding histograms show the distribution of each population, following the same color code as scatter plots. (For interpretation of the references to colour in this figure legend, the reader is referred to the web version of this article.)
3.3. Cell area reduction along with hypoxia-induced cell sickling
Two important factors may contribute to the shift in impedance differential, including the electrical properties of intracellular HbS and cell membrane, as explained by a simplified equivalent circuit model of single RBCs surrounded by a conductive medium (Fig. S3). In this circuit model, medium is modelled as a parallel capacitor and resistor and the influence of electrical double layer (EDL) is represented by capacitors. A sickle RBC is modelled as a membrane capacitor in series with an interior Hb resistor, adapted from the circuit model of a normal RBC [35]. In the case of sickle RBCs, the electrical impedance of the intracellular HbS may depend on its phase as HbS is a main constituent of cell interior. Under normoxia, the cell interior is represented by a resistor. Under hypoxia, the cell interior is replaced by a capacitor for polymerized HbS in parallel with a resistor representing other Hb types in soluble state. This is supported by previous studies on semiconductivity of proteins [36–39]. Hemoglobin and water are the main constituents of RBC interior. According to Rosenberg [36] and Eley [37], the electrical conductivity of protein varies with temperature, σ = σ0exp(−ε/kT), where σ0 is a constant whose value depends on the test material, and ε is the activation energy of semiconduction. In the “wet” state, the protein exhibits semiconductor-like temperature-dependence of conductivity but the semiconduction activation energy is lower than that of crystalline hemoglobin. Furthermore, according to Pethig [38], the electrical conductivity of hemoglobin varies with the amount m of adsorbed water, σ(m) = σDexp(α m), where σD is the dry state conductivity and α is a constant. For a RBC with hemoglobin in “wet” soluble state, as a sickle RBC under normoxia, cell interior is typically modelled as a resistor. During hypoxia-induced cell sickling, intracellular HbS crystallized into fibers from hydrophobic interactions. Such “gel state” of HbS is expected to be more electrically resistive than the soluble HbS under normoxia and exhibits semiconductivity, similar to crystalline bovine haemoglobin [36] as well as the fixation process observed in normal RBCs [40].
Tracking 114 individual sickled RBCs selected randomly from one sickle blood sample, we observed a widespread decrease in the projected cell area after hypoxia. The degree in the cell area reduction varied drastically among sickle RBCs, from less than 5% to more than 50% (Fig. 5). Average area change was 14% ± 9%. About 50% of cells had an area reduction about 10% ± 5%. As electrical impedance of a biological cell is a composite measurement, determined by its size and electrical properties of each component. The variations in the measured electrical impedance differential of sickle RBCs associated with cell sickling after hypoxia are likely attributed to the alternation in cell size. Difference in cell size may also explain the significant difference between normal RBCs and sickle RBCs under normoxia. Other factors beyond the cell size, such as variation in cell interior, Hb types and concentrations may also be responsible for the variation in impedance. Quantitative relationships between the intracellular Hb types, concentration and impedance will require detailed mathematical modelling and analysis.
Fig. 5.
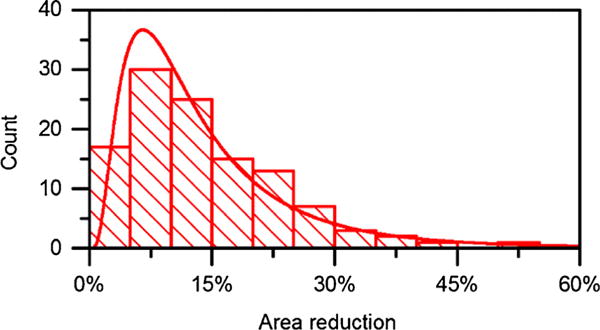
Reduction in the projected cell area in sickled RBCs from sample sickle-2 under hypoxia (n = 114), fitted with a lognormal function. Mean area reduction is about 14%. The most frequently occurring value is around 10% ± 5%.
3.4. Patient variation
SCD manifests marked heterogeneity in pathophysiology [41], cell density profile [42], cellular mechanical properties [12,14], and blood rheology [33]. As indicated previously, comparing to normal RBCs, sickle RBCs in the 3 sickle blood samples exhibited similar patterns in the scatter plot of Δ|Z| versus Δθ under normoxia (Fig. 4). To study the possibility of electrical impedance differential as a marker of patient-specific cell sickling, we compared the electrical impedance signals of sickle-1, sickle-2, and sickle-3 under normoxia and hypoxia at electrical frequencies 156 kHz, 500 kHz, and 3 MHz (Fig. 6).
Fig. 6.
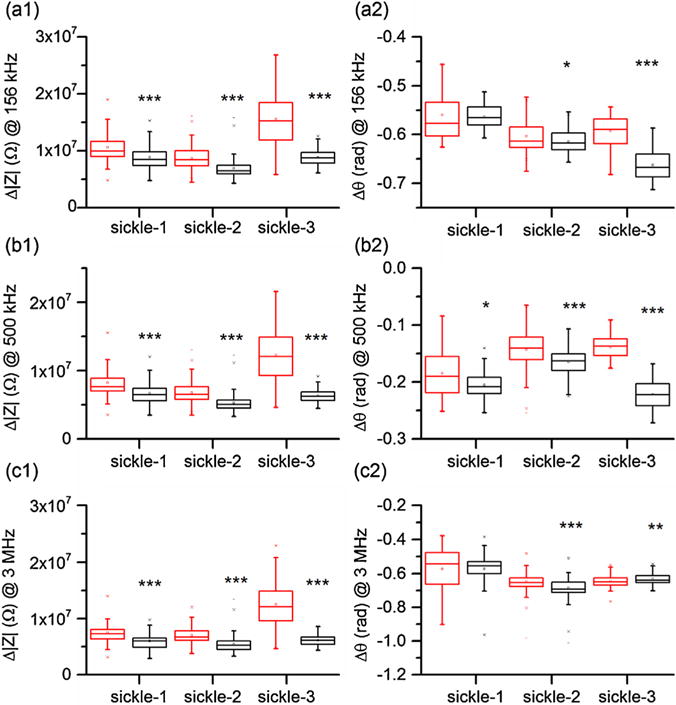
Patient-specific variations in electrical impedance differential under normoxia (red box) and hypoxia (black box) measured at (a) 156 kHz, (b) 500 kHz, and (c) 3 MHz. (For interpretation of the references to colour in this figure legend, the reader is referred to the web version of this article.)
The differences in the electrical impedance differential between normoxia and hypoxia are substantial in Δ|Z| among all 3 sickle samples. Comparing to the values determined under normoxia, values of Δ|Z| decreased 16%, 20%, and 43% at 156 kHz, 18%, 22%, 48% at 500 kHz, and 20%, 23%, and 51% at 3 MHz, for samples sickle-1, sickle-2, and sickle-3, respectively. Changes in Δθ varied among the 3 sickle samples and depended on the excitation frequency. Significance was observed in sickle-2 and sickle-3 at all frequencies but not for sickle-1. Frequency of 500 kHz was found to be the only frequency at which all samples displayed significance (Fig. 6b2). These results indicated that the difference in the electrical impedance differential measured under normoxia and hypoxia, especially at the intermediate electrical frequency, can be potentially used as a signature of patient’s hematological response to hypoxia.
4. Conclusions
This study provides a unique, label-free flow cytometry technique, combining electrical impedance sensing and on-chip oxygen control onto a single microfluidic chip for hematological analysis of sickle blood. This study was not designed to detect differences between the various genotypes or correlations between disease severity and electrical impedance. Such correlates are warranted but require a lager sample size. This method offers a low-sample consumption, non-invasive measurement of individual cells without hemolysing process in a microfluidic environment. Our results suggest that sickle cells can be differentiated from normal cells using electrical impedance signals under normoxia. Furthermore, our results suggested that the electrical impedance signals of sickle blood cells measured under hypoxia as well as the difference from normoxia values can provide additional information indicative of cell sickling events. These findings lead to the conclusion that electrical impedance differential can serve as a new biomarker of SCD.
Supplementary Material
Acknowledgments
The authors thank Vanessa Cumming at the Division of Pediatric Hematology and Oncology, University of Miami for assistance in procuring sickle cell blood samples. The authors acknowledge support by the National Science Foundation under Grant No. 1635312 and No. 1464102. E. D. acknowledges faculty start-up grant by Florida Atlantic University. Y. Q. thanks the microfabrication facility support by AMERI, Florida International University. Microfabrication research carried out in part at the Center for Functional Nanomaterials, Brookhaven National Laboratory, which is supported by the U.S. Department of Energy, Office of Basic Energy Sciences, under Contract No. DE-SC0012704.
Biographies
Jia Liu is currently a PhD candidate of Mechanical Engineering at Florida Atlantic University. Her research interest is focused on lab-on-a-chip devices and biosensors for disease diagnosis.
Yuhao Qiang is currently a PhD candidate of Mechanical Engineering at Florida Atlantic University. His research interest in focused on microfluidics and bioMEMS for cell biomechanics.
Ofelia Alvarez, MD, is a pediatric hematologist-oncologist in Miami, Florida and is affiliated with Jackson Memorial Hospital. She received her medical degree from University of Puerto Rico School of Medicin.
E Du obtained her PhD degree in Mechanical Engineering in 2011 from the Stevens Institute of Technology. She is now assistant professor at the Florid Atlantic University. Her current research interests focus on microfluidics, biosensors, and biomechanics.
Appendix A. Supplementary data
Supplementary data associated with this article can be found, in the online version, at http://dx.doi.org/10.1016/j.snb.2017.08.163.
References
- 1.Rees DC, Williams TN, Gladwin MT. Sickle-cell disease. Lancet. 2010;376:2018–2031. doi: 10.1016/S0140-6736(10)61029-X. [DOI] [PubMed] [Google Scholar]
- 2.van Beers EJ, Samsel L, Mendelsohn L, Saiyed R, Fertrin KY, Brantner CA, et al. Imaging flow cytometry for automated detection of hypoxia-induced erythrocyte shape change in sickle cell disease. Am J Hematol. 2014;89:598–603. doi: 10.1002/ajh.23699. [DOI] [PMC free article] [PubMed] [Google Scholar]
- 3.Christoph GW, Hofrichter J, Eaton WA. Understanding the shape of sickled red cells. Biophys J. 2005;88:1371–1376. doi: 10.1529/biophysj.104.051250. [DOI] [PMC free article] [PubMed] [Google Scholar]
- 4.Li X, Du E, Lei H, Tang YH, Dao M, Suresh S, et al. Patient-specific blood rheology in sickle-cell anaemia. Interface Focus. 2016;6:20150065. doi: 10.1098/rsfs.2015.0065. [DOI] [PMC free article] [PubMed] [Google Scholar]
- 5.Barabino GA, Platt MO, Kaul DK. Sickle cell biomechanics. Annu Rev Biomed Eng. 2010;12:345–367. doi: 10.1146/annurev-bioeng-070909-105339. [DOI] [PubMed] [Google Scholar]
- 6.Brittenham GM, Schechter AN, Noguchi CT. Hemoglobin-S polymerization – primary determinant of the hemolytic and clinical severity of the sickling syndromes. Blood. 1985;65:183–189. [PubMed] [Google Scholar]
- 7.Bunn HF. Pathogenesis and treatment of sickle cell disease. New Engl J Med. 1997;337:762–769. doi: 10.1056/NEJM199709113371107. [DOI] [PubMed] [Google Scholar]
- 8.Clarke GM, Higgins TN. Laboratory investigation of hemoglobinopathies and thalassemias: review and update. Clin Chem. 2000;46:1284–1290. [PubMed] [Google Scholar]
- 9.Akinsheye I, Alsultan A, Solovieff N, Ngo D, Baldwin CT, Sebastiani P, et al. Fetal hemoglobin in sickle cell anemia. Blood. 2011;118:19–27. doi: 10.1182/blood-2011-03-325258. [DOI] [PMC free article] [PubMed] [Google Scholar]
- 10.Kumar M, Guo Y, Zhang P. Highly sensitive and selective oligonucleotide sensor for sickle cell disease gene using photon upconverting nanoparticles. Biosens Bioelectron. 2009;24:1522–1526. doi: 10.1016/j.bios.2008.08.023. [DOI] [PMC free article] [PubMed] [Google Scholar]
- 11.Evans E, Mohandas N, Leung A. Static and dynamic rigidities of normal and sickle erythrocytes. Major influence of cell hemoglobin concentration. J Clin Invest. 1984;73:477. doi: 10.1172/JCI111234. [DOI] [PMC free article] [PubMed] [Google Scholar]
- 12.Nash GB, Johnson CS, Meiselman HJ. Mechanical properties of oxygenated red blood cells in sickle cell (HbSS) disease. Blood. 1984;63:73–82. [PubMed] [Google Scholar]
- 13.Maciaszek JL, Andemariam B, Lykotrafitis G. Microelasticity of red blood cells in sickle cell disease. J Strain Anal Eng Des. 2011;46:368–379. [Google Scholar]
- 14.Byun H, Hillman TR, Higgins JM, Diez-Silva M, Peng Z, Dao M, et al. Optical measurement of biomechanical properties of individual erythrocytes from a sickle cell patient. Acta Biomater. 2012;8:4130–4138. doi: 10.1016/j.actbio.2012.07.011. [DOI] [PMC free article] [PubMed] [Google Scholar]
- 15.Hosseini P, Abidi SZ, Du E, Papageorgiou DP, Choi Y, Park Y, et al. Cellular normoxic biophysical markers of hydroxyurea treatment in sickle cell disease. Proc Natl Acad Sci. 2016:201610435. doi: 10.1073/pnas.1610435113. [DOI] [PMC free article] [PubMed] [Google Scholar]
- 16.Wood DK, Soriano A, Mahadevan L, Higgins JM, Bhatia SN. A biophysical indicator of vaso-occlusive risk in sickle cell disease. Sci Transl Med. 2012;4:123ra26–ra26. doi: 10.1126/scitranslmed.3002738. [DOI] [PMC free article] [PubMed] [Google Scholar]
- 17.Abbyad P, Tharaux PL, Martin JL, Baroud CN, Alexandrou A. Sickling of red blood cells through rapid oxygen exchange in microfluidic drops. Lab Chip. 2010;10:2505–2512. doi: 10.1039/c004390g. [DOI] [PubMed] [Google Scholar]
- 18.Beers EJ, Samsel L, Mendelsohn L, Saiyed R, Fertrin KY, Brantner CA, et al. Imaging flow cytometry for automated detection of hypoxia-induced erythrocyte shape change in sickle cell disease. Am J Hematol. 2014;89:598–603. doi: 10.1002/ajh.23699. [DOI] [PMC free article] [PubMed] [Google Scholar]
- 19.Zheng Y, Nguyen J, Wei Y, Sun Y. Recent advances in microfluidic techniques for single-cell biophysical characterization. Lab Chip. 2013;13:2464–2483. doi: 10.1039/c3lc50355k. [DOI] [PubMed] [Google Scholar]
- 20.Haandbaek N, Burgel SC, Heer F, Hierlemann A. Characterization of subcellular morphology of single yeast cells using high frequency microfluidic impedance cytometer. Lab Chip. 2014;14:369–377. doi: 10.1039/c3lc50866h. [DOI] [PubMed] [Google Scholar]
- 21.Song H, Wang Y, Rosano JM, Prabhakarpandian B, Garson C, Pant K, et al. A microfluidic impedance flow cytometer for identification of differentiation state of stem cells. Lab Chip. 2013;13:2300–2310. doi: 10.1039/c3lc41321g. [DOI] [PubMed] [Google Scholar]
- 22.Kirkegaard J, Clausen CH, Rodriguez-Trujillo R, Svendsen WE. Study of paclitaxel-treated HeLa cells by differential electrical impedance flow cytometry. Biosensors. 2014;4:257–272. doi: 10.3390/bios4030257. [DOI] [PMC free article] [PubMed] [Google Scholar]
- 23.Simon P, Frankowski M, Bock N, Neukammer J. Label-free whole blood cell differentiation based on multiple frequency AC impedance and light scattering analysis in a micro flow cytometer. Lab Chip. 2016;16:2326–2338. doi: 10.1039/c6lc00128a. [DOI] [PubMed] [Google Scholar]
- 24.Lvovich V, Srikanthan S, Silverstein RL. A novel broadband impedance method for detection of cell-derived microparticles. Biosens Bioelectron. 2010;26:444–451. doi: 10.1016/j.bios.2010.07.094. [DOI] [PMC free article] [PubMed] [Google Scholar]
- 25.Yakdi NE, Huet F, Ngo K. Detection and sizing of single droplets flowing in a lab-on-a-chip device by measuring impedance fluctuations. Sens Actuators, B. 2016;236:794–804. [Google Scholar]
- 26.Du E, Ha S, Diez-Silva M, Dao M, Suresh S, Chandrakasan AP. Electric impedance microflow cytometry for characterization of cell disease states. Lab Chip. 2013;13:3903–3909. doi: 10.1039/c3lc50540e. [DOI] [PMC free article] [PubMed] [Google Scholar]
- 27.Valero A, Braschler T, Renaud P. A unified approach to dielectric single cell analysis: impedance and dielectrophoretic force spectroscopy. Lab Chip. 2010;10:2216–2225. doi: 10.1039/c003982a. [DOI] [PubMed] [Google Scholar]
- 28.Tsai SL, Wang MH. 24 h observation of a single HeLa cell by impedance measurement and numerical modeling. Sens Actuators, B. 2016;229:225–231. [Google Scholar]
- 29.Haandbæk N, Bürgel SC, Heer F, Hierlemann A. Characterization of subcellular morphology of single yeast cells using high frequency microfluidic impedance cytometer. Lab Chip. 2014;14:369–377. doi: 10.1039/c3lc50866h. [DOI] [PubMed] [Google Scholar]
- 30.Cheung K, Gawad S, Renaud P. Impedance spectroscopy flow cytometry: on-chip label-free cell differentiation. Cytom Part A. 2005;65A:124–132. doi: 10.1002/cyto.a.20141. [DOI] [PubMed] [Google Scholar]
- 31.Du E, Diez-Silva M, Kato GJ, Dao M, Suresh S. Kinetics of sickle cell biorheology and implications for painful vasoocclusive crisis. Proc Natl Acad Sci. 2015;112:1422–1427. doi: 10.1073/pnas.1424111112. [DOI] [PMC free article] [PubMed] [Google Scholar]
- 32.Liu J, Qiang Y, Du E. ASME’s International Mechanical Engineering Congress and Exposition Tampa. Florida: 2017. Measurement of electrical properties of sickle cells from electrical impedance of cell suspension. [Google Scholar]
- 33.Usami S, Chien S, Scholtz PM, Bertles JF. Effect of deoxygenation on blood rheology in sickle cell disease. Microvasc Res. 1975;9:324–334. doi: 10.1016/0026-2862(75)90069-2. [DOI] [PubMed] [Google Scholar]
- 34.Rasband W. ImageJ. US National Institutes of Health; Bethesda, MD: 1997. [Google Scholar]
- 35.Morgan H, Sun T, Holmes D, Gawad S, Green NG. Single cell dielectric spectroscopy. J Phys D Appl Phys. 2007;40:61–70. [Google Scholar]
- 36.Rosenberg B. Electrical conductivity of proteins. 2. semiconduction in crystalline bovine hemoglobin. J Chem Phys. 1962;36:816–&. [Google Scholar]
- 37.Eley DD, Spivey DI. The semiconductivity of organic substances.6. a range of proteins. Trans Faraday Soc. 1960;56:1432–1442. [Google Scholar]
- 38.Pethig RA. Dielectric and Electronic Properties of Biological Materials. John Wiley; 1979. [Google Scholar]
- 39.Meredith P, Bettinger CJ, Irimia-Vladu M, Mostert AB, Schwenn PE. Electronic and optoelectronic materials and devices inspired by nature. Rep Prog Phys. 2013;76 doi: 10.1088/0034-4885/76/3/034501. [DOI] [PubMed] [Google Scholar]
- 40.Huang SB, Zhao Y, Chen DY, Liu SL, Luo YN, Chiu TK, et al. Classification of cells with membrane staining and/or fixation based on cellular specific membrane capacitance and cytoplasm conductivity. Micromach-Basel. 2015;6:163–171. [Google Scholar]
- 41.Steinberg MH, Rodgers GP. Pathophysiology of sickle cell disease: role of cellular and genetic modifiers. Semin Hematol. 2001;38:299–306. doi: 10.1016/s0037-1963(01)90023-x. [DOI] [PubMed] [Google Scholar]
- 42.Rodgers GP, Schechter AN, Noguchi CT. Cell heterogeneity in sickle-cell disease – quantitation of the erythrocyte density profile. J Lab Clin Med. 1985;106:30–37. [PubMed] [Google Scholar]
Associated Data
This section collects any data citations, data availability statements, or supplementary materials included in this article.