Abstract
BACKGROUND. Sodium glucose cotransporter-2 (SGLT2) inhibitors are the most recently approved class of drugs for type 2 diabetes and provide both glycemic efficacy and cardiovascular risk reduction. A number of safety issues have been identified, including treatment-emergent bone fractures. To understand the overall clinical profile, these safety issues must be balanced against an attractive efficacy profile. Our study was designed to investigate pathophysiological mechanisms mediating treatment-emergent adverse effects on bone health.
METHODS. We conducted a single-blind randomized crossover study in hospitalized healthy adults (n = 25) receiving either canagliflozin (300 mg/d) or placebo for 5 days. The primary end-point was the drug-induced change in AUC for plasma intact fibroblast growth factor 23 (FGF23) immunoactivity between 24 and 72 hours.
RESULTS. Canagliflozin administration increased placebo-subtracted mean levels of serum phosphorus (+16%), plasma FGF23 (+20%), and plasma parathyroid hormone (PTH) (+25%), while decreasing the level of 1,25-dihydroxyvitamin D (–10%). There was substantial interindividual variation in the magnitude of each of these pharmacodynamic responses. The increase in plasma FGF23 was correlated with the increase in serum phosphorus, and the decrease in plasma 1,25-dihydroxyvitamin D was correlated with the increase in plasma FGF23.
CONCLUSIONS. Canagliflozin induced a prompt increase in serum phosphorus, which triggers downstream changes in FGF23, 1,25-dihydroxyvitamin D, and PTH, with potential to exert adverse effects on bone health. These pharmacodynamic data provide a foundation for future research to elucidate pathophysiological mechanisms of adverse effects on bone health, with the objective of devising therapeutic strategies to mitigate the drug-associated fracture risk.
TRIAL REGISTRATION. ClinicalTrial.gov (NCT02404870).
FUNDING. Supported by the Intramural Program of NIDDK.
Keywords: Bone Biology, Endocrinology
Keywords: Bone disease, Diabetes
Canalgiflozin therapy induces changes in calciotropic hormones, triggering a decrease in vitamin D and increase in PTH, which may lead to adverse effects on bone health.
Introduction
Sodium glucose cotransporter-2 (SGLT2) inhibitors, the newest class of oral therapies approved for type 2 diabetes (T2D), decrease plasma glucose levels by inhibiting renal proximal tubular glucose reabsorption (1). These drugs have attractive clinical efficacy profiles, including glycemic control, weight loss, and decreased blood pressure. SGLT2 inhibitors have also been reported to decrease the risks of major adverse cardiovascular events, hospitalization for heart failure, and progression of diabetic kidney disease (2, 3). Nevertheless, the Food and Drug Administration (FDA) has issued warnings about various risks, such as diabetic ketoacidosis, fractures, and amputations. Physicians and patients must take both benefits and risks into account in order to fully understand the clinical profile (4–6).
In 2014, Kohan et al. (7) reported a dose-dependent increase in the number of treatment-emergent bone fractures in dapagliflozin-treated patients with T2D and moderate renal impairment. Watts et al. (8) reported that canagliflozin was associated with increased incidence of fractures in the CANVAS study: 2.6% of placebo-treated vs. 4.0% of canagliflozin-treated patients. Bilezikian et al. (9) reported that canagliflozin treatment decreased total hip bone mineral density and increased the bone resorption marker C-terminal telopeptide (β-CTX). Although the peer-reviewed literature does not contain reports of associations between empagliflozin and the risk of fractures, the FDA has suggested that longer trials might be needed to detect an increase in fracture risk (10). Further, empagliflozin was associated with a doubling in the incidence in upper extremity fractures (1.0% vs. 0.5%) in the Empagliflozin, Cardiovascular Outcome Event Trial in Type 2 Diabetes Patients (EMPA-REG OUTCOME) trial (10). After approval, the FDA issued warnings about the risk of bone loss and bone fracture in canagliflozin-treated patients (4, 11). At present, the FDA is handling this issue as a compound-specific adverse effect of canagliflozin rather than a class effect.
We hypothesized that SGLT2 inhibitors stimulate renal proximal tubular reabsorption of phosphate (12). By increasing availability of sodium in the proximal tubule, SGLT2 inhibitors increase the electrochemical gradient for sodium, which provides energy to drive reabsorption of phosphate via type II sodium–phosphate cotransporters — also located in the proximal renal tubule. Increased phosphate reabsorption would trigger secretion of fibroblast growth factor 23 (FGF23) (12). FGF23 inhibits production of 1,25-dihydroxyvitamin D (the biologically active form of vitamin D), which would decrease absorption of calcium from the gastrointestinal tract, thereby promoting secretion of parathyroid hormone (PTH). We designed the present study to test our mechanistic hypotheses. While this pathophysiological mechanism would be predicted to apply to all SGLT2 inhibitors, we selected canagliflozin because it was the only SGLT2 inhibitor approved in the US when the study was initiated. Furthermore, canagliflozin is the most widely used SGLT2 inhibitor and has the strongest clinical evidence for an adverse effect on bone health. We found that canagliflozin significantly increased levels of serum phosphorus, plasma FGF23, and plasma PTH, while decreasing plasma levels of 1,25-dihydroxyvitamin D. Based on these data, we hypothesize that these pharmacodynamic responses provide biomarkers to identify patients at greatest risk for drug-induced bone loss and fractures. In addition, our data suggest that calcitriol might protect against the risk of drug-induced fractures if administered to SGLT2 inhibitor–treated patients with low levels of 1,25-dihydroxyvitamin D and/or PTH. Finally, our data are relevant to the controversy as to whether bone loss represents a canagliflozin-specific adverse effect vs. a characteristic of the entire class of SGLT2 inhibitors. Our proposed mechanism is intrinsic to the SGLT2 inhibitor mechanism of action, suggesting that the adverse effects on bone are likely mechanism-based effects of the SGLT2 inhibitor class of drugs.
Results
Research subjects.
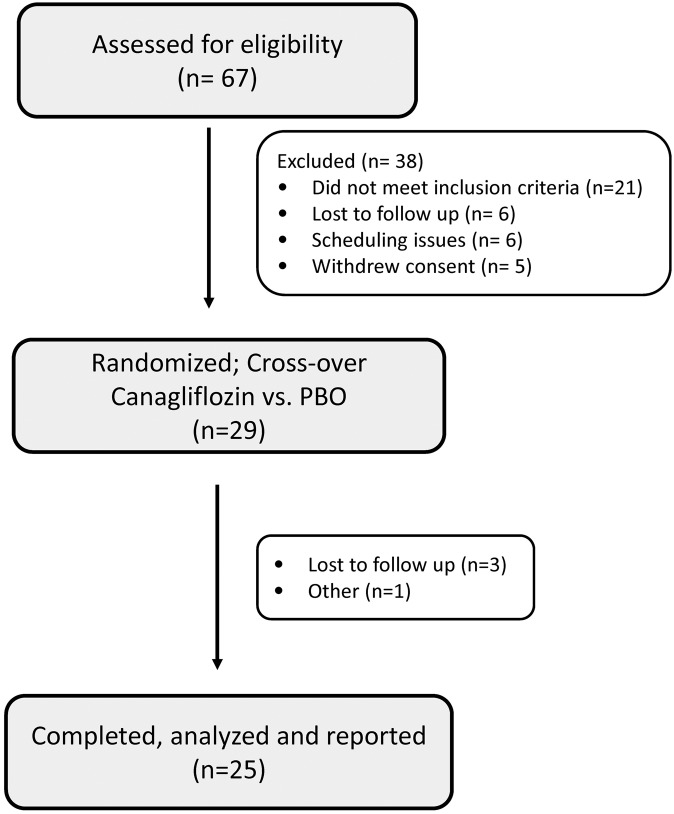
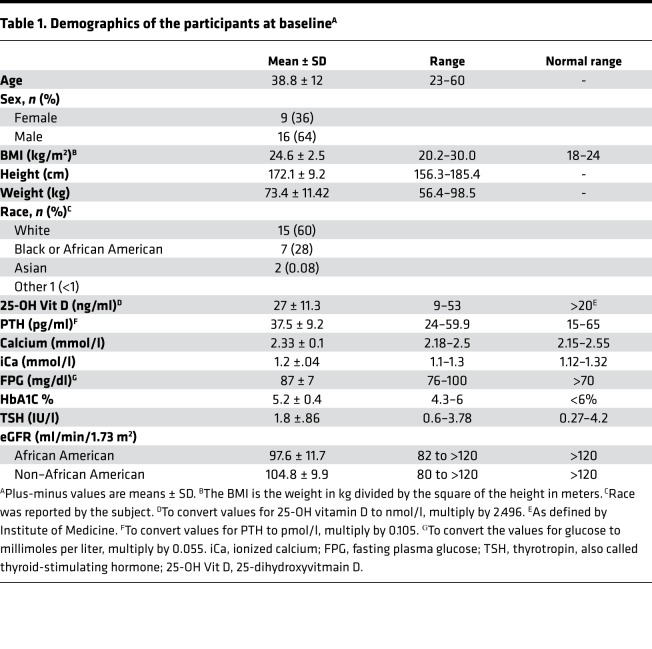
Sixty-seven patients were screened for eligibility; 29 met eligibility criteria and were randomized between October, 2014, and March, 2016. Four patients discontinued the study after randomization. Two were lost to follow up after completion of the first study arm, 1 had anxiety about the inpatient admission, and the fourth had a previously unplanned geographic relocation. Twenty-five healthy subjects (9 females), mean age 38.8 ± 12.0 years and BMI of 24.6 ± 2.5 kg/m2 (mean ± SD) completed the study. A flow chart of study subjects is shown in Figure 1. Subjects were excluded if they had any of the following baseline laboratory values: fasting plasma glucose >100 mg/dl, hemoglobin A1c >6%, hemoglobin ≤11 g/dl, glucosuria, creatinine >1.5 mg/dl, estimated GFR (eGFR) <80 ml/min/1.73 m2, serum inorganic phosphorus <2.5 mg/dl or >4.8 mg/dl, or PTH >60 pg/ml. Other exclusion criteria included use of diuretics or other hypertensive medications, daily intake of supplemental calcium >800 mg or vitamin D >1,000 units within 2 weeks of the study, or any medical condition known to affect bone health. Baseline laboratory results — including eGFR, PTH, total and ionized calcium, and phosphorus — were within normal ranges (Table 1). Thirty-four percent were excluded based on one or more of the following criteria: BMI >30, prediabetes, or hypertension. Screening evaluation and complete inclusion/exclusion criteria are provided in Supplemental Table 2 and Supplemental Methods (supplemental material available online with this article; https://doi.org/10.1172/jci.insight.99123DS1).
Figure 1. Trial enrollment details.
A total of 67 healthy volunteers were assessed for eligibility based on inclusion/exclusion criteria (see Supplemental Methods for complete list). A total of 29 subjects were randomized for the cross-over study (canagliflozin vs. placebo [BPO]). Four subjects withdrew from the study after randomization. Therefore, data were collected and analyses performed on 25 subjects.
Table 1. Demographics of the participants at baselineA.
Subjects were provided a fixed diet during the 7-day outpatient phase prior to each admission and also during each inpatient stay. They were required to abstain from foods other than those provided by the research team and from beverages other than water. Details regarding calculations for caloric needs and micro- and macronutrient composition are provided in the Supplemental Methods. The diet was provided in 3 daily meals during the inpatient stay, and subjects were instructed to consume all food within 30 minutes. Subjects were fasting beginning at 10 pm the night prior until 12:30 pm (first meal). They were provided 6 fluid ounces of cold, distilled, deionized water every 2 hours between 8 am and 12 pm.
Subjects were required to have at least 1 week of wash-out prior to initiating the next arm (7-day outpatient phase followed by 7-day inpatient arm). There were no hypersensitivity reactions or other serious adverse events in either group.
Pharmacodynamic effects of canagliflozin on markers of mineral metabolism.
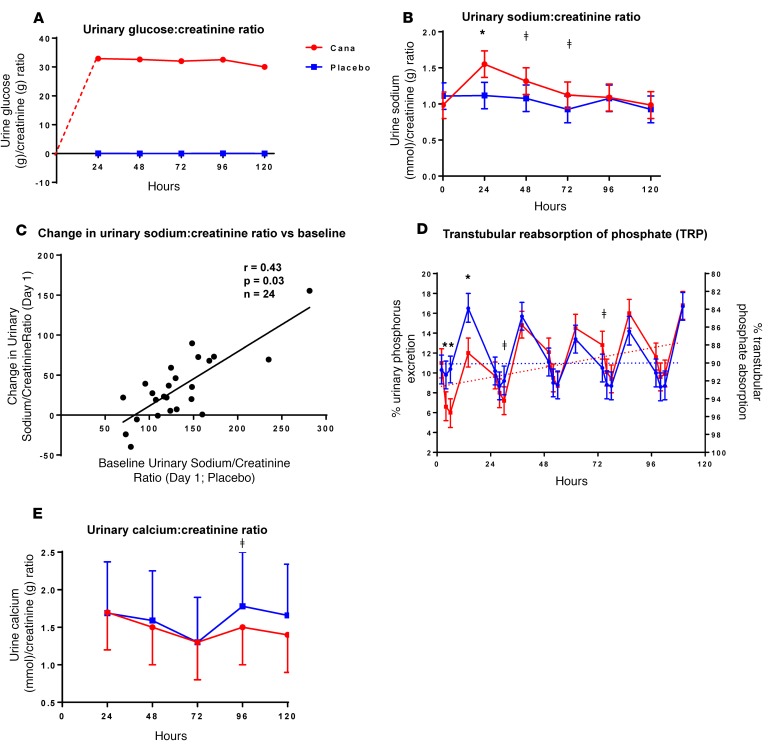
Canagliflozin induced marked and sustained glucosuria (Figure 2A) over the course of the 5-day study. Urinary sodium excretion increased by an average of 47% promptly within the first day (Figure 2B) but decreased to baseline levels by 96 hours. The magnitude of the acute drug-induced increase in urinary sodium excretion was correlated with the baseline level of sodium excretion; the largest drug-induced natriuresis occurred in those with the highest baseline rates of urinary sodium excretion (r = 0.43, P = 0.03, Figure 2C). When baseline sodium/creatinine ratios were less than ~80 mmol/g, canagliflozin had little or no effect on urinary sodium excretion.
Figure 2. Canaglifozin-induced changes in urinary excretion of glucose, sodium, and phosphate.
Research subjects (n = 25) received canaglifozin (Cana) (300 mg/d) for 5 days starting at 0 hours. Urinary excretion of glucose (g/d), sodium (mmol/d), creatinine (g/d), and phosphate (g/d) were collected over 24-hour periods. Ratios of glucose (g)/creatinine (g) excretion (A) and sodium (mmol)/creatinine (g) excretion (B) were plotted as means ± SEM at time points corresponding to the ends of the collection periods. (C) Drug-induced increase in urinary sodium/creatinine ratio as a function of baseline urinary sodium excretion. (D) Percent urinary phosphate excretion on the left axis and % urinary phosphorus absorption on the right axis. Note that the sum of excretion and absorption equals 100% at all time points. Urinary excretion (left axis) is plotted with values increasing, whereas transtubular reabsorption of phosphate (TRP; right axis) is plotted with values decreasing. Daily timed urine specimens were collected at 0, 2, 4, and 12 hours. Aliquots (10 ml) were analyzed to generate data for D, and the remainder of the urine specimen was added to the 24-hour urine collection. (E) Twenty-four–hour urinary calcium excretion (mmol/24 hr)/creatinine (g) excretion as a function of the day on which the urine was collected. In B, D, and E, *P < 0.0001 and ǂP < 0.05 by 2-tailed t test, respectively. Data for placebo and canagliflozin are represented in blue and red, respectively.
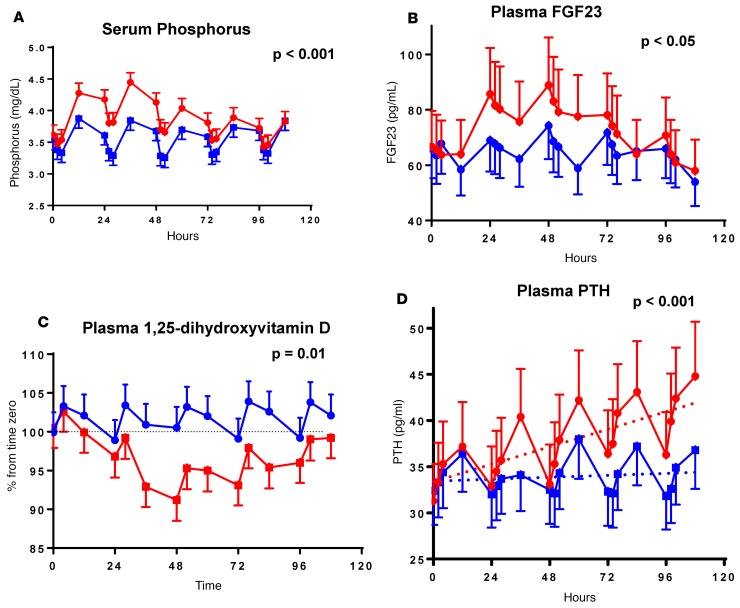
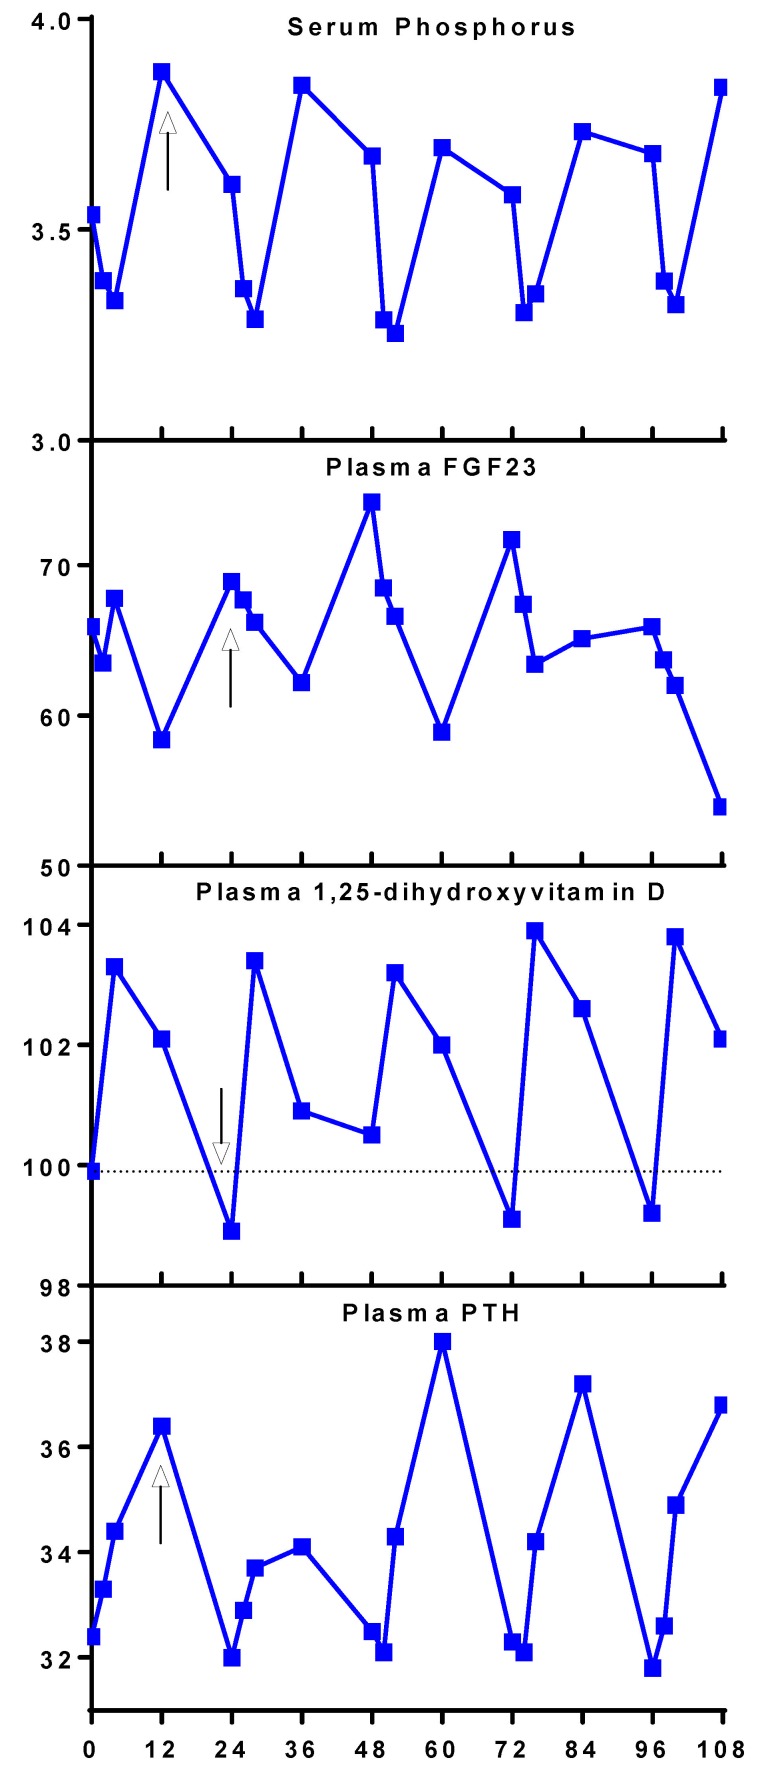
Several end-points demonstrated a circadian rhythm (Figures 3 and 4) including serum phosphorus, plasma FGF23, 1,25-dihydroxyvitamin D, and PTH (13–15). Peak levels for serum phosphorus, FGF23, and PTH were observed around 12 pm, 8 pm, and 12 pm, respectively. The nadir for 1,25-dihydroxyvitamin D was observed at 8 am (Figure 4). Administration of canagliflozin rapidly increased serum phosphorus (at 4 hours, Δ = +0.20 mg/dl, P = 0.02, Figure 3A) compared with placebo — coinciding with an increase in urinary phosphorus reabsorption (+4.4%; P ≤ 0.001, Figure 2D). The maximum placebo-subtracted mean difference in serum phosphorus of 0.61 mg/dl was reached at 36 hours (P < 0.001).
Figure 3. Effect of canagliflozin on serum phosphorus and hormones of mineral metabolism.
Research subjects (n = 25) were treated with canagliflozin or placebo (Figure 2). Serial blood tests were obtained and analyzed for serum phosphorus (A) and plasma hormones (FGF23, 1,25-dihydroxyvitamin D, and PTH in B–D, respectively). Differences were statistically significant (P < 0.05, paired 2-tailed t tests) for phosphorus (4–76 hours), FGF23 (24–60 hours), 1,25-dihydroxyvitamin D (28–100 hours), and PTH (36 and 52–108 hours). Data are graphed as means ± 95% CIs. Two-tailed P value for PTH refers to the rate of change over time. Data for placebo and canagliflozin are represented in blue and red, respectively.
Figure 4. Circadian rhythm of levels of serum phosphorus and plasma hormones of mineral metabolism in placebo arm.
Mean values from days 1–5 (0–108 hours) of the subjects’ placebo visits (n = 25) are arranged from top to bottom: serum phosphorus, plasma FGF23, plasma 1,25-dihydroxyvitamin D, and plasma PTH. Arrows are placed at the peaks for serum phosphorus (8 pm), plasma FGF23 (8 am), and plasma PTH (8 pm) and the nadir for plasma 1,25-dihydroxyvitamin D (12 pm).
Canagliflozin increased mean FGF23 AUC between 24 and 72 hours (the prespecified primary end-point), by 20% (AUC24-72hrs canagliflozin 3,855 vs. AUC24-72hrs placebo 3,204 pg/ml × 48 hours, geometric means, P < 0.0001, Figure 3B). The maximum placebo-subtracted value of mean FGF23 concentrations occurred at 60 hours, with the FGF23 level in the canagliflozin group being ~30% higher than placebo (P < 0.001). The difference in mean FGF23 concentrations between treatment and placebo groups was no longer statistically significant by 84 hours after treatment initiation.
Plasma 1,25-dihydroxyvitamin D concentrations decreased promptly in response to canagliflozin and remained lower throughout the treatment period. The maximum mean difference between the treatment conditions was observed at 48 hours (–9.4% ± 1.5%, P < 0.0001, Figure 3C). Peak and nadir levels of plasma 1,25-dihydroxyvitamin D were consistent from day to day during the placebo admission.
Mean PTH concentrations increased by approximately 5% per day throughout the study period in the canagliflozin-treated condition (Figure 3D), reaching between-condition significance by 36 hours (P = 0.0004). Mean PTH levels increased by a maximum of 25% on day 5 (P < 0.0001). No significant changes were detected in mean concentrations of serum calcium or ionized calcium throughout the 5-day study period. However, canagliflozin treatment was associated with a nominally significant decrease in urinary calcium excretion on day 4 (1.50 vs. 1.78; P = 0.04) (Figure 2E). A trend in the same direction was observed on day 5 (1.40 vs. 1.66; P = 0.09). The decreases in urinary calcium excretion occurred at the same time as the maximal increases in PTH and 2 days after the maximal decrease in 1,25-dihydroxyvitamin D levels (Figure 3).
The wash-out period was sufficiently long so there were no significant carry-over effects at time zero for any of the markers analyzed (all P > 0.10).
Interindividual variability in response to canagliflozin.
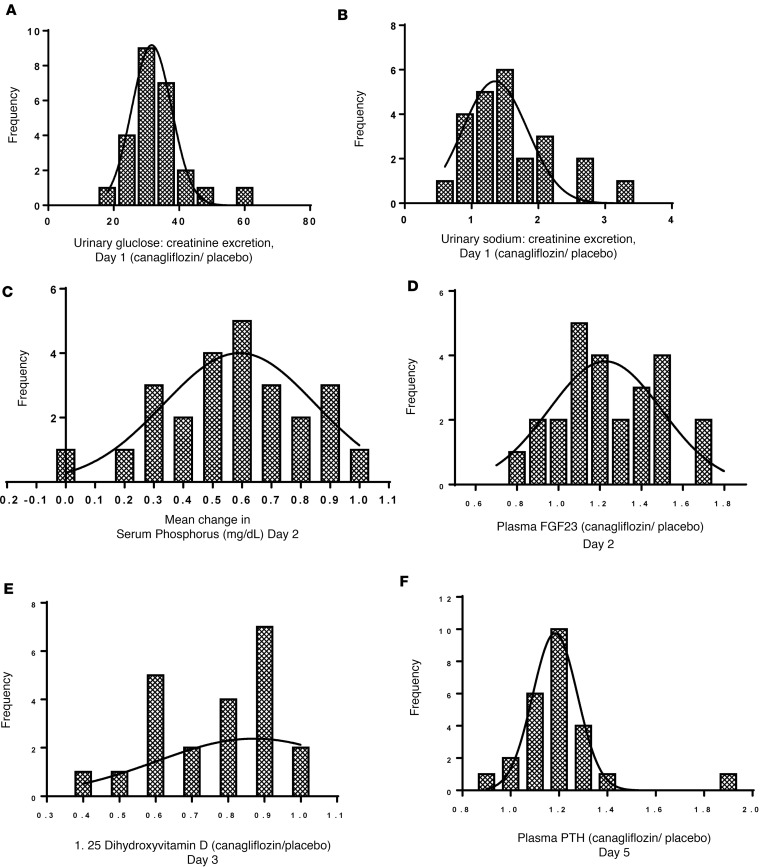
We observed considerable interindividual variation among research subjects in pharmacodynamic responses to canagliflozin (Supplemental Table 1). Canagliflozin-induced glucosuria varied over a 3-fold range (Figure 5A). Some individuals had more than a tripling in urinary sodium excretion, while others had minimal increase (Figure 5B). There was also variability in the drug effects on bone-related biomarkers (Figure 5, C–F), ranging from +0.03 to +1.0 mg/dl for phosphorus, –20% to +70% for FGF23, and −60% to +3% for 1,25-dihydroxyvitamin D. Changes in PTH ranged from −10% to +90%.
Figure 5. Interindividual variation in urinary glucose and sodium excretion and circulating biomarkers of mineral metabolism in response to canagliflozin.
We defined indices of the drug’s effects on serum phosphorus and plasma FGF23 as the mean changes in those parameters on day 2 (24, 26, 28, and 36 hours); plasma 1,25-dihydroxyvitamin D as the mean change on day 3 (48, 52, and 60 hours); and plasma PTH as the mean change on day 5 (96, 98, 100, and 108 hours). (A) Histogram distribution of the ratio of urinary excretions of glucose/creatinine in research subjects treated with canagliflozin (day 1; Figure 2). (B) A similar histogram distribution of the ratio of urinary excretions of sodium/creatinine (day 1; Figure 2). X axes of the histograms (A, B, D–F) depict the ratio of each index during the canagliflozin treatment period divided by the index during the placebo period (i.e., a ratio [canagliflozin/placebo] of ratios [sodium/creatinine or glucose/creatinine]). The x axis for C plots the absolute change in serum phosphorus level (canagliflozin treatment period minus placebo period). The y axes (A–F) depict the number of individuals with the drug responses indicated on the x axes. Bin widths are 6 (A), 0.3 (B), and 0.1 (C, D, F). Data in B include 24 research subjects because of missing data from 1 subject. Data in E include 22 research subjects because of missing data on 3 subjects (see Supplemental Methods). Data in the other 4 panels include all 25 research subjects.
Associations among pharmacodynamic responses.
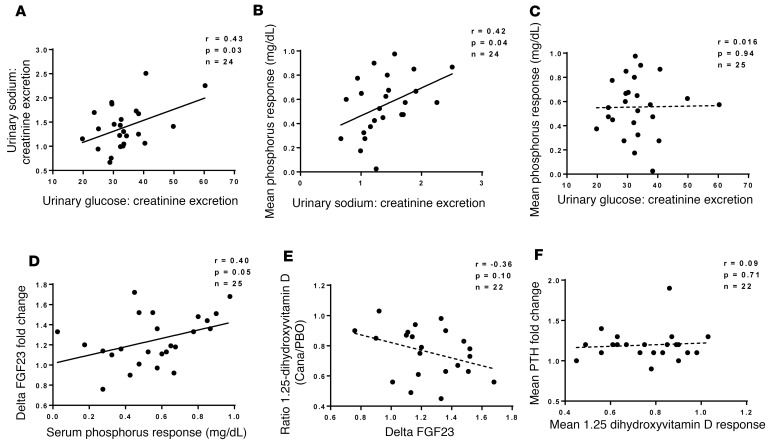
Scatterplots illustrate correlations among pharmacodynamic biomarkers (Figure 6). We observed the following significant correlations (uncorrected for multiple comparisons): between urinary excretion of sodium and glucose (r = 0.43; P = 0.03); increase in serum phosphorus vs. urinary sodium excretion (r = 0.42; P = 0.04); and changes in FGF23 vs. serum phosphorus (r = 0.40; P = 0.05). In addition, there was a trend toward a correlation between changes in 1,25-dihydroxyvitamin D and FGF23 (r = –0.36; P = 0.1). In contrast, we did not detect significant correlations between the increase in serum phosphorus and drug-induced glucosuria or between drug-induced changes in plasma levels of PTH and 1,25-dihydroxyvitamin D.
Figure 6. Associations among pharmacodynamic changes in response to canagliflozin.
Scatterplots showing the relationships between urinary excretion of sodium versus urinary glucose excretion (A), mean serum phosphorus response versus urinary sodium excretion (B), mean serum phosphorus response versus urinary glucose excretion (C), ΔFGF23 versus mean serum phosphorus response (D), mean 1,25-dihydroxyvitamind D versus ΔFGF23 (E), and mean PTH response versus mean 1,25-dihydroxyvitamin D response. Dotted lines represent correlations with P > 0.05. In each case, the indices of drug-induced changes are defined in Figure 3’s legend. The analysis excludes patients with missing data, as explained in Figure 3’s legend.
Discussion
Canagliflozin directly inhibits SGLT2-mediated renal proximal tubular reabsorption of glucose and sodium. In addition, SGLT2 inhibitors lead to several indirect pharmacodynamic effects. For example, by inhibiting cotransport of both Na+ and glucose, canagliflozin increases availability of Na+ in the regions of the proximal tubule where sodium-dependent phosphate cotransporters SLC34A1 and SLC34A3 are expressed (16). This, in turn, increases the electrochemical drive to reabsorb phosphate. Within 2–4 hours after administration of canagliflozin, renal tubular phosphate reabsorption was increased, thereby decreasing urinary phosphate excretion and increasing serum phosphorus levels (Figure 2D and Figure 3A) (17–19). Consistent with the hypothesis that availability of Na+ in the tubular fluid promotes phosphate reabsorption, we observed a correlation between the increase in serum phosphorus and the magnitude of drug-induced natriuresis (Figure 6B).
Peak levels of FGF23 were observed approximately 12 hours after the peak of serum phosphorus, consistent with previous studies suggesting that phosphate promotes FGF23 secretion and increases plasma FGF23 concentrations (20, 21). In contrast, Ito et al. (22) previously reported that a 4-hour i.v. administration of phosphate did not increase FGF23 levels. A possible explanation of this apparent discrepancy is the duration of the clinical study. Our circadian rhythm data suggest that changes in FGF23 lag 12 hours behind changes in serum phosphorus. Thus, it is possible that the study of Ito et al. (22) was not long enough to demonstrate a phosphate-induced increase in FGF23 levels.
FGF23 is known to exert several biological actions (23): (i) decreased expression of type II sodium–phosphate cotransporters type (encoded by genes of the SLC34A family), thereby increasing urinary phosphate excretion; (ii) decreased expression of CYP27B1, which catalyzes 1α-hydroxylation of 25-hydroxyvitamin D and 1,25-dihydroxyvitamin D; and (iii) increased expression of CYP24A1, which catalyzes 24-hydroxylation of 25-hydroxyvitamin D. Decreased expression of CYP27B1 in combination with increased expression of CYP24A1 likely mediated the ~10% decrease in 1,25-dihydroxyvitamin D levels observed on days 2–3 of canagliflozin administration (Figure 3C). The decrease in 1,25-dihydroxyvitamin D would be predicted to decrease gastrointestinal calcium absorption (24), thereby triggering a compensatory increase in plasma PTH. Although we did not observe a statistically significant change in levels of ionized Ca++, the parathyroid gland has a sensitive detection system that may have responded to small changes that were below the sensitivity of our assays to detect. We did not observe a decrease in urinary Ca++ excretion on day 4, which is consistent with our hypothesis that the decrease in 1,25-dihydroxyvitamin D levels (maximal on days 2–3) drove a decrease in gastrointestinal Ca++ absorption. However, the observation is also consistent with an alternate (and not mutually exclusive) explanation that the increase in PTH acted on the kidney to promote tubular reabsorption of Ca++ (25).
Homeostatic compensation.
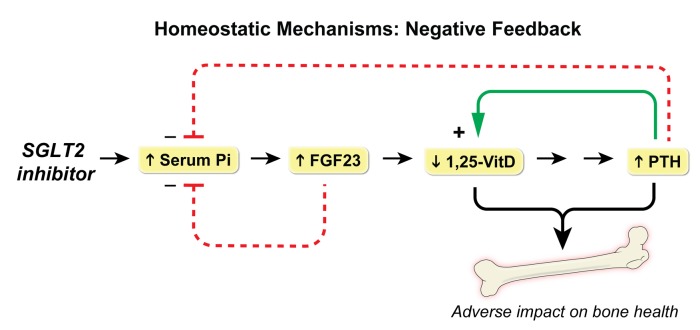
The existence of numerous homeostatic mechanisms introduces complexity in interpretation of studies of SGLT2 inhibitors. Each pharmacological action elicits a physiological reaction. For example, the canagliflozin-induced increase in urinary sodium excretion reached a peak on the first day. This triggers a homeostatic response, which restores urinary sodium excretion to baseline levels — possibly mediated by activation of the renin–angiotensin II–aldosterone system in response to volume contraction (26). These counterregulatory mechanisms establish a new steady-state in which urinary Na+ excretion is balanced by dietary Na+ intake. Similarly, the increase in serum phosphorus triggered increases in FGF23 and PTH, which provided negative feedback restoring serum phosphorus toward baseline levels, thereby abrogating the stimulus for FGF23 secretion (20, 27) (Figure 7). Further, we hypothesized that decreased levels of 1,25-dihydroxyvitamin D elicited an increase in PTH levels, which likely contributed to maintenance of eucalcemia. The observed increase in PTH levels would be predicted to restore 1,25-dihydroxyvitamin D levels toward normal by upregulating CYP27B1 (28). Whereas these relatively small studies in healthy volunteers demonstrated only a transient increase in serum phosphorus, large phase III studies in T2D patients demonstrated sustained increases of 0.1–0.15 mg/dl in mean serum phosphorus that persisted for at least 6 months (2, 7, 19). It is possible that the observed differences relate to the very large size of the phase III studies, which were better powered to detect a small increase in serum phosphorus. Further, just as the elevated levels of plasma glucose in diabetic patients is associated with larger quantities of glucosuria as compared with healthy volunteers, it is likely that diabetic patients would also experience greater increases of urinary sodium excretion and renal tubular reabsorption of phosphate.
Figure 7. Homeostatic mechanisms mediating the effects of SGLT2 inhibitors on hormonal regulation of bone and mineral metabolism.
SLGT2 inhibition increases serum phosphorus, which triggers an increase in FGF23. Increased FGF23 provides negative feedback in order to restore serum phosphorus toward baseline levels. FGF23 is also known to decrease levels of 1,25-dihydroxyvitamin D (1,25-VitD), which is predicted to decrease gastrointestinal Ca+ absorption, thereby stimulating an increase in PTH levels. PTH acts to restore 1,25-VitD levels toward normal by upregulating CYP27B1, while also decreasing serum phosphate. The observed increase in PTH combined with a decrease in 1,25-VitD levels would be predicted to adversely affect bone health.
Canagliflozin-induced changes: interindividual and diurnal variation.
The mean changes in serum phosphorus, FGF23, 1,25-dihydroxyvitamin D, and PTH are not large, which may explain the fact that the majority of canagliflozin-treated patients do not experience fractures. Nevertheless, even relatively small changes may exert clinically significant effects over long periods of time. Furthermore, we hypothesized that outliers with the greatest changes in 1,25-dihydroxyvitamin D, and/or PTH may be at the greatest risk to experience bone loss and/or fracture. Drug-induced urinary excretion of glucose and sodium differed by up to 3-fold among subjects. Likewise, FGF23, 1,25-dihydroxyvitamin D, and PTH also demonstrated wide interindividual variation. Previous studies have also observed considerable interindividual variation in canagliflozin responses. For example, in a pooled analysis of multiple studies with canagliflozin over 26 weeks (19), ~2% of patients had greater than a 25% change in serum phosphorus, and the SD was quite large (14.7%). Future research will be required to confirm whether individuals with the largest changes in bone-related biomarkers are indeed at greatest risk for bone loss and fracture. In order to detect drug effects on these bone-related end-points on top of the background of circadian rhythms, close attention must be paid to the timing of blood samples. We conducted this study in a metabolic ward and obtained blood samples on a strict schedule. In contrast, most previous studies of SGLT2 inhibitors were conducted in out-patient settings and did not provide detailed descriptions of blood sample timing.
The observed decrease in 1,25-dihydroxyvitamin D and increase in PTH represent biologically plausible biomarkers to predict fracture risk. Because the increased PTH levels persisted through the end of our study, we hypothesize that PTH may be the final mediator of canagliflozin-induced bone loss. SGLT2 inhibitor–treated patients with the lowest levels of drug-induced 1,25-dihyroxyvitamin D might be candidates for replacement therapy with calcitriol. Likewise, based on the proposed pathophysiological mechanisms, dietary sodium restriction and/or phosphate binders represent rational approaches that could be evaluated in future clinical trials to determine whether they might mitigate adverse effects of SGLT2 inhibitors on bone.
Alternative hypotheses for increased fracture risk.
In a pooled analysis of canagliflozin-treated patients (8), the observed increase in fractures was attributed to an increase in reported falls, possibly secondary to volume contraction or changes in blood pressure. However, incidence of fall-related adverse events was low, and hazard ratios (HR) were small. It is not stated whether falls were more common among patients experiencing fractures (29). Furthermore, none of the fractures in the pooled analysis were reported in patients just before or within 30 days of experiencing an event related to volume depletion.
Canagliflozin was associated with decreases in bone mineral density of the hip in a 104-week study (9). The authors suggested that weight loss might mediate the effect on bone resorption. Indeed, the change in a bone resorption biomarker (β-CTX) was significantly correlated with the change in body weight. However, changes in body weight accounted for only 3%–4% of the variance in β-CTX. An alternative mechanism was also proposed (9). During the course of the 52-week study, canagliflozin (100 and 300 mg) decreased estradiol by 2.4% and 9.2%, respectively, compared with an 11.8% increase among placebo-treated patients.
Diabetic ketoacidosis has also been described to occur in T2D patients taking SGLT2 inhibitors (6, 30). The mechanism is thought to be largely due to increased ketone body production, and this has been demonstrated in ~1,200 patients with T2D treated with canagliflozin (31). Increased ketonemia may decrease serum bicarbonate, which could trigger bone to release base in the form of alkaline salts of calcium (32). On the other hand, it is not clear that the modest increase reported for total ketone body levels (31) is sufficient to induce clinically significant metabolic acidosis.
Fractures: a class effect?
The strongest available evidence for increased fracture risk comes from data on canagliflozin-treated patients, but increased risk of fracture was also reported in studies of dapagliflozin (7). Even if adverse effects on bone health are intrinsic to the SGLT2 inhibitor mechanism, it is plausible that the magnitude of increased risk might differ among the individual drugs in the class. In head-to-head trials comparing canagliflozin vs. dapagliflozin, the 300 mg dose of canagliflozin induced more glucosuria than 10 mg of dapagliflozin (33). Just as 300 mg of canagliflozin provides superior efficacy, it may also lead to more severe mechanism-based side effects (e.g., fractures) when compared with 10 mg of dapagliflozin. Thus, approved doses of individual drugs might be located at different points in the dose-response curve. Likewise, selectivity profiles for inhibiting SGLT2 vs. SGLT1 are different: empagliflozin > dapagliflozin > canagliflozin (34). Such selectivity differences may also play a role in determining risk of adverse effects on bone.
Although fracture risk was not increased in EMPA-REG (2), the FDA has stated that adverse event terms associated with osteoporosis were noted more often in patients treated with empagliflozin as compared with the placebo group (0.53% vs. 0.09%, respectively). Based on concerns that another member of the SGLT2 inhibitor class (canagliflozin) exerted adverse effects on bone health, the FDA was not entirely reassured by the absence of differences in fracture risk among the treatment arms in EMPA-REG. They emphasized that longer exposures might be required to detect an increase in fracture risk (10). The FDA is not currently treating adverse effects on bone health as a class effect, yet their comments suggest that the question remains unresolved.
Need for future follow-up research.
Our data support our previous hypothesis that canagliflozin decreases mean 1,25-dihydroxyvitamin D and increases mean PTH levels (12). Nevertheless, follow-up studies are needed to rigorously assess the effects of chronic therapy with SGLT2 inhibitors in T2D patients. Hyperglycemia increases both the filtered load of glucose and SGLT2-mediated glucose reabsorption. Consequently, T2D patients would likely experience quantitatively greater drug-induced glucosuria accompanied by greater natriuresis than observed in healthy volunteers. Enhanced natriuresis is predicted to be accompanied by greater increases in serum phosphorus. Furthermore, it has been demonstrated that canagliflozin induces a larger increase in serum phosphorus in T2D patients with moderately impaired renal function as compared with patients with normal eGFR (29, 35). Recently, de Jong et al. (36) published a preliminary report based on a study of 33 diabetic patients with albuminuria who were treated with dapagliflozin (10 mg) for 6 weeks. They observed statistically significant increases in serum phosphorus, plasma FGF23, and plasma PTH. These data provide evidence that a second SGLT2 inhibitor induces similar pharmacodynamic effects on these bone and mineral parameters. Furthermore, their data in patients with evidence of diabetic kidney disease are complementary to our data in healthy volunteers.
Because of their cardioprotective and renoprotective benefits, SGLT2 inhibitors offer hope to many patients with T2D. If it were possible to identify patients at greatest risk for drug-induced fractures, this might allow physicians to prescribe SGLT2 inhibitors to patients who will derive the greatest net clinical benefit and thereby improve the benefit-risk profile for this important class of drugs.
Methods
Supplemental Methods are available online with this article.
Subjects.
Subjects included adults age ≥18 years old with a BMI of 20–30 kg/m2 and deemed to be in good health as determined by the principal investigator based on the results of medical history, laboratory profile, and physical examination, including the following: normal fasting glucose <100 mg/dl and hemoglobin A1c <6%, no glucosuria, creatinine <1.5 mg/dl or eGFR >80 ml/min/1.73 m2 as calculated by the CKD-EPI creatinine equation, inorganic phosphorus level >2.5 mg/dl or <4.8 mg/dl, and PTH <60 pg/ml.
Study design.
This randomized, controlled crossover study (NCT02404870) was conducted at the NIH Clinical Center. To minimize changes in dietary phosphorus, which is known to affect bone and mineral metabolism and FGF23 levels (37), subjects were provided with a weight-maintenance, controlled-nutrient diet with consistent sodium, phosphorus, calcium, magnesium, and macronutrient composition for 1 week prior to and during both admissions (Supplemental Methods) (38, 39). Subjects were randomized in a blinded fashion with respect to the order of treatments (placebo vs. canagliflozin 300 mg [Janssen Pharmaceuticals Inc.]). Each subject’s treatment response was compared with his/her own values in the placebo admission of the study. A prespecified interim analysis was conducted after completing studies on 10 participants to determine if results support the existence of significant differences in the primary endpoint, FGF23, that meet or exceed the differences defined by the statistical guidelines of the trial (40). Minor changes to the initial study design are outlined in the Supplemental Ammendments to Protocol.
Following eligibility screening by the research coordinator and confirmed by an investigator, the research coordinator telephoned the pharmacy who provided the randomization schedule (placebo or study drug for each arm) for each patient. Placebo was provided in a capsule, while canagliflozin was provided in a tablet. However, patients were blinded to the treatment allocation.
Subjects completed 2 inpatient admissions at the NIH metabolic research unit separated by a wash-out of least a 1-week duration. Study drug or placebo was administered daily at 8 am, followed by serial blood and urine sampling. Subjects fasted daily until receiving meals at 12:30 pm, 4 pm, and 8 pm, and they were required to eat everything provided to them and nothing else. They were provided 6 oz. of distilled, deionized water every 2 hours from 8 am until noon, followed by ad libitum water intake the rest of the day. Daily 24-hour urine collections were obtained throughout the course of the inpatient stay.
Biochemical analyses.
Details on biochemical analyses are described in the Supplemental Methods.
Statistical analysis.
The primary endpoint of this study was the AUC of FGF23 serum concentrations at 24–72 hours administration of either canagliflozin or placebo. Power calculations were performed prior to the study. A sample size of 25 subjects was calculated to provide 80% power at a 2-sided α level of 0.05 to detect a 30% increase in FGF23 AUC of (baseline AUC = 5,000 pg/ml × 48 hours; SD = 3,500 pg/ml × 48 hours) during the canagliflozin condition as compared with the placebo condition using a paired 2-tailed t test analysis of log10 AUC values. These power calculations assumed a drop-out rate of 25% and accounted for an interim analysis performed when 10 subjects had completed their baseline admission using the O’Brien-Fleming α-spending function.
A mixed-models trajectory analysis using a first-order autoregressive error structure for repeated measures was used to analyze data between canagliflozin and placebo conditions controlling for the actual time in hours (range: 0–108 hours) from the beginning of the study. A time × condition interaction term was also included in each mixed model to test for divergent trajectories over time, and it was then removed if its P value was greater than 0.05. All mixed models also included both sequence (canagliflozin → placebo vs. placebo → canagliflozin) and period (canagliflozin first vs. placebo first) terms to account for carryover effects. Data with a skewed distribution was log10-transformed before analyses to achieve a Gaussian distribution.
Based on results of the mixed-model analysis, a time-averaged response was calculated for each subject and each condition (canagliflozin or placebo) as the following: phosphorus and FGF23 (average of concentrations after 24, 26, 28, and 36 hours from the beginning of the study), 1,25 D (48, 52, 60 hours) and PTH (96, 98, 100, and 108 hours). With the exception of serum phosphorus, all concentrations were log10-transformed before averaging to achieve a Gaussian distribution, and resulting means were then back-transformed to the original unit (i.e., geometric means). Differences between conditions were expressed as fold change in the canagliflozin condition as compared with placebo condition. Correlations among responses were quantified by the Pearson’s correlation coefficient (r).
Statistical analyses were performed using SPSS (version 23; IBM). Data are presented as arithmetic mean ± SD or as geometric mean with its 95% CI, as indicated. The 95% CI implicitly incorporates 3 components of variation: (i) the interindividual variation of baseline, (ii) the interindividual variation in the magnitude of the circadian rhythm, and (iii) the interindividual variation of drug effect. In contrast, the paired 2-tailed t tests assessed whether there as a consistent intraindividual change in the value of the parameter.
A P < 0.05 for 2-tailed t test was used as the criterion for statistical significance for the study’s primary outcome measure (AUC for FGF23 at 24–72 hrs). In other cases, we have provided nominal P values without correcting for multiple comparisons.
Study approval.
The study was approved by the IRB of the NIDDK and registered at clinicaltrials.gov (NCT02404870). Written informed consent was obtained from all subjects.
Author contributions
JEB, MTC, SIT, and KIR were responsible for the design of the study protocol, data collection, analysis of the data, and writing of the manuscript. JEB, VB, EMC, and MTC conducted laboratory assays. MFW provided technical and laboratory support. PP conducted the statistical analysis. ECW contributed to the statistical design. SB and ABC contributed to the design of the diet plan and collection of dietary data. All authors contributed to the drafting and editing of this manuscript.
Supplementary Material
Acknowledgments
This work was supported by the Intramural Research Programs of the National Institute of Diabetes and Digestive and Kidney Diseases (NIDDK), NIDCR, and the Eunice Kennedy Shriver NICHD. We thank Marc L Reitman, Lee Weinstein, Rachel Gafni, Joseph Verbalis, Moshe Levi, James Balow, Jeffery Kopp, Phillip Gorden, and Brent Abel for helpful scientific discussions. Ranganath Muniyappa served as the data safety monitor. KIR, VB, EMC, PP, EW, and MFW received salary support from NIDDK, JEB received salary support from NICHD, MTC received salary support from NIDCR, and SB and ABC received salary support from NIH Clinical Center. SIT acknowledges funding from NIDDK (grants R21DK105401 and P30DK072488) and the American Diabetes Association (grant 1-16-ICTS-112). NIDDK reviewed and approved the manuscript for publication.
Version 1. 04/19/2018
Electronic publication
Footnotes
Conflict of interest: SIT is a consultant for Ionis Pharmaceuticals, has research support provided to University of Maryland School of Medicine by Regeneron Pharmaceuticals, and has ownership of stock in Celgene, Amgen, and Abbott Laboratories.
Reference information: JCI Insight. 2018;3(8):e99123. https://doi.org/10.1172/jci.insight.99123.
Contributor Information
Viviana Bauman, Email: bauman.viviana@gmail.com.
Paolo Piaggi, Email: paolo.piaggi@nih.gov.
Elizabeth C. Wright, Email: wrightel@niddk.nih.gov.
Shanna Bernstein, Email: shanna.bernstein@nih.gov.
Michael T. Collins, Email: mcollins@dir.nidcr.nih.gov.
Kristina I. Rother, Email: kristinar@intra.niddk.nih.gov.
Simeon I. Taylor, Email: staylor2@som.umaryland.edu.
References
- 1.Ferrannini E. Sodium-Glucose Co-transporters and Their Inhibition: Clinical Physiology. Cell Metab. 2017;26(1):27–38. doi: 10.1016/j.cmet.2017.04.011. [DOI] [PubMed] [Google Scholar]
- 2.Zinman B, et al. Empagliflozin, Cardiovascular Outcomes, and Mortality in Type 2 Diabetes. N Engl J Med. 2015;373(22):2117–2128. doi: 10.1056/NEJMoa1504720. [DOI] [PubMed] [Google Scholar]
- 3.Neal B, et al. Canagliflozin and Cardiovascular and Renal Events in Type 2 Diabetes. N Engl J Med. 2017;377(7):644–657. doi: 10.1056/NEJMoa1611925. [DOI] [PubMed] [Google Scholar]
- 4. FDA Drug Safety Communication: FDA revises label of diabetes drug canagliflozin (Invokana, Invokamet) to include updates on bone fracture risk and new information on decreased bone mineral density. Food and Drug Administration. http://www.fda.gov/Drugs/DrugSafety/ucm461449.htm Published September 10, 2015. Updated January 15, 2016. Accessed March 30, 2018.
- 5. FDA Drug Safety Communication: Interim clinical trial results find increased risk of leg and foot amputations, mostly affecting the toes, with the diabetes medicine canagliflozin (Invokana, Invokamet); FDA to investigate. Food and Drug Administration. https://www.fda.gov/Drugs/DrugSafety/ucm500965.htm Published May 18, 2016. Updated May 17, 2017. Accessed March 30, 2018.
- 6. FDA Drug Safety Communication: FDA revises labels of SGLT2 inhibitors for diabetes to include warnings about too much acid in the blood and serious urinary tract infections. Food and Drug Administration. Published December 4, 2015. Updated January 19, 2018. Accessed March 30, 2018. https://www.fda.gov/Drugs/DrugSafety/ucm475463.htm.
- 7.Kohan DE, Fioretto P, Tang W, List JF. Long-term study of patients with type 2 diabetes and moderate renal impairment shows that dapagliflozin reduces weight and blood pressure but does not improve glycemic control. Kidney Int. 2014;85(4):962–971. doi: 10.1038/ki.2013.356. [DOI] [PMC free article] [PubMed] [Google Scholar]
- 8.Watts NB, et al. Effects of Canagliflozin on Fracture Risk in Patients With Type 2 Diabetes Mellitus. J Clin Endocrinol Metab. 2016;101(1):157–166. doi: 10.1210/jc.2015-3167. [DOI] [PMC free article] [PubMed] [Google Scholar]
- 9.Bilezikian JP, et al. Evaluation of Bone Mineral Density and Bone Biomarkers in Patients With Type 2 Diabetes Treated With Canagliflozin. J Clin Endocrinol Metab. 2016;101(1):44–51. doi: 10.1210/jc.2015-1860. [DOI] [PMC free article] [PubMed] [Google Scholar]
- 10. FDA Briefing Document: Endocrine and Metabolic Drug Advisory Committee Meeting Empagliflozin. Food and Drug Administration. https://www.fda.gov/downloads/AdvisoryCommittees/UCM508422.pdf Published June 28, 2016. Accessed March 30, 2018.
- 11. Invokana and Invokamet (canagliflozin): Drug Safety Communication - New Information on Bone Fracture Risk and Decreased Bone Mineral Density. Food and Drug Administration. https://www.fda.gov/Drugs/DrugSafety/ucm461449.htm Access April 13, 2018.
- 12.Taylor SI, Blau JE, Rother KI. Possible adverse effects of SGLT2 inhibitors on bone. Lancet Diabetes Endocrinol. 2015;3(1):8–10. doi: 10.1016/S2213-8587(14)70227-X. [DOI] [PMC free article] [PubMed] [Google Scholar]
- 13.Becker GJ, Walker RG, Hewitson TD, Pedagogos E. Phosphate levels--time for a rethink? Nephrol Dial Transplant. 2009;24(8):2321–2324. doi: 10.1093/ndt/gfp220. [DOI] [PubMed] [Google Scholar]
- 14.el-Hajj Fuleihan G, Klerman EB, Brown EN, Choe Y, Brown EM, Czeisler CA. The parathyroid hormone circadian rhythm is truly endogenous--a general clinical research center study. J Clin Endocrinol Metab. 1997;82(1):281–286. doi: 10.1210/jcem.82.1.3683. [DOI] [PubMed] [Google Scholar]
- 15.Smith ER, Cai MM, McMahon LP, Holt SG. Biological variability of plasma intact and C-terminal FGF23 measurements. J Clin Endocrinol Metab. 2012;97(9):3357–3365. doi: 10.1210/jc.2012-1811. [DOI] [PubMed] [Google Scholar]
- 16.Lee JW, Chou CL, Knepper MA. Deep Sequencing in Microdissected Renal Tubules Identifies Nephron Segment-Specific Transcriptomes. J Am Soc Nephrol. 2015;26(11):2669–2677. doi: 10.1681/ASN.2014111067. [DOI] [PMC free article] [PubMed] [Google Scholar]
- 17.Dennis VW, Brazy PC. Sodium, phosphate, glucose, bicarbonate, and alanine interactions in the isolated proximal convoluted tubule of the rabbit kidney. J Clin Invest. 1978;62(2):387–397. doi: 10.1172/JCI109140. [DOI] [PMC free article] [PubMed] [Google Scholar]
- 18.Skeith MD, Healey LA, Cutler RE. Effect of phloridzin on uric acid excretion in man. Am J Physiol. 1970;219(4):1080–1082. doi: 10.1152/ajplegacy.1970.219.4.1080. [DOI] [PubMed] [Google Scholar]
- 19.Weir MR, Kline I, Xie J, Edwards R, Usiskin K. Effect of canagliflozin on serum electrolytes in patients with type 2 diabetes in relation to estimated glomerular filtration rate (eGFR) Curr Med Res Opin. 2014;30(9):1759–1768. doi: 10.1185/03007995.2014.919907. [DOI] [PubMed] [Google Scholar]
- 20.Burnett SM, Gunawardene SC, Bringhurst FR, Jüppner H, Lee H, Finkelstein JS. Regulation of C-terminal and intact FGF-23 by dietary phosphate in men and women. J Bone Miner Res. 2006;21(8):1187–1196. doi: 10.1359/jbmr.060507. [DOI] [PubMed] [Google Scholar]
- 21.Mirams M, Robinson BG, Mason RS, Nelson AE. Bone as a source of FGF23: regulation by phosphate? Bone. 2004;35(5):1192–1199. doi: 10.1016/j.bone.2004.06.014. [DOI] [PubMed] [Google Scholar]
- 22.Ito N, et al. Effect of acute changes of serum phosphate on fibroblast growth factor (FGF)23 levels in humans. J Bone Miner Metab. 2007;25(6):419–422. doi: 10.1007/s00774-007-0779-3. [DOI] [PubMed] [Google Scholar]
- 23.Shimada T, et al. FGF-23 is a potent regulator of vitamin D metabolism and phosphate homeostasis. J Bone Miner Res. 2004;19(3):429–435. doi: 10.1359/JBMR.0301264. [DOI] [PubMed] [Google Scholar]
- 24.Sheikh MS, Schiller LR, Fordtran JS. In vivo intestinal absorption of calcium in humans. Miner Electrolyte Metab. 1990;16(2-3):130–146. [PubMed] [Google Scholar]
- 25.Horwitz MJ, Tedesco MB, Sereika SM, Hollis BW, Garcia-Ocaña A, Stewart AF. Direct comparison of sustained infusion of human parathyroid hormone-related protein-(1-36) [hPTHrP-(1-36)] versus hPTH-(1-34) on serum calcium, plasma 1,25-dihydroxyvitamin D concentrations, and fractional calcium excretion in healthy human volunteers. J Clin Endocrinol Metab. 2003;88(4):1603–1609. doi: 10.1210/jc.2002-020773. [DOI] [PubMed] [Google Scholar]
- 26.Muskiet MH, van Raalte DH, van Bommel EJ, van Bommel E, Smits MM, Tonneijck L. Understanding EMPA-REG OUTCOME. Lancet Diabetes Endocrinol. 2015;3(12):928–929. doi: 10.1016/S2213-8587(15)00424-6. [DOI] [PubMed] [Google Scholar]
- 27.Perwad F, Azam N, Zhang MY, Yamashita T, Tenenhouse HS, Portale AA. Dietary and serum phosphorus regulate fibroblast growth factor 23 expression and 1,25-dihydroxyvitamin D metabolism in mice. Endocrinology. 2005;146(12):5358–5364. doi: 10.1210/en.2005-0777. [DOI] [PubMed] [Google Scholar]
- 28.Brenza HL, et al. Parathyroid hormone activation of the 25-hydroxyvitamin D3-1alpha-hydroxylase gene promoter. Proc Natl Acad Sci USA. 1998;95(4):1387–1391. doi: 10.1073/pnas.95.4.1387. [DOI] [PMC free article] [PubMed] [Google Scholar]
- 29. Kwon H. Canagliflozin: clinical efficacy and safety. FDA Endocrinology and Metabolic Drugs Advisory Committee Meeting. https://www.fda.gov/downloads/AdvisoryCommittees/CommitteesMeetingMaterials/Drugs/EndocrinologicandMetabolicDrugsAdvisoryCommittee/UCM334550.pdf Accessed April 13, 2018.
- 30.Blau JE, Tella SH, Taylor SI, Rother KI. Ketoacidosis associated with SGLT2 inhibitor treatment: Analysis of FAERS data. Diabetes Metab Res Rev. 2017;33(8):e2924. doi: 10.1002/dmrr.2924. [DOI] [PMC free article] [PubMed] [Google Scholar]
- 31.Polidori D, Iijima H, Goda M, Maruyama N, Inagaki N, Crawford PA. Intra- Inter-Subject Variability for Increases in Serum Ketone Bodies in Patients With Type 2 Diabetes Treated With the Sodium Glucose Co-transporter 2 Inhibitor Canagliflozin. Diabetes Obes Metab. doi: 10.1111/dom. [published online ahead of print February 14, 2018]. https://doi.org/10.1111/dom.13224. [DOI] [PMC free article] [PubMed] [Google Scholar]
- 32.Green J, Kleeman CR. Role of bone in regulation of systemic acid-base balance. Kidney Int. 1991;39(1):9–26. doi: 10.1038/ki.1991.2. [DOI] [PubMed] [Google Scholar]
- 33.Sha S, et al. Pharmacodynamic differences between canagliflozin and dapagliflozin: results of a randomized, double-blind, crossover study. Diabetes Obes Metab. 2015;17(2):188–197. doi: 10.1111/dom.12418. [DOI] [PMC free article] [PubMed] [Google Scholar]
- 34.Nauck MA. Update on developments with SGLT2 inhibitors in the management of type 2 diabetes. Drug Des Devel Ther. 2014;8:1335–1380. doi: 10.2147/DDDT.S50773. [DOI] [PMC free article] [PubMed] [Google Scholar]
- 35.Gutierrez O, et al. Fibroblast growth factor-23 mitigates hyperphosphatemia but accentuates calcitriol deficiency in chronic kidney disease. J Am Soc Nephrol. 2005;16(7):2205–2215. doi: 10.1681/ASN.2005010052. [DOI] [PubMed] [Google Scholar]
- 36. de Jong MA, et al. Effects of SGLT2 Inhibition on Fibroblast Growth Factor 23 and 25(OH) Vitamin D. American Society of Nephrology. https://www.asn-online.org/education/kidneyweek/2017/program-abstract.aspx?controlId=2784671 Accessed March 30, 2018.
- 37.Antoniucci DM, Yamashita T, Portale AA. Dietary phosphorus regulates serum fibroblast growth factor-23 concentrations in healthy men. J Clin Endocrinol Metab. 2006;91(8):3144–3149. doi: 10.1210/jc.2006-0021. [DOI] [PubMed] [Google Scholar]
- 38.Mifflin MD, St Jeor ST, Hill LA, Scott BJ, Daugherty SA, Koh YO. A new predictive equation for resting energy expenditure in healthy individuals. Am J Clin Nutr. 1990;51(2):241–247. doi: 10.1093/ajcn/51.2.241. [DOI] [PubMed] [Google Scholar]
- 39. What We Eat in America. United States Department of Agriculture. http://www.ars.usda.gov/services/docs.htm?docid=13793 Updated October 23, 2017. Accessed March 30, 2018.
- 40. Blau JE BV, Piaggi P, Collins MT, Taylor SI, Rother KI. Acute Effects of Canagliflozin, a Sodium Glucose Co-Transporter 2 (SGLT2) Inhibitor on Bone Metabolism. Clinical Trials. https://clinicaltrials.gov/ct2/show/NCT02404870 Accessed March 30, 2018.
Associated Data
This section collects any data citations, data availability statements, or supplementary materials included in this article.


