Abstract
Programmed cell death protein 1 (PD-1) is an immune checkpoint receptor that is upregulated on activated T cells to induce immune tolerance.1,2 Tumor cells frequently overexpress the ligand for PD-1, programmed cell death ligand 1 (PD-L1), facilitating escape from the immune system.3,4 Monoclonal antibodies blocking PD-1/PD-L1 have shown remarkable clinical efficacy in patients with a variety of cancers, including melanoma, colorectal cancer, non-small cell lung cancer, and Hodgkin’s lymphoma.5–9 Although it is well-established that PD-1/PD-L1 blockade activates T cells, little is known about the role that this pathway may have on tumor-associated macrophages (TAMs). Here we show that both mouse and human TAMs express PD-1. TAM PD-1 expression increases over time in mouse models, and with increasing disease stage in primary human cancers. TAM PD-1 expression negatively correlates with phagocytic potency against tumor cells, and blockade of PD-1/PD-L1 in vivo increases macrophage phagocytosis, reduces tumor growth, and lengthens survival in mouse models of cancer in a macrophage-dependent fashion. Our results suggest that PD-1/PD-L1 therapies may also function through a direct effect on macrophages, with significant implications for treatment with these agents.
The presence of TAMs correlates with poor prognosis in human cancers.10 However, recent work has demonstrated that macrophages can be induced to phagocytose tumor cells through SIRPα/CD47 blockade,11 and this therapeutic strategy is currently the subject of multiple clinical trials in cancer.12,13 Although SIRPα/CD47 may serve as a primary regulatory “checkpoint” on macrophages, other immune-regulatory receptors could serve a complementary or redundant role. The PD-1 receptor is one of the best-studied and most clinically successful immune checkpoint drug targets, but its primary function is widely understood to be in the regulation of T cells. However, given that macrophages have previously been reported to express PD-1 in the context of pathogen infection,14–17 we wondered whether macrophages might also express PD-1 in the tumor microenvironment, and if so, what consequences this expression might have on anti-tumor immunity.
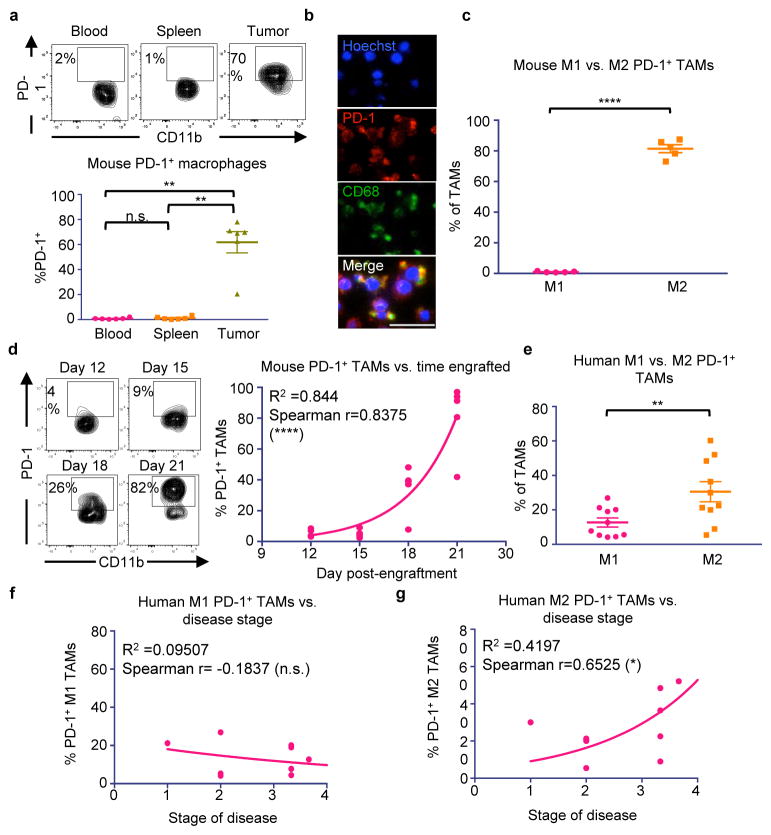
To assess PD-1 expression on TAMs in an immunocompetent syngeneic setting, we used the colon cancer line CT26. Fluorescence-activated cell sorting (FACS) of dissociated tumors 3 weeks post-engraftment showed that indeed, a high percentage of macrophages in the tumor expressed surface PD-1 (~50%), while in contrast, no circulating monocytes or splenic macrophages expressed detectable levels of PD-1 (Figure 1a. Gating strategy, Extended Data Figure 1). Immunofluorescence (IF) revealed a clear and abundant population of cells expressing both the macrophage marker CD68 and PD-1 (Figure 1b. No primary control, Extended Data Figure 2a), further confirming PD-1 expression on TAMs.
Figure 1. Mouse and human TAMs express high levels of PD-1.
a. Representative flow cytometry plots (top) and analysis (bottom) of CT26 tumors 3 weeks post-engraftment shows tissue-specific expression of PD-1 by TAMs (n=5. Paired one-way ANOVA with multiple comparisons correction). b. IF on FACS sorted CT26 TAMs shows PD-1 and CD68 double-positive cells (n=2. Representative images shown. 20× magnification, scale bar=20 μm. Red=PD-1, Green=CD68, Blue=Hoechst). c. Mouse PD-1+ TAMs from CT26 tumors are predominantly M2 (CD206+MHC IIlow/neg) rather than M1 (CD206−MHCIIhigh) (n=5. Paired one-tailed t-test). d. Representative flow cytometry plots (left) of the TAM population in CT26 tumors over time. Analysis (right) comparing day post-engraftment vs. % PD-1+ TAMs shows a correlation between time and PD-1 expression (n=20. Exponential growth equation is shown). e. Human TAMs from patient colorectal cancer samples express PD-1, and PD-1+ TAMs are predominantly M2 (CD206+CD64−) and not M1 (CD206−CD64+) (n=10. Paired one-tailed t-test). f. Patient disease stage vs. % PD-1+ M1 TAMs (n=10. Exponential growth equation is shown). g. Patient disease stage vs. % PD-1+ M2 TAMs (n=10. Exponential growth equation is shown). *p<0.05; **p<0.01; ***p<0.001; ****p<0.0001; n.s., not significant. Data are mean ± s.e.m.
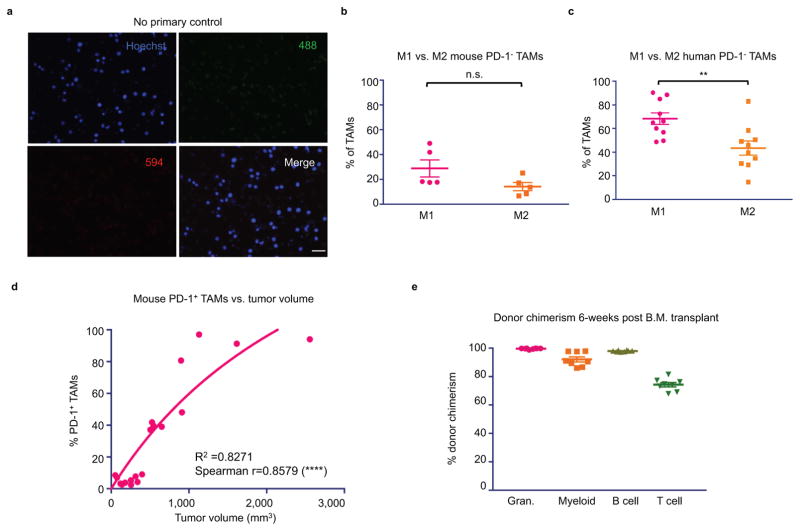
TAMs are often thought to polarize towards an inflammatory “M1” or protumor “M2” state, depending upon their environmental stimuli.18 Flow cytometry analysis revealed that virtually all PD-1+ TAMs expressed an M2-like surface profile (Figure 1c), while PD-1− TAMs trended towards expressing an M1-like profile (Extended Data Figure 2b). Further analysis of mouse CT26 tumors in syngeneic hosts revealed that this PD-1+ TAM population is not static; it begins to emerge circa 2 weeks post-engraftment, and increases over time (Figure 1d, left). We found that PD-1 expression correlated strongly with time post-engraftment (Figure 1d, right), as well as with tumor volume (Extended Data Figure 2d).
Given these observations in mice, we wondered whether human macrophages similarly express PD-1 in the primary tumor setting. Upon profiling the TAMs in human colorectal cancer samples, we saw high but variable PD-1 expression on human TAMs. Strikingly, we also observed that, just as in mice, the M2 population expressed significantly more PD-1 than the M1 population (Figure 1e), and that the PD-1- population was predominantly M1 in phenotype (Extended Data Figure 2c). Furthermore, the frequency of PD-1+ TAMs increased with disease stage, but only within the M2 subset (Figure 1f,g). These data from primary clinical samples suggest that, just as we observed in murine tumors, M2 PD-1+ TAMs likely accumulate over time in the tumor microenvironment in human cancer.
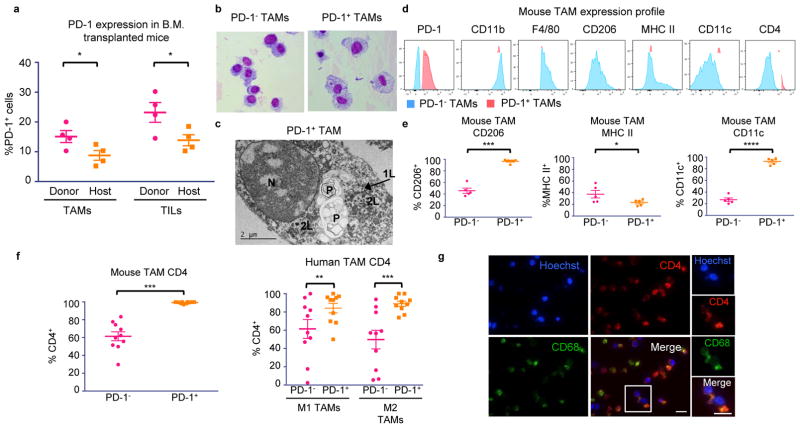
We hypothesized that this time-dependent increase in PD-1+ TAMs in both mice and humans could be mainly attributed to bone marrow-derived macrophages homing to the inflammatory tumor microenvironment, rather than from yolk sac-derived tissue-resident macrophages differentiating into PD-1+ cells. To investigate the origin of these cells, we performed a bone marrow (B.M.) transplant experiment. Donor B.M. from RFP+ C57BL/6 mice was engrafted into irradiated host GFP+ C57BL/6 mice. After 6 weeks, we verified engraftment by assessing donor chimerism in the myeloid (CD11b+), granulocyte (Gr1high), T cell (TCRβ+), and B cell (CD19+) compartments (Extended Data Figure 2e.) We then engrafted the B.M. transplanted mice with MC38 tumors, a colon cancer model syngeneic to the C57BL/6 background. After 3 weeks, a significantly higher fraction of both the PD-1+ TAMs and the PD-1+ tumor-infiltrating lymphocytes (TILs) were derived from donor RFP+ marrow (Figure 2a). This suggests that the majority of PD-1+ TAMs and TILs originate from circulating leukocytes, rather than from resident immune cells.
Figure 2. PD-1+ TAM characterization.
a. Transplant of RFP+ donor B.M. into GFP+ hosts shows that immune cells in the blood home to MC38 tumors and become PD-1+ (n=4. Paired one-tailed t-test). b. Giemsa staining of FACS sorted CT26 TAMs (n=3. Representative images shown). c. Electron microscopy on FACS sorted PD-1+ TAMs from CT26 tumors shows that these macrophages have rounded nuclei (N) with abundant heterochromatin. The cytoplasm contains primary (1L) and secondary lysosomes (2L) and two large phagosomes (P) (n=2. Representative image shown). d. Representative flow cytometry histograms showing expression of typical TAM markers in PD-1− vs. PD-1+ TAMs in CT26 tumors (n=5. Representative histograms shown). e. Analysis of TAM markers in PD-1− vs. PD-1+ subsets from CT26 tumors shows that PD-1+ TAMs express more CD206 (n=5. Paired one-tailed t-test), less MHC II, (n=5. Paired one-tailed t-test. p<0.05), and more CD11c (n=5. Paired two-tailed t-test). f. Mouse (left) and human (right) PD-1+ TAMs express higher CD4 than PD-1− TAMs (n=10. Paired two-tailed t-test). g. IF on FACS sorted TAMs from CT26 tumors confirms coexpression of CD4 and CD68 (n=2. Representative images shown. 20× magnification, scale bar=20 μm. Red=CD4, Green=CD68, Blue=Hoechst). *p<0.05; **p<0.01; ***p<0.001; ****p<0.0001; n.s., not significant. Data are mean ± s.e.m.
We further characterized the phenotype of PD-1+ TAMs by a variety of microscopy and flow cytometry-based techniques. Giemsa staining of FACS-sorted TAMs from dissociated CT26 tumors showed marked differences in their morphology. PD-1+ TAMs appeared large and foamy, in contrast to PD-1− TAMs, which were smaller and more monocytic in appearance (Figure 2b). Electron microscopy of these PD-1+ TAMs confirmed that this foamy appearance was in part due to the accumulation of abundant, uncleared phagocytic material and lysosomes within the cytoplasm (Figure 2c).
FACS analysis of typical TAM markers showed that PD-1+ and PD-1− TAMs from CT26 tumors express equivalent levels of CD11b and F4/80, but that PD-1+ TAMs express more of the M2-associated scavenger receptor CD206, less MHC class II, and more CD11c (Figure 2d,e). Surprisingly, virtually all PD-1+ TAMs and a high fraction of PD-1− TAMs expressed CD4, a marker typically associated with T cells, but also known to mark a subset of myeloid cells, including macrophages19–21 (Figure 2d,f). We confirmed coexpression of CD68 and CD4 on FACS-sorted TAMs by IF (Figure 2g. No primary control, Extended Data Figure 2a). Levels of CD4 were also higher on PD-1+ human TAMs in both the M1 and M2 subsets compared to their PD-1− counterparts (Figure 2f).
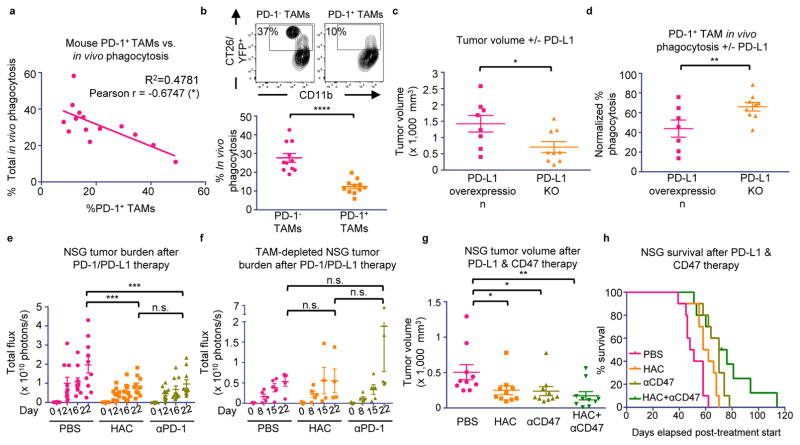
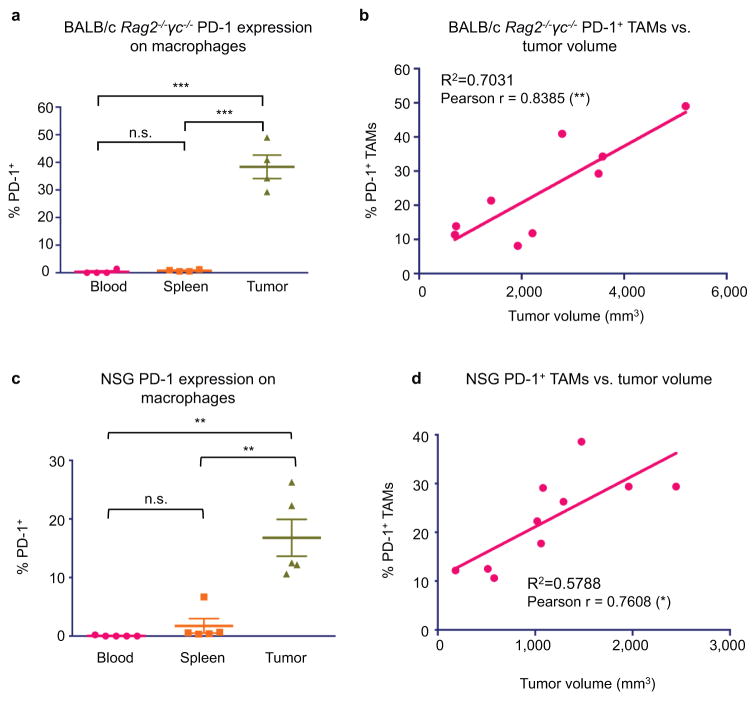
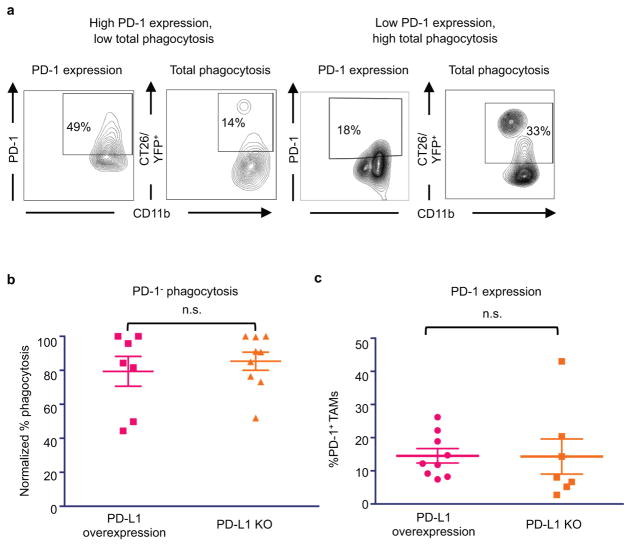
Beyond its role as a marker of a distinct macrophage subset, we hypothesized that PD-1 expression could affect TAM phagocytosis by curbing the effector functions of activated TAMs, analogous to the role it plays in the inhibition of stimulated T cells. To test this hypothesis, we FACS-sorted PD-1+ and PD-1− TAMs from CT26 tumors, and conducted an ex vivo phagocytosis assay with GFP+ Staphylococcus aureus bioparticles. PD-1+ TAMs showed a reduced degree of phagocytosis of S. aureus bioparticles as compared to the PD-1− TAMs (Extended Data Figure 3a–c), suggesting that the PD-1+ TAMs exist in a phagocytically repressed state. To further investigate this inhibition in vivo, we utilized immunocompromised BALB/c Rag2−/−γc−/− mice, which lack an adaptive immune system, to study TAM phagocytosis of fluorescent cancer cells. Like immunocompetent mice, BALB/c Rag2−/−γc−/− mice exhibit PD-1 expression specifically on TAMs (Extended Data Figure 4a), as well as a correlation between PD-1 expression and tumor volume (Extended Data Figure 4b). We generated two sub-lines of YFP+ CT26 cells, one with constitutive over-expression of PD-L1 (PD-L1 over-expressing) and the other deficient in PD-L1 (PD-L1 KO). First we engrafted PD-L1 over-expressing tumors, which should constitutively agonize PD-1 signaling, in BALB/c Rag2−/−γc−/− mice. We then assessed total phagocytosis levels in the tumor by analyzing the percentage of TAMs that were also YFP+ (Representative gates, Extended Data Figure 5a). As confirmation of our hypothesis regarding an inhibitory role for PD-1 on TAMs, we found that the frequency of PD-1 expression significantly and inversely correlated with total phagocytosis levels (Figure 3a). Furthermore, FACS analysis of PD-1− vs. PD-1+ TAMs showed that PD-1− TAMs phagocytosed significantly more than PD-1+ TAMs (Figure 3b).
Figure 3. PD-1/PD-L1 blockade promotes anti-tumor efficacy by TAMs.
a. % PD-1+ TAMs vs. total phagocytosis in PD-L1 overexpressing CT26/YFP+ tumors in BALB/c Rag2−/−γc−/− mice (n=14. Best fit line is shown). b. Representative flow cytometry plots (top) showing PD-1− vs. PD-1+ TAM phagocytosis gating. Analysis (bottom) shows a highly significant decrease in phagocytosis by PD-1+ TAMs compared to PD-1− TAMs (n=11. Paired one-tailed t-test). c. Comparison of tumor volume, CT26 PD-L1 KO tumors vs. CT26 PD-L1 overexpressing tumors in BALB/c Rag2−/−γc−/− mice (PD-L1 overexpressing, n=8; PD-L1 KO, n=9. Paired one-tailed t-test). d. PD-1+ TAMs phagocytose more in CT26 PD-L1 KO tumors than in CT26 PD-L1 overexpressing tumors (PD-L1 overexpressing, n=7; PD-L1 KO, n=9. Paired one-tailed t-test). e. Treatment of DLD-tg(PD-L1)-GFPluc+ tumors in NSG mice with either PD-1 blockade (anti-PD-1) or PD-L1 blockade (HAC protein) (n=10. Paired two-way ANOVA with multiple comparisons correction). f. TAM depletion ablates anti-tumor efficacy seen in (e) (n=5. Paired two-way ANOVA with multiple comparison correction). g. Treatment of DLD-tg(PD-L1)-GFPluc+ tumors in NSG mice with both PD-L1 blockade (HAC protein), CD47 blockade (anti-CD47), and combination therapy (n=10. Unpaired one-way ANOVA without multiple comparison correction). h. Survival analysis of mice in (g) (n=10. One-tailed log-rank Mantel-Cox test. PBS vs. HAC, p<0.01; PBS vs. anti-CD47, p<0.001; PBS vs. combo, p<0.0001; HAC vs. anti-CD47, p<0.05; HAC vs. combo; p<0.05; anti-CD47 vs. combo, p=0.0761). *p<0.05; **p<0.01; ***p<0.001; ****p<0.0001; n.s., not significant. Data are mean ± s.e.m.
To determine whether this decrease in phagocytosis could be reversed with removal of the ligand PD-L1, we engrafted PD-L1 over-expressing and PD-L1 KO tumors in BALB/c Rag2−/−γc−/− mice. After 3 weeks, tumors in the PD-L1 KO group were significantly smaller than tumors with PD-L1 overexpression (Figure 3c), supporting the hypothesis that PD-1/PD-L1 antagonism enhances myeloid anti-tumor efficacy. Upon analyzing phagocytosis levels by both PD-1− and PD-1+ TAMs, we saw that, as expected, removal of PD-L1 had no effect on phagocytosis by PD-1- macrophages (Extended Data Figure 5b). In contrast, PD-L1 KO significantly augmented phagocytosis by PD-1+ macrophages (Figure 3d). PD-L1 KO did not directly affect the percentage of PD-1+ TAMs (Extended Data Figure 5c).
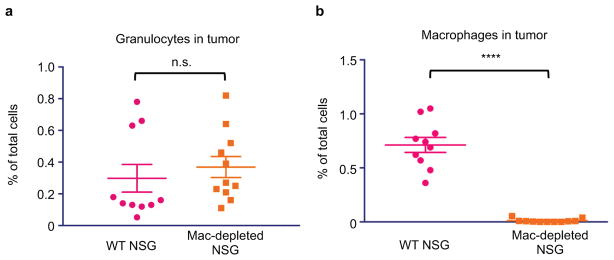
The decrease in tumor burden and increase in PD-1+ TAM phagocytosis upon PD-L1 removal suggests that the PD-1/PD-L1 pathway specifically inhibits TAM function. To demonstrate that this enhancement of TAM anti-tumor immunity could be modulated by therapeutic blockade of the PD-1/PD-L1 interaction, we treated immunocompromised mice with either a PD-1 blocker (anti-mouse PD-1 antibody), or a PD-L1 blocker (HAC, an engineered small protein with human PD-L1 blocking activity).22 Previous reports have suggested that murine and human tumor cells can acquire expression of the PD-1 receptor to drive tumor growth,23 so to eliminate the possibility that an anti-mouse PD-1 antibody could elicit an anti-tumor effect by binding to PD-1 on the cancer cells rather than on the macrophages, we used a human colon cancer xenograft model, DLD-1, which could not express mouse PD-1. We engrafted constitutively PD-L1 and GFP-luciferase expressing DLD cells into NOD.Cg-Prkdcscid Il2rgtm1Wjl/SzJ (NSG) mice, an immunocompromised strain with improved engraftment of human cells as compared to Rag2−/−γc−/− mice. These cells should continually agonize TAM mouse PD-1 signaling,24 an effect that should be blocked by administration of the anti-mouse PD-1 antibody, or the anti-human PD-L1 small protein, HAC. As expected, NSG mice engrafted with these DLD-tg(PD-L1)-GFPluc+ tumors exhibited tumor-specific PD-1 expression on TAMs (Extended Data Figure 4c), and shared the previously observed correlation between PD-1 expression and tumor volume (Extended Data Figure 4d). Mice treated with either PD-1 blockade (anti-mouse PD-1 antibody) or PD-L1 blockade (HAC) had an equivalent and significant reduction in tumor growth (Figure 3e). TAM depletion (See Methods for TAM depletion protocol. Extended Data Figure 6a,b) abrogated the effects that HAC and anti-PD-1 treatment had on tumor size (Figure 3f). These treatment experiments demonstrate that specific inhibition of the PD-1/PD-L1 axis in TAMs is responsible for the anti-tumor efficacy that we observed. This effect cannot be due to Fc-mediated phagocytosis of PD-L1+ cancer cells,25 as HAC lacks an Fc-domain,22 and can therefore be attributed to specific blockade of the PD-L1 pathway.
Given that patients in early clinical trials are already receiving anti-CD47 therapy, and that this therapeutic strategy will likely combined with PD-1/PD-L1 blockade, we sought to determine how PD-1/PD-L1 therapies might interact with anti-CD47 in the context of macrophage-mediated immunotherapy. We conducted another treatment study using the same DLD xenograft in NSG mice, with four treatment groups (PBS, HAC, anti-CD47, HAC+anti-CD47). Both HAC and anti-CD47 monotherapies were able to equivalently reduce tumor size, with tumors in the combination HAC+anti-CD47 group trending towards the greatest reduction (Figure 3g). This enhancement in anti-tumor efficacy also had an effect on survival, with both HAC and anti-CD47 monotherapy groups living significantly longer than the PBS control (Figure 3h). Combination therapy trended towards increasing survival more than either monotherapy (Figure 3h).
The data presented here demonstrate that both murine and human TAMs express high levels of PD-1, and that PD-1 increases with stage of disease. PD-1 expression on TAMs correlates with decreased phagocytosis, but PD-L1 removal increases PD-1+ TAM phagocytosis in vivo and decreases tumor burden, suggesting that TAM function can be rescued. PD-1 expression inhibits numerous immune cell subsets in the tumor microenvironment, including T cells, B cells,26 NK cells,27 and dendritic cells.28 We can now expand this to include macrophages, suggesting that PD-1 expression is a global mechanism for curbing immunity across the innate and adaptive immune system. Given that cancer patients now routinely receive anti-PD-1/PD-L1 therapies, the effects of PD-1 blockade on macrophages in human cancer should not be neglected, as they may illuminate novel disease indications or treatment combinations. As one example, anti-PD-1 agents have proven highly effective against Hodgkin’s lymphoma, despite heterogeneous PD-1 expression on TILs29 and frequently compromised surface expression of MHC class I on tumor cells,30 potentially precluding a T cell mediated mechanism for anti-tumor efficacy. This discordance could in part be explained by a macrophage-mediated anti-tumor effect in Hodgkin’s lymphoma that is enabled by PD-1/PD-L1 blockade.
METHODS
Statistics note
One-tailed p values were calculated whenever a hypothesis had been made before the experiment, and two-tailed p values when a hypothesis was not determined beforehand. Variance was similar between groups compared statistically.
Cell lines
The murine colon carcinoma cell lines CT26 and MC38, and the human colon carcinoma cell line DLD-1, were purchased from ATCC. CT26-tg(hPD-L1)-Δ(mPD-L1) and CT26-Δ(mPD-L1) cells (engineering strategy described previously22) were infected with YFP-luciferase retrovirus to generate CT26-tg(hPD-L1)-Δ(mPD-L1)-YFPluc+ and CT26-Δ(mPD-L1)-YFPluc+ cells. After 72 hrs, infected cells were expanded and FACS sorted to generate uniformly YFP+ populations. DLD-tg(hPD-L1)-GFPluc+ cells were generated by transducing DLD cells with lentivirus for constitutive, EF1A-driven expression of hPD-L1, as well as lentivirus for GFP-luciferase. All cells were cultured in a humidified, 5% CO2 incubator at 37°C, and grown in RPMI or DMEM+10% fetal bovine serum (FBS)+100 U/mL penicillin/streptomycin (Life Technologies). All cell lines were tested for mycoplasma contamination.
Ex vivo pHrodo green Staphylococcus aureus phagocytosis assay
20,000 FACS sorted PD-1− and PD-1+ TAMs were plated in an ultra-low attachment 96-well plate (Corning) for 15–20 minutes at 37°C to allow them to rest after sorting. TAMs were then spun down at 1200 g, 5 min, 4°C, and resuspended in 100 μL pHrodo Green S. aureus bioparticles (ThermoFisher) as per the manufacturers instruction. After 2 hours incubation at 37°C, TAMs were spun down and restained with F4/80 in the same fluorescent channel as sorted on, and the phagocytosis assay was subsequently analyzed by flow cytometry. TAMs that were GFP high were considered to be phagocytosing.
Protein expression and purification
High-affinity PD-1 protein (HAC) was produced as described previously.22
Mice
BALB/c mice were purchased from Jackson Laboratory. BALB/c Rag2−/−γc−/−, NOD.Cg-Prkdcscid Il2rgtm1Wjl/SzJ (NSG), RFP+ C57BL/6, and GFP+ C57BL/6 mice were obtained from in-house breeding stocks. All experiments were carried out in accordance with guidelines set by the Stanford University Administrative Panel on Laboratory Animal Care. Investigators were not blinded for animal studies.
FACS of mouse macrophages
Circulating blood samples were taken by cardiac puncture, and harvested into blood collection tubes (Terumo) to prevent clotting. Blood cells were lysed in ACK lysis buffer (Invitrogen) for 10 min, filled with PBS to stop reaction, and spun down for 5 min, 4°C, 1200 rpm. Samples were resuspended in FACS buffer (PBS+2% FBS) for staining. Splenic samples were isolated by dissociating spleens over a 100 μm filter, and then washing in FACS buffer. After spinning down for 5 min, 4°C, 1200 rpm, blood cells were lysed as above, and the finished splenic sample resuspended in FACS buffer. Tumors were resected from mice and mechanically dissociated with a straight-edge razor and then digested with 5–10 mL HBSS+Ca/Mg (Corning)+10 μg/mL DNase I (Sigma Aldrich)+25 μg/mL Liberase (Roche) for 30 min at 37°C, mixed by pipetting every 10 min. After dissociation, tumor suspensions were filtered through a 70 μm filter, put on ice, washed with cold PBS, and spun down for 5 min, 4°C, 1200 rpm. Sample blood cells were lysed as above, and then samples were resuspended in FACS buffer and blocked with 1 μg/106 cells rat serum IgG (Sigma) for 15 minutes before staining with antibody panel. Antibody panels were constructed as listed below, with clones used listed in Table 1 (see Supplemental Information). Photomultiplier tube (PMT) voltages were set with fully stained samples, and compensations were performed with single-stained UltraComp eBeads (Affymetrix) or cells. For all channels, positive and negative cells were gated from Fluorescence Minus One controls (FMOs), and PD-1 was gated from an appropriate isotype control.
Mouse TAM Panels:
Immunocompetent mouse TAMs: Hoechst−, CD45+, CD8a−, CD19−, Ter119−, TCRβ−, CD11b+, F4/80+
Immunocompromised mouse TAMs: Hoechst−, CD45+, Gr1low/neg, CD11b+, F4/80+
M1 mouse TAMs: Hoechst−, TCRβ−, CD11b+, F4/80+, CD206−, MHC II+
Note: TAMs that did not adhere to either of these expression profiles were not classified as M1 vs M2.
M2 mouse TAMs: Hoechst−, TCRβ−, CD11b+, F4/80+, CD206+, MHC IIlow/neg
Human samples
The Human Immune Monitoring Center Biobank received IRB approval to obtain patient colorectal cancer samples, and obtained informed consent from all patients.
Cryopreservation of human colorectal cancer samples
The Human Immune Monitoring Center Biobank carried out colorectal cancer sample preservation as follows. Following a surgical procedure, cancer samples were finely minced with razor blades, then incubated for 15 minutes at RT in PBS+6.5 mM dithiothreitol (DTT) to remove mucus. Samples were then washed with Hank’s Balanced Salt Solution (HBSS) to remove DTT, and centrifuged at 1500 rpm, 5 min, 4°C. Pellets were then resuspended in RPMI+200 U/mL collagenase type III (Worthington)+100 U/mL DNase I (Worthington), and incubated at 37°C for 2 hours. The suspensions were mixed by pipetting, and filtered over a 70 μm and then a 40 μm filter. Samples were spun down, and blood cells lysed with ACK buffer for 5 minutes at RT, then washed with cold PBS and spun down. Samples were then resuspended in 90% FBS+10% DMSO, aliquoted into cryovials and frozen.
FACS of human macrophages
Cryopreserved colorectal cancer samples were dethawed rapidly in a 37°C water bath, washed with PBS, and then spun down for 5 min, 4°C, 1200 rpm. Cells were blocked with 1 μg/106 cells αCD32 for 15 minutes on ice, before being stained with antibody panel below. Photomultiplier tube (PMT) voltages were set with fully stained samples, and compensations were performed with single-stained UltraComp eBeads (Affymetrix) or cells. For all channels, positive and negative cells were gated from Fluorescence Minus One controls (FMOs), and PD-1 was gated from an appropriate isotype control.
Human TAM panels:
M1 human TAMs: Hoechst−, CD45+, TCRα/β−, CD11b+, CD64+, CD206−
M2 human TAMs: Hoechst−, CD45+, TCRα/β−, CD11b+, CD64−, CD206+
Human colorectal cancer staging analysis
Pathology reports for human colorectal cancer patients were obtained and deidentified, according to Stanford IRB protocols. Disease stage was converted to a number scale as shown in Table 2 (see Supplemental Information). Stage of disease was plotted on a number scale vs. PD-1 expression on human TAMs.
Syngeneic tumor models
6–8 week old female or male BALB/c mice were shaved on their lower back and engrafted with CT26 colon carcinoma cells by subcutaneously injecting 1×10⁶ cells in a 100 μL suspension, consisting of 25% Matrigel Basement Membrane Matrix (Corning)+75% RPMI (Life Technologies). For B.M. transplant model, 6-week post-transplant C57BL/6 mice were engrafted with MC38 colon carcinoma cells by the same method. Tumors were used for FACS and immunofluorescence (IF) between 13–30 days, before reaching 2.5 cm in diameter. Tumors were measured with digital calipers and approximated as ellipsoids with two radii, x and y, where x is the largest measurable dimension of the tumor and y is the dimension immediately perpendicular to x, using the formula: Volume = (4/3) * (π) * (x/2)2 * (y/2).
Bone marrow (B.M.) transplant model
4–6 week old GFP+ C57BL/6 mice were irradiated with 50 rads/min prior to transplantation. Following irradiation, 4–6-week old RFP+ C57BL/6 mice were euthanized and their bone marrow harvested from tibia and femurs. Briefly, bones were crushed, and bone marrow was resuspended in PBS and passed over a 70 μm filter. After centrifugation at 1200 rpm, 5 minutes, 4°C, the blood cells were lysed using ACK lysis buffer for 5 minutes at RT, then spun down again. Following lysis, remaining cells were again passed over a 70 μm filter, counted, and resuspended at 1e6 cells/100 μL in PBS for transplantation. Irradiated host GFP+ mice were transplanted with 1e6 cells via retro orbital injection. 6 weeks later, host mice were bled to assess donor chimerism using FACS. Once donor chimerism was confirmed, mice were engrafted subcutaneously with the MC38 cell line, as described above in “syngeneic tumor models” methods. To determine % PD-1+ TAMs and TILs, gating was as follows:
PD-1+ Donor TAMs: Hoechst−, RFP+, TCRβ−, CD11b+, F4/80+, PD-1+
PD-1+ Donor TILs: Hoechst−, RFP+, TCRβ+, PD-1+
PD-1+ Host TAMs: Hoechst−, GFP+, TCRβ−, CD11b+, F4/80+, PD-1+
PD-1+ Host TILs: Hoechst−, GFP+, TCRβ+, PD-1+
Immunocompromised in vivo phagocytosis analysis
For in vivo phagocytosis analysis, BALB/c Rag2−/−γc−/− mice were engrafted with either 2.5×10⁴ CT26-tg(hPD-L1)-Δ(mPD-L1)-YFPluc+ or CT26-Δ(mPD-L1)-YFPluc+ cells by subcutaneously injecting 1×10⁶ cells in a 100 μL suspension, consisting of 25% Matrigel Basement Membrane Matrix (Corning)+75% RPMI (Life Technologies). Any mice with non-engrafting tumors were removed from study. Tumors were allowed to grow for 21 days, at which point tumor volumes were measured, and outliers in each group were removed using Prism Outlier Calculator (http://graphpad.com/quickcalcs/Grubbs1.cfm). PD-1− and PD-1+ TAM phagocytosis were determined by FACS, with phagocytosis considered to be YFP+ TAMs (see Figure 3b for example gating). Outliers for phagocytosis were removed. Phagocytosis between repeated experiments was normalized by comparing raw phagocytosis values to the maximum phagocytosis in each experimental cohort.
Immunocompromised tumor treatment studies
6–8 week old male NSG mice were engrafted with 5×10⁴ DLD-tg(hPD-L1)-GFPluc+ cells. Day 5 post-engraftment, tumor total flux (photons/sec) was quantified using bioluminescence imaging (BLI). Outliers were removed, and mice were randomized into groups such that each treatment group would have similar average total flux values. Mice were treated intraperitoneally for 21 (HAC vs αPD-1 study) or 28 days (HAC +/− αCD47 study). Treatment conditions were PBS (daily), 250 μg HAC (daily), 250 μg αPD-1 (clone 29F.1A12, BioXCell; daily), and 250 μg αCD47 (clone B6.H12, BioXCell; every other day). BLI measurements or caliper measurements were taken periodically to assess tumor growth. For survival analysis, mice were considered “dead” when tumor diameter reached 2.0 cm, in accordance with our APLAC protocols.
Generation of NSG-Ccr2RFP/RFP mice (NSG-Ccr2−/− mice)
Male Ccr2RFP/RFP mice31 were purchased from Jackson Lab (Bar Harbor, ME, USA) and mated with female NSG mice. The heterozygous males of the first generation carrying the X-chromosomal Il2rg mutation were used for the next backcrossing to female NSG mice. This cross yielded a small number of Ccr2 RFP/wt Il2rg−/− Prkdcscid/scid SirpaNOD/NOD mice. The positive mice were intercrossed to yield NSG-Ccr2RFP/RFP mice. Primers (in 5′-3′ direction) used for genotyping with resulting amplification products are listed in Table 3 (see Supplemental Information). For genotyping the Prkdc-Scid mutation, the protocol by Maruyama et al.32 was used. A representative agarose gel electrophoresis plot after PCR amplification is shown in Figure A (see Supplemental Information). Sirpα polymorphisms have been shown to be of high importance for successful xenografting.33 To discriminate between NOD and C57BL/6 Sirpa, a restriction fragment length polymorphism analysis was established. Briefly, Sirpa exon 2 was sequenced, restriction sites mapped, PCR amplified, and the resulting fragment digested with restriction enzyme Bsh1236I (FastDigest, ThermoFisher, MA, USA), which specifically cuts the NOD-Sirpα amplicon into two fragments (290 bp/112 bp), whereas the C57Bl/6 Sirpα amplicon remains undigested. Further, absence of T-, B- and NK cells in established NSG-Ccr2RFP/RFP mice was verified by FACS analysis of PBMCs from NSG-Ccr2RFP/RFP and NSG control mice using antibodies against CD3, CD19 and NK1.1 (all Biolegend, San Diego, CA, USA).
In vivo macrophage depletion treatment study
To deplete macrophages in the tumor, NSG-Ccr2−/− mice, which lack deficient Ccr2 signalizing, were treated with αCSF1R as per MacDonald et al.34 Mice were pre-treated for 2 weeks with 400 μg αCSF1R (clone BE0213, BioXCell; Mon, Wed, Frid). After two weeks, DLD-tg(hPD-L1)-GFPluc+ tumors were engrafted subcutaneously, and treatment was initiated as above in “immunocompromised tumor treatment studies” section, with αCSF1R depletion sustained throughout tumor engraftment and treatment. Mice were treated for 21 days as above, with PBS, HAC, or αPD-1. BLI measurements were taken periodically to assess tumor growth. After 21 days, mice were euthanized and infiltrating granulocytes (CD45+, Gr1high) and TAMs (CD45+, Gr1low/neg, CD11b+, F4/80+) were assessed to ensure macrophage depletion.
Immunofluorescence (IF) on cytospinned TAMs
FACS-sorted TAMs were cytospinned onto glass slides at1000 rpm, 5 min. Slides were dried 10 minutes, and then immediately fixed in 4% paraformaldehyde (PFA) for 15 minutes at room temperature. Slides were rinsed briefly in PBS to remove PFA, and then permeabilized in cold methanol for 10 minutes at 4°C. Methanol was rinsed off with PBS, and slides were dried 5 minutes. Slides were blocked overnight at 4°C with blocking buffer (PBS+5% goat serum+0.2% Triton X-100+1% DMSO). The next day, TAMs were stained first with primary antibodies (see Table 1 in Supplemental Information for clones used) at 1:100 dilution in blocking buffer for 2+ hours. Slides were then washed twice with PBS, and incubated with secondary antibodies conjugated to Alex Fluor 594 or 488, at 1:1000 concentration, 1–2 hours at 4°C. Slides were washed once with PBST and three times with PBS before nuclear staining with Hoechst 33342 (Life Technologies), for two minutes, washed in PBS, dried, and then imaged.
Giemsa staining on cytospinned TAMs
TAMs were cytospinned onto glass slides as above, and immediately fixed in methanol for 30 seconds at room temperature. Slides were dried for 10 minutes, and then stained with Giemsa for 20 minutes at room temperature. Excess Giemsa was rinsed off with water, and slides dried before imaging.
Electron microscopy on TAMs
PD-1+ TAMs from CT26 tumors were sorted and fixed in Karnovsky’s fixative [2% Glutaraldehyde (EMS)+4% PFA (EMS)+0.1M Sodium Cacodylate (EMS) pH 7.4] for 1 hr, chilled and sent to Stanford’s Cell Sciences Imaging Facility on ice. The samples were allowed to warm to RT in cold 1% Osmium tetroxide (EMS) for 1 hr rotating in a hood, washed three times with ultrafiltered water, then en bloc stained overnight in 1% Uranyl Acetate at 4°C while rotating. Samples were then dehydrated in a series of ethanol washes for 30 minutes each at 4°C beginning at 50%, 70%, 95% where the samples were then allowed to rise to RT, changed to 100% two times, then Propylene Oxide (PO) for 15 min. Samples were infiltrated with EMbed-812 resin (EMS) mixed 1:2, 1:1, and 2:1 with PO for 2 hrs each, leaving samples in 2:1 resin to PO overnight rotating at RT in the hood. The samples were then placed into EMbed-812 for 2 to 4 hours then placed into molds with labels and fresh resin, orientated and placed into 65° C oven overnight. Sections were taken between 75 and 90 nm, picked up on formvar/Carbon coated slot Cu grids, stained for 30 seconds in 3.5% Uranyl Acetate + 50% Acetone followed by staining in 0.2% Lead Citrate for 3 minutes. Samples were observed in the JEOL JEM-1400 120kV and photos were taken using a Gatan Orius 832 4k X 2.6k digital camera with 9 μm pixel size.
Analysis of electron microscopy images
Primary lysosomes were identifiable as cytoplasmic dark spherical bodies (0.2 – 0.4 μm) and new secondary lysosomes seen as larger membrane-bound vesicles often containing these same dark bodies along with other material. Phagosomes are seen as membrane-bound vesicles with a peripheral clearing around the contained material.
Extended Data
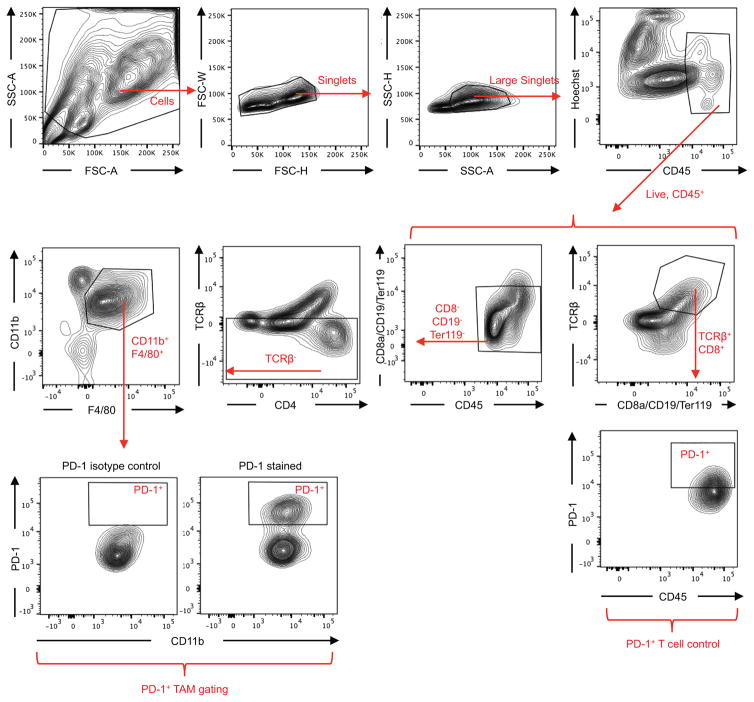
Extended Data Figure 1. FACS gating strategy for TAMs.
Debris and doublets were removed, then TAMs were assessed as DAPI−CD45+CD8a−CD19−Ter119−TCRβ−CD11b+F4/80+. TAM PD-1 gating is shown as well, based on PD-1 isotype control. All other gates were determined from fluorescence minus one controls (FMOs). T cells, gated as DAPI−CD45+TCRβ+CD8a+, are shown as PD-1+ positive control.
Extended Data Figure 2. TAM characterization.
a. No primary control for IF images is shown. Cytospinned TAMs were stained with fluorescently-conjugated secondary only (20× magnification, Scale bar=20 μm. Red=594, Green=488, Blue=Hoechst). b. Mouse PD-1− TAMs trend towards an M1 (CD206−MHCIIhigh) expression profile, rather than M2 (CD206+MHC IIlow/neg). TAMs that did not adhere to either of these expression profiles were not classified as M1 vs M2 (n=5. Paired one-tailed t-test). c. Human PD-1- TAMs are predominantly M1 (CD206−CD64+) rather than M2 (CD206+CD64−) (n=10. Paired one-tailed t-test). d. In mice, comparing tumor volume vs. % PD-1+ TAMs shows a highly significant correlation between tumor size and PD-1 expression (n=20. Exponential growth equation is shown). e. Donor chimerism 6-weeks post B.M. transplant. [Granulocytes (Gr1high), 99%; myeloid (CD11b+), 92%; B cell (CD19+), 97%; T cell (TCRβ+), 74%.] *p<0.05; **p<0.01; ***p<0.001; ****p<0.0001; n.s., not significant. Data are mean ± s.e.m.
Extended Data Figure 3. Ex vivo phagocytosis assay with FACS-sorted TAMs.
Sorted PD-1− and PD-1+ TAMs from CT26 tumors were assayed with pHrodo green Staphylococcus aureus bioparticles. These particles are GFPlow at neutral pH, and GFPhigh in the acidic phagosome. a. Representative histogram showing difference in GFP fluorescence of PD-1− vs PD-1+ TAMs in phagocytosis assay, and in comparison to S. aureus bioparticles alone. Bioparticles alone are clearly GFPlow, but have an obvious upshift in fluorescence when they are phagocytosed. b. Representative histograms showing flow cytometry gating strategy for phagocytosis by PD-1− and PD-1+ TAMs. GFPhigh TAMs were considered to be phagocytosing. c. Analysis of phagocytosis shows that PD-1+ TAMs phagocytosed significantly less than PD-1− TAMS (n=4. Paired one-tailed t test). *p<0.05; **p<0.01; ***p<0.001; ****p<0.0001; n.s., not significant. Data are mean ± s.e.m.
Extended Data Figure 4. Immunocompromised mice also exhibit tumor-specific expression of PD-1 on macrophages.
a. Analysis of PD-L1 overexpressing CT26/YFP+ tumors in BALB/c Rag2−/−γc−/− mice shows that TAMs specifically express PD-1 (n=4. Paired one-way ANOVA with multiple comparisons correction). b. Comparing BALB/c Rag2−/−γc−/− tumor volume vs. % PD-1+ TAMs shows a highly significant correlation between tumor volume and PD-1 expression (n=9. Best fit line is shown). c. Analysis of DLD-tg(hPD-L1)-GFPluc+ tumors shows that TAMs specifically express PD-1 (n=5. Paired one-way ANOVA with multiple comparisons correction). d. Comparing NSG tumor volume vs. % PD-1+ TAMs shows a highly significant correlation between tumor volume and PD-1 expression (n=10. Best fit line is shown). *p<0.05; **p<0.01; ***p<0.001; ****p<0.0001; n.s., not significant. Data are mean ± s.e.m.
Extended Data Figure 5. In vivo phagocytosis analysis.
a. Representative FACS plots showing gating strategy for in vivo phagocytosis. Here, total phagocytosis was analyzed by first gating on TAMs, and then gating on YFP+ cells. Total TAM PD-1 expression from the same tumor sample is shown side by side to demonstrate that high PD-1 expression inversely correlates with phagocytosis. b. Analysis of PD-1− TAM phagocytosis shows that presence or absence of PD-L1 does not affect PD-1− TAM phagocytosis (PD-L1 overexpressing, n=7; PD-L1 KO, n=9. Paired one-tailed t test). c. TAM PD-1 expression is not affected by presence or absence of PD-L1 (PD-L1 overexpressing, n=7; PD-L1 KO, n=9. Paired one-tailed t test). *p<0.05; **p<0.01; ***p<0.001; ****p<0.0001; n.s., not significant. Data are mean ± s.e.m.
Extended Data Figure 6. In vivo TAM depletion.
TAMs were depleted with anti-CSF1-R treatment in NSG-Ccr2−/− mice. a. TAM depletion protocol does not affect number of granulocytes (Gr1high) in DLD-tg(PD-L1)-GFPluc+ tumors (n=10. Unpaired one-tailed t test). b. TAM depletion protocol eliminates virtually all TAMs in tumors (n=10. Unpaired one-tailed t test). *p<0.05; **p<0.01; ***p<0.001 ****p<0.0001; n.s., not significant. Data are mean ± s.e.m.
Supplementary Material
Acknowledgments
The authors would like to thank S. Karten for assistance in editing the manuscript; and A. McCarty, T. Storm, and T. Naik for technical support. Research reported in this publication was supported by the D. K. Ludwig Fund for Cancer Research (to I.L.W.); the A.P. Giannini Foundation and the Stanford Dean’s Fellowship (to M.N.M.); the Stanford Medical Scientist Training Program NIH-GM07365 (to B.M.G., B.W.D., and J.M.T.); a Cancer Research Institute Irvington Fellowship (to R.L.M.); and a Swiss National Science Foundation fellowship P300P3_155336 (to G.H.) The project described was supported, in apart, by ARRA Award Number 1S10RR026780-01 from the National Center for Research Resources (NCRR). Its contents are solely the responsibility of the authors and do not necessarily represent the official views of the NCRR or the National Institutes of Health.
Footnotes
Author Contributions: S.R.G. wrote the manuscript. S.R.G., R.L.M., M.N.M., A.M.R., and I.L.W. conceived of and designed all experiments. S.R.G. performed TAM staining., made HAC protein and conducted all in vivo studies, phagocytosis assays, and analysis. B.W.D. and R.S. helped with FACS gating and TAM analysis. G.H. generated NSG Ccr2−/− mice. B.M.G. conducted B.M. transplant. S.R.G., R.L.M., and M.N.M. generated cell lines. R.G. acquired human colon cancer samples. J.M.T. taught IF protocol. D.C. and A.J.C. characterized foamy TAMs. R.L.M. and I.L.W. supervised the research and edited the manuscript.
Conflicts of interest: S.R.G., R.L.M., M.N.M., A.M.R., and I.L.W. are inventors on a patent (15/502,439) related to the HAC protein. S.R.G. and M.N.M. provide paid consulting services to Ab Initio Biotherapeutics, Inc., which licensed this patent. R.L.M. and A.M.R. are founders of Ab Initio Biotherapeutics, Inc.
Data availability: The data that support the findings of this study are available from the corresponding author upon reasonable request. Source data is available for all figures in the online version of the manuscript.
References
- 1.Nishimura H, Nose M, Hiai H, Minato N, Honjo T. Development of lupus-like autoimmune diseases by disruption of the PD-1 gene encoding an ITIM motif-carrying immunoreceptor. Immunity. 1999;11:141–151. doi: 10.1016/s1074-7613(00)80089-8. [DOI] [PubMed] [Google Scholar]
- 2.Freeman GJ, et al. Engagement of the PD-1 immunoinhibitory receptor by a novel B7 family member leads to negative regulation of lymphocyte activation. J Exp Med. 2000;192:1027–1034. doi: 10.1084/jem.192.7.1027. [DOI] [PMC free article] [PubMed] [Google Scholar]
- 3.Okazaki T, Honjo T. The PD-1-PD-L pathway in immunological tolerance. Trends Immunol. 2006;27:195–201. doi: 10.1016/j.it.2006.02.001. [DOI] [PubMed] [Google Scholar]
- 4.Keir ME, Butte MJ, Freeman GJ, Sharpe AH. PD-1 and its ligands in tolerance and immunity. Annu Rev Immunol. 2008;26:677–704. doi: 10.1146/annurev.immunol.26.021607.090331. [DOI] [PMC free article] [PubMed] [Google Scholar]
- 5.Zou W, Wolchok JD, Chen L. PD-L1 (B7-H1) and PD-1 pathway blockade for cancer therapy: Mechanisms, response biomarkers, and combinations. Sci Transl Med. 2016;8:328rv324. doi: 10.1126/scitranslmed.aad7118. [DOI] [PMC free article] [PubMed] [Google Scholar]
- 6.Pardoll DM. The blockade of immune checkpoints in cancer immunotherapy. Nat Rev Cancer. 2012;12:252–264. doi: 10.1038/nrc3239. [DOI] [PMC free article] [PubMed] [Google Scholar]
- 7.Topalian SL, et al. Safety, activity, and immune correlates of anti-PD-1 antibody in cancer. N Engl J Med. 2012;366:2443–2454. doi: 10.1056/NEJMoa1200690. [DOI] [PMC free article] [PubMed] [Google Scholar]
- 8.Hamid O, et al. Safety and tumor responses with lambrolizumab (anti-PD-1) in melanoma. N Engl J Med. 2013;369:134–144. doi: 10.1056/NEJMoa1305133. [DOI] [PMC free article] [PubMed] [Google Scholar]
- 9.Topalian SL, et al. Survival, durable tumor remission, and long-term safety in patients with advanced melanoma receiving nivolumab. J Clin Oncol. 2014;32:1020–1030. doi: 10.1200/JCO.2013.53.0105. [DOI] [PMC free article] [PubMed] [Google Scholar]
- 10.Pollard JW. Tumour-educated macrophages promote tumour progression and metastasis. Nat Rev Cancer. 2004;4:71–78. doi: 10.1038/nrc1256. [DOI] [PubMed] [Google Scholar]
- 11.Chao MP, et al. Anti-CD47 antibody synergizes with rituximab to promote phagocytosis and eradicate non-Hodgkin lymphoma. Cell. 2010;142:699–713. doi: 10.1016/j.cell.2010.07.044. [DOI] [PMC free article] [PubMed] [Google Scholar]
- 12.Forty Seven, I. Phase 1 Trial of Hu5F9-G4, a CD47-targeting Antibody. 2014 < https://clinicaltrials.gov/ct2/show/NCT02216409?term=cd47&rank=8>.
- 13.Celgene. A Phase 1, Dose Finding Study of CC-90002 in Subjects With Advanced Solid and Hematologic Cancers. 2015 < https://clinicaltrials.gov/ct2/show/NCT02367196?term=cd47&rank=7>.
- 14.Huang X, et al. PD-1 expression by macrophages plays a pathologic role in altering microbial clearance and the innate inflammatory response to sepsis. Proc Natl Acad Sci U S A. 2009;106:6303–6308. doi: 10.1073/pnas.0809422106. [DOI] [PMC free article] [PubMed] [Google Scholar]
- 15.Bally AP, et al. NF-κB regulates PD-1 expression in macrophages. J Immunol. 2015;194:4545–4554. doi: 10.4049/jimmunol.1402550. [DOI] [PMC free article] [PubMed] [Google Scholar]
- 16.Chen W, Wang J, Jia L, Liu J, Tian Y. Attenuation of the programmed cell death-1 pathway increases the M1 polarization of macrophages induced by zymosan. Cell Death Dis. 2016;7:e2115. doi: 10.1038/cddis.2016.33. [DOI] [PMC free article] [PubMed] [Google Scholar]
- 17.Shen L, et al. PD-1/PD-L pathway inhibits M.tb-specific CD4(+) T-cell functions and phagocytosis of macrophages in active tuberculosis. Sci Rep. 2016;6:38362. doi: 10.1038/srep38362. [DOI] [PMC free article] [PubMed] [Google Scholar]
- 18.Sica A, Schioppa T, Mantovani A, Allavena P. Tumour-associated macrophages are a distinct M2 polarised population promoting tumour progression: potential targets of anti-cancer therapy. Eur J Cancer. 2006;42:717–727. doi: 10.1016/j.ejca.2006.01.003. [DOI] [PubMed] [Google Scholar]
- 19.Esashi E, Sekiguchi T, Ito H, Koyasu S, Miyajima A. Cutting Edge: A possible role for CD4+ thymic macrophages as professional scavengers of apoptotic thymocytes. J Immunol. 2003;171:2773–2777. doi: 10.4049/jimmunol.171.6.2773. [DOI] [PubMed] [Google Scholar]
- 20.Baba T, et al. CD4+/CD8+ macrophages infiltrating at inflammatory sites: a population of monocytes/macrophages with a cytotoxic phenotype. Blood. 2006;107:2004–2012. doi: 10.1182/blood-2005-06-2345. [DOI] [PubMed] [Google Scholar]
- 21.Zhen A, et al. CD4 ligation on human blood monocytes triggers macrophage differentiation and enhances HIV infection. J Virol. 2014;88:9934–9946. doi: 10.1128/JVI.00616-14. [DOI] [PMC free article] [PubMed] [Google Scholar]
- 22.Maute RL, et al. Engineering high-affinity PD-1 variants for optimized immunotherapy and immuno-PET imaging. Proc Natl Acad Sci U S A. 2015;112:E6506–6514. doi: 10.1073/pnas.1519623112. [DOI] [PMC free article] [PubMed] [Google Scholar]
- 23.Kleffel S, et al. Melanoma Cell-Intrinsic PD-1 Receptor Functions Promote Tumor Growth. Cell. 2015;162:1242–1256. doi: 10.1016/j.cell.2015.08.052. [DOI] [PMC free article] [PubMed] [Google Scholar]
- 24.Lin DY, et al. The PD-1/PD-L1 complex resembles the antigen-binding Fv domains of antibodies and T cell receptors. Proc Natl Acad Sci U S A. 2008;105:3011–3016. doi: 10.1073/pnas.0712278105. [DOI] [PMC free article] [PubMed] [Google Scholar]
- 25.Dahan R, et al. FcγRs Modulate the Anti-tumor Activity of Antibodies Targeting the PD-1/PD-L1 Axis. Cancer Cell. 2015;28:285–295. doi: 10.1016/j.ccell.2015.08.004. [DOI] [PubMed] [Google Scholar]
- 26.Agata Y, et al. Expression of the PD-1 antigen on the surface of stimulated mouse T and B lymphocytes. Int Immunol. 1996;8:765–772. doi: 10.1093/intimm/8.5.765. [DOI] [PubMed] [Google Scholar]
- 27.Benson DM, et al. The PD-1/PD-L1 axis modulates the natural killer cell versus multiple myeloma effect: a therapeutic target for CT-011, a novel monoclonal anti-PD-1 antibody. Blood. 2010;116:2286–2294. doi: 10.1182/blood-2010-02-271874. [DOI] [PMC free article] [PubMed] [Google Scholar]
- 28.Karyampudi L, et al. PD-1 Blunts the Function of Ovarian Tumor-Infiltrating Dendritic Cells by Inactivating NF-κB. Cancer Res. 2016;76:239–250. doi: 10.1158/0008-5472.CAN-15-0748. [DOI] [PMC free article] [PubMed] [Google Scholar]
- 29.Ansell SM, et al. PD-1 blockade with nivolumab in relapsed or refractory Hodgkin’s lymphoma. N Engl J Med. 2015;372:311–319. doi: 10.1056/NEJMoa1411087. [DOI] [PMC free article] [PubMed] [Google Scholar]
- 30.Reichel J, et al. Flow sorting and exome sequencing reveal the oncogenome of primary Hodgkin and Reed-Sternberg cells. Blood. 2015;125:1061–1072. doi: 10.1182/blood-2014-11-610436. [DOI] [PubMed] [Google Scholar]
- 31.Saederup N, et al. Selective chemokine receptor usage by central nervous system myeloid cells in CCR2-red fluorescent protein knock-in mice. PLoS One. 2010;5:e13693. doi: 10.1371/journal.pone.0013693. [DOI] [PMC free article] [PubMed] [Google Scholar]
- 32.Maruyama C, et al. Genotyping the mouse severe combined immunodeficiency mutation using the polymerase chain reaction with confronting two-pair primers (PCR-CTPP) Exp Anim. 2002;51:391–393. doi: 10.1538/expanim.51.391. [DOI] [PubMed] [Google Scholar]
- 33.Takenaka K, et al. Polymorphism in Sirpa modulates engraftment of human hematopoietic stem cells. Nat Immunol. 2007;8:1313–1323. doi: 10.1038/ni1527. [DOI] [PubMed] [Google Scholar]
- 34.MacDonald KP, et al. An antibody against the colony-stimulating factor 1 receptor depletes the resident subset of monocytes and tissue- and tumor-associated macrophages but does not inhibit inflammation. Blood. 2010;116:3955–3963. doi: 10.1182/blood-2010-02-266296. [DOI] [PubMed] [Google Scholar]
Associated Data
This section collects any data citations, data availability statements, or supplementary materials included in this article.


