Abstract
New microarray chip strategies that are sensitive and selective and that can measure low levels of important biomarkers directly in a blood sample are significant for improving human health by allowing timely diagnosis of an abnormal condition. Herein, we designed an antibody–aptamer immunoarray chip to demonstrate simultaneous measurement of blood insulin and glycated hemoglobin (HbA1c) levels relevant to diabetic and prediabetic disorders using a surface plasmon microarray with validation by fluorescence imaging. To accomplish both surface plasmon and fluorescence imaging on the same sample, we decorated magnetite nanoparticles with quantum dots for covalent immobilization of aptamers for subsequent capture and isolation of the aptamers specific for insulin and HbA1c markers from 20-times diluted whole blood samples. Direct clinically relevant analysis, along with fluorescent imaging of the two markers, was achieved by this new immunoarray platform. The limit of detection was 4 pM for insulin and 1% for HbA1c. Examination of cross-talk using thrombin and platelet-derived growth factor confirmed that the designed immunoarray was highly selective for insulin and HbA1c. Surface plasmon kinetic analysis provided apparent binding constants of 0.24 (±0.08) nM and 37 (±3) μM, respectively, for the binding of insulin and HbA1c onto their surface immobilized monoclonal antibodies. Thus, quantitative imaging of ultralow levels of blood biomarker levels with binding kinetics is uniquely obtained in the designed immunoarray chip. In conclusion, this report demonstrates considerable significance of the developed magnetite-quantum dot-bioconjugate strategy for clinical diagnostics of whole blood biomarkers with characterization of molecular binding interactions.
Keywords: microarray, whole blood analysis, nonglucose markers, magnetite-quantum dot, plasmon-coupled-fluorescence, binding kinetics
Graphical abstract
Diabetes is characterized by abnormally high blood glucose levels that can result from either insulin deficiency (type 1 diabetes T1D) or insulin resistance (type 2 diabetes T2D). In contrast to T1D, T2D is typically associated with unusually high levels of insulin secretion by the beta cells within the pancreas. If left undiagnosed or untreated, diabetes can lead to health complications such as cardiovascular diseases, kidney failure, and diabetic retinopathy. A survey conducted by the World Health Organization indicated that the incidence of diabetes is increasing at a constant rate. The latest statistics show nearly 8.5% of the world’s population to be diabetic, with many children being affected in recent times. Originally, type 1 diabetes was the most common form, but in recent years type 2 diabetes has become a serious problem in both children and adults. In the United States, the Centers for Disease Control and Prevention (National Diabetes Fact Sheet, 2011) reported that ~11% of adults had type 1 diabetes and 35% of the population had a prediabetic disorder (a stage before type 2 diabetes).1
Although glucose biosensors have been successful in diabetes management, considerable attention is now focused on developing diagnostic devices that can detect nonglucose biomarkers such as insulin and glycated hemoglobin (HbA1c) to categorize the type of diabetes and predict risks for development of cardiovascular, kidney, and vision complications. Hence, timely identification of type 1 and type 2 diabetic disorders would benefit from the ability to measure blood insulin levels under fasting conditions, and assessment of associated complications by additionally measuring HbA1c levels in the same sample.2,3
HbA1c is formed by the nonenzymatic reaction of glucose with the N-terminal valine amino group of the β-chain of hemoglobin.4 Recent studies highlighted the benefit of measuring HbA1c instead of glucose levels for better prediction of risk of developing diabetes and cardiovascular diseases.5–8 Hence, the American Diabetes Association has recommended measuring HbA1c for diabetes screening and diagnosis.9,10 In healthy adults, HbA1c is within the range of 4.0–6.0%, whereas levels >6.5% indicate diabetes.11 Although HbA1c levels are useful for predicting cardiovascular problems they cannot be used to categorize the type of diabetes present.12–14 Hence, measuring both fasting insulin and HbA1c levels in whole blood samples would be clinically significant for predicting diabetes type and other diabetes related health complications.
Compared to the millimolar glucose concentration present in whole blood, it is very challenging to measure ultralow clinically useful levels of nonglucose diabetes markers. High abundance of interfering components such as cell lysates or serum proteins in clinical matrices (i.e., the matrix effect) can interfere with and influence the performance of the assay in terms of robustness, sensitivity, and high false positive and false negative results.
Methods such as the chemiluminescence assay, radioactive immunoassay, enzyme linked immunosorbent assay (ELISA), and column chromatography have been used to detect insulin and HbA1c levels in buffer and serum.15–17 For HbA1c the current gold standards are ion-exchange chromatography,18 boronated affinity chromatography,19 and electrophoresis.20 Based on the affinity of the diol groups of HbA1c to the boric acid surface, electrocatalytic detection of HbA1c on a boronate affinity modified surface,21,22 a disposable amperometric sensor,23 and an impedimetric sensor on 3-aminophenylboronic acid-modified egg shell membranes24 have been demonstrated previously. All these prior assays/sensors had good sensitivity and selectivity, but they cannot offer real-time binding kinetics analysis with an image output of biomarker levels as in surface plasmon resonance (SPR) microarray imager.
Real-time binding kinetics helps in understanding the structure and function of proteins, the strength of interactions between biomolecules, and that with nonbiological entities such as drugs and aptamers. Different proteins with the same affinities may not exhibit the same kinetics. Therefore, without knowing the association and dissociation rates, the true nature of an interaction cannot be known. As a result, real-time kinetic analysis has become important and useful in providing clear quantitative insights into interactions for early phase drug development,25 genetic screening,26 understanding molecular mechanisms,27,28 biosensor development,29 disease diagnosis,30 and other related applications.
SPR measures changes in refractive index for up to ~200–300 nm upon binding of molecules onto the metal surface that is in contact with a dielectric medium (e.g., buffer solution).31,32 These changes are imaged by a charge-coupled device (CCD) camera within 30 s in an SPR imager (SPRi). SPR bioassays for detection of analytes can be a label-free format,33 although various nanoparticle based signal amplification labels are often required to enhance detection sensitivity.34–37 Studies have shown that the surface plasmon field effects can be increased several-fold by interaction of quantum dots (QDs) with propagating surface plasmons (SP-QD coupling).38 Taking advantage of this phenomenon, there have been reports of SPR based biosensors that have incorporated near-infrared (NIR) QDs to achieve high sensitivity in detection of single analyte biomarkers such as C-reactive protein in 1% serum with a limit of detection (LOD) of 43 aM,39 and a femtomolar LOD of prostate specific antigen in buffer.40
Herein, we describe a novel SPRi immunoarray that incorporates SP-QD coupling for sensitive and combined detection of insulin and HbA1c in unprocessed 20-times diluted whole blood. We show that by designing appropriate surface chemistry and bioconjugation strategies, it is feasible to measure clinically relevant levels of two biomarkers of diabetes in whole blood samples with binding kinetic insights and an array image output. Additionally, we demonstrate fluorescence imaging of the markers on the same array surface. Such a dual independent detection method for evaluating the same biomarker sample adds better reliability to the results.
The designed sensor incorporates aptamers as the capture probes attached to magnetic nanoparticles (MNPs) decorated with two distinct QDs to selectively isolate insulin and HbA1c from blood and detect their presence upon binding to surface immobilized antibodies. This study not only demonstrated the ability to image two biomarkers in whole blood, but also led us to perform the kinetic analysis to estimate the binding affinity interactions between the MNP-QD-aptamer-insulin or MNP-QD-aptamer-HbA1c biomarker conjugates and their respective monoclonal antibodies immobilized on the SPRi array surface. This study is significant for the clinical diagnosis of nonglucose diabetes biomarkers to accomplish better treatment outcomes, prediction of complications, and management of type 1 and type 2 diabetes.
EXPERIMENTAL SECTION
Reagents and Materials
Polyethylene glycol amine functionalized magnetite (Fe3O4) nanoparticles (MNPs, 115 ± 2 nm hydrodynamic size) were purchased from Chemicell GmbH (Berlin, Germany). Qdots 800 and 565 ITK carboxyl quantum dots (QD800 and QD565) were bought from Life Technologies Corporation (Carlsbad, CA, USA). Aptamers for insulin, HbA1c, thrombin, and platelet-derived growth factor (PDGF) were purchased from Integrated DNA Technologies (Coralville, IA, USA). Recombinant human insulin was obtained from Kerafast, Inc. (Boston, MA, USA). Monoclonal mouse anti-insulin antibody (Abinsulin), 3-mercaptopropionic acid (MPA), 1-ethyl-3-[3-(dimethylamino)propyl] carbodiimide hydrochloride (EDC), N-hydroxysuccinimide (NHS), bovine serum albumin (BSA), Generation 4 polyamidoamine (PAMAM) dendrimer, glutaraldehyde, cyanmethemoglobin reagent, and human blood hemolysate were purchased from Sigma-Aldrich (St. Louis, MO, USA). Monoclonal mouse antiglycated hemoglobin antibody (AbHbA1c) was purchased from Fitzgerald (Acton, MA, USA). Normal whole blood and type 1 and type 2 diabetic whole blood patient samples were from Bioreclamation IVT (Westbury, NY, USA). Cyanmethemoglobin standard (80 mg/dL) was purchased from Stanbio Laboratory (Boerne, TX, USA). The ultrasensitive insulin ELISA kit was purchased from Mercodia (Uppsala, Sweden), and the HbA1c assay kit was purchased from Crystal Chem, Inc. (Downers Grove, IL, USA). All other chemicals were analytical grade.
Instrumentation
Dynamic light scattering (DLS) and zeta potential measurements were performed on ZetaPALS (Brookhaven Instruments Corporation, Holtsville, NY, USA). The fluorescence spectra for quantitating QD800 and QD565 in the conjugates were generated using a Cary Eclipse Fluorescence Spectrophotometer (Agilent Technologies, Santa Clara, CA, USA), and fluorescence images were taken using a Nikon Eclipse 80i microscope (Nikon Instruments Inc., Melville, NY, USA). The UV–vis absorbance for estimating the amount of total hemoglobin in the standards was measured using a Cary 5000 UV–vis-NIR (Agilent Technologies, Santa Clara, CA, USA). Residual insulin and HbA1c levels in normal whole blood were estimated using a BioTek Synergy H1 Plate Reader (Winooski, VT, USA). The real-time binding kinetics study was conducted using a surface plasmon resonance imager (GWC, SPRimager-II, Horizon SPR imager model, Madison, WI, USA) operating at a SPR source wavelength of 800 nm. Pico Plus Elite PumpII was purchased from Harvard Apparatus (Holliston, MA, USA), and a dual injector valve for injecting phosphate buffered saline (PBS, running buffer) and samples was from IDEX Health & Science LLC (Rheodyne model 9725i PEEK injector, Rohnert Park, CA, USA).
Preparation of MNP-QD-Aptamer-Insulin or HbA1c (MNP-QD800-Aptamer-Insulin and MNP-QD565-Aptamer-HbA1c) Conjugates
To 20 μL of amine terminated MNPs in separate vials, 400 μL of 100 nM QD565 or QD800 in borate buffer, pH 9.5, were added and rotated for 2 h in the dark for effective electrostatic interaction. The unbound QDs in the supernatant solution were then removed by applying a magnetic field via a small magnet to separate the QD-bound MNPs. The –COOH groups of QDs in the prepared MNP-QD samples were activated by a freshly prepared solution of 150 μL of 0.2 M EDC and 0.05 M NHS for 10 min and were subsequently treated with 40 μL of 20 μM amine terminated insulin or HbA1c aptamers in pH 7.5 Tris-EDTA buffer for another 2 h in the dark (MNP-QD565 was treated with HbA1c aptamer and MNP-QD800 was treated with insulin aptamer).
The unbound aptamers in solution were removed by magnetic field, and the aptamer-bound MNP-QD conjugates were washed twice with 1% BSA in PBS to prevent nonspecific binding by blocking the free carboxylic acid groups of QDs. The washed conjugates were then incubated with 100 μL of different spiked concentrations of insulin or HbA1c in whole blood (20-times diluted in PBS) for 15 min. The prepared MNP-QD800-aptamer-insulin and MNP-QD565-aptamer-HbA1c conjugates were again washed twice with 1% BSA in PBS and resuspended in 500 μL of PBS buffer, pH 7.4.
The standards for insulin and HbA1c in whole blood were prepared by the standard addition method to reduce matrix interference. These standards were prepared by adding 50 μL of 10-times diluted whole blood and 50 μL of 2× concentrations of insulin and HbA1c, whereas the controls were prepared by mixing 50 μL of 10-times diluted whole blood and 50 μL of PBS, pH 7.4, to give a total volume of 100 μL. Using ELISA and the HbA1c assay kit, we estimated that the 20-times diluted control blood had 2.2 pM insulin and 0.3% HbA1c, which was taken as the zero signal reference for the spiked samples, as this was the only way we could mimic the blood sample matrix for controls and also obtain spiked samples. Patient samples and conjugates for thrombin and PDGF (negative control) were also prepared in a similar fashion. The aptamers for insulin,41 HbA1c,42 thrombin,43 and PDGF44 were C6 amino modified (AmMC6) at the 5′ end and HPLC purified.
Aptamer for insulin: 5′ AmMC6/GGT GGT GGG GGG GGT TGG TAG GGT GTC TTC 3′
Aptamer for HbA1c: 5′ AmMC6/GGC AGG AAG ACA AAC ACA TCG TCG CGG CCT TAG GAG GGG CGG ACG GGG GGG GGC GTT GGT CTG TGG TGC TGT 3′
Aptamer for thrombin: 5′ AmMC6/GGT TGG TGT GGT TGG 3′
Aptamer for PDGF: 5′ AmMC6/CAG GCT ACG GCA CGT AGA GCA TCA CCA TGA TCC TG 3′.
RESULTS AND DISCUSSION
Design of the SPR Dual Immunoarray Surface
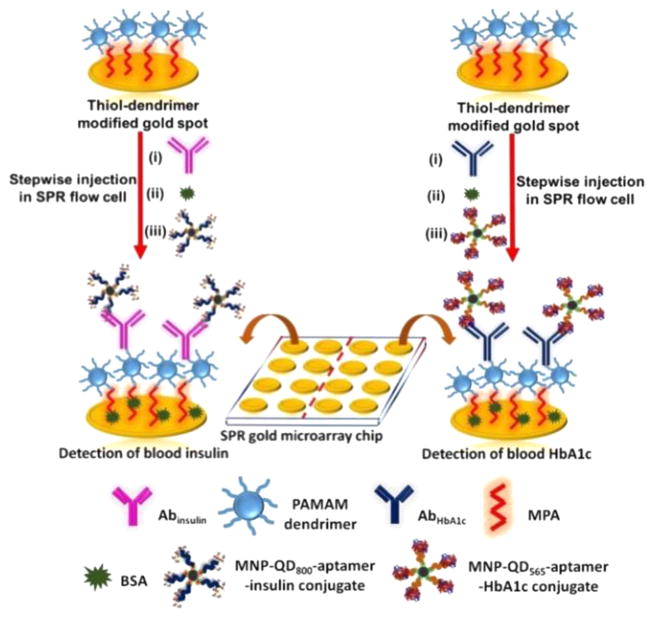
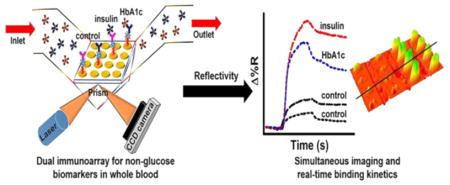
The complete microarray fabrication and interaction of the blood insulin or blood HbA1c captured MNP-QD-aptamer conjugates with the surface immobilized antibodies was monitored real-time on the SPRi. The immunoassay strategy is shown in Figure 1.
Figure 1.
Assay strategy used for measuring the clinical levels of insulin and HbA1c in 20-times diluted whole blood in PBS.
We incorporated two different carboxyl terminated QDs (QD800 with emission peak at 800 nm and QD565 with emission peak at 565 nm) to monitor and image the binding of insulin and HbA1c in whole blood using the SPRi followed by distinction of the QDs by fluorescence imaging characterization of the same microarray spots. Different concentrations of insulin and HbA1c in whole blood were prepared using the standard addition method to yield MNP-QD800-aptamer-insulin and MNP-QD565-aptamer-HbA1c conjugates. The number of molecules of QD800 and QD565 bound to 0.5 mg of MNP was estimated by taking the difference in fluorescence intensity of the QD solutions before and after the electrostatic adsorption onto MNPs. This estimation yielded 2.4 (±0.1) × 1013 of QD800 and 2.3 (±0.2) × 1013 of QD565 molecules bound to MNPs.
Characterization of Conjugates
Table S1 shows results of particle size analysis and surface charge analysis of the prepared conjugates. Because of the longer single-stranded oligonucleotide sequence of the HbA1c-aptamer and the higher molecular weight of HbA1c compared to those of the insulin system, the MNP-QD565-aptamer-HbA1c conjugate was ~190 nm greater in size than the MNP-QD800-aptamer-insulin conjugate. The negative zeta potential confirmed the attachment of QDs to the positively charged MNPs. Further conjugation of the QDs to the amine terminated aptamers shifted the zeta potential toward more positive values. The final step of capture of insulin and HbA1c from 20-times diluted whole blood showed slighlty more negative zeta potential values.
Real-Time Monitoring of the Binding of Conjugates to the Antibody Immobilized SPR Immunoarray
SPR gold (Au) microarray chips were initially thiol functionalized by immersion in mercaptopropionic acid (MPA) overnight. Fourth-generation polyamidoamine (PAMAM) dendrimer was then covalently bound via carbodiimide linkage by immersion for 2 h. The dendrimer was incorporated to reduce nonspecific binding, to prevent leaching, and to provide a stable surface for homogeneous immobilization of biomolecules.45 The thiol-dendrimer fabricated chips were then used to immobilize anti-insulin (Abinsulin, 0.2 mg/mL in PBS, pH 7.4) or antiglycated hemoglobin (AbHbA1c, 0.2 mg/mL in PBS, pH 7.4) antibody.
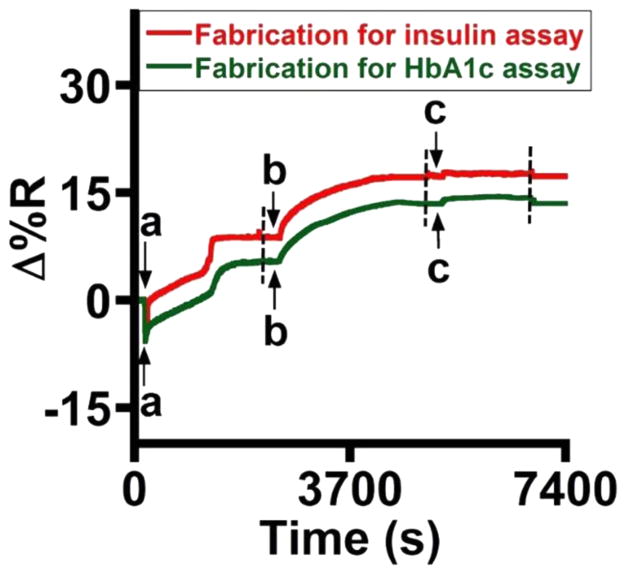
Injection of 100 μL of 0.5% glutaraldehyde for 30 min activated the amino groups of the dendrimer by forming Schiff’s base and linked the antibodies to the sensor surface. The microarray was divided into two halves with eight array spots in each half to immobilize Abinsulin and AbHbA1c. Immobilization took place for 40 min and was followed by a blocking step in 100 μL of 0.1% BSA in PBS for 30 min. Each step of immobilization included a washing step of 5 min in PBS at a flow rate of 50 μL/min to remove any unbound molecules and obtain a steady-state response. SpotReady 16 chips from GWC Technologies, with each spot 1 mm in diameter, were utilized for the immunoassembly fabrication and detection of diabetes biomarkers. The construction of the sensor surface and the dual analysis were performed at room temperature (23 °C). Figure 2 shows the real-time data in PBS, pH 7.4 delivered at a flow rate of 50 μL/min. Table 1 presents the percent change in reflectivity at every step of array fabrication.
Figure 2.
Reflectivity changes during stepwise SPR microarray fabrication with (a) glutaraldehyde, (b) Abinsulin or AbHbA1c, and (c) 0.1% BSA. The broken lines indicate the onset of the washing step (duration of 5 min).
Table 1.
Reflectivity Changes during Fabrication of the SPR Microarray for Detection of Insulin and HbA1c in 20-Times Diluted Whole Blooda
| stepwise assembly on the Au chip | % change in reflectivity | |
|---|---|---|
|
| ||
| Insulin | HbA1c | |
| Au chip-MPA-dendrimer | initial | initial |
| Au chip-MPA-dendrimer-glutaraldehyde | 8.1 (±1.3) | 5.8 (±0.8) |
| Au chip-MPA-dendrimer-glutaraldehyde-Ab | 7.4 (±1.4) | 7.7 (±1.0) |
| Au chip-MPA-dendrimer-glutaraldehyde-Ab-0.1% | 0.9 (±0.5) | 1.0 (±0.4) |
| BSA | ||
N = 3 replicates with eight spots per sample.
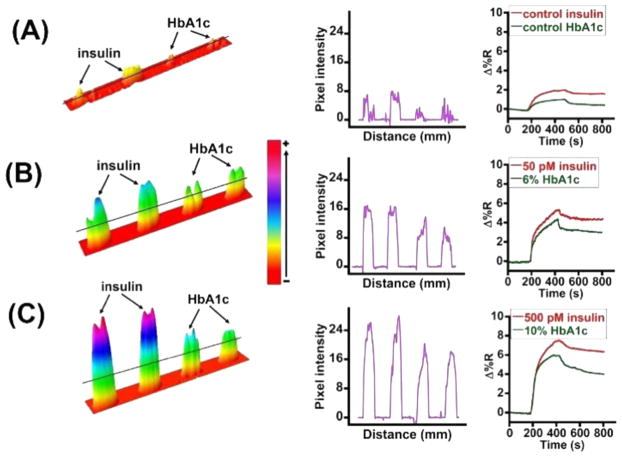
The antibody-immobilized microarray was used to selectively monitor the binding of different concentrations of MNP-QD800-aptamer-insulin and MNP-QD565-aptamer-HbA1c conjugates. The sandwich assay was conducted such that the conjugates of insulin and HbA1c, which were suspended in 500 μL of PBS buffer, pH 7.4, were mixed at 1:1 v/v ratio and used as the sample for detecting both markers simultaneously and for dual and cross-reactivity analysis. The binding of the mixed conjugates on the sensor surface was monitored at a flow rate of 100 μL/min for 10 min, which included a 5 min washing step. Figure 3A–C shows the sensograms for simultaneous detection of insulin and HbA1c present in one sample mixture and the corresponding difference images and line profiles. The control samples (Figure 3A) correspond to 20-times diluted unspiked whole blood (having a residual 2.2 pM insulin and 0.3% HbA1c) treated with either MNP-QD800-insulin aptamer or MNP-QD565-HbA1c aptamer conjugates.
Figure 3.
Difference images, line profiles, and sensograms of (A) control, (B) 50 pM and 6%, and (C) 500 pM and 10% insulin and HbA1c levels, respectively, in whole blood.
Thus, we examined the specificity of the sensor by mixing the two conjugates in one solution for the assay (Figure 3). Additionally, a negative control experiment utilizing thrombin and PDGF aptamers was run to assess any nonspecific crosstalk on the sensor surface (Figure S1). Thrombin and PDGF were chosen because they are normally present in whole blood. MNP-QD800-aptamer-thrombin and MNP-QD565-aptamer-PDGF conjugates were prepared in a manner similar to that of the insulin and HbA1c conjugates and were mixed at 1:1 v/v ratio to conduct the cross-talk study. These conjugates did not show any increase in reflectivity, which confirmed the selectivity of the designed aptamer immunosurfaces toward insulin or HbA1c. In fact, a negative SPR reflectivity change was observed for the thrombin and PDGF conjugates. The exact reason for this negative shift is not clear and could result from a shift in SPR angle minimum to a higher angle causing a net negative reflectivity change, or an induced desorption of BSA from the sensor surface caused by the nonspecific interaction of thrombin and PDGF aptamer conjugates.46,47
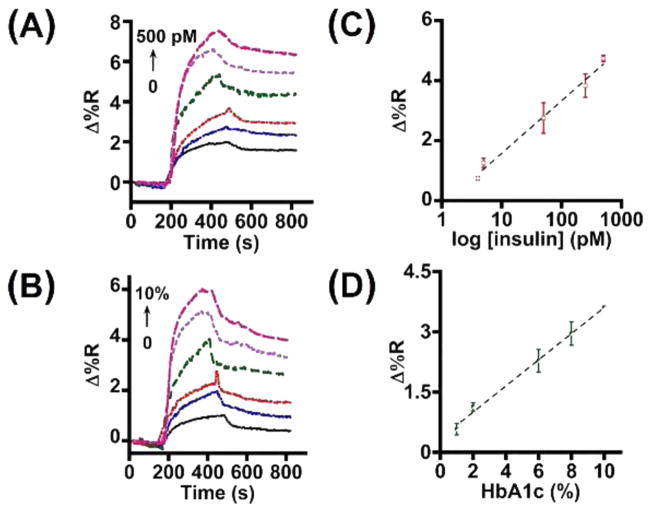
Figure 4 shows the insulin and HbA1c SPR sensograms and the respective calibration plots for the dual detection. Using the equation LOD = mean ± 3 × standard deviation of blank, we calculated an LOD of 4 pM insulin and 1% HbA1c in the designed immunoarray strategy (Figure 4C,D). These detection limits are comparable to other competing methods presented in Table S2.
Figure 4.
SPR sensograms for (A) insulin and (B) HbA1c and calibration plots for (C) insulin and (D) HbA1c detection in 20-times diluted whole blood (N = 3 replicates).
To perform the kinetic analysis, concentrations of HbA1c expressed in % were converted to molar concentrations by performing the cyanmethemoglobin (hemoglobin) assay.48 Absorbance spectra of the cyanmethemoglobin complex formed at 540 nm were recorded (Figure S2) for the prepared HbA1c standards and were converted to molar concentrations using the following equation:
The experimentally obtained SPR sensograms in Figure 4 were fit into a 1:1 bimolecular interaction model (Figure S3).49 The equations provided in the Supporting Information were used to calculate the kinetic parameters, association rate constant (ka), dissociation rate constant (kd), and binding constant (KD). All data processing and kinetic model fitting was performed using the software provided by GWC Technologies, Inc., which gives kobs (rate constant “observed” in the experiment) based on the association curve and the kd from the dissociation curve following the point of wash in buffer.
kobs values for each concentration of biomarker displayed good linearity (Figure S4). The slope and the intercept values correspond to ka and kd, respectively (Table 2). The kinetic parameters determined from the linear plot were in close agreement with the binding constant (KD) values generated by individual simulated sensograms (Figure S4). The low nM and μM KD values obtained for the respective aptamers captured blood insulin and HbA1c on the MNP-support suggest reasonably strong binding interactions with the corresponding surface immobilized insulin and HbA1c antibodies (Table 2). The determined KD value of insulin in the designed aptamer-insulin-antibody sandwich assay format is on the similar order to that reported for insulin affinities with insulin-receptor or anti-insulin antibody.50,51 In the case of HbA1c, the measured KD is higher than that reported for 5000-fold diluted blood samples by an ELISA method (KD = 75 nM).52 A possible reason for the observed difference could arise from the lower dilution factor of the whole blood samples in our study and the associated presence of the greater amounts of other nonspecific analytes that could hinder the binding rates of HbA1c with its surface antibody. Additionally, the differences in the surface chemistry and immunoassembly designs could be another possible factor.
Table 2.
Kinetic Parameters for the Binding of 20-times Diluted Whole Blood Insulin and HbA1c Aptamer Conjugates onto Surface Immobilized Antibodies
| biomarker | association rate constant (ka, M−1 s−1) | dissociation rate constant (kd, s−1) | binding constant (KD) |
|---|---|---|---|
| Insulin | 3.0 (±1) × 107 | 7.3 (±0.1) × 10−3 | 0.24 (±0.08) nM |
| HbA1c | 201 (±14) | 7.4 (±0.2) × 10−3 | 37 (±3) μM |
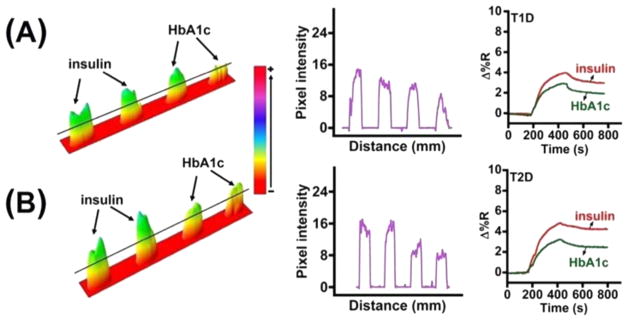
To illustrate the clinical applicability of the designed dual biomarker immunoarray imager, insulin and HbA1c levels in real type 1 diabetic (T1D) and type 2 diabetic (T2D) patient samples were measured. The conjugates for the patient samples were prepared in a manner similar to that used to prepare the spiked insulin and HbA1c standards in 20-times diluted blood as described previously. Figure 5 shows the real-time binding sensograms and the corresponding difference images and line profiles. The concentrations estimated for insulin and HbA1c in the TID patient sample were 33 (±5) pM and 6.6 (±0.6)%, respectively, whereas in the T2D patient sample they were 89 (±3) pM and 9.8 (±1.5)%.
Figure 5.
Difference images, line profiles, and sensograms of (A) T1D and (B) T2D whole blood patient samples.
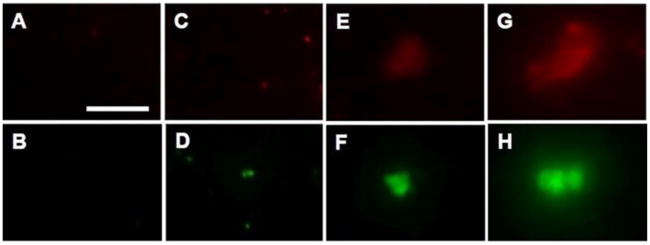
The SPR results of the bound insulin and HbA1c conjugates on the immunoarray surface were validated by fluorescence imaging (Figure 6). The aptamer conjugates, MNP-QD800- aptamer and MNP-QD565-aptamer, as such did not show any measurable QD emissions when allowed to bind the immunoarray surface antibodies (Figure 6A,B), suggesting negligible nonspecific binding. 20-times diluted whole blood samples not spiked with insulin or HbA1c, but treated with the aptamer conjugates, showed slight nonspecific binding signals at the immunoarray surface due to the presence of residual insulin (2.2 pM) and HbA1c (0.3%) in the blood (Figure 6C,D). On the other hand, the whole blood spiked with 50 and 500 pM insulin (Figure 6E,G) or 6% and 10% HbA1c (Figure 6F,H) and captured with the aptamer conjugates displayed notable fluorescence emission signals as the result of selective binding of the biomarkers onto their respective microarray immobilized antibody.
Figure 6.
Fluorescence images of aptamer control (A,B), 20-times diluted whole blood conjugates with residual insulin and HbA1c (C,D), MNP-QD-aptamer captured 50 pM insulin and 6% HbA1c (E,F), and 500 pM insulin and 10% HbA1c (G,H) in 20-times diluted whole blood upon binding to their respective surface immobilized antibodies on the SPR microarray chip. Scale bar: 20 μm for (A–H).
CONCLUSIONS
Development of surface plasmon array chips that can directly measure levels of more than one biomarker in whole blood with high sensitivity, selectivity, and minimal nonspecific binding from interfering proteins represents a challenging task. This was overcome in this study by designing an antibody-aptamer immunoarray chip utilizing magnetic nanoparticles and fluorescent QD labels to measure insulin and HbA1c in 20-times diluted whole blood. Clinical diagnoses of type of diabetes from fasting insulin levels and prediction of cardiovascular complications from elevated HbA1c levels are possible with the demonstrated immunoarray strategy. This dual biomarker chip platform is innovative and impactful considering the rapidly growing rate of diabetes and cardiovascular problems worldwide.
As aptamers are highly specific compared to antibodies,53–55 incorporating them as capturing probes for insulin and HbA1c from whole blood as part of the sandwich assay resulted in good selectivity and negligible nonspecific binding signals. We achieved detection within the clinical range with high sensitivity, and the KD values in the μM to nM range confirmed good affinity between the biomarker conjugates and their antibodies.
Table S2 provides a comparative analysis of the detection sensitivity of insulin and HbA1c in different clinical matrices, which confirms the unique advantage of the proposed microarray imager for ultralow detection along with the binding kinetics parameters. MNPs were used in the conjugate preparation because they provide easy isolation and separation of insulin and HbA1c from whole blood by a magnet, which is not possible with other inorganic NPs. The use of two distinct fluorescent QDs allowed the independent validation of the SPR microarray results. Such magnetic NP-QD probes are of growing interest, as they allow biolabeling and easy isolation and separation of desired biomarkers from complex sample matrices for sensitive imaging based measurements.56,57
Supplementary Material
Acknowledgments
Research reported in this publication was supported, in part, by the National Institute of Diabetes and Digestive and Kidney Diseases of the National Institutes of Health (Award Number R15DK103386), and, in part, by the Oklahoma State University (start-up funds). The content is solely the responsibility of the authors and does not necessarily represent the official views of the National Institutes of Health.
Footnotes
Notes
The authors declare no competing financial interest.
The Supporting Information is available free of charge on the ACS Publications website at DOI: 10.1021/acssensors.7b00124.
Table S1 for DLS and Zeta potential data, Table S2 for comparative analysis, Figure S1 for thrombin and PDGF conjugates, Figure S2 for HbA1c estimation, Figure S3 for simulated and experimental SPR sensograms, and Figure S4 for kinetic plots (PDF)
References
- 1.Centers for Disease Control and Prevention. National Diabetes Fact Sheet. 2011 http://www.cdc.gov/diabetes/pubs/pdf/ndfs_2011.pdf.
- 2.Nathan DM, Turgeon H, Regan S. Relationship between glycated haemoglobin levels and mean glucose levels over time. Diabetologia. 2007;50:2239–2244. doi: 10.1007/s00125-007-0803-0. [DOI] [PMC free article] [PubMed] [Google Scholar]
- 3.Pribyl J, Skladal P. Development of a combined setup for simultaneous detection of total and glycated haemoglobin content in blood samples. Biosens Bioelectron. 2006;21:1952–1959. doi: 10.1016/j.bios.2005.09.007. [DOI] [PubMed] [Google Scholar]
- 4.Gallagher EJ, Le Roith D, Bloomgarden Z. Review of hemoglobin A(1c) in the management of diabetes. J Diabetes. 2009;1:9–17. doi: 10.1111/j.1753-0407.2009.00009.x. [DOI] [PubMed] [Google Scholar]
- 5.Wareham NJ, Pfister R. Diabetes: glycated hemoglobin is a marker of diabetes and CVD risk. Nat Rev Cardiol. 2010;7:367–368. doi: 10.1038/nrcardio.2010.84. [DOI] [PubMed] [Google Scholar]
- 6.Selvin E, Steffes MW, Zhu H, Matsushita K, Wagenknecht L, Pankow J, Coresh J, Brancati FL. Glycated hemoglobin, diabetes, and cardiovascular risk in nondiabetic adults. N Engl J Med. 2010;362:800–811. doi: 10.1056/NEJMoa0908359. [DOI] [PMC free article] [PubMed] [Google Scholar]
- 7.The Emerging Risk Factors Collaboration. Diabetes mellitus fasting blood glucose concentration and risk of vascular disease: a collaborative meta-analysis of 102 prospective studies. Lancet. 2010;375:2215–2222. doi: 10.1016/S0140-6736(10)60484-9. [DOI] [PMC free article] [PubMed] [Google Scholar]
- 8.Hong LF, Li XL, Guo YL, Luo SH, Zhu CG, Qing P, Xu RX, Wu NQ, Li JJ. Glycosylated hemoglobin A1c as a marker predicting the severity of coronary artery disease and early outcome in patients with stable angina. Lipids Health Dis. 2014;13:89. doi: 10.1186/1476-511X-13-89. [DOI] [PMC free article] [PubMed] [Google Scholar]
- 9.American Diabetes Association. Standards of Medical Care in Diabetes - 2010. Diabetes Care. 2010;33:S11–S61. doi: 10.2337/dc10-S011. [DOI] [PMC free article] [PubMed] [Google Scholar]
- 10.American Diabetes Association. Standards of Medical Care in Diabetes - 2014. Diabetes Care. 2014;37:S14–S80. doi: 10.2337/dc14-S014. [DOI] [PubMed] [Google Scholar]
- 11.Liu JT, Chen LY, Shih MC, Chang Y, Chen WY. The investigation of recognition interaction between phenylboronate monolayer and glycated hemoglobin using surface plasmon resonance. Anal Biochem. 2008;375:90–96. doi: 10.1016/j.ab.2008.01.004. [DOI] [PubMed] [Google Scholar]
- 12.Muoio DM, Newgard CB. Mechanisms of disease: Molecular and metabolic mechanisms of insulin resistance and beta-cell failure in type 2 diabetes. Nat Rev Mol Cell Biol. 2008;9:193–205. doi: 10.1038/nrm2327. [DOI] [PubMed] [Google Scholar]
- 13.Weyer C, Hanson RL, Tataranni PA, Bogardus C, Pratley RE. A high fasting plasma insulin concentration predicts type 2 diabetes independent of insulin resistance: evidence for a pathogenic role of relative hyperinsulinemia. Diabetes. 2000;49:2094–2101. doi: 10.2337/diabetes.49.12.2094. [DOI] [PubMed] [Google Scholar]
- 14.Goetz FC, French LR, Thomas W, Gingerich RL, Clements JP. Are specific serum insulin levels low in impaired glucose tolerance and type II diabetes?: measurement with a radioimmunoassay blind to proinsulin, in the population of Wadena, Minnesota. Metab, Clin Exp. 1995;44:1371–1376. doi: 10.1016/0026-0495(95)90045-4. [DOI] [PubMed] [Google Scholar]
- 15.Manley SE, Stratton IM, Clark PM, Luzio SD. Comparison of 11 human insulin assays: Implications for clinical investigation and research. Clin Chem. 2007;53:922–932. doi: 10.1373/clinchem.2006.077784. [DOI] [PubMed] [Google Scholar]
- 16.Shen H, Aspinwall CA, Kennedy RT. Dual microcolumn immunoassay applied to determination of insulin secretion from single islets of Langerhans and insulin in serum. J Chromatogr, Biomed Appl. 1997;689:295–303. doi: 10.1016/s0378-4347(96)00336-2. [DOI] [PubMed] [Google Scholar]
- 17.Karami A, Baradaran A. Comparative evaluation of three different methods for HbA1c measurement with high-performance liquid chromatography in diabetic patients. Adv Biomed Res. 2014;3:94. doi: 10.4103/2277-9175.129364. [DOI] [PMC free article] [PubMed] [Google Scholar]
- 18.Eckerbom S, Bergqvist Y, Jeppsson JO. Improved method for analysis of glycated haemoglobin by ion exchange chromatography. Ann Clin Biochem. 1994;31:355–360. doi: 10.1177/000456329403100409. [DOI] [PubMed] [Google Scholar]
- 19.Frantzen F, Grimsrud K, Heggli DE, Faaren AL, Lovli T, Sundrehagen E. Glycohemoglobin filter assay for doctors’ offices based on boronic acid affinity principle. Clin Chem. 1997;43:2390–2396. [PubMed] [Google Scholar]
- 20.Jenkins M, Ratnaike S. Capillary electrophoresis of hemoglobin. Clin Chem Lab Med. 2003;41:747–754. doi: 10.1515/CCLM.2003.114. [DOI] [PubMed] [Google Scholar]
- 21.Liu S, Wollenberger U, Katterle M, Scheller FW. Ferroceneboronic acid-based amperometric biosensor for glycated hemoglobin. Sens Actuators, B. 2006;113:623–629. [Google Scholar]
- 22.Song SY, Yoon HC. Boronic acid-modified thin film interface for specific binding of glycated hemoglobin (HbA1c) and electrochemical biosensing. Sens Actuators, B. 2009;140:233–239. [Google Scholar]
- 23.Kim D–M, Shim Y–B. Disposable amperometric glycated hemoglobin sensor for the finger prick blood test. Anal Chem. 2013;85:6536–6543. doi: 10.1021/ac401411y. [DOI] [PubMed] [Google Scholar]
- 24.Boonyasit Y, Heiskanen A, Chailapakul O, Laiwattanapaisal W. Selective label-free electrochemical impedance measurement of glycated haemoglobin on 3-aminophenylboronic acid-modified eggshell membranes. Anal Bioanal Chem. 2015;407:5287–5297. doi: 10.1007/s00216-015-8680-8. [DOI] [PubMed] [Google Scholar]
- 25.Arlett JL, Myers EB, Roukes ML. Comparative advantages of mechanical biosensors. Nat Nanotechnol. 2011;6:203–215. doi: 10.1038/nnano.2011.44. [DOI] [PMC free article] [PubMed] [Google Scholar]
- 26.D’Orazio P. Biosensors in clinical chemistry. Clin Chim Acta. 2003;334:41–69. doi: 10.1016/s0009-8981(03)00241-9. [DOI] [PubMed] [Google Scholar]
- 27.Walgama C, Al Mubarak ZH, Zhang B, Akinwale M, Pathiranage A, Deng J, Berlin KD, Benbrook DM, Krishnan S. Label-free real-time microarray imaging of cancer protein-protein interactions and their inhibition by small molecules. Anal Chem. 2016;88:3130–3135. doi: 10.1021/acs.analchem.5b04234. [DOI] [PubMed] [Google Scholar]
- 28.Munoz EM, Correa J, Riguera R, Fernandez-Megia E. Real-time evaluation of binding mechanisms in multivalent interactions: a surface plasmon resonance kinetic approach. J Am Chem Soc. 2013;135:5966–5969. doi: 10.1021/ja400951g. [DOI] [PubMed] [Google Scholar]
- 29.Tao S, Jia TW, Yang Y, Chu LQ. BSA-Sugar Conjugates as Ideal Building Blocks for SPR-Based Glycan Biosensors. ACS Sensors. 2017;2:57–60. doi: 10.1021/acssensors.6b00679. [DOI] [PubMed] [Google Scholar]
- 30.Cheng MMC, Cuda G, Bunimovich YL, Gaspari M, Heath JR, Hill HD, Mirkin CA, Nijdam AJ, Terracciano R, Thundat T, Ferrari M. Nanotechnologies for biomolecular detection and medical diagnostics. Curr Opin Chem Biol. 2006;10:11–19. doi: 10.1016/j.cbpa.2006.01.006. [DOI] [PubMed] [Google Scholar]
- 31.Homola J, Yee SS, Gauglitz G. Surface plasmon resonance sensors: review. Sens Actuators, B. 1999;54:3–15. [Google Scholar]
- 32.Helmerhorst E, Chandler DJ, Nussio M, Mamotte CD. Real-time and label-free bio-sensing of molecular interactions by surface plasmon resonance: A laboratory medicine perspective. Clin Biochem Rev. 2012;33:161–173. [PMC free article] [PubMed] [Google Scholar]
- 33.Wang S, Shan X, Patel U, Huang X, Lu J, Li J, Tao N. Label-free imaging, detection, and mass measurement of single viruses by surface plasmon resonance. Proc Natl Acad Sci U S A. 2010;107:16028–16032. doi: 10.1073/pnas.1005264107. [DOI] [PMC free article] [PubMed] [Google Scholar]
- 34.Yang A, Hryn AJ, Bourgeois MR, Lee WK, Hu J, Schatz GC, Odom TW. Programmable and reversible plasmon mode engineering. Proc Natl Acad Sci U S A. 2016;113:14201–14206. doi: 10.1073/pnas.1615281113. [DOI] [PMC free article] [PubMed] [Google Scholar]
- 35.Viitala L, Maley AM, Fung HWM, Corn RM, Viitala T, Murtomäki L. Surface plasmon resonance imaging microscopy of liposomes and liposome-encapsulated gold nanoparticles. J Phys Chem C. 2016;120:25958–25966. [Google Scholar]
- 36.Krishnan S, Mani V, Wasalathanthri D, Kumar CV, Rusling JF. Attomolar detection of a cancer biomarker protein in serum by surface plasmon resonance using superparamagnetic particle labels. Angew Chem, Int Ed. 2011;50:1175–1178. doi: 10.1002/anie.201005607. [DOI] [PMC free article] [PubMed] [Google Scholar]
- 37.Singh V, Rodenbaugh C, Krishnan S. Magnetic optical microarray imager for diagnosing type of diabetes in clinical blood serum samples. ACS Sens. 2016;1:437–443. doi: 10.1021/acssensors.5b00273. [DOI] [PMC free article] [PubMed] [Google Scholar]
- 38.Wei H, Ratchford D, Li XQ, Xu HX, Shih C-K. Propagating surface plasmon induced photon emission from quantum dots. Nano Lett. 2009;9:4168–4171. doi: 10.1021/nl9023897. [DOI] [PubMed] [Google Scholar]
- 39.Vance SA, Sandros MG. Zeptomole detection of C-reactive protein in serum by a nanoparticle amplified surface plasmon resonance imaging aptasensor. Sci Rep. 2015;4:5129. doi: 10.1038/srep05129. [DOI] [PMC free article] [PubMed] [Google Scholar]
- 40.Malic L, Sandros MG, Tabrizian M. Designed biointerface using near-infrared quantum dots for ultrasensitive surface plasmon resonance imaging biosensors. Anal Chem. 2011;83:5222–5229. doi: 10.1021/ac200465m. [DOI] [PubMed] [Google Scholar]
- 41.Pu Y, Zhu Z, Han D, Liu H, Liu J, Liao J, Zhang K, Tan W. Insulin-binding aptamer-conjugated graphene oxide for insulin detection. Analyst. 2011;136:4138–4140. doi: 10.1039/c1an15407a. [DOI] [PMC free article] [PubMed] [Google Scholar]
- 42.Lin H–I, Wu C-C, Yang C-H, Chang K-W, Lee G-B, Shiesh S-C. Selection of aptamers specific for glycated hemoglobin and total hemoglobin using on-chip SELEX. Lab Chip. 2015;15:486–494. doi: 10.1039/c4lc01124d. [DOI] [PubMed] [Google Scholar]
- 43.Gao L, Li Q, Li R, Yan L, Zhou Y, Chen K, Shi H. Highly sensitive detection for proteins using graphene oxide-aptamer based sensors. Nanoscale. 2015;7:10903–10907. doi: 10.1039/c5nr01187f. [DOI] [PubMed] [Google Scholar]
- 44.Lai RY, Plaxco KW, Heeger AJ. Aptamer-based electrochemical detection of picomolar platelet-derived growth factor directly in blood serum. Anal Chem. 2007;79:229–233. doi: 10.1021/ac061592s. [DOI] [PubMed] [Google Scholar]
- 45.Satija J, Sai VVR, Mukherji S. Dendrimers in biosensors: Concept and applications. J Mater Chem. 2011;21:14367–14386. [Google Scholar]
- 46.Shumaker-Parry JS, Campbell CT. Quantitative methods for spatially resolved adsorption/desorption measurements in real time by surface plasmon resonance microscopy. Anal Chem. 2004;76:907–917. doi: 10.1021/ac034962a. [DOI] [PubMed] [Google Scholar]
- 47.Wegner GJ, Wark AW, Lee HJ, Codner E, Saeki T, Fang S, Corn RM. Real-time surface plasmon resonance imaging measurements for the multiplexed determination of protein adsorption/desorption kinetics and surface enzymatic reactions on peptide microarrays. Anal Chem. 2004;76:5677–5684. doi: 10.1021/ac0494275. [DOI] [PubMed] [Google Scholar]
- 48.Verwilghen RL. Recommendations for reference method for haemoglobinometry in human blood (ICSH standard 1986) and specifications for international haemiglobincyanade reference preparation (3rd edn). International Committee for Standardization in Haematology; Expert panel on haemoglobinometry. Clin Lab Haematol. 1987;9:73–79. doi: 10.1111/j.1365-2257.1987.tb01384.x. [DOI] [PubMed] [Google Scholar]
- 49.Katsamba PS, Navratilova I, Calderon-Cacia M, Fan L, Thornton K, Zhu M, Bos TM, Forte C, Friend D, Laird-Offringa I, Tavares G, Whatley J, Shi EA, Widom A, Lindquist KC, Klakamp S, Drake A, Bohmann D, Roell M, Rose L, Dorocke J, Roth B, Luginbühl B, Myszka DG. Kinetic analysis of a high-affinity antibody/antigen interaction performed by multiple Biacore users. Anal Biochem. 2006;352:208–221. doi: 10.1016/j.ab.2006.01.034. [DOI] [PubMed] [Google Scholar]
- 50.Trabucchi A, Iacono RF, Guerra LL, Faccinetti NI, Krochik AG, Arriazu MC, Poskus E, Valdez SN. Characterization of insulin antibodies by Surface Plasmon Resonance in two clinical cases: brittle diabetes and insulin autoimmune syndrome. PLoS One. 2013;8:e84099. doi: 10.1371/journal.pone.0084099. [DOI] [PMC free article] [PubMed] [Google Scholar]
- 51.Subramanian K, Fee CJ, Fredericks R, Stubbs RS, Hayes MT. Insulin receptor-insulin interaction kinetics using multiplex surface plasmon resonance. J Mol Recognit. 2013;26:643–652. doi: 10.1002/jmr.2307. [DOI] [PubMed] [Google Scholar]
- 52.Stöllner D, Warsinke A, Stöcklein W, Dölling R, Scheller F. Immunochemical Determination of Hemoglobin-A1c Utilizing a Glycated Peptide as Hemoglobin-A1c Analogon. BIOSENSOR Symposium; Tübingen. 2001. [Google Scholar]
- 53.Jayasena SD. Aptamers: an emerging class of molecules that rival antibodies in diagnostics. Clin Chem. 1999;45:1628–1650. [PubMed] [Google Scholar]
- 54.Brody EN, Gold L. Aptamers as therapeutic and diagnostic agents. Rev Mol Biotechnol. 2000;74:5–13. doi: 10.1016/s1389-0352(99)00004-5. [DOI] [PubMed] [Google Scholar]
- 55.Mayer G. The chemical biology of aptamers. Angew Chem, Int Ed. 2009;48:2672–2689. doi: 10.1002/anie.200804643. [DOI] [PubMed] [Google Scholar]
- 56.Wang D, He J, Rosenzweig N, Rosenzweig Z. Super-paramagnetic Fe2O3 beads–CdSe/ZnS quantum dots core–shell nanocomposite particles for cell separation. Nano Lett. 2004;4:409–413. [Google Scholar]
- 57.Ahmed SR, Dong J, Yui M, Kato T, Lee J, Park E. Quantum dots incorporated magnetic nanoparticles for imaging colon carcinoma cells. J Nanobiotechnol. 2013;11:28. doi: 10.1186/1477-3155-11-28. [DOI] [PMC free article] [PubMed] [Google Scholar]
Associated Data
This section collects any data citations, data availability statements, or supplementary materials included in this article.


