

Summary
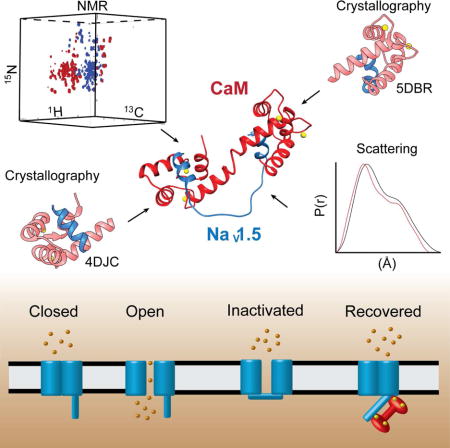
The function of the human cardiac sodium channel (NaV1.5) is modulated by the Ca2+-sensor calmodulin (CaM), but the underlying mechanism(s) are controversial and poorly defined. CaM has been reported to bind in a Ca2+-dependent manner to two sites in the intracellular-loop that is critical for inactivation of NaV1.5 (inactivation gate; IG). The affinity of CaM for the complete IG was significantly stronger than that of fragments that lacked both complete binding sites. Structural analysis by NMR, crystallographic, and scattering approaches revealed that CaM simultaneously engages both IG sites using an extended configuration. Patch clamp recordings for wild-type and mutant channels with an impaired CaM-IG interaction revealed CaM binding to the IG promotes recovery from inactivation while impeding the kinetics of inactivation. Models of full-length NaV1.5 suggest CaM binding to the IG directly modulates channel function by destabilizing the inactivated state, which would promote resetting of the IG after channels close.
eTOC blurb
The mechanism of calcium regulation of cardiac sodium channel (NaV1.5) gating is much debated. Johnson et al. define a strong, calcium-dependent interaction between the intracellular calcium sensor calmodulin and the gate controlling inactivation of NaV1.5. They find that calmodulin binding to the gate alters the recovery from inactivation.
Introduction
Voltage-gated sodium channels (NaV) are a critical element of most excitable cells including cardiomyocytes. Mutations in the cardiac NaV channel (NaV1.5) are associated with life-threatening disorders of heart rhythm (arrhythmia) (Amin et al., 2010; Makita et al., 2014; Tester et al., 2014). NaV channels open in response to membrane depolarization, rapidly inactivate within 1-2 ms and transition to a closed state; reopening of the channel occurs primarily from the closed state (Hodgkin and Huxley, 1952). The core of NaV1.5 is the pore-forming α subunit containing four transmembrane domains with intracellular and extracellular linkers (Fig. 1). Channel inactivation primarily occurs by a fast inactivation process that involves the intracellular linker between domains 3 and 4, which is believed to function as a lid covering the pore and is often referred to as the inactivation gate (IG) (Kellenberger et al., 1996; Vassilev et al., 1989). Although the precise mechanisms of inactivation are poorly understood, it is commonly accepted that a Ile-Phe-Met (IFM) motif contained within the IG functions as a ‘latch’ that holds the gate closed during fast inactivation, as alterations to the latch or nearby residues can disrupt or eliminate channel inactivation (Patton et al., 1992; Rohl et al., 1999; West et al., 1992). A recent structure of NaV1.4 shows the corresponding IG Phe side chain nestled into a pocket on the cytoplasmic side of the channel, consistent with a potential inactivated configuration (Shen et al., 2017).
Fig. 1. Overview of the human cardiac voltage-gated sodium channel.
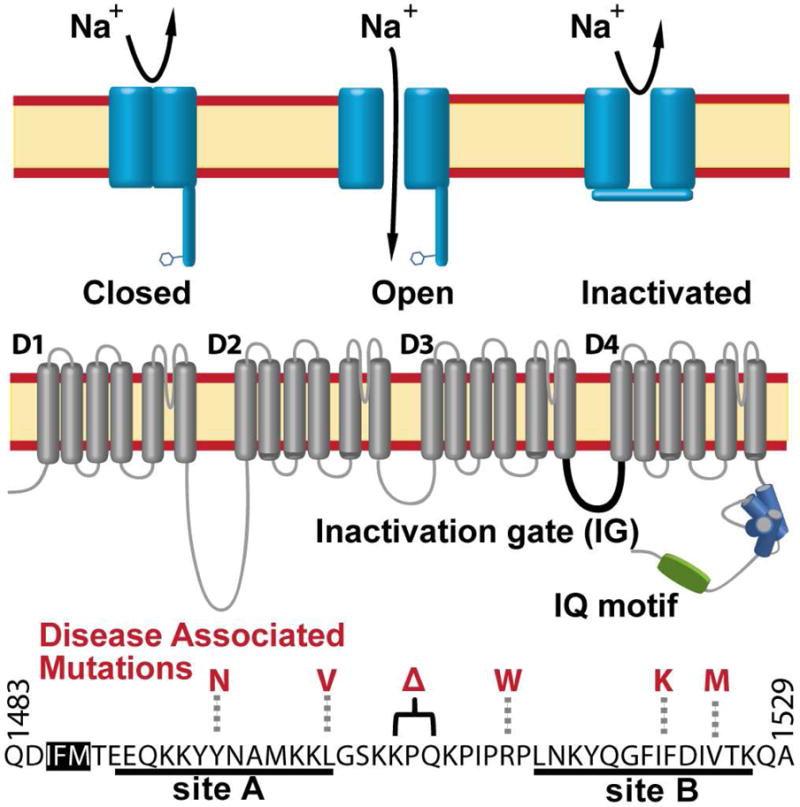
(Top) Diagram highlighting the main configurations and key features of the α subunit of NaV1.5. (Middle) Schematic diagram of the NaV1.5 α subunit. The four membrane spanning domains are designated as D1-D4. The intracellular linker between domains III and IV (shown in black) functions as the fast inactivation gate (IG). The IQ motif (green) and C terminal EF hand like motif (blue) are shown as cylinders. (Bottom) Domain III-IV linker sequence with the CaM binding sites underlined. The IFM ‘latch’ amino acids are highlighted in white with black relief. Cardiac disease associated mutations investigated in this study are highlighted in red.
The regulation of Nav1.5 by Ca2+ was first reported ~15 years ago, but has been the subject of much controversy (Tan et al., 2002; Wingo et al., 2004). Nevertheless, it is generally accepted that the ubiquitous Ca2+ sensor CaM has a role in modulating channel gating function, although a number of contrasting models have been proposed (Chagot and Chazin, 2011; Hovey et al., 2017; Sarhan et al., 2009, 2012a; Shah et al., 2006; Wingo et al., 2004). The controversies have arisen in part due to the complexity of the Ca2+ sensing apparatus, which includes an extended region from the NaV1.5 C-terminus, the IG, and CaM. It is well established that CaM binds to an IQ motif C-terminal to an EF-hand domain in the NaV1.5 C-terminus. Exactly how this interaction modulates Ca2+ sensitivity is not known even though structures of CaM bound to the IQ motif in the absence and presence of Ca2+ are available (Chagot et al., 2009; Gabelli et al., 2014; Shah et al., 2006; Wang et al., 2014). CaM also binds to the NaV1.5-IG (Fig. 1), which provides a more direct link to modulate channel inactivation (Potet et al., 2009; Sarhan et al., 2009, 2012a; Shah et al., 2006). An NMR study showed that when activated by Ca2+, both domains of CaM engaged a motif in the IG (I1510-F1530, termed here site B) (Potet et al., 2009). Subsequently, an X-ray crystal structure obtained at high Ca2+ was reported, in which the C-terminal domain of CaM (CaM-C) is bound to a different motif in the IG (Q1490-L1501, site A), while the N-terminal domain (CaM-N) remained free (Fig. 1). In both reports, the affinity of CaM for either IG construct was relatively modest (Kd = 3-8 M) as neither construct contained the complete sequence for both IG binding sites. Moreover, the physiological relevance of interaction of CaM with the IG has been called into question, as these CaM affinities for the IG are weaker than that measured for the binding of CaM to the IQ motif (Kd ~ 0.1 uM) (Potet et al., 2009; Sarhan et al., 2012a; Shah et al., 2006; Wang et al., 2014).
Here we address the controversy over the interaction of CaM with the NaV1.5-IG. We find binding of CaM to the entire IG is significantly stronger than that reported previously. Combining data from X-ray crystallography, NMR spectroscopy, and small angle X-ray scattering, we determined that CaM binds to the IG in a unique extended configuration. Structure-guided mutagenesis validated the structure and was used to design whole cell patch clamp recordings that probed the specific effects of IG mutations on channel function. Mutant channels with an impaired CaM-IG interaction required more time to recover from inactivation than wild-type. These data indicate CaM binding to the IG promotes recovery from inactivation. Together, our results demonstrate a previously unrecognized structural basis for how CaM binds the complete IG and suggest a mechanism for how CaM modulates NaV1.5 function.
Results
CaM binds tightly to the complete NaV1.5-IG in a Ca2+ dependent manner
To characterize the CaM interaction with the two previously reported CaM binding sites, a 62-residue peptide (D1471-V1532) corresponding to the full-length IG was produced and characterized (Fig. S1a). A dissociation constant (Kd) of 12 ± 2 nM (ΔH = −9.3 ± 0.1 Kcal/mol, ΔS = 5.2 ± 1.1 cal/mol•deg) was measured for CaM binding to this peptide in the presence of Ca2+ using isothermal titration calorimetry (ITC), whereas no interaction was observed in the absence of Ca2+ (Fig. S1b,c). This nM affinity of Ca2+-loaded CaM for the NaV1.5-IG contrasts significantly with the Kd values of 0.6 μM and 3.1 μM reported previously for Ca2+-loaded CaM binding shorter inactivation gate peptides, neither of which contain both complete A and B binding sites (Potet et al., 2009; Sarhan et al., 2012a).
To determine if all 62 residues of the IG are required for high affinity CaM binding, a series of N- and C-terminally truncated IG peptides was prepared and their affinity measured by ITC. Consistent with a previous report (Sarhan et al., 2012a), we found the N terminus could be truncated to Q1483 with no effect on CaM affinity (data not shown). At the C terminus, truncating to A1529 did not substantially weaken CaM binding affinity (Kd = 66 ± 11 nM) (Fig. S1b), but further reductions to T1526, D1523, and G1519 incrementally reduced affinity into the μM range (Supplementary Table 1). [The modest 5-fold higher Kd value for Q1483-A1529 relative to D1471-V1532 can be attributed to the lower ionic strength buffer required to measure affinity for the longer peptide due to its limited solubility under higher ionic strength conditions.] A comparison of 15N-1H HSQC NMR spectra of Ca2+-CaM in the presence of the full-length (D1471-V1532) and truncated IG peptides (Q1483-A1529) confirmed that they bind to CaM in the same mode (Fig. S1d). All further studies were therefore performed on the Q1483-A1529 peptide. Further characterization of this complex by size exclusion chromatography coupled to multi angle light scattering (SEC-MALS) revealed that a 1:1 CaM-IG complex was formed (Fig. S1e). Analysis of the complex by SAXS (see below) confirmed the 1:1 stoichiometry (22.7 kDa, calculated mass of 22.6 kDa). Together, these results show that CaM has a much tighter affinity for the IG than was previously appreciated and that a direct 1:1 complex is formed.
CaM uses both -N and -C domains to engage both NaV1.5-IG binding sites
In an effort to define the structure of the CaM-IG interaction, the complex of Ca2+-loaded CaM with the high affinity IG peptide was crystallized. These crystals diffracted to 2.25 Å and the structure was determined by molecular replacement using coordinates from the crystal structure with the C-terminal domain of CaM (CaM-C) bound to IG site A (Q1491-L1501) (16). In our complex, well-resolved density was observed for CaM residues L4-K148. However, resolved density for the IG was observed for only the 14 residues of site B (L1514-K1527) (Fig. S2). The interaction with only one of the IG binding sites in this structure was surprising because it is inconsistent with our observations that both IG sites are required for high affinity binding (Potet et al., 2009; Sarhan et al., 2009, 2012a). Moreover, our biophysical data shows that a 1:1 complex is formed, yet in the crystal structure, each CaM interacts with two different IG peptide molecules. Such ‘domain-swapped’ arrangements in crystal structures of CaM are not unique (e.g. (Majava et al 2009)). These observations led us to consider that the unique environment of the crystal lattice stabilizes a structure that provides an incomplete picture of CaM binding to the IG. Consequently, we turned to an NMR approach in solution to test this hypothesis and better understand the nature of the CaM-IG interaction.
NMR signals are highly sensitive to local electronic environment. As a result, residues that interact with a ligand usually display alterations in resonance frequency (chemical shifts) and can be used to map a binding interface. Therefore, reciprocal NMR titrations of CaM and IG peptide (Fig. 3, S3, and S4) were performed to directly establish which IG binding sites and CaM domains are involved. Notably, saturation was observed in the NMR titrations at 1:1 stoichiometry (independent of titration direction), consistent with the stoichiometry reported from our ITC, SEC-MALS and X-ray scattering data.
Fig. 3. NMR analysis of the interaction of CaM with the NaV1.5 IG.
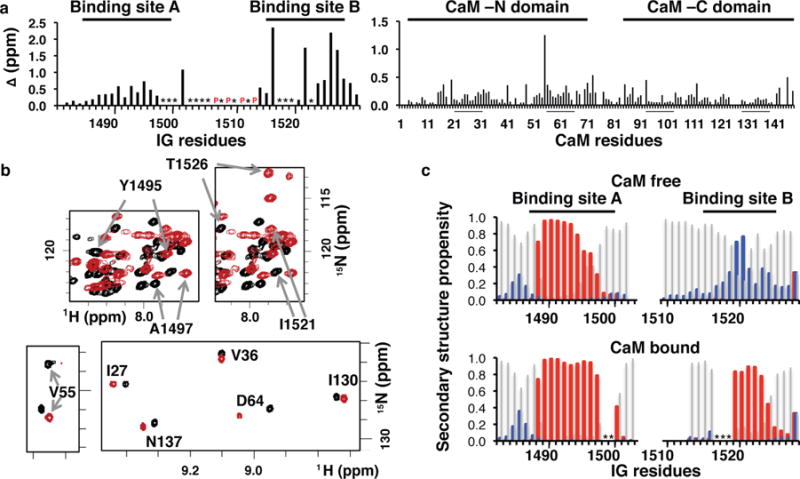
a) Binding-induced chemical shift perturbations in backbone 15N-1H resonances of the IG peptide (left) and CaM (right). CaM Ca2+ binding loop residues are underlined. An * indicates cross peaks were not visible or not distinguishable due to spectral overlap. CaM V55 displays the largest perturbation in chemical shift, but the origin of this effect is not known. P denote proline residues. b) Overlay of regions from the 15N-1H spectra in the absence (black) and presence (red) of binding partner for: IG peptide (upper panels) and CaM (lower panels). Full spectra and resonance assignments are available in SI. c) Secondary structure prediction (TALOS+, helix, sheet, and coil) based on NMR 1H, 15N, 13CA, 13CB, and 13CO chemical shifts of the inactivation gate peptide in the absence (upper) and presence (lower) of CaM. Blank spaces indicate a value could not be calculated due to missing or significantly overlapped resonances.
Titrating 15N-enriched CaM with unlabeled IG peptide produced a substantial number of chemical shift perturbations (CSPs) in both CaM domains (Fig. 3). In the reciprocal titration of 15N-enriched IG, resonances from both the A and B sites exhibited significant CSPs upon formation of the complex (Figs. 3, S3 and S4). Moreover, the majority of the signals decreased in intensity, and new signals appeared over the course of the titration, an observation consistent with the nM affinity determined by ITC (Fig. S1c). These results indicate that both CaM domains as well as both IG sites are involved in the interaction.
We next asked if specificity and high affinity were encoded in the isolated CaM domains and/or NaV1.5-IG binding sites. To this end, recombinant proteins corresponding to the independent CaM domains and NaV1.5-IG binding sites were prepared, and the four permutations of CaM-IG interactions were characterized by ITC and NMR. The interactions between CaM-N and CaM-C with either of the IG binding sites were substantially weaker than the nM affinity observed for CaM with the complete IG, so weak that accurate measurements could not be made using ITC. These much weaker interactions were also reflected in NMR titrations, where the changes in the signals occurred in the fast exchange regime on the NMR time scale relative to the slow and intermediate exchange observed for full-length CaM with the complete IG (Fig. S5a). Kd values calculated from the NMR titrations were all in the high μM range, consistent with the difficulty to obtain affinities by ITC. The weak CaM affinity for IG site A contrasts with a previous report of Kd of ~3 uM (Sarhan et al., 2009). However, that study utilized the Q1483-F1522 peptide, which contains not only site A but also a portion of site B. Our results show that neither CaM domain has a significant preference for binding to either of the individual IG binding site peptides (Fig. S5b,c).
Overall these experiments show that none of the single contacts between the CaM domains and individual IG binding sites are strong, from which we conclude that both CaM domains and both the A and B IG binding sites are required for tight binding. This supports the notion that the crystal structures of CaM complexes with different IG peptides do not fully reflect the manner in which CaM binds to the IG in solution.
CaM binds to the NaV1.5-IG in an extended anti-parallel configuration
Having established that both CaM domains are bound to both NaV1.5-IG binding sites, we next turned to directly determining the overall architecture of the complex using small angle X-ray scattering (SAXS), which is a powerful technique to characterize the shape of molecules in solution (Putnam et al., 2007). Analysis of the SAXS data for the complex revealed a combination of significant ordered globular structure and some disordered segments, as was readily apparent from inspection of the Kratky plot (Fig. S6a-c). The SAXS distance distribution function, P(r), provides a histogram of distances between all pairs of atoms. The P(r) curve is sensitive to the overall shape of the molecular system, and following the common approach to distinguish different architectures, we compared the experimental P(r) to the P(r) back-calculated from structural coordinates of known CaM complexes.
Overlays of the experimental P(r) function for the complex of Ca2+-loaded CaM with NaV1.5-IG and the P(r) back-calculated from structures of three known classes of CaM complexes are shown in Fig. 4 and Fig. S6d-i. The experimental P(r) contains two features, a large peak with a maximum at 21 Å and a smaller shoulder with a maximum at 40 Å (Fig. 4, black lines). In the previously published crystal structure, CaM is bound to only one of the NaV1.5-IG binding sites with the peptide extending out in a perpendicular orientation (Sarhan et al., 2012a). The back-calculated P(r) function for this architecture results in two distinct maxima (Fig. 4a red curve) offset from the two features in the experimental P(r) (black curve). This and the high value of the χ2 fitting parameter (19.1) indicate that the complex does not adopt this architecture in solution, and is consistent with our data showing that both domains of CaM interact with both NaV1.5-IG binding sites. Similarly, the P(r) function back-calculated from a structure in classical “wrap-around” mode displays poor agreement with the experimental P(r), as is readily evident in the value of χ2 (27.5) and the maximum distance of the curve (Dmax), which is significantly shorter than that observed in the experimental data (Fig. 4b). In contrast to the first two complexes, a much greater similarity between the experimental and back-calculated P(r) functions is found for the NMR structure of CaM bound to an HIV matrix peptide (Vlach et al., 2014) (χ2= 5.0), as the overall shape and features are reasonably well reproduced (Fig. 4c). Thus, the P(r) analysis shows that the CaM-IG complex shares a similar global architecture to that of the CaM-HIV matrix peptide complex with the CaM domains extended and both NaV1.5-IG binding sites engaged and we note this architecture is similar to several other CaM-peptide structures (Reichow et al., 2013; Rodríguez-Castañeda et al., 2010). While further refinement of the structure could be pursued, the Porod exponent of 2.7 indicates there is a substantial degree of inter-domain flexibility in the complex, which implies that further refinement would lead to an untoward degree of speculation about the relative positioning of the CaM domains.
Fig. 4. Analysis of the architecture of the CaM-NaV1.5-IG complex by small angle X-ray scattering.
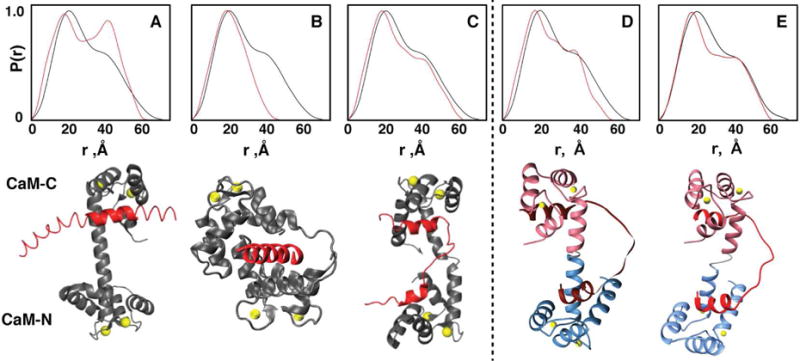
Overlays of the experimental SAXS P(r) for the CaM-NaV1.5-IG complex (black) with the back-calculated P(r) (red) extracted from coordinates of CaM complexes with (A) an extended peptide of NaV1.5 based on PDB 4DJC (χ2= 19.1),(B) MLCK PDB 2O5G (χ2= 27.5)., and the (C) HIV matrix protein PDB 2MGU (χ2= 5.0). SAXS profiles of our experimental data (black) overlaid with our optimized final structures (red) (D) (χ2= 6.3) and (E) (χ2= 4.6).
To determine the orientation of CaM on the NaV1.5-IG, two IG variants were prepared with mutations of a hydrophobic anchor residue in either site A or site B. The corresponding effects on the binding of the IG peptide by Ca2+-loaded CaM were analyzed using NMR. Site A was investigated with the disease-associated Y1494N mutation. A previous study of the Y1494A site A mutation reported that the affinity for CaM was substantially reduced (15). Our NMR analysis revealed that the Y1494N mutation significantly perturbs the interactions of the IG with residues within the CaM-C domain (Fig. 5), consistent with the previous study of Y1494A and the proposed role of this residue as an anchor for the hydrophobic patch of CaM-C (Sarhan et al., 2012a). To study the effect of mutation in site B, the disease-associated I1521K mutation was investigated. NMR analysis of this mutation revealed the interaction with the CaM-N domain was substantially altered (Fig. 5), consistent with its position at the center of site B in our crystal structure. Together, these data indicate that CaM binds to the IG in an anti-parallel orientation with CaM-C engaged on site A in the N-terminal portion of the IG and CaM-N engaged on site B in the C-terminal portion of the IG.
Fig. 5. Disease-associated NaV1.5-IG mutations cause domain-specific perturbations of the interaction with CaM.
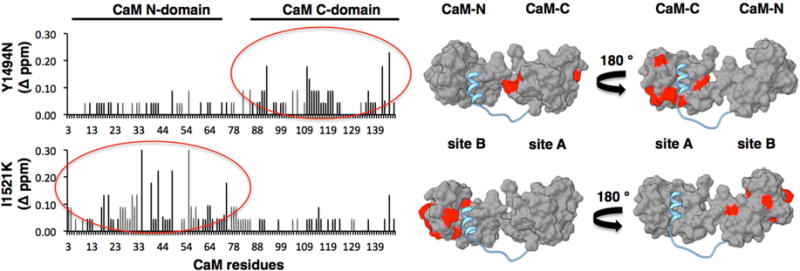
Plots of differences in CaM NMR backbone resonance CSPs calculated for complexes with wild type versus mutant IG peptides. Red circles highlight differences in CaM-C in the Y1494N IG peptide complex and CaM-N in the I1521K IG peptide complex (left). Surface rendering of CaM-IG complex with significant CSPs highlighted in red (right).
We next generated a hybrid structural model for the complex of Ca2+-CaM bound to the NaV1.5-IG using all available structural data. The previously published crystal structure provided a model for site A bound to CaM-C. Our new crystal structure provided the complementary model for site B bound to CaM-N. The models of the two sub-complexes were then linked together by overlaying the central helix of CaM from each crystal structure to generate the initial structural model for the full complex. This model was refined to optimize the fit to the SAXS data by systematically varying the distance between the two sub-complexes and the intervening dihedral angle, then comparing the back-calculated P(r) and to the experimental data. This study not only provided a ‘best-fit’ but also revealed how well defined the two parameters could be determined in the final structural model: changes of ± 2 Å or greater in separation and ± 15° or greater in rotation resulted in significantly poorer fits to the experimental P(r) (Fig. S6j). The best fit to the data required translating the domains in the starting structure closer together by only 2 Å and rotating about the axis of central helix by 300° (Figs. 4d, S6 j,k).
Two additional steps were required to complete the refinement of the structure. First, the residues between the two NaV1.5-IG binding sites (G1502-P1513) had to be added because neither of the two crystal structures has high quality electron density for, these residues. In order to best fill the gap between the two binding sites, the residues were generated in extended conformation. Second, the model was further refined to best fit the SAXS data. As in most other CaM crystal structures, both structures with IG peptides have long central helices. However, it is known that the full helix is only formed transiently in solution (Akke et al., 1993). Hence, the relative position of the two domains was adjusted in silico; the best result was found by closely mimicking the position of the two domains in the extended structure of CaM with the HIV peptide, leading to a good fit to the data χ2 = 4.6 (Fig. 4e). Although further refinement of the structure to achieve even better fit to the SAXS data is possible, the Porod exponent of 2.7 derived from the SAXS data implies there is considerable flexibility in the system, so further refinement would amount to an over-interpretation of the data (Putnam et al., 2007). Overall, in our final hybrid structural model the molecular details of the interactions between CaM and the NaV1.5-IG are well defined whereas there is higher uncertainty in the overall architecture of the complex.
Model of NaV1.5 suggests the CaM-IG interaction destabilizes channel inactivation
To further understand the implications of our structural findings, we generated homology models of the full length NaV1.5 based on the cryo-EM structures of rabbit CaV1.1, eel NaV1.4, and cockroach NaVPas (Shen et al., 2017; Wu et al., 2016; Yan et al., 2017b) (Figs. 6, S7). Our analysis focused on the model generated from the CaV1.1 structure (Fig. 6) because (i) the residues at the edges of the transmembrane regions of interest are well defined, and (ii) of the three, it is the only channel construct that has been shown to be functional (Shen et al., 2017; Wu et al., 2016; Yan et al., 2017b). Our model provides insight into the locations of the transmembrane domains, including the spatial proximity of the cytosolic inter-domain linkers. The orientation of the protein in the lipid bi-layer was set using the Orientations of Proteins in Membranes database (Lomize et al., 2012). There has been some controversy regarding the accessibility of the entire IG for interaction with CaM, in particular, for site B (Sarhan et al., 2009). However, in all three homology models, the IG A and B sites are in the cytosol. Site A is clearly accessible for CaM binding, and while site B is adjacent to the transmembrane region, it is not in to the lipid bilayer and is also accessible for CaM binding.
Fig. 6. Homology model of NaV1.5 α subunit (grey ribbons) orientated in a lipid bi-layer.
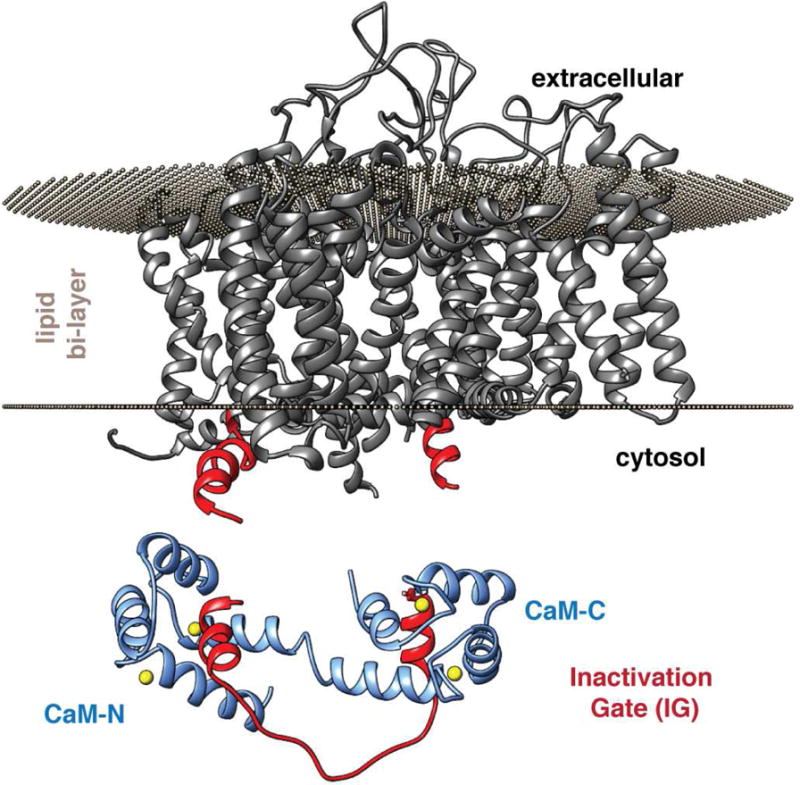
The edges of the D3D4 linker from the model that form the IG are highlighted in bright red. The CaM-IG structure is shown below.
Figure 6 shows how well the structure of the CaM-IG complex aligns to the model of NaV1.5, and suggests how the CaM-IG interaction can directly modulate channel function. F1486 is a key residue in the conserved IFM motif of NaV1.5 channels. It is believed to be inserted into a hydrophobic pocket across the pore and hold the gate closed (Kellenberger et al., 1996). The recent structure of NaV1.4 appears to have captured the structure with the latch engaged, however, this awaits functional conformation (Yan et al., 2017b). Importantly the engagement of the channel latch is known to be very sensitive and easily disrupted (Hartmann et al., 1993; Kellenberger et al., 1996; West et al., 1992). Furthermore, mutations to residues adjacent to the latch (E1489, E1490) have been shown to modulate CaM binding and channel inactivation (Sarhan et al., 2012a). Our NMR data are consistent with this finding, showing that the binding of the CaM significantly alters the local environment of residues adjacent to the latch, which suggests CaM would dislodge the Phe latch from the NaV1.5 channel pocket. (Fig 3a and Fig S7). Structures of the complex show that CaM does not directly contact the latch residues, so CaM exerts its effect on channel inactivation in an allosteric manner. Beyond the specific effect of CaM-C binding at site A near the latch, we propose that binding of CaM-N to NaV1.5-IG site B alters the orientation of this portion of the gate and thereby also disrupts the ability of the latch to engage. This model implies that Ca2+-dependent binding of CaM to the NaV1.5-IG would destabilize channel inactivation. Our hypothesis is supported by the observation that an antibody raised against a NaV1.5-IG site A epitope inhibits channel inactivation (Vassilev et al., 1989).
Impeding the CaM-IG interaction affects inactivation of NaV1.5
To test the predictions of our model, we investigated the functional effects of structure-based mutations in the NaV1.5-IG. If our hypothesis is correct, mutations that impair CaM binding to NaV1.5-IG should promote stability of the inactivation state and thereby increase the time required for channels to recover from inactivation. For these studies, we again turned to hydrophobic anchor IG mutants and tested their effect on channel gating function. Given the many factors that affect channel gating, we felt it imperative to design subtle mutations that would result in only modest effects on channel function in order to obtain a clean and directly interpretable result. Our goal was to probe specifically the effects of CaM binding to the IG, while ensuring that the mutations do not alter other aspects of NaV1.5 function. Therefore, for our functional studies we designed two mutations, Y1494L in Site A and F1522L in Site B, that are predicted to only perturb CaM binding.
To test our mutant designs, we performed ITC experiments to measure the binding to CaM of IG peptides with one, the other, or both mutations (Fig. S8a). For all three variant peptides, there is clear perturbation of the binding curve, indicating that these mutations alter the manner in which CaM interacts with the IG. The binding curves for the variants are multi-phasic, reflecting the existence of multiple complexes over the course of the titration. We attribute this to the reduction in affinity of CaM-C for site A and/or CaM-N for site B, as a result of the mutations. To validate the reduced binding affinity, we performed an NMR experiment on the complex of 15N-enriched IG peptide double mutant and CaM, and compared to the complex with WT IG peptide (Fig. S8b). For the CaM complex with the double mutant variant, numerous cross-peaks of the IG peptide are absent relative to what is observed for the WT complex, consistent with an intermediate mode of exchange on the NMR timescale for the variant versus slow exchange observed for the WT. This difference in rate of exchange is consistent with a significant reduction in the affinity of CaM for both sites A and B for the variant IG peptide. It is important to note, the combination of these two mutations impairs but does not completely eradicate the CaM-IG interaction.
NaV1.5 channels containing either site A, site B, or the combination of both IG mutations were investigated by acquiring whole cell patch clamp recordings. CaM binding to both sites in the inactivation gate is anticipated to affect the ability of the latch to engage, and therefore alter both the recovery from inactivation and kinetics of inactivation. Steady state inactivation has been the primary effect reported for Ca2+ modulation of NaV channel function (Gabelli et al., 2014; Sarhan et al., 2009, 2012a; Shah et al., 2006; Tan et al., 2002; Wingo et al., 2004). In the presence of Ca2+, we found neither the single nor the double site mutations altered the voltage dependence of steady state inactivation (Fig. S9). In addition, we observed only minimal effects on recovery of inactivation for mutation in site A and no effect for mutation in site B (Fig. S9). However, the double mutant exhibited a much stronger effect, altering channel function in two distinct ways. First, the time required for channels to recover from fast inactivation was ~3 fold slower for the double mutant relative to WT (WT: τfast = 5.8 ± 0.5 ms, τslow = 60.1 ± 4.9 ms; Y1494L,F1522L: τfast = 15.8 ± 4 ms, τslow = 156.1 ± 41 ms), a significant difference when the CaM-IG interaction is impaired (P = 0.01, n=15 and 12, respectively). Note that the relative weights of the τfast and τslow components of recovery were not changed by the CaM-IG mutations (WT fast = 78 ± 3%, slow = 22 ± 3, vs. CaM-IG impaired fast = 81 ± 3%, slow = 19 ± 3; P = 0.8, n = 15). Second, fast inactivation kinetics was hastened by ~25% at hyperpolarized potentials (WT = 1.32 ± 0.08 ms vs. CaM-IG impaired = 0.99 ± 0.07 ms; P = 0.01, n = 20 and 12, respectively) (Fig. 7). Thus, it is only the combination of mutations in both sites that results in significant effects on channel function.
Fig. 7. Inhibition of the CaM-IG interaction alters the inactivation kinetic and its recovery.
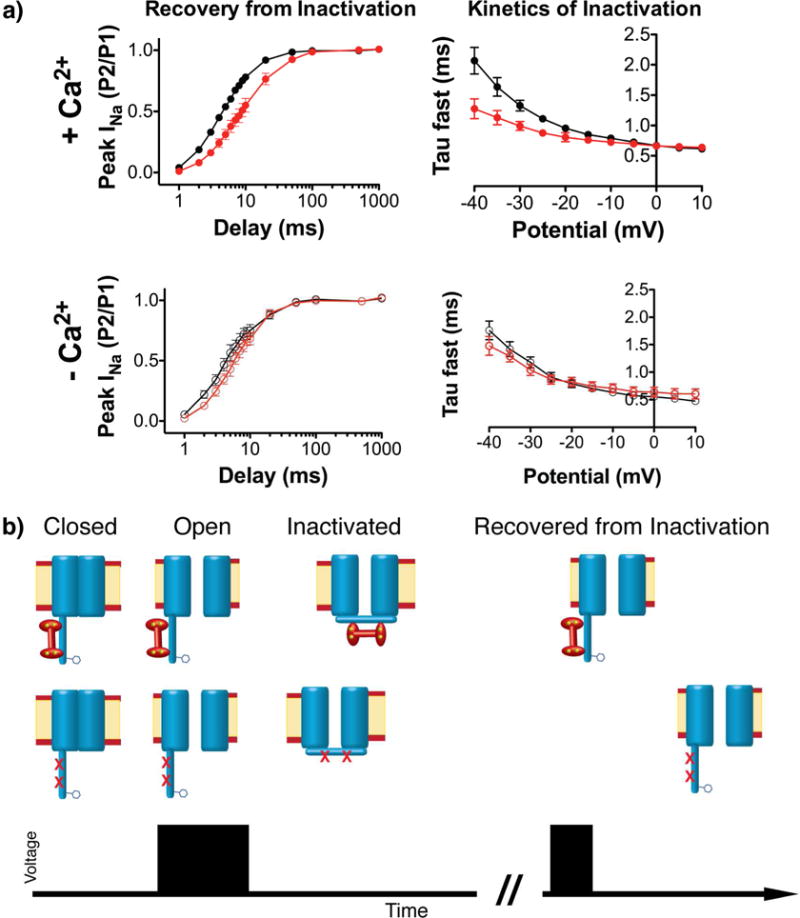
a) Overlays of WT (black) and reduced CaM-IG (red) recovery from inactivation (left) and fast kinetic of inactivation (right) in the presence (upper) and absence (lower) of Ca2+. b) Cartoon illustration of the effects of impairing the CaM-IG interaction on NaV channel function in the presence of Ca2+. A summary of fitting values and statistics are shown in Fig. S9.
To ensure the observed effects on channel function were due to the impaired binding of CaM to the IG, we repeated the patch clamp recording in absence of Ca2+. Because the CaM-IG interaction is strictly Ca2+ dependent, these experiments enabled us to determine if the mutations influenced channel functions independent of CaM binding. Consistent with our hypothesis, none of the recordings obtained in these experiments showed any significant difference between WT and IG (A+B) mutant channels. In the absence of Ca2+, the recovery from fast inactivation for WT (τfast = 5.0 ± 0.6 ms, τslow = 68.9 ± 11 ms) was essentially the same as the double mutant (τfast = 7.1 ± 0.9 ms, τslow = 56.1 ± 9.6 ms) (P(fast) = 0.07 and P(slow) = 0.9 with n=8 and 7, respectively). The same was true for the kinetics of inactivation (WT τfast at −30 mV = 1.17 ± 0.1 ms; double mutant τfast at −30 mV = 1.04 ± 0.1 ms) (P = 0.3, n = 7) (Fig. 7). These results demonstrate that the observed effects on NaV 1.5 function in the presence of Ca2+ are due to impairment of the CaM-IG interaction.
NaV channels are a hallmark of excitable cells, which suggests Ca2+-dependent binding of CaM to the IG may be a common feature. Alignment of IG sequences for nine NaV channels reveals a high degree of sequence conservation across the family (Fig. 8a). Remarkably site A residues are perfectly conserved for all 9 channels, and only subtle substitutions are found for site B. The conservation of CaM binding to the IG was directly testing by measuring the affinity of CaM for the IG peptides of NaV 1.2, 1.4, and 1.6, and determining if there are any effects on the mode of binding as reflected in the 15N-1H HSQC NMR spectra of the corresponding complexes. The observation of high nM affinities for all NaV peptides (Fig 8b) and very similar NMR spectra for the corresponding complexes (Fig 8c) strongly implies that Ca2+-dependent binding of CaM to the IG is a general feature of all NaV channels.
Fig. 8. Ca2+-dependent binding of CaM to the IG may be a common feature of NaV channels.
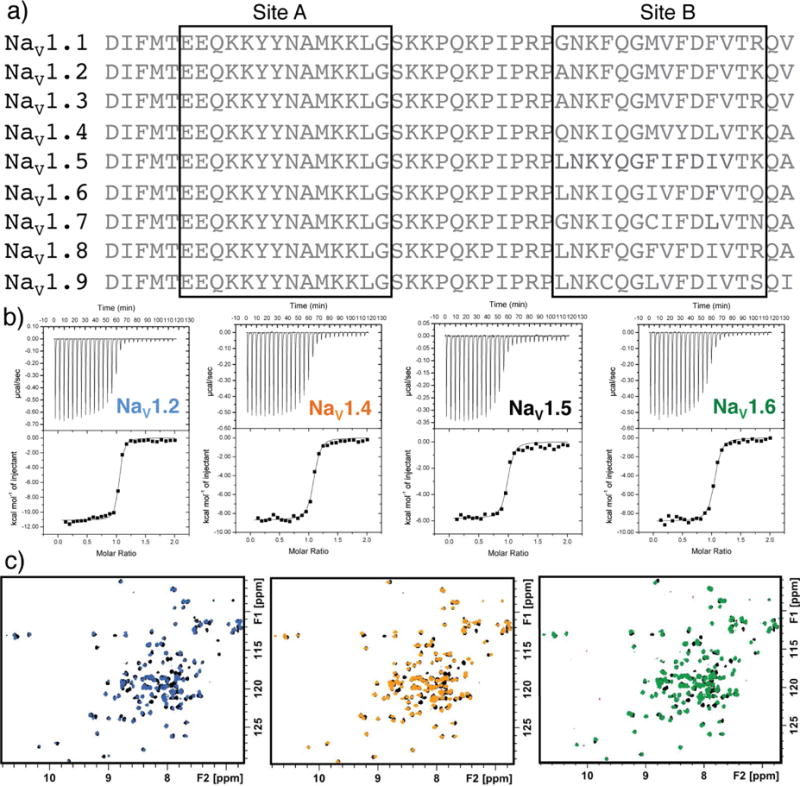
Alignment of IG sequences for the different human channels of NaV. ITC sensorgrams for CaM binding to each IG peptide corresponding to the NaV1.5 Q1483-A1529 amino acids. 2D 15N-1H HSQC NMR spectra of CaM-NaV1.5 IG complex (black) overlaid with CaM complexed with peptides for the different IG sequences(colored as shown in sensorgrams). Values and statistics for CaM binding to IG peptides are shown in Table 2.
Discussion
Numerous studies have reported effects of cytosolic Ca2+ signals on channel gating and a role for the ubiquitous Ca2+ sensor CaM (Chagot et al., 2009; Gabelli et al., 2014; Glynn et al., 2015; Potet et al., 2009; Sarhan et al., 2009, 2012a; Shah et al., 2006; Wang et al., 2014; Wingo et al., 2004). However, the role of CaM in regulating NaV1.5 has been particularly controversial (e.g. (Ben-Johny et al., 2014)). We and others have shown the inactivation gate of NaV1.5, well established as critical for proper channel function, is one of the targets of CaM action (Potet et al., 2009; Sarhan et al., 2009, 2012a, 2012b). Here, we set out to understand the molecular underpinnings and functional consequences of the Ca2+-dependent interaction of CaM with the NaV1.5-IG. In contrast to previous reports that identified two distinct modest affinity CaM binding sites in the IG (Potet et al., 2009; Sarhan et al., 2009, 2012a), we found CaM interacts with both IG sites simultaneously. Our biophysical data and electrophysiology studies are consistent with this mode of binding, as a pair of mutations that simultaneously disrupts binding to both IG sites was required to significantly impair the CaM-IG interaction and elicit a functional response.
For our studies, an approach was needed to selectively probe the CaM-IG interaction without altering other Ca2+ sensitive properties of the NaV1.5 channel. Investigations of Ca2+ regulation of NaV1.5 typically compare channel function in the absence and presence of Ca2+. However, the Ca2+ sensing apparatus is complex, involving CaM and both the EF-hand domain and the IQ motif in the C-terminal region of the channel. The standard approach of manipulating Ca2+ will affect not only CaM binding to the IG but also CaM binding to other parts of the channel, as well as other Ca2+ dependent processes that modulate channel function, including activation of CaMKII (Gabelli et al., 2014; Glynn et al., 2015; Shah et al., 2006; Wang et al., 2014; Wingo et al., 2004). Making only subtle mutations based on the CaM-IG structure affected only the CaM-IG interaction without altering other Ca2+ sensitive properties of the NaV1.5 channel. The observation of no differences between mutant and wild-type channels under conditions of very low Ca2+ where CaM does not interact with the IG served to corroborate our approach. Thus, the functional changes observed at high Ca2+ could be attributed to impaired CaM-IG interaction.
CaM binds to the IG only in the presence of Ca2+, so the origin of the CaM molecule that is an important open question. Unbound CaM from the cytosol could be activated by Ca2+ and diffuse onto the IG. Alternatively, the CaM molecule could correspond to that bound to the IQ motif, an interaction known to be a means for pre-localizing CaM to channels. As we proposed previously, when cytosolic [Ca2+] rises, an interaction between the IQ motif and the C-terminal EF-hand domain could contribute to release of the CaM molecule in the vicinity of the IG (Hovey et al., 2017; Shah et al., 2006). Cell fluorescence studies of CaM binding to NaV1.4 indicate a 1:1 CaM: NaV stoichiometry in both the absence and presence of Ca2+ (Ben-Johny et al., 2016), supporting the notion that the IQ-bound CaM molecule is transferred to the IG. Further study is required to better understand the complex network of competing interactions, including the recently reported interaction of the EF-hand domain with the IG (Shen et al., 2017).
Incorporating our CaM-IG structure into a homology model of NaV1.5 provided insight into how CaM binding to the IG may influence channel function. This compound model predicts that CaM binding to the IG would have two prominent effects. First, the ability of IG gate to open and close will be slowed by the bound CaM and therefore reduce the rate of inactivation. Second, given the close proximity of CaM binding site A to the gate “latch”, CaM binding is expected to impede the latch from engaging the channel. Both effects amount to destabilization of inactivated channels, which results in channels staying open longer and faster recovery from inactivation (Fig. 7b). Consistent with this hypothesis, when the CaM-IG interaction is impaired by mutation, channels display faster rates of inactivation than wild-type channels and corresponding slower recovery from inactivation.
Our work examined the CaM-IG interaction in non-cardiac cells at fixed [Ca2+], conditions under which CaM will be bound to the IG. It is intriguing to consider how the cycling of Ca2+ during an action potential could affect Ca2+ regulation of NaV1.5 function in a cardiomyocyte. At the start of the cardiac excitation contraction cycle cytosolic Ca2+ concentration is low. The primarily source of increased [Ca2+]i is through CaV channel opening and subsequent Ca2+ release from the sarcoplasmic reticulum, which occurs after the majority of NaV1.5 channels have inactivated. Hence, NaV 1.5 inactivation likely occurs in a low Ca2+ environment where CaM is not engaging the IG. Therefore, in a cardiomyocyte we anticipate CaM will not alter the kinetics of inactivation since it is still bound to the IQ motif during channel inactivation. Rather, CaM will be activated after intracellular [Ca2+] is raised, and it is only then that it could bind to the IG, disrupt the latch and facilitate recovery from inactivation.
As anticipated based on its essential role in fast inactivation of NaV1.5, mutations in the IG have been associated with genetic arrhythmia syndromes (Fig. 1) (Kapplinger et al., 2010). Our coupled structure-function analysis enables predictions of the effects of disease-associated mutations in the IG (Table 1) on the CaM-IG interaction and channel function. For example, the site A Y1494N and site B I1521K mutants are associated with Brugada syndrome (BrS) and both have reduced affinity for CaM that can be attributed to their roles as hydrophobic anchors for the interaction with CaM. In contrast, NMR analysis of L1501V (associated with BrS and Long QT type III syndrome) revealed this mutation has little effect on CaM binding (data not shown), consistent with its location at the edge of IG site A in the structure. This implies that the dysfunction caused by this mutation is not the result of perturbation of CaM binding. Structure-function analysis provides insights to speculate about how IG mutations might render a NaV channel prone to disease. Mutations that alter the interaction of CaM with the IG affect recovery from channel inactivation and ultimately, reduce the number of channels available to open. Mutations that do not overtly perturb the CaM-IG interaction may compromise the inactivated configuration of the channel. This could lead to untimely binding of CaM, re-opening of the IG, and premature channel opening. A recent report demonstrates NaV channels containing mutations that cause elevated channel leak are able to elicit an aberrant increase in [Ca2+]i that could promote such a process (Sag et al., 2014). While such speculation is enticing, our investigations were performed at fixed [Ca2+], conditions under which CaM is trapped bound to the IG (or IQ motif). Further studies of NaV1.5 function in the presence of Ca2+ transients (e.g. in induced pluripotent stem cell-derived cardiomyocytes or humanized animal models) will be required to establish the role(s) of the CaM-IG modulation within the cardiac action potential and contraction cycle, and to further test the impact of the CaM-IG interaction on cardiac disease.
Table 1.
Structural predictions and effects of disease-associated mutations on CaM binding to the NaV1.5 IG.
| Mutation | Diseasea | Predicted Effect on CaM-IG interactionb | Measured Effect on CaM-IG interaction |
|---|---|---|---|
| F1473C | LQTS | 0 | – |
| L1480Δ | BrS | 0 | – |
| E1481G | LQTS | 0 | – |
| F1486L | LQTS | 0 | – |
| K1493Δ | BrS | 2 | – |
| Y1494N | BrS | 3 | 3 |
| M1498T | LQTS | 3 | – |
| K1500N | LQTS | 2 | – |
| K1500Δ | LQTS, BrS | 1 | – |
| L1501V | LQTS, BrS | 1 | 1 |
| G1502S | BrS | 1 | – |
| ΔKPQ | LQTS | 1 | 2 |
| ΔQKP | LQTS | 1 | – |
| R1512W | BrS | 1 | 2 |
| I1521K | BrS | 3 | 3 |
| V1525M | BrS | 1 | 1 |
Abbreviations: LQTS - long QT syndrome, BrS - Brugada syndrome
Scores were assigned as described in supplementary methods and range from: no effect = 0 to critically important = 3.
There is considerable disagreement about whether CaM regulates all NaV channels. Based on mutagenesis studies of Ca binding sites of CaM, NaV1.4 was proposed to require CaM with full Ca2+ binding capacity but NaV1.5 did not (Young and Caldwell, 2005). Similar differences between NaV1.4 and 1.5 have been reported by others (Ben-Johny et al., 2014). In contrast a recent report concludes that CaM limits pathogenic Na+ channel persistent current for all NaV channels (Yan et al., 2017a).
The challenge in these analyses is that there are numerous variables such as differences in cell lines or overexpression of CaM that can have profound effects on the channel gating and function (Young and Caldwell, 2005). One of our key findings is that impairing the NaV1.5 CaM-IG interaction does not produce a shift in the steady state inactivation, which is consistent with, the report by Yue and coworkers (Ben-Johny et al 2014). We also find CaM engages other NaV IGs (1.2 1.4 1.5 and 1.6) with high affinity, indicating the CaM-IG interaction is not likely the source for the previously observed differences in NaV Ca sensitivity, consistent with the previous observation that chimeric NaV channels containing different NaV C terminal domains display different Ca sensing properties (Ben-Johny et al., 2014). We speculate that such differences could arise from variations between channels in CaM re-orientation and potential release upon the addition of Ca, as proposed for CaM NaV1.2 -IQ motif interactions (Hovey et al., 2017). The recently reported reduction in late current observed with overexpression of CaM (Yan et al., 2017) remains extremely difficult to interpret in light of the many known cellular targets of CaM.
The studies reported here were focused on characterization of the structural basis and functional modulation of NaV1.5 channel function mediated by the CaM-IG interaction. Importantly, a particularly nuanced, structure-enabled approach to mutagenesis was critical to generating the partial inhibition of the CaM-IG interaction needed to minimize effects on IG functions that do not involve CaM. The integration of CaM-IG interaction with the other Ca2+ sensitive properties of NaV channels remains a significant unknown and will be focus of future studies in our laboratories.
In summary, cardiac voltage-gated sodium (NaV1.5) channels play a critical role in signaling the beating of the heart and their dysfunction can cause arrhythmias. Development of novel therapeutics and improvements to existing treatments for cardiac arrhythmias are hindered by a lack of understanding of the intimate molecular details that define how these channels work. We have identified and characterized the structure and function of Ca2+ dependent interaction of calmodulin with the inactivation gate of NaV1.5 channels, suggesting a mechanism for how calmodulin regulates cardiac sodium channel function. This work provides a foundation to clarify how Ca2+ influences sodium channel function.
STAR Methods
CONTACT FOR REAGENT AND RESOURCE SHARING
Further information and requests for resources and reagents should be directed to and will be fulfilled by the lead contact Walter Chazin (walter.j.chazin@vanderbilt.edu).
METHOD DETAILS
Protein Production
The human CALM3 gene was sub-cloned into a pET15b vector. Proteins were expressed in BL21(DE3) cells and purified by hydrophobic affinity chromatography followed by reverse phase HPLC. Proper protein folding was verified by 2D 15N-1H HSQC NMR spectroscopy. Peptide constructs for the sodium channel inactivation gate were sub-cloned from the human NaV1.5 gene (SCN5A) into an in-house vector containing a His tagged Small Ubiquitin Modifying (SUMO) fusion protein. Mutations were prepared using QuikChange (Stratagene) site directed mutagenesis. Constructs were expressed in BL21 cells and purified by Ni2+ affinity chromatography at 4 °C. The fusion protei n was cleaved with H3C protease and separated by re-pass over a Ni2+ column. A final purification step utilized reverse phase HPLC chromatography using a C4 PROTO column with mobile phase that contained 0.15 % (v/v) TFA. Purified proteins and peptides were lyophilized and dialyzed into appropriate buffers for ITC, SAXS and NMR. The molecular mass and purity of samples were confirmed by SDS-PAGE and electrospray mass spectroscopy. The individual CaM domain plasmids encoded N-domain A1-M76 and C-domain K77-K148, and were gifts from and Professor Madeline Shea (University of Iowa Medical School). QuikChange (Stratagene) was used to modify the amino acids at IG site B to match the sequence of other human NaV channels. The resulting NaV 1.2, 1.4 and 1.6 IG peptides were produced as described above for NaV1.5 IG. All IG peptides contain a residual GPGS at the N terminus from a protease cleavage site.
Isothermal Titration Calorimetery
Samples were dialyzed into 20 mM TRIS, 50 mM NaCl, 1 mM CaCl2, pH 7.4 overnight in the same container. Sample stocks were spun at 13K × g and checked for aggregation prior to data collection. Data was acquired in triplicate using a Microcal VP-ITC instrument. Sample concentrations were 20 μM protein in the cell and 250 μM protein in the syringe. The delay between injections was set to 250 sec to ensure a complete return to baseline. The association constant ka, enthalpy, entropy, and stoichiometry were directly obtained from fitting the data to a 1:1 binding model using MicroCaLOrigin software. Measurements of CaM binding to the final NaV1.5 (Q1483-A1529) and other channel NaV IG peptides were repeated in triplicate and error is reported as standard deviation.
NMR Sample preparation
Lyophilized CaM and peptides were dialyzed into 20 mM BISTRIS, 100 mM KCl, 2 mM CaCl2, pH 6.76 at 4 °C overnight. Concentrations were de termined using a Cary100 UV-VIS spectrometer with the following molar extinction coefficients: CaM ε = 3006 M−1cm−1, full fast inactivation gate (IG) ε = 4470 M−1cm−1, IG-N terminal binding site, ε = 2980 M−1cm−1, and IG-C terminal binding site ε = 1490 M−1cm−1 at 280 nm. The CaM-N domain concentration was determined using ε = 980 at 258.4 nm as described by Bevas and Holiday (BEAVEN and Holiday, 1952) D2O (3%) was added to the samples for a lock signal. All NMR samples were spun at 13K × g at 4 ° C and checked f or aggregation prior to data acquisition. Conditions for isotopically enriched 15N peptide - CaM complex conditions were screened by pH (6.5 - 8.5) and temperature (283-315 K) to identify optimal resonance dispersion. Proper CaM folding was verified in 2D 15N-1H HSQC NMR spectra.
NMR Spectroscopy
Backbone resonance assignments for the peptide, CaM, and complex were determined using standard HSQC, HNCA, HNcoCACB, HNCO, CBCAcoNH experiments collected on Bruker 600, 800, and 900 MHz spectrometers equipped with triple resonance cryoprobes. Additional 3D hNcocaNCO, HNcoCANCO and CON experiments (Pantoja-Uceda and Santoro, 2014) were acquired for the free peptide to confirm and extend the assignments. For the individual CaM domains and binding site peptides, resonance assignments were translated from the full length constructs. Chemical shift perturbations (CSPs) were calculated using ((HA−HB)2 + 0.2 × (NA−NB)2)0.5 (Williamson, 2013). CSP plots and expanded 1H-15N HSQC spectra are shown in SI Fig. 2 and 3.
SECMALS
Stocks of HPLC purified peptide and CaM were combined in a 1:1 molar ratio at 50 uM. The complex was concentrated to a volume of 0.5 ml and loaded onto a GE Superdex 200 (5/150) gel filtration column connected to a multi-angle light scattering system. A single peak was observed with a retention time of 9.29 min. Sample composition was 50 uM protein complex, 10 mM BISTRIS, 100 mM KCl, 2 mM CaCl2. Data were processed using the ASTRA 6 software.
Crystallography data collection and refinement
Diffraction data for all crystals were collected at 100 K on a Bruker-Nonius Microstar rotating anode x-ray generator at Vanderbilt University. The collected diffraction data sets were processed with Bruker-AXS (2010) PROTEUM2 Version 2010.11 (Bruker-AXS, Madison, WI). Phasing of the diffraction data was done by molecular replacement using PHASER. Once sufficient phases were obtained, the initial CaM model was constructed using ARPwARP, leaving residual density for the peptides corresponding to the NaV1.5-IG. Further model building was performed using Coot model building software. Waters were placed with the Coot routine, Find Waters. The final model was obtained by iterative cycles of model building in Coot and structure refinement using Refmac5 in the CCP4 suite of programs (Collaborative Computational Project, 1994) and consists of residues L4–K148 for CaM and L1514-K1527 for NaV1.5-IG.
SAXS
Stocks of peptide and CaM were combined in a 1:1 molar ratio at 50 uM, concentrated, and loaded onto an S75 gel filtration column. A single peak was observed with a retention time of 14.9 min in 10 mM BISTRIS, 100 mM KCl, and 2 mM CaCl2. Using the fraction directly under the center of the peak (9 mg/ml) two aliquots of diluted complex were prepared using buffer eluted from the column (6 and 3 mg/ml). Twenty-five μls of each sample aliquot was flash frozen in N2 (l). Data were collected using four different exposures (0.5, 1, 2, and 5 sec) for each of the three sample concentrations. The data were processed with SCATTER and GNOME from the ATSAS suite (Petoukhov et al., 2012). The FOXs web server (Schneidman-Duhovny et al., 2010) was used to generate P(r) functions for coordinates of CaM complexes (PDBID: 4DJC, 2O5G, 2M55, 2MGU).
Structure of the Complete CaM-NaV.1.5 IG
The crystal structures of CaM bound to each NaV1.5 IG site (4DJC and 5DBR) were aligned by the central helix of CaM and atoms for the non IG interacting CaM domains were deleted. The dihedral angle and distance between the two CaM domains was optimized by systematically calculating theoretical P(r) functions and comparing them to our experimental SAXS data. For the final model, 12 amino acids between the IG binding sites for which density is not observed in either crystal structure were added. The geometry of these residues and surrounding amino acids (G1502-G1519) was minimized using the refmac feature in Coot.
Homology Model
The SCN5A (NP_001092874) sequence was threaded onto the protein structure of Cav1.1 (PDB entry 5GJW) using the HHPred server, with the alignment truncated to exclude portions not present within the crystal structure. Transmembrane segments for SCN5A were predicted using the OCTOPUS web server and were manually verified to ensure they matched those predicted by sequence alignment with the structure PDBID 3JBR; and used to impose membrane-specific energy terms on residues within a theoretical membrane bilayer. Unresolved regions in the template structure or insertions/deletions in the sequence alignment were reconstructed using fragment insertion and the cyclic coordinate descent (CCD) algorithm with subsequent iterative side chain packing and backbone torsion angle minimization from the loop re-build application of Rosetta. Figures for models were prepared using UCSF Chimera (Pettersen et al., 2004).
Electrophysiology
Plasmids encoding the human NaV1.5 a subunit (SCN5A) were subcloned into an ires2 vector for co-expression of the channel protein with a green fluorescent protein as a fluorescent marker of transfected cells. Mutation sites and the complete coding regions of all plasmid constructs were verified by sequencing. Cultured cells (tsA201) were transiently transfected with 2 μg of either WT or mutant cDNA using Lipofectamine™ (Invitrogen) according to the manufacturer’s instructions. The cells were maintained in tissue culture dishes using DMEM with 10% FBS and 1% penicillin-streptomycin. Green fluorescent cells were selected for electrophysiological analysis 24-48 hours after transfection.
Sodium currents were recorded at room temperature 24-48 hours after transfection using the whole-cell patch clamp technique. Patch-clamp pipettes were pulled from thin-wall borosilicate glass (OD: 1.5 mm, Warner Instrument Corp., Hamden, CT, U.S.A.) on a P-97 multistage Flaming-Brown micropipette puller (Sutter Instruments, Novato, CA, U.S.A) and fire polished to a resistance between 1.0 and 2.5 MΩ. In order to avoid the time-dependent shift of the INa availability curve commonly observed during patch-clamp experiments, voltage-dependent inactivation was assessed within 2 minutes after rupture of the membrane. Specific voltage-clamp protocols are depicted as figure insets. The pipette solution used to approximate zero intracellular Ca2+ concentration ([Ca2+]i) contained (in mM): 10 NaF, 100 CsF, 20 CsCl, 20 BAPTA, 10 HEPES, adjusted to pH 7.35 with CsOH. For high [Ca2+]i (1.6 μM free Ca2+), HEDTA was used as a chelator, 5 mM HEDTA was used with 0.9 mM Ca2+. The extracellular (bath) recording solution contained (in mM): 145 NaCl, 4 KCl, 1 MgCl2, 10 HEPES, and 1.8 CaCl2, adjusted to pH 7.35 with CsOH. Series resistance was compensated at 80%. Data acquisition was carried out using an Axopatch 200B patch clamp amplifier and pCLAMP 10.0 software (Molecular Devices, Sunnyvale, CA). To assess the voltage-dependent inactivation, the current amplitude was measured during an activating pulse to −20 mV as a function of the preceding membrane potential (from −160 mV to −20 mV). This first step was 50 msec long to exclude slowly-developing inactivation processes that involve extracellular domains). A Boltzmann function (I = 1/[1 + exp(Vt−V1/2)/k)]) was fitted to the availability curves to determine the membrane potential eliciting half-maximal inactivation (V1/2), where k is the slope factor.
All data were analyzed using pCLAMP 10.0 or Microsoft Excel 2007 and plotted using Prism 5 Graphpad. The recovery from inactivation was assessed using a standard two-pulse protocol consisting of a depolarizing 1000 ms pulse (−20 mV) to engage slow inactivation, followed by a variable duration recovery step to −120 mV and a final test pulse (−20 mV, 20 ms). The availability of the channels after the end of the recovery interval was normalized to initial values and plotted against the recovery time. The time course of recovery from inactivation exhibited a bi-exponential time course described by a fast and a slow time constant. For all the experiments the holding potential was −120 mV.
QUANTIFICATION AND STATISTICAL ANALYSIS
ITC experiments were performed in triplicate and error is reported as the standard deviation. Whole cell patch clamp recordings were collected on three separate occasions for three separate transfections. The investigator was blinded to the sample identify until after the data was analyzed. The results were then re-produced by a second investigator using blinded samples. Patch-clamp measurements are presented as the means ± SEM. Comparisons were made using Student’s t-test, with P < 0.05 considered significant.
DATA AVAILABILITY
The crystallography data for 5DBR is available from the protein data bank at www.pdb.org. NMR chemical shift assignments are available from the Biological Magnetic Resonance Data Bank at www.BMRB.wisc.edu. All other data generated and/or analyzed as part of the current study are available from the corresponding author upon request. For coordinates of the final model of the complex, see: http://structbio.vanderbilt.edu/chazin/publications/CaM_NaV1.5.coords.
Supplementary Material
Fig. 2. Interaction of CaM-N with NaV-IG site B.
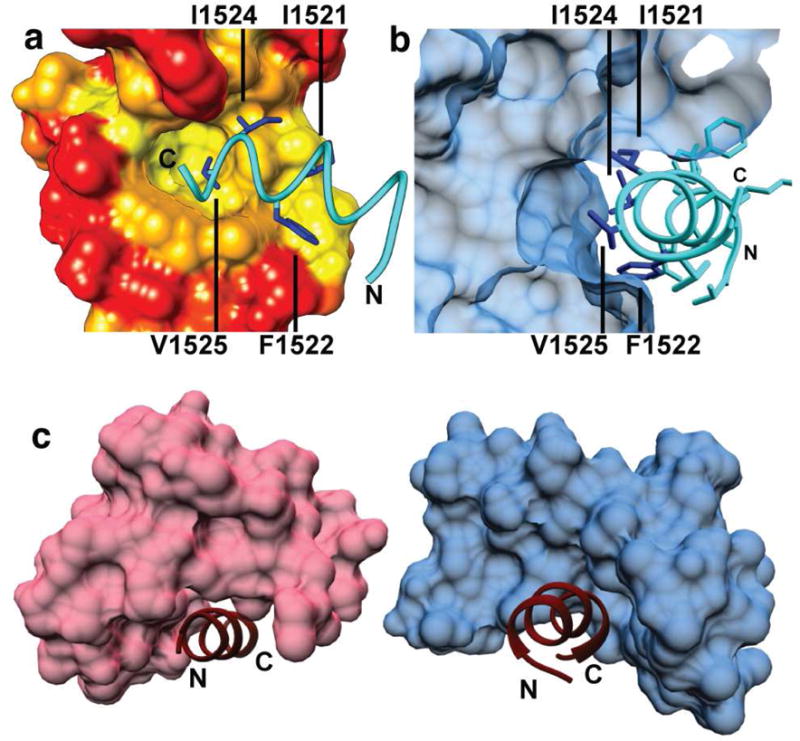
a) Side view of CaM-N bound to site B with CaM surface color coded by least (red) to most (yellow) hydrophobic. I1521 is at the center of site B and is the first residue within the IG motif IFDIV that contacts CaM b) Cross slice of the view in A showing V1525 buried in CaM-N domain hydrophobic pocket. c) Comparison of the structures of CaM-C (blue) and CaM–N (pink) interacting with NaV1.5 IG sites A (PDB 4DJC) and B,(PDB 5DBR) respectively. The termini for each IG peptide are labeled as N or C, respectively, to indicate directionality.
Table 2.
Thermodynamics properties of CaM binding to different NaV IG peptidesa.
| stoichiometry | Kd (nM) | ΔH (Kcal/mol) |
ΔS (cal/mol•deg) |
|
|---|---|---|---|---|
| NaV 1.2 | 1.02 ± 0.02 | 29 ± 6 | −12 ± 0.4 | −4.2 ± 1.9 |
| NaV 1.4 | 1.06 ± 0.01 | 51 ± 10 | −8.8 ± 0.3 | 3.8 ± 1.3 |
| NaV 1.5 | 0.96 ± 0.00 | 66 ± 11 | −5.8 ± 0.1 | 13.4 ± 0.6 |
| NaV 1.6 | 1.03 ± 0.01 | 82 ± 20 | −9.0 ± 0.2 | 2.5 ± 1.1 |
IG peptides are comprised of the amino acids of each channel IG aligned to the NaV1.5 Q1483-A1529 sequence.
Highlights.
Calmodulin binds tightly to the NaV1.5 inactivation gate in a Ca dependent manner
Calmodulin engages two sites on the gate using an extended configuration
Disease-associated mutations in the gate can disrupt the CaM interaction
Impairing the CaM-IG interaction hampers NaV1.5 recovery from inactivation
Acknowledgments
We thank Greg Hura for assistance with processing SAXS data and Madeline Shea for providing plasmids of individual CaM domains. C.N.J. was supported by: NRSA 2T32NS007491-11, AHA postdoctoral fellowship 13POST14380036, and NIH NSRA 5 F32 HL117612-02. This work was also supported in part by grants for NMR instrumentation from the NSF (0922862), NIH (S10 RR025677) and Vanderbilt University matching funds. Research on Ca2+ binding proteins in the Chazin laboratory is supported by an endowed chair from Vanderbilt University and in part by NIH grant R35 GM118089.
Footnotes
Publisher's Disclaimer: This is a PDF file of an unedited manuscript that has been accepted for publication. As a service to our customers we are providing this early version of the manuscript. The manuscript will undergo copyediting, typesetting, and review of the resulting proof before it is published in its final citable form. Please note that during the production process errors may be discovered which could affect the content, and all legal disclaimers that apply to the journal pertain.
Author Contributions: C.N.J and W.J.C developed project framework and experimental design. C.N.J. prepared samples, and collected and analyzed biophysical data. M.K.T determined crystallography phasing and crystal structure. C.N.J, F.P. and A.L.G. designed, collected and analyzed patch clamp recording experiments. C.N.J. and B.M.K generated NaV1.5 homology models. C.N.J and M.W.V. implemented NMR pulse programs and analyzed data. C.N.J and W.J.C. prepared the text and figures, with input from all other authors.
Declaration of Interests: The authors declare no competing interests.
References
- Akke M, Skelton NJ, Kordel J, Palmer JAG, Chazin WJ. Effects of Ion Binding on the Backbone Dynamics of Calbindin Determined by. Biochemistry. 1993;32:9832–9844. doi: 10.1021/bi00088a039. [DOI] [PubMed] [Google Scholar]
- Amin AS, Tan HL, Wilde AAM. Cardiac ion channels in health and disease. Heart Rhythm. 2010;7:117–126. doi: 10.1016/j.hrthm.2009.08.005. [DOI] [PubMed] [Google Scholar]
- BEAVEN GT, Holiday ER. Ultraviolet absorption spectra of proteins and amino acids. Adv Protein Chem. 1952;7:319–386. doi: 10.1016/s0065-3233(08)60022-4. [DOI] [PubMed] [Google Scholar]
- Ben-Johny M, Yang PS, Niu J, Yang W, Joshi-Mukherjee R, Yue DT. Conservation of Ca2+/Calmodulin Regulation across Na and Ca2+ Channels. Cell. 2014;157:1657–1670. doi: 10.1016/j.cell.2014.04.035. [DOI] [PMC free article] [PubMed] [Google Scholar]
- Ben-Johny M, Yue DN, Yue DT. Detecting stoichiometry of macromolecular complexes in live cells using FRET. Nat Commun. 2016;7:13709. doi: 10.1038/ncomms13709. [DOI] [PMC free article] [PubMed] [Google Scholar]
- Chagot B, Chazin WJ. Solution NMR structure of Apo-calmodulin in complex with the IQ motif of human cardiac sodium channel NaV1.5. J Mol Biol. 2011;406:106–119. doi: 10.1016/j.jmb.2010.11.046. [DOI] [PMC free article] [PubMed] [Google Scholar]
- Chagot B, Potet F, Balser JR, Chazin WJ. Solution NMR structure of the C-terminal EF-hand domain of human cardiac sodium channel NaV1.5. J Biol Chem. 2009;284:6436–6445. doi: 10.1074/jbc.M807747200. [DOI] [PMC free article] [PubMed] [Google Scholar]
- Gabelli SB, Boto A, Kuhns VH, Bianchet MA, Farinelli F, Aripirala S, Yoder J, Jakoncic J, Tomaselli GF, Amzel LM. Regulation of the NaV1.5 cytoplasmic domain by calmodulin. Nat Commun. 2014;5:5126. doi: 10.1038/ncomms6126. [DOI] [PMC free article] [PubMed] [Google Scholar]
- Glynn P, Musa H, Wu X, Unudurthi SD, Little S, Qian L, Wright PJ, Radwanski PB, Gyorke S, Mohler PJ, et al. Voltage-Gated Sodium Channel Phosphorylation at Ser571 Regulates Late Current, Arrhythmia, and Cardiac Function In Vivo. Circulation. 2015;132:567–577. doi: 10.1161/CIRCULATIONAHA.114.015218. [DOI] [PMC free article] [PubMed] [Google Scholar]
- Hartmann HA, Tiedeman AA, Chen S, Brown AM, Kirsch GE. Effects of IlI-IV Linker Mutations on Human Heart Na + Channel Inactivation GatinSg. Circ Res. 1993:114–123. doi: 10.1161/01.res.75.1.114. [DOI] [PubMed] [Google Scholar]
- Hodgkin AL, Huxley F. Laboratory of. J Physiol. 1952;116:497–506. doi: 10.1113/jphysiol.1952.sp004719. [DOI] [PMC free article] [PubMed] [Google Scholar]
- Hovey L, Fowler CA, Mahling R, Lin Z, Miller MS, Marx DC, Yoder JB, Kim EH, Tefft KM, Waite BC, et al. Calcium triggers reversal of calmodulin on nested anti-parallel sites in the IQ motif of the neuronal voltage-dependent sodium channel Na V 1.2. Biophys Chem. 2017;224:1–19. doi: 10.1016/j.bpc.2017.02.006. [DOI] [PMC free article] [PubMed] [Google Scholar]
- Kapplinger JD, Tester DJ, Alders M, Benito B, Berthet M, Brugada J, Brugada P, Fressart V, Guerchicoff A, Harris-Kerr C, et al. An international compendium of mutations in the SCN5A-encoded cardiac sodium channel in patients referred for Brugada syndrome genetic testing. Heart Rhythm. 2010;7:33–46. doi: 10.1016/j.hrthm.2009.09.069. [DOI] [PMC free article] [PubMed] [Google Scholar]
- Kellenberger S, Scheuer T, Catterall WA. Movement of the Na + Channel Inactivation Gate during Inactivation *. J Biol Chem. 1996;271:30971–30979. doi: 10.1074/jbc.271.48.30971. [DOI] [PubMed] [Google Scholar]
- Lomize MA, Pogozheva ID, Joo H, Mosberg HI, Lomize AL. OPM database and PPM web server: Resources for positioning of proteins in membranes. Nucleic Acids Res. 2012;40:370–376. doi: 10.1093/nar/gkr703. [DOI] [PMC free article] [PubMed] [Google Scholar]
- Makita N, Yagihara N, Crotti L, Johnson CN, Beckmann BM, Roh MS, Shigemizu D, Lichtner P, Ishikawa T, Aiba T, et al. Novel Calmodulin (CALM2) Mutations Associated with Congenital Arrhythmia Susceptibility. Circ Cardiovasc Genet. 2014 doi: 10.1161/CIRCGENETICS.113.000459. [DOI] [PMC free article] [PubMed] [Google Scholar]
- Pantoja-Uceda D, Santoro J. New (13)C-detected experiments for the assignment of intrinsically disordered proteins. J Biomol NMR. 2014;59:43–50. doi: 10.1007/s10858-014-9827-1. [DOI] [PubMed] [Google Scholar]
- Patton DE, Westt JW, Catterall WA, Goldin AL. Amino acid residues required for fast Na + -channel inactivation: Charge neutralizations and deletions in the III-IV linker. Proc Natl Acad Sci. 1992;89:10905–10909. doi: 10.1073/pnas.89.22.10905. [DOI] [PMC free article] [PubMed] [Google Scholar]
- Petoukhov MV, Franke D, Shkumatov AV, Tria G, Kikhney AG, Gajda M, Gorba C, Mertens HDT, Konarev PV, Svergun DI. New developments in the ATSAS program package for small-angle scattering data analysis. J Appl Crystallogr. 2012;45:342–350. doi: 10.1107/S0021889812007662. [DOI] [PMC free article] [PubMed] [Google Scholar]
- Pettersen EF, Goddard TD, Huang CC, Couch GS, Greenblatt DM, Meng EC, Ferrin TE. UCSF Chimera—A visualization system for exploratory research and analysis. J Comput Chem. 2004;25:1605–1612. doi: 10.1002/jcc.20084. [DOI] [PubMed] [Google Scholar]
- Potet F, Chagot B, Anghelescu M, Viswanathan PC, Stepanovic SZ, Kupershmidt S, Chazin WJ, Balser JR. Functional Interactions between Distinct Sodium Channel Cytoplasmic Domains through the Action of Calmodulin. J Biol Chem. 2009;284:8846–8854. doi: 10.1074/jbc.M806871200. [DOI] [PMC free article] [PubMed] [Google Scholar]
- Putnam CD, Hammel M, Hura GL, Tainer JA. X-ray solution scattering (SAXS) combined with crystallography and computation: defining accurate macromolecular structures, conformations and assemblies in solution. Q Rev Biophys. 2007;40:191–285. doi: 10.1017/S0033583507004635. [DOI] [PubMed] [Google Scholar]
- Reichow SL, Clemens DM, Freites JA, Németh-Cahalan KL, Heyden M, Tobias DJ, Hall JE, Gonen T. Allosteric mechanism of water-channel gating by Ca 2+ -calmodulin. Nat Struct Mol Biol. 2013;20:1085–1092. doi: 10.1038/nsmb.2630. [DOI] [PMC free article] [PubMed] [Google Scholar]
- Rodríguez-Castañeda F, Maestre-Martínez M, Coudevylle N, Dimova K, Junge H, Lipstein N, Lee D, Becker S, Brose N, Jahn O, et al. Modular architecture of Munc13/calmodulin complexes: dual regulation by Ca2+ and possible function in short-term synaptic plasticity. EMBO J. 2010;29:680–691. doi: 10.1038/emboj.2009.373. [DOI] [PMC free article] [PubMed] [Google Scholar]
- Rohl CA, Boeckman FA, Baker C, Scheuer T, Catterall WA, Klevit RE. Solution Structure of the Sodium Channel Inactivation Gate †,‡. Biochemsitry. 1999;38 doi: 10.1021/bi9823380. [DOI] [PubMed] [Google Scholar]
- Sag CM, Mallwitz A, Wagner S, Hartmann N, Schotola H, Fischer TH, Ungeheuer N, Herting J, Shah AM, Maier LS, et al. Enhanced late INa induces proarrhythmogenic SR Ca leak in a CaMKII-dependent manner. J Mol Cell Cardiol. 2014;76:94–105. doi: 10.1016/j.yjmcc.2014.08.016. [DOI] [PubMed] [Google Scholar]
- Sarhan MF, Van Petegem F, Ahern CA. A double tyrosine motif in the cardiac sodium channel domain III-IV linker couples calcium-dependent calmodulin binding to inactivation gating. J Biol Chem. 2009;284:33265–33274. doi: 10.1074/jbc.M109.052910. [DOI] [PMC free article] [PubMed] [Google Scholar]
- Sarhan MF, Tung CC, Van Petegem F, Ahern CA. Crystallographic basis for calcium regulation of sodium channels. Proc Natl Acad Sci U S A. 2012a;109:3558–3563. doi: 10.1073/pnas.1114748109. [DOI] [PMC free article] [PubMed] [Google Scholar]
- Sarhan MF, Van Petegem F, Ahern Ca. Crystallographic Basis for calcium regulation of sodium channels - SI. PNAS. 2012b:3–6. doi: 10.1073/pnas.1114748109. [DOI] [PMC free article] [PubMed] [Google Scholar]
- Schneidman-Duhovny D, Hammel M, Sali A. FoXS: a web server for rapid computation and fitting of SAXS profiles. Nucleic Acids Res. 2010;38:W540–4. doi: 10.1093/nar/gkq461. [DOI] [PMC free article] [PubMed] [Google Scholar]
- Shah VN, Wingo TL, Weiss KL, Williams CK, Balser JR, Chazin WJ. Calcium-dependent regulation of the voltage-gated sodium channel hH1: intrinsic and extrinsic sensors use a common molecular switch. Proc Natl Acad Sci U S A. 2006;103:3592–3597. doi: 10.1073/pnas.0507397103. [DOI] [PMC free article] [PubMed] [Google Scholar]
- Shen H, Shen H, Zhou Q, Pan X, Li Z, Wu J, Yan N. Structure of a eukaryotic voltage-gated sodium channel at near-atomic resolution. 2017;4326 doi: 10.1126/science.aal4326. [DOI] [PubMed] [Google Scholar]
- Tan HL, Kupershmidt S, Zhang R, Stepanovic S, Roden DM, Wilde AAM, Anderson ME, Balser JR. A calcium sensor in the sodium channel modulates cardiac excitability. 2002;415:442–447. doi: 10.1038/415442a. [DOI] [PubMed] [Google Scholar]
- Tester DJ, Ackerman MJ, Ph D. GENETICS OF LONG QT SYNDROME. 2014:29–33. doi: 10.14797/mdcj-10-1-29. [DOI] [PMC free article] [PubMed] [Google Scholar]
- Vassilev P, Scheuer T, Catterall WA. Inhibition of inactivation of single sodium channels by a site-directed antibody. Proc Natl Acad Sci. 1989;86:8147–8151. doi: 10.1073/pnas.86.20.8147. [DOI] [PMC free article] [PubMed] [Google Scholar]
- Vlach J, Samal AB, Saad JS. Solution structure of calmodulin bound to the binding domain of the HIV-1 matrix protein. J Biol Chem. 2014;289:8697–8705. doi: 10.1074/jbc.M113.543694. [DOI] [PMC free article] [PubMed] [Google Scholar]
- Wang C, Chung BC, Yan H, Wang HG, Lee SY, Pitt GS. Structural analyses of Ca(2+)/CaM interaction with NaV channel C-termini reveal mechanisms of calcium-dependent regulation. Nat Commun. 2014;5:4896. doi: 10.1038/ncomms5896. [DOI] [PMC free article] [PubMed] [Google Scholar]
- West JW, Pattont DE, Scheuer T, Wang Y, Goldint AL, Catterall WA. A cluster of hydrophobic amino acid residues required for fast Na + -channel inactivation. Proc Natl Acad Sci. 1992;89:10910–10914. doi: 10.1073/pnas.89.22.10910. [DOI] [PMC free article] [PubMed] [Google Scholar]
- Williamson MP. Using chemical shift perturbation to characterise ligand binding. Prog Nucl Magn Reson Spectrosc. 2013;73:1–16. doi: 10.1016/j.pnmrs.2013.02.001. [DOI] [PubMed] [Google Scholar]
- Wingo TL, Shah VN, Anderson ME, Lybrand TP, Chazin WJ, Balser JR. An EF-hand in the sodium channel couples intracellular calcium to cardiac excitability. Nat Struct Mol Biol. 2004;11:219–225. doi: 10.1038/nsmb737. [DOI] [PubMed] [Google Scholar]
- Wu J, Yan Z, Li Z, Yan C, Lu S, Dong M, Yan N. Structure of the voltage-gated calcium channel Ca channel CaV1.1 at 3.6A resolution. Nature. 2016;537:191–197. doi: 10.1038/nature19321. [DOI] [PubMed] [Google Scholar]
- Yan H, Wang C, Marx SO, Pitt GS. Calmodulin limits pathogenic Na + channel persistent current. Jounral Gen Physiol. 2017a:1–17. doi: 10.1085/jgp.201611721. [DOI] [PMC free article] [PubMed] [Google Scholar]
- Yan Z, Zhou Q, Wang L, Wu J, Zhao Y, Huang G, Peng W, Shen H, Lei J, Yan N. Structure of the Na v 1.4-β1 Complex from Electric Eel. Cell. 2017b;170:470–475.e11. doi: 10.1016/j.cell.2017.06.039. [DOI] [PubMed] [Google Scholar]
- Young KA, Caldwell JH. Modulation of skeletal and cardiac voltage-gated sodium channels by calmodulin. J Physiol. 2005;565:349–370. doi: 10.1113/jphysiol.2004.081422. [DOI] [PMC free article] [PubMed] [Google Scholar]
Associated Data
This section collects any data citations, data availability statements, or supplementary materials included in this article.
Supplementary Materials
Data Availability Statement
The crystallography data for 5DBR is available from the protein data bank at www.pdb.org. NMR chemical shift assignments are available from the Biological Magnetic Resonance Data Bank at www.BMRB.wisc.edu. All other data generated and/or analyzed as part of the current study are available from the corresponding author upon request. For coordinates of the final model of the complex, see: http://structbio.vanderbilt.edu/chazin/publications/CaM_NaV1.5.coords.