Abstract
Immobilized trypsin (IM) has been recognized as an alternative to free trypsin (FT) for accelerating protein digestion 30 years ago. However, some questions of IM still need to be answered. How does the solid matrix of IM influence its preference for protein cleavage and how well can IM perform for deep bottom-up proteomics compared to FT? By analyzing E. coli proteome samples digested with amine or carboxyl functionalized magnetic bead-based IM (IM-N or IM-C) or FT, we observed that IM-N with the nearly neutral solid matrix, IM-C with the negatively charged solid matrix, and FT had similar cleavage preference considering the microenvironment surrounding the cleavage sites. IM-N (15 min) and FT (12 h) both approached 9000 protein identifications (IDs) from a mouse brain proteome. Compared to FT, IM-N had no bias in digestion of proteins that were involved in various biological processes, were located in different components of cells, had diverse functions, and were expressed in varying abundance. A high-throughput bottom-up proteomics workflow comprising IM-N based rapid protein cleavage and fast CZE-MS/MS enabled the completion of protein sample preparation, CZE-MS/MS analysis, and data analysis in only 3 h, resulting in 1000 protein IDs from the mouse brain proteome.
Keywords: Amine functionalized magnetic bead-based immobilized trypsin, Bottom-up proteomics, Fast protein digestion, High-throughput proteomics, Immobilized trypsin
1 Introduction
Comprehensive characterization of complex proteomes using bottom-up proteomics has been achieved in only a couple of hours using modern RPLC-ESI-MS/MS.1 However, at least 12 hours is typically required to prepare the sample for RPLC-MS/MS analysis, which limits the overall throughput of bottom-up proteomics. The most time-consuming step during the sample preparation is digestion of proteins using free trypsin (FT), which typically requires 12 hours for complete digestion. Immobilized trypsin (IM) has been well recognized for speeding the protein digestion.2,3 IM can accomplish protein digestion in minutes due to the much higher concentration of trypsin compared with FT.2,3 Moreover, immobilization of trypsin greatly reduces the autodigestion of trypsin molecules.2
Various solid matrixes have been used to immobilize trypsin, e.g., beads4–10, monolithic materials11–16, and membranes17–19. Sun et al. reported 2,100 protein IDs from MCF7 cell lysate using 20-min IM digestion, and the number of protein IDs was comparable with that using 12-h FT digestion.5 They also observed a significant loss of basic peptides using the IM digestion compared with FT digestion, most likely due to the negatively charged solid matrix (carboxyl groups functionalized magnetic beads) used for trypsin immobilization.5 Fan et al. also observed significant effect of the IM matrixes on the identified protein and peptide pools from complex proteome samples digested with IM.6 Those data indicate that the surface chemistry of the solid matrix of IM can influence the tryptic digestion process.
IM has also been coupled to CZE-MS/MS 20–23 or RPLC-MS/MS 24–31 for online protein digestion, peptide separation, and identification. However, IM has not played a significant role in routine deep bottom-up proteomics studies. Some questions of IM need to be answered to facilitate its wide application.
First, how does the solid matrix of IM influence its preference for protein cleavage comparing with FT? Quantitative proteomics has been employed to reveal the preference of protein cleavage catalyzed by FT.32,33 Using dimethyl labeling based quantitative proteomics,34,35 Ye et al. observed that the cleavage sites surrounded by neutral amino acids could be cleaved quickly, while sites surrounded by negatively charged amino acids (aspartic and glutamic acids) were cleaved much more slowly.32,33 Šlechtová et al. also observed the similar conclusion about the cleavage preference of peptides catalyzed by FT using synthetic peptides as trypsin substrates.36 To our best knowledge, the preference of protein cleavage catalyzed by IM and the effect of the solid matrixes of IM on the cleavage preference have not been studied using quantitative proteomics.
Second, how well can IM perform for digestion of complex proteomes for deep proteomics compared with FT? Only a few reports in the literature applied the IM based fast protein digestion for large-scale proteomics, resulting in 1000–3000 protein IDs from mammalian cell lines or tissues,5,6,28 and less than 1000 protein IDs from yeast cell lysate.24,26 The routine deep bottom-up proteomics studies using FT digestion have approached over 8000 protein IDs from mammalian cell lines or tissues.37–40 Deep proteomics datasets using IM based fast protein digestion are required to demonstrate the capability of IM for deep proteomics and to confirm that IM can speed protein digestion without any bias.
In this work, we performed experiments to provide answers to those two questions. We prepared amine and carboxyl functionalized magnetic beads based IM (IM-N and IM-C), which represented nearly neutral and negatively charged solid matrix surface at pH 8. We investigated the preference of protein cleavage catalyzed by FT and the two kinds of IM using label-free quantitative proteomics. Furthermore, we qualitatively and quantitatively analyzed mouse brain proteome samples digested by FT (12 h) and IM-N (15 min) using both 1D- and 2D-LC-ESI-MS/MS. We compared the FT and IM-N in terms of the identified protein and peptide pools that contained nearly 9,000 proteins and over 100,000 peptides. Finally, we developed a high-throughput bottom-up workflow using IM-N based rapid protein digestion and fast CZE-MS/MS analysis.
2 Materials and methods
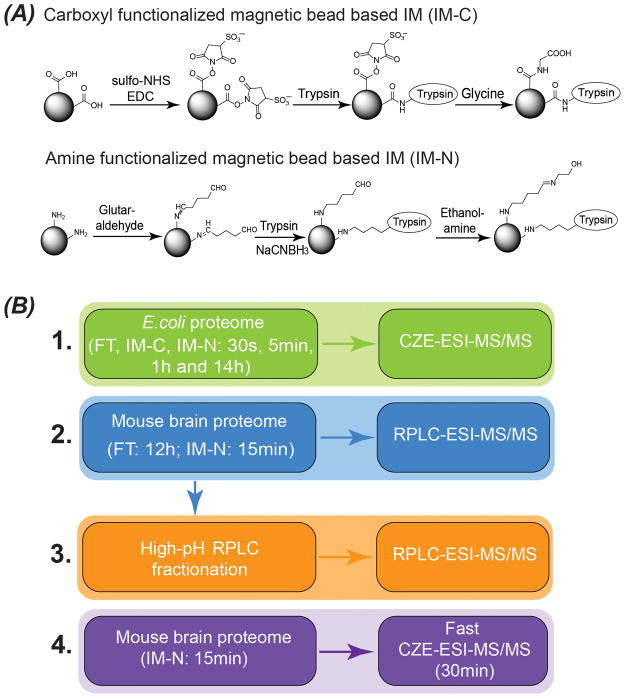
To investigate how the solid matrix of IM influences its preference for protein cleavage comparing with FT, we prepared two types of IM based on reference 4, as shown in Figure 1A. We prepared IM-C with carboxyl group functionalized magnetic beads, and the remaining succinimide groups on the bead surface were blocked with glycine. Therefore, the solid matrix surface of IM-C is negatively charged at pH 8 due to the immobilized glycines’ carboxyl groups. We prepared IM-N with anime group functionalized magnetic beads, and the remaining aldehyde groups were blocked with ethanolamine, resulting in the nearly neutral solid matrix at pH 8. As shown in Figure 1B, we performed experiments 1 and 2 to understand the protein cleavage catalyzed by IM. To investigate how well IM can perform for digestion of complex proteomes for deep proteomics compared with FT, we digested a mouse brain proteome sample with both IM-N and FT, followed by 2D-LC-MS/MS analysis, Figure 1B (experiment 3). We further coupled IM-N based rapid protein digestion to fast CZE-MS/MS for high-throughput characterization of the mouse brain proteome (experiment 4). All the experimental details are shown in supporting information I.
Figure 1.
(A) Synthesis of carboxyl functionalized magnetic bead based IM (IM-C) and amine functionalized magnetic bead based IM (IM-N). (B) Experimental design of the work.
A brief summary of the procedure for experiment 3 was as follows. Two aliquots of the mouse brain proteome sample (300 μg of proteins in each aliquot) were digested by FT (12 h) and IM-N (15 min). The 300 μg of mouse brain proteome digests from FT and IM-N were fractionated by high-pH RPLC into 30 fractions, followed by low-pH RPLC-MS/MS analysis. An EASY-nLC™ 1200 System and a Q-Exactive HF mass spectrometer from Thermo Fisher Scientific were used for low-pH RPLC-MS/MS. A commercial C18 reversed phase column (Acclaim™ PepMap™, 75 μm i.d. × 50 cm, particle size 2 μm, pore size 100Å) was used as a separation column and a commercial C18 reversed phase column (Acclaim™ PepMap™, 75 μm i.d. × 2 cm, particle size 3 μm, pore size 100Å) was used as a trap column. A 90-min LC gradient was employed for peptide separation with a flow rate of 200 nL/min. A top 20 data-dependent acquisition method was used for the MS experiments. Raw MS files were analyzed by MaxQuant software (version 1.3.0.5) 41 for peptide/protein identification and label free quantification. The false discovery rate (FDR) for both peptide and protein identifications was set to 0.01.
3 Result and discussion
3.1 Investigation of protein cleavage preference catalyzed by IM
E. coli proteome samples (20 μg of proteins) were digested by FT, IM-C and IM-N for four different periods (30 s, 5 min, 1 h and 14 h), followed by single-shot CZE-MS/MS analysis in triplicate, Figure 1B. We employed the same trypsin-to-protein mass ratio (1:100) for all digestion methods. Therefore, we are able to investigate how immobilization of trypsin affects the preference of trypsin-catalyzed cleavage accurately.
IM-N had better digestion performance than IM-C based on the numbers of protein and peptide IDs in each digestion time as well as the missed cleavage distributions, Figures S-1 and S-2 in supporting information I. One reason is that IM-N has a longer spacer arm between trypsin and solid matrix than IM-C (Figure 1A). The longer spacer arm can avoid the steric hindrance and allow the trypsin on beads to stretch and catch substrates more easily,42 thus leading to faster and more complete digestion. Another possible reason is that the negatively charged proteins in the sample at pH 8 have difficulty approaching the IM-C surface due to electrostatic repulsion. IM-C tended to identify basic proteins compared with IM-N in short digestion periods (30 s, 5 min, and 1 h), Figure S-3.
IM-N showed better digestion performance than FT in each digestion period with respect to the numbers of peptide/protein IDs and the missed cleavage distributions, Figures S-1 and S-2. The number of protein IDs from 1-h IM-N digestion was almost the same as that from 14-h FT digestion, suggesting that IM-N could digest proteins faster than FT. Because we used the same trypsin-to-protein mass ratio (1:100) for all of the experiments, the difference between IM-N and FT in digestion performance is most likely due to the immobilization of trypsin. In FT digestion, trypsin is consumed by auto-digestion. We clearly detected one trypsin peptide from the E. coli sample that was digested by FT for only 30 s, indicating that auto-digestion of trypsin happened very fast. However, we did not observe significant signal of trypsin peptides in the E. coli samples that were digested by IM-N for 30 s or 5 min, suggesting that immobilization of trypsin in IM-N greatly reduced the auto-digestion of trypsin. Therefore, IM-N can achieve better digestion performance than FT. FT and IM-N have no significant difference in the cumulative distribution of the pI of identified proteins, Figure S-3, which is due to the nearly neutral solid matrix surface of IM-N.
We then investigated the microenvironment surrounding the cleavage sites (K/R) to better our understanding about the cleavage preference catalyzed by FT, IM-N, and IM-C. We classified the identified peptides from the four digestion periods into two types, early-generated peptides, and late-generated peptides, based on the intensity change of peptides as a function of digestion time, Figure S-4. Early-generated peptides were defined as peptides that appeared in the first digestion period (30 s) and had no continuous increase in intensity in longer digestion periods (Figure S-4, panels A–C). The early-generated peptides contained cleavage sites (K/R) that were cleaved quickly. Late-generated peptides were defined as peptides that had an at least 5-times continous increase in intensity as digestion time increased (Figure S-4, panels D–F). Those peptides contained cleavage sites (K/R) that were cleaved slowly.
We compared the microenvironment surrounding the cleavage sites (K/R) for FT, IM-C, and IM-N based on those early-generated peptides and late-generated peptides, Figure S-5. Compared with the early-generated peptides, the cleavage sites for the late-generated peptides tended to be surrounded by more acidic amino acids (D/E). The results from FT, IM-C and IM-N digestion agreed reasonably with each other, suggesting that the immobilization of trypsin on the solid matrixes studied here did not significantly influence the cleavage preference of trypsin molecules. For the first time, we investigated the protein cleavage preference catalyzed by the IM using a complex proteome sample and quantitative proteomics.
3.2 Reproducibility of IM-N for fast digestion of a mouse brain proteome sample
We further investigated the reproducibility of IM-N for fast digestion of a mouse brain proteome sample. Three protein samples were prepared in parallel as replicates using IM-N and FT. For IM-N digestion, each protein sample (20 μg of proteins) was mixed with IM-N for digestion at 37 °C for 15 min. The trypsin concentration in the solution during IM-N digestion was 0.5 mg/mL, and the trypsin-to-protein mass ratio was 1:2. For FT digestion, each sample (20 μg of proteins) was digested with FT at 37 °C for 12 h under trypsin-to-protein mass ratio as 1:30. All of the six proteome digests were analyzed by RPLC-ESI-MS/MS in duplicate.
Tables S-1 and S-2 show the summary of protein and peptide IDs from FT and IM-N digestion. IM-N and FT digestion generated comparable numbers of protein and peptide IDs from duplicate LC-MS runs (2679±27 vs. 2700±36 proteins; 18306±528 vs.18599±1630 peptides), Table S-1. Both FT and IM-N digestion were reproducible regarding the numbers of protein and peptide IDs. In addition, IM-N and FT digestion yielded same pools of proteins and peptides. As shown in Table S-2, the overlaps of protein and peptide IDs between FT and IM-N digestion are comparable with that from duplicate LC-MS analysis of one sample. The identified peptides from FT and IM-N digestion have almost the same cumulative distributions of the pI and grand average of hydropathy (GRAVY) values as well as the same distributions of the number of missed cleavages, Figure S-6.
We further quantitatively evaluated the FT and IM-N digestion based on the label-free quantification (LFQ) protein intensity from MaxQuant database search.41,43 The Perseus software was used for the data analysis.44 We observed good correlations of LFQ intensity among triplicate sample preparations using FT and IM-N (r ≥ 0.998), Figure 2, indicating that both digestion methods were quantitatively reproducible. The LFQ intensity of proteins from FT and IM-N digestion also agreed well (r≥0.989), Figure 2. As shown in Figure S-7, there are almost no proteins having significantly different LFQ intensity between replicate preparations using FT or IM-N digestion (panels A and B). Only 90 out of 1488 quantified protein groups show significantly different LFQ intensity between IM-N and FT digestion, Figure S-7 (panel C). Those results further indicated that IM-N could yield very similar digestion performance to FT for complex proteomes.
Figure 2.
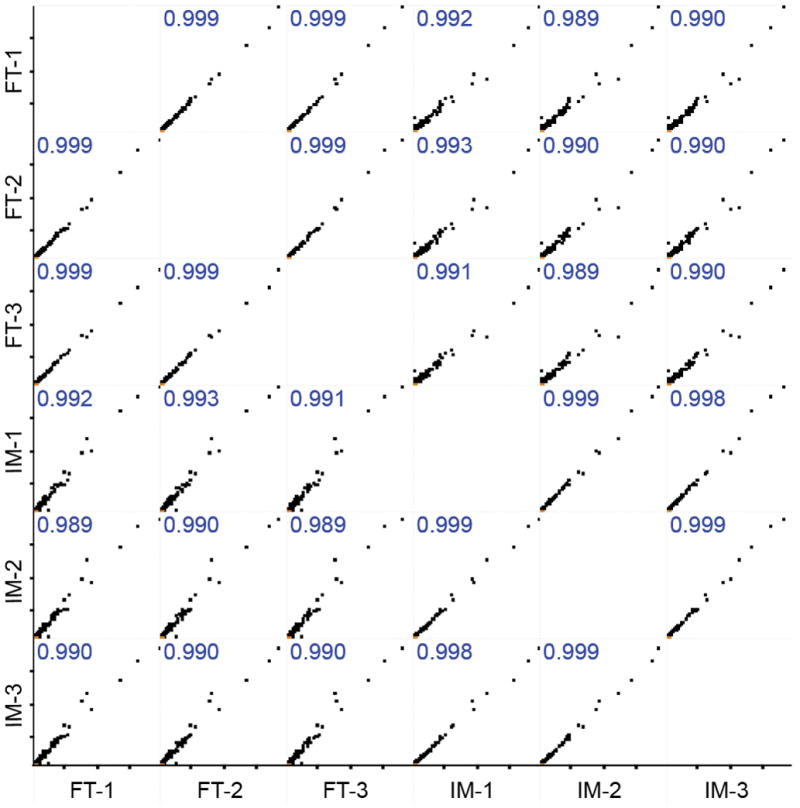
Multi-scatter correlations of protein LFQ intensity from triplicate preparations of mouse brain proteome with IM-N and FT digestion. Pearson correlation (r) values were labeled. Perseus software (version 1.6.0.7) was used to generate the correlations.44
3.3 IM-N based fast protein digestion for deep bottom-up proteomics
In order to determine how well IM can perform for deep bottom-up proteomics compared to FT, we employed two-dimensional LC-ESI-MS/MS to analyze the mouse brain proteome digests (300 μg) from the IM-N digestion (15 min) and FT digestion (12 h).
FT and IM-N digestion produced similar numbers of protein group and peptide IDs, 8716 vs. 8733 proteins and 96377 vs. 103662 peptides. This is the largest proteomic dataset using IM based fast protein digestion reported to date. Recently, Sharma et al reported that nearly 13000 transcripts were detected using RNA sequencing from mouse brain with common filtering criteria.45 Our work using IM-N covered nearly 70% of the mouse brain proteome, which clearly suggests that deep proteome coverage can be approached using IM-N based fast protein digestion. The identified proteins are presented in Supporting information II. More importantly, FT and IM-N approached the same pool of proteins, which was demonstrated by the 93% protein-level overlap. Although the peptide-level overlap is relatively lower compared with the peptide overlaps in Table S-1 and Table S-2 (60% vs. 64%–81%), we did not observe significant differences of identified peptides from IM-N and FT in the peptide pI, peptide GRAVY and the number of the missed cleavages on peptides, Figure 3 (panels A–C).
Figure 3.
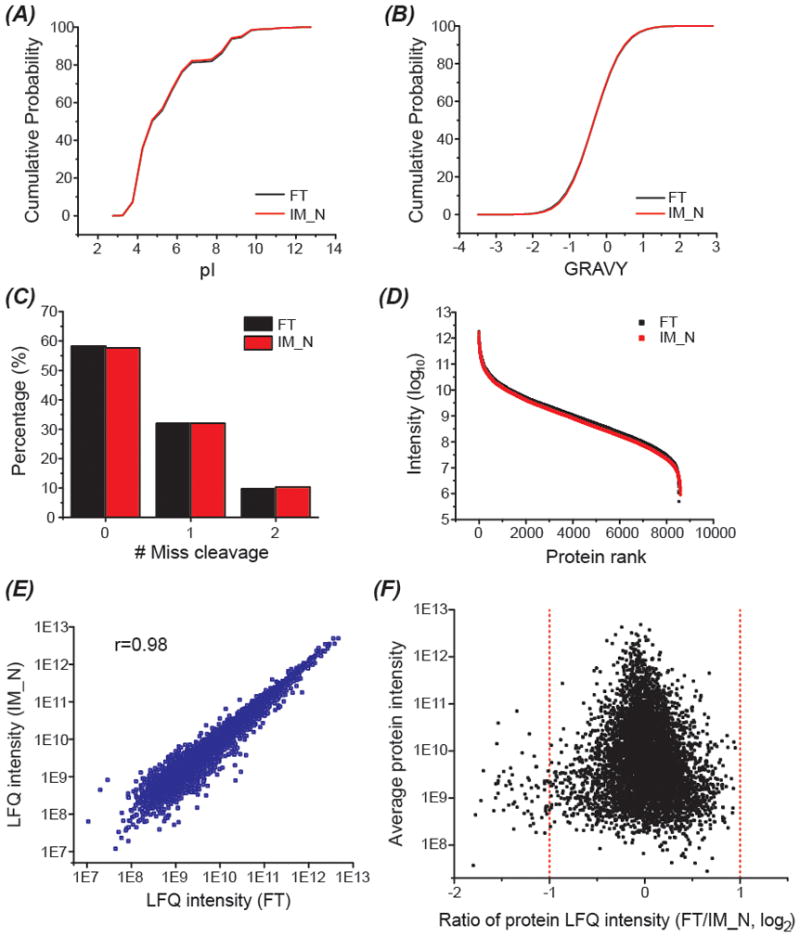
Data analysis of identified peptides and protein groups from the mouse brain proteome sample digested by FT and IM-N after analyzed by 2D-LC-MS/MS. (A) Cumulative distribution of the peptide pIs. (B) Cumulative distribution of the GRAVY values of peptides. (C) Distributions of the missed cleavages on peptides. (D) Dynamic range of observed proteome using FT and IM-N. (E) Log-log correlation of protein LFQ intensity between FT and IM-N. (F) Comparison of the protein LFQ intensity from FT and IM-N. The average LFQ intensity of each protein from FT and IM-N vs. the ratio of protein LFQ intensity between FT and IM-N (Log2).
We further analyzed the dynamic range of the observed mouse brain proteomes from IM-N and FT digestion and compared the LFQ intensity of 6099 proteins quantified from IM-N and FT digestion, Figure 3 (panels D–F). IM-N and FT digestion both yielded close to 6.5 orders of magnitude proteome dynamic range, Figure 3D. The protein LFQ intensity from FT and IM-N agreed well across the complete dynamic range of the observed proteome (r=0.98), Figure 3E. The data suggest that IM-N has no bias in the digestion of low abundant proteins compared to FT. Around 99% of the quantified proteins had less than 2-fold difference in LFQ intensity between FT and IM-N, Figure 3F. The results clearly indicate that IM-N (15 min) can perform as well as FT (12 h) for digestion of complex proteomes qualitatively and quantitatively.
Compared to FT, IM-N had no bias in the digestion of proteins that were involved in various biological processes, were located in different components of cells, and had diverse functions, Figure 4 (panels A–C). As shown in Table S-3, around 50% or higher of the proteins related to the selected biological processes, cellular components and molecular functions in the UniProt mouse database were covered by the proteome dataset from IM-N digestion. The result further indicates that IM-N based fast protein digestion can approach very deep proteome coverage.
Figure 4.
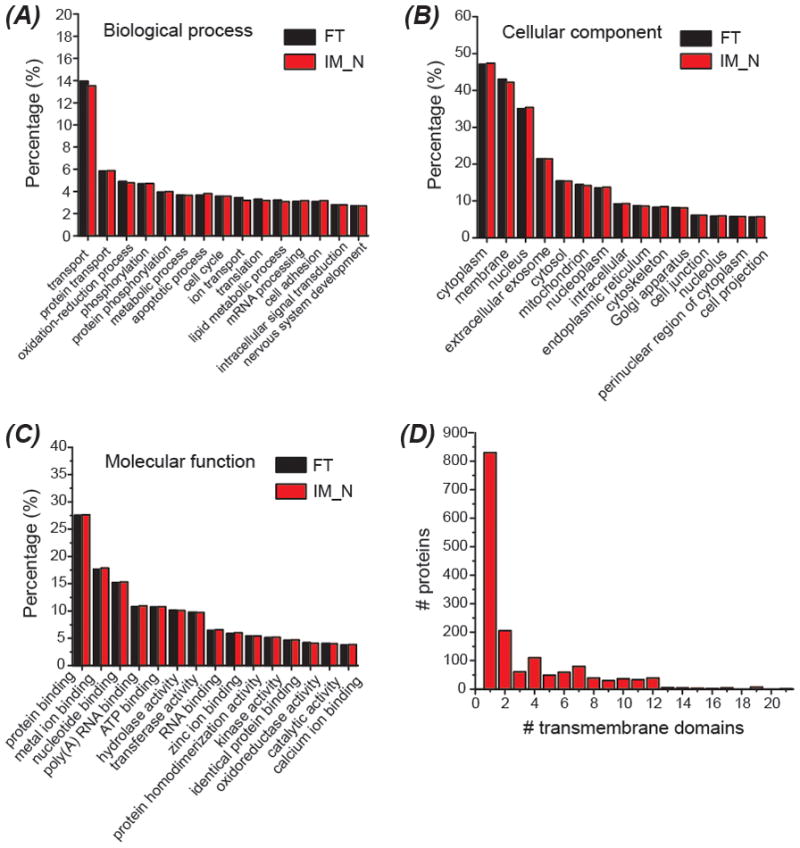
GO analysis of the identified proteins from the mouse brain proteome sample (A–C). The distribution of the transmembrane domains of identified proteins using IM-N digestion (D). DAVID Bioinformatics Resources 6.8 was used for the GO analysis. TMHMM (http://www.cbs.dtu.dk/services/TMHMM/) algorithm was used for prediction of the number of transmembrane domains based on the protein sequences.
We identified 3447 membrane proteins using IM-N digestion, which is 50% of all the annotated membrane proteins in the UniProt Mus musculus database, Table S-3. The data represents the first example of fast IM digestion for deep membrane proteomics. 1549 identified proteins have at least one transmembrane domain (TMD). The number of predicted TMDs on those proteins ranged from 1 to 21, Figure 4D. Chen et al. identified 1897 membrane proteins from a rat brain lysate using FT digestion and 2D-LC-MS/MS.46 Wiśniewski et al. identified 2700 membrane proteins from mouse hippocampus using FT digestion and 2D-LC-MS/MS.47 Very recently, Zhao et al. performed deep membrane proteomics of HeLa cells using FT digestion and 2D-LC-MS/MS.38 They identified 3785 membrane proteins from HeLa cells, representing the largest membrane protein dataset from human cell lines. Overall, the results here support that IM-N could perform as well as FT for digestion of hydrophobic membrane proteins.
3.4 Coupling IM-N based protein digestion to CZE-MS/MS for high-throughput bottom-up proteomics
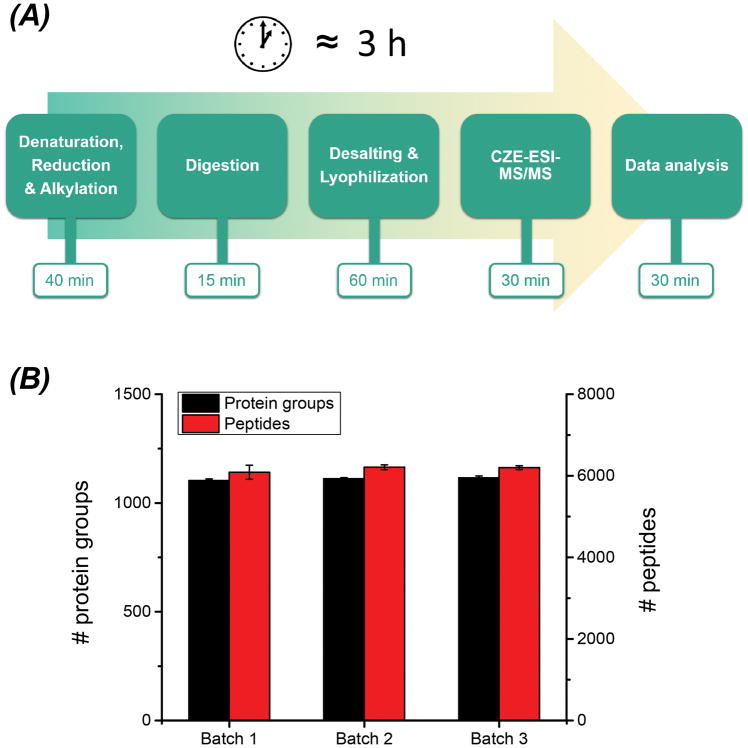
We developed a high-throughput bottom-up proteomics workflow encompassing the protein sample pretreatment (denaturation, reduction and alkylation) in 40 min, protein digestion with IM-N in 15 min, desalting and lyophilization of the peptides in 1 h, peptide analysis with CZE-MS/MS in 30 min, and data analysis for protein ID in 30 min, Figure 5A. In total, this workflow only required ~3 h. The details of the workflow are shown in Supporting information I. This fast workflow enabled the identification of over 1000 proteins and 6000 peptides from the mouse brain proteome in only 3 h and with good qualitative and quantitative reproducibility, Figure 5B and Figure S-8.
Figure 5.
The high-throughput bottom-up proteomics workflow using IM-N for rapid protein digestion and CZE-MS/MS for fast sample analysis (A). The number of protein and peptide IDs from the mouse brain proteome using the workflow (B). Three samples were prepared and analyzed by the workflow as three batches. Each sample was analyzed by the CZE-MS/MS in triplicate. The error bars represent the standard deviations of the number of protein and peptide IDs from the triplicate CZE-MS/MS analyses.
Much effort has been made to improve the throughput of proteomic sample preparation for bottom-up proteomics in order to facilitate fundamental research and clinical diagnostics.48–50 However, hours of tryptic digestion were required in those studies. We believe the high-throughput bottom-up proteomics workflow comprising IM-N based rapid protein digestion and fast CZE-MS/MS analysis will benefit many clinical applications.
4 Concluding remarks
We provided clear answers to two important questions of IM. First, the immobilization of trypsin molecules on the neutral and negatively charged solid matrixes did not significantly affect the cleavage preference of trypsin molecules compared with FT. Second, IM-N (15-min digestion) can perform as well as FT (12-h digestion) for deep bottom-up proteomics of complex proteomes. Compared to FT, IM-N did not introduce any bias in the digestion of proteins that were involved in various biological processes, were located in different components of cells, had diverse functions, and were expressed in varying abundance. We developed a high-throughput bottom-up proteomics workflow that coupled IM-N based rapid protein digestion to fast CZE-MS/MS analysis. The workflow enabled the characterization of complex proteomes in only 3 h.
Supplementary Material
Significance of the study.
Nearly 9000 proteins were identified from a mouse brain proteome using immobilized trypsin (IM) based protein digestion in 15 min. The data represents the largest proteomic dataset with IM. IM yielded 3447 membrane protein identifications from the mouse brain proteome, and the data represents the first example of fast IM digestion for deep membrane proteomics. More importantly, IM could reach complete digestion of complex proteomes in 50-times shorter digestion time and without any bias compared to free trypsin (FT). The cleavage preference of IM was investigated using quantitative proteomics and a complex proteome sample for the first time. The high-throughput bottom-up proteomics workflow consisting of IM based rapid protein digestion and fast CZE-MS/MS enabled the characterization of complex proteomes in only 3 h. The workflow will be useful for many clinical applications.
Acknowledgments
We thank Prof. Heedeok Hong’s group at Department of Chemistry, Michigan State University for kindly providing the Escherichia coli cells for our experiments. We thank Prof. Chen Chen’s group at Department of Animal Science, Michigan State University for kindly providing the mouse brain for our research. We thank the support from the National Institute of General Medical Sciences, National Institutes of Health (NIH), through Grant R01GM125991 and the support from Michigan State University.
Abbreviations
- IM
Immobilized trypsin
- FT
free trypsin
- LFQ
label-free quantification
Footnotes
These authors have declared no conflict of interest.
References
- 1.Hebert AS, Richards AL, Bailey DJ, Ulbrich A, Coughlin EE, Westphall MS, Coon JJ. Mol Cell Proteomics. 2014;13:339. doi: 10.1074/mcp.M113.034769. [DOI] [PMC free article] [PubMed] [Google Scholar]
- 2.Ma J, Zhang L, Liang Z, Shan Y, Zhang Y. Trac-Trend Anal Chem. 2011;30:691. [Google Scholar]
- 3.Switzar L, Giera M, Niessen WM. J Proteome Res. 2013;12:1067. doi: 10.1021/pr301201x. [DOI] [PubMed] [Google Scholar]
- 4.Sun L, Li Y, Yang P, Zhu G, Dovichi NJ. J Chromatogr A. 2012;1220:68. doi: 10.1016/j.chroma.2011.11.050. [DOI] [PMC free article] [PubMed] [Google Scholar]
- 5.Sun L, Zhu G, Yan X, Mou S, Dovichi NJ. J Chromatogr A. 2014;1337:40. doi: 10.1016/j.chroma.2014.02.014. [DOI] [PMC free article] [PubMed] [Google Scholar]
- 6.Fan C, Shi Z, Pan Y, Song Z, Zhang W, Zhao X, Tian F, Peng B, Qin W, Cai Y, Qian X. Anal Chem. 2014;86:1452. doi: 10.1021/ac402696b. [DOI] [PubMed] [Google Scholar]
- 7.Qin W, Song Z, Fan C, Zhang W, Cai Y, Zhang Y, Qian X. Anal Chem. 2012;84:3138. doi: 10.1021/ac2029216. [DOI] [PubMed] [Google Scholar]
- 8.Vale G, Santos HM, Carreira RJ, Fonseca L, Miró M, Cerdà V, Reboiro-Jato M, Capelo JL. Proteomics. 2011;11:3866. doi: 10.1002/pmic.201100200. [DOI] [PubMed] [Google Scholar]
- 9.Lin S, Yao G, Qi D, Li Y, Deng C, Yang P, Zhang X. Anal Chem. 2008;80:3655. doi: 10.1021/ac800023r. [DOI] [PubMed] [Google Scholar]
- 10.Deng Y, Deng C, Qi D, Liu C, Liu J, Zhang X, Zhao D. Adv Mater. 2009;21:1377. [Google Scholar]
- 11.Palm AK, Novotny MV. Rapid Commun Mass Spectrom. 2004;18:1374. doi: 10.1002/rcm.1500. [DOI] [PubMed] [Google Scholar]
- 12.Ma J, Liang Z, Qiao X, Deng Q, Tao D, Zhang L, Zhang Y. Anal Chem. 2008;80:2949. doi: 10.1021/ac702343a. [DOI] [PubMed] [Google Scholar]
- 13.Duan J, Sun L, Liang Z, Zhang J, Wang H, Zhang L, Zhang W, Zhang Y. J Chromatogr A. 2006;1106:165. doi: 10.1016/j.chroma.2005.11.102. [DOI] [PubMed] [Google Scholar]
- 14.Dulay MT, Baca QJ, Zare RN. Anal Chem. 2005;77:4604. doi: 10.1021/ac0504767. [DOI] [PubMed] [Google Scholar]
- 15.Dulay MT, Eberlin LS, Zare RN. Anal Chem. 2015;87:12324. doi: 10.1021/acs.analchem.5b03669. [DOI] [PubMed] [Google Scholar]
- 16.Jiang S, Zhang Z, Li L. J Chromatogr A. 2015;1412:75. doi: 10.1016/j.chroma.2015.07.121. [DOI] [PMC free article] [PubMed] [Google Scholar]
- 17.Chui WK, Wainer IW. Anal Biochem. 1992;201:237. doi: 10.1016/0003-2697(92)90334-4. [DOI] [PubMed] [Google Scholar]
- 18.Xu F, Wang W, Tan Y, Bruening ML. Anal Chem. 2010;82:10045. doi: 10.1021/ac101857j. [DOI] [PMC free article] [PubMed] [Google Scholar]
- 19.Dong J, Ning W, Liu W, Bruening ML. Analyst. 2017;142:2578. doi: 10.1039/c7an00778g. [DOI] [PubMed] [Google Scholar]
- 20.Liu L, Zhang B, Zhang Q, Shi Y, Guo L, Yang L. J Chromatogr A. 2014;1352:80. doi: 10.1016/j.chroma.2014.05.058. [DOI] [PubMed] [Google Scholar]
- 21.Sun L, Zhu G, Dovichi NJ. Anal Chem. 2013;85:4187. doi: 10.1021/ac400523x. [DOI] [PMC free article] [PubMed] [Google Scholar]
- 22.Li Y, Wojcik R, Dovichi NJ. J Chromatogr A. 2011;1218:2007. doi: 10.1016/j.chroma.2010.10.013. [DOI] [PMC free article] [PubMed] [Google Scholar]
- 23.Wang T, Ma J, Zhu G, Shan Y, Liang Z, Zhang L, Zhang Y. J Sep Sci. 2010;33:3194. doi: 10.1002/jssc.201000324. [DOI] [PubMed] [Google Scholar]
- 24.Moore S, Hess S, Jorgenson J. J Chromatogr A. 2016;1476:1. doi: 10.1016/j.chroma.2016.11.021. [DOI] [PMC free article] [PubMed] [Google Scholar]
- 25.Slysz GW, Schriemer DC. Anal Chem. 2005;77:1572. doi: 10.1021/ac048698c. [DOI] [PubMed] [Google Scholar]
- 26.Feng S, Ye M, Jiang X, Jin W, Zou H. J Proteome Res. 2006;5:422. doi: 10.1021/pr0502727. [DOI] [PubMed] [Google Scholar]
- 27.Yuan H, Zhou Y, Xia S, Zhang L, Zhang X, Wu Q, Liang Z, Zhang Y. Anal Chem. 2012;84:5124. doi: 10.1021/ac3006796. [DOI] [PubMed] [Google Scholar]
- 28.Yuan H, Zhang S, Zhao B, Weng Y, Zhu X, Li S, Zhang L, Zhang Y. Anal Chem. 2017;89:6324. doi: 10.1021/acs.analchem.7b00682. [DOI] [PubMed] [Google Scholar]
- 29.Wang F, Wei X, Zhou H, Liu J, Figeys D, Zou H. Proteomics. 2012;12:3129. doi: 10.1002/pmic.201200162. [DOI] [PubMed] [Google Scholar]
- 30.Spross J, Sinz A. Anal Chem. 2010;82:1434. doi: 10.1021/ac9025362. [DOI] [PubMed] [Google Scholar]
- 31.Hustoft HK, Brandtzaeg OK, Rogeberg M, Misaghian D, Torsetnes SB, Greibrokk T, Reubsaet L, Wilson SR, Lundanes E. Sci Rep. 2013;3:3511. doi: 10.1038/srep03511. [DOI] [PMC free article] [PubMed] [Google Scholar]
- 32.Ye M, Pan Y, Cheng K, Zou H. Nat Methods. 2014;11:220. doi: 10.1038/nmeth.2850. [DOI] [PubMed] [Google Scholar]
- 33.Pan Y, Cheng K, Mao J, Liu F, Liu J, Ye M, Zou H. Anal Bioanal Chem. 2014;406:6247. doi: 10.1007/s00216-014-8071-6. [DOI] [PubMed] [Google Scholar]
- 34.Hsu JL, Huang SY, Chow NH, Chen SH. Anal Chem. 2003;75:6843. doi: 10.1021/ac0348625. [DOI] [PubMed] [Google Scholar]
- 35.Wang F, Chen R, Zhu J, Sun D, Song C, Wu Y, Ye M, Wang L, Zou H. Anal Chem. 2010;82:3007. doi: 10.1021/ac100075y. [DOI] [PubMed] [Google Scholar]
- 36.Šlechtová T, Gilar M, Kalíková K, Tesařová E. Anal Chem. 2015;87:7636. doi: 10.1021/acs.analchem.5b00866. [DOI] [PubMed] [Google Scholar]
- 37.Geiger T, Wehner A, Schaab C, Cox J, Mann M. Mol Cell Proteomics. 2012;11:M111.014050. doi: 10.1074/mcp.M111.014050. [DOI] [PMC free article] [PubMed] [Google Scholar]
- 38.Zhao Q, Fang F, Shan Y, Sui Z, Zhao B, Liang Z, Zhang L, Zhang Y. Anal Chem. 2017;89:5179. doi: 10.1021/acs.analchem.6b04232. [DOI] [PubMed] [Google Scholar]
- 39.Ding C, Jiang J, Wei J, Liu W, Zhang W, Liu M, Fu T, Lu T, Song L, Ying W, Chang C, Zhang Y, Ma J, Wei L, Malovannaya A, Jia L, Zhen B, Wang Y, He F, Qian X, Qin J. Mol Cell Proteomics. 2013;12:2370. doi: 10.1074/mcp.O112.025023. [DOI] [PMC free article] [PubMed] [Google Scholar]
- 40.Mertins P, Qiao JW, Patel J, Udeshi ND, Clauser KR, Mani DR, Burgess MW, Gillette MA, Jaffe JD, Carr SA. Nat Methods. 2013;10:634. doi: 10.1038/nmeth.2518. [DOI] [PMC free article] [PubMed] [Google Scholar]
- 41.Cox J, Mann M. Nat Biotechnol. 2008;26:1367. doi: 10.1038/nbt.1511. [DOI] [PubMed] [Google Scholar]
- 42.Zhang D, Yuwen L, Peng L. J Chem. 2013;2013:1. [Google Scholar]
- 43.Cox J, Hein MY, Luber CA, Paron I, Nagaraj N, Mann M. Mol Cell Proteomics. 2014;13:2513. doi: 10.1074/mcp.M113.031591. [DOI] [PMC free article] [PubMed] [Google Scholar]
- 44.Tyanova S, Temu T, Sinitcyn P, Carlson A, Hein MY, Geiger T, Mann M, Cox J. Nat Methods. 2016;13:731–740. doi: 10.1038/nmeth.3901. [DOI] [PubMed] [Google Scholar]
- 45.Sharma K, Schmitt S, Bergner C, Tyanova S, Kannaiyan N, Manrique-Hoyos N, Kongi K, Cantuti L, Hanisch U, Philips M, Rossner M, Mann M, Simons M. Nat Neurosci. 2015;18:1819. doi: 10.1038/nn.4160. [DOI] [PMC free article] [PubMed] [Google Scholar]
- 46.Chen EI, McClatchy D, Park SK, Yates JR., III Anal Chem. 2008;80:8694. doi: 10.1021/ac800606w. [DOI] [PMC free article] [PubMed] [Google Scholar]
- 47.Wiśniewski J, Zougman A, Mann M. J Proteome Res. 2009;8:5674. doi: 10.1021/pr900748n. [DOI] [PubMed] [Google Scholar]
- 48.Ning Z, Seebun D, Hawley B, Chiang CK, Figeys D. J Proteome Res. 2013;12:1512. doi: 10.1021/pr301064z. [DOI] [PubMed] [Google Scholar]
- 49.Geyer PE, Kulak NA, Pichler G, Holdt LM, Teupser D, Mann M. Cell Syst. 2016;2:185. doi: 10.1016/j.cels.2016.02.015. [DOI] [PubMed] [Google Scholar]
- 50.Fu Q, Kowalski MP, Mastali M, Parker SJ, Sobhani K, van den Broek I, Hunter CL, Van Eyk JE. J Proteome Res. 2018;17:420. doi: 10.1021/acs.jproteome.7b00623. [DOI] [PMC free article] [PubMed] [Google Scholar]
Associated Data
This section collects any data citations, data availability statements, or supplementary materials included in this article.


