

Abstract
Sectioning via paraffin embedding is a broadly established technique in eukaryotic systems. Here we provide a method for the fixation, embedding, and sectioning of intact microbial colony biofilms using perfused paraffin wax. To adapt this method for use on colony biofilms, we developed techniques for maintaining each sample on its growth substrate and laminating it with an agar overlayer, and added lysine to the fixative solution. These optimizations improve sample retention and preservation of micromorphological features. Samples prepared in this manner are amenable to thin sectioning and imaging by light, fluorescence, and transmission electron microscopy. We have applied this technique to colony biofilms of Pseudomonas aeruginosa, Pseudomonas synxantha, Bacillus subtilis, and Vibrio cholerae. The high level of detail visible in samples generated by this method, combined with reporter strain engineering or the use of specific dyes, can provide exciting insights into the physiology and development of microbial communities.
Keywords: Immunology and Infection, Issue 133, Thin Section, Biofilm, Paraffin Embedding, Colony Biofilm, Paraformaldehyde Fixation, Fluorescence Microscopy, Lectin Stain, Pel Polysaccharide, Biofilm Matrix
Introduction
Most microbes have the capacity to form biofilms, communities of cells held together by self-produced matrices. Biofilms can be grown in many types of physical setups, with various regimes of nutrient and substrate provision. Specific assays for biofilm formation tend to yield reproducible multicellular structures, and common architectures are observed for phylogenetically diverse species at the community or macroscopic level. When microbes are grown as colonies on solid medium under an atmosphere, macroscopic morphology conveys information about the capacity for matrix production and often correlates with other traits 1,2,3. The internal architecture of microbial colonies can also provide clues regarding biofilm-specific chemistry and physiology, but has been difficult to characterize. Recent applications of cryoembedding and cryosectioning techniques to bacterial colonies have enabled imaging and visualization of specific features at unprecedented resolution 4,5,6. However, studies with animal tissue have shown that paraffin embedding provides superior preservation of morphology when compared to cryoembedding 7 and has been used to visualize bacteria in tissues 8,9. We have therefore developed a protocol for fixation, paraffin embedding, and thin sectioning of microbial colony biofilms. Here, we will describe the preparation of Pseudomonas aeruginosa PA14 colony-biofilm thin sections 10,11, but we have also successfully applied this technique to biofilms formed by the bacteria Pseudomonas synxantha, Bacillus subtilis, and Vibrio cholerae12.
The process of paraffin-embedding and thin-sectioning biofilms follows a simple logic. First, the biofilms are encased in a layer of agar to preserve morphology during processing. Second, the encased-biofilms are submerged in a fixative to crosslink macromolecules and preserve micromorphology. These are then dehydrated with alcohol, cleared with a more non-polar solvent, and then infiltrated with liquid paraffin wax. Once infiltrated, the samples are embedded into wax blocks for sectioning. Sections are cut, mounted on slides, and then rehydrated in order to return them to a more native state. From this point, they can be stained or covered in mounting medium for microscopic analysis.
This protocol produces thin sections of microbial biofilms suitable for histological analysis. Colony biofilm substructures are visible when thin sections prepared using this method are imaged by light microscopy. Biofilms can also be grown on media containing fluorescent stains specific for individual features or stained at the rehydration step, immediately prior to mounting (steps 9.5-9.6). Finally, microbes can be engineered to produce fluorescent proteins in a constitutive or regulated fashion allowing in situ reporting of cell distribution or gene expression within these communities. We have used these methods to determine colony biofilm depth, cell distribution, matrix distribution, growth patterns, and spatiotemporal gene expression.
Protocol
1. Growth of Pseudomonas aeruginosa Colony Biofilms
- Preparation of Medium-Bilayer Plates
- Prepare a 10 g/L tryptone, 10 g/L agar (see Table of Materials) solution in deionized water.
- Autoclave for 20 min. Cool to 50-60 °C in a water bath.
- Pour 45 mL of the agar-tryptone solution into a 100 mm x 100 mm square dish (see Table of Materials) using a 50-mL conical tube. Allow the agar to solidify (~20-30 min). Pour a second, 15-mL layer on top of first layer. Let solidify overnight, removing condensation from lids if necessary by wiping with a lint-free tissue.
- Spotting Colony Biofilms
- Streak the strains of interest from freezer stocks onto LB agar plates13 and incubate in the dark for 12-16 h at 37 °C and 80-100% relative humidity.
- For each strain or replicate, use a single colony to inoculate 2 mL of LB and incubate in the dark for 12-16 h at 37 °C with shaking at 250 rpm.
- Sub-culture by diluting 1:100 into fresh LB and incubating in the dark for 2.5-3 h at 37 °C with shaking at 250 rpm.
- Measure optical density using a spectrophotometer and adjust with sterile LB to achieve a cell suspension with an OD500 nm of ~0.5.
- Depending on the desired colony size, pipet 2.5-10 µL of cell suspension onto a medium-bilayer plate (prepared in step 1.1) and allow the spot to dry for ~20 min. Leaving the petri lid ajar near an open flame can facilitate drying.
- Incubate spot colonies at 25 °C and 80-100% relative humidity, in the dark for up to 4 days.
2. Preparation of the Fixative Solution
Prepare the fixative solution on the day of sample harvesting. Dilute 37% formaldehyde (FA) in 1x PBS to a final concentration of 4% FA. CAUTION: FA is volatile and toxic. Wear protective equipment and work in a well-ventilated fume-hood.
Immediately before use, dissolve L-lysine hydrochloride in 4% FA (prepared in step 2.1) at room temperature to a final concentration of 50 mM L-lysine HCl.
3. Direct Application of Fixative to the Colony Biofilm [Optional]
NOTE: We have found that biofilm morphology is best preserved when the agar overlay is added before fixation. However, this step also constitutes a change in environmental conditions that could affect gene expression. Fluorescent reporter expression patterns should therefore be verified using a separate protocol in which the fixation step is carried out before the addition of the agar overlay, as described here.
On the day of fixation, and working in a well-ventilated fume-hood, pipette the fixative prepared in step 2 directly to the agar surface around the colony's edge, allowing it to reach the colony's periphery without submerging it. Apply only as much fixative as is needed to fully surround the colony, approximately 500 µL. Allow the fixative to diffuse into the colony and the surrounding agar.
Once the fixative has been fully absorbed into the colony and surrounding media, about 20-30 min, and residual FA is no longer visible on the plate, repeat step 3.1. Allow this fixative to diffuse into the colony and the surrounding agar.
Once the fixative has been fully absorbed into the colony and surrounding media repeat step 3.1, this time applying fixative to the surface of the colony directly. Allow this fixative to diffuse into the colony and the surrounding agar, proceeding to step 4 only after all fixative has been absorbed and is no longer visible on the plate.
4. Overlaying Colonies with Agar
On the day of fixation, prepare a 10 g/L agar solution in deionized water and autoclave for 10-20 minutes to dissolve. Cool in a water bath to 50 ˚C.
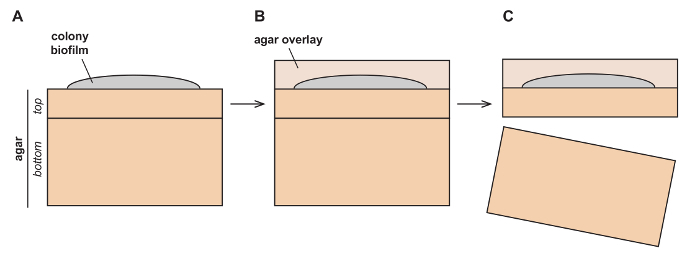
Gently pour 15 mL of the agar solution over the growth medium and colony. Allow the agar to form a gel at room temperature for 5 min (Figure 1B).
Use a sharp razor blade to cut a square, 3-layer chuck with the colony laminated between the top two layers. If preparing multiple samples, ensure that each chuck is cut to a comparable size.
Gently remove excess agar from the colony-containing chuck.
To lift the two upper layers of agar (containing the colony) away from the bottom layer of the chuck (Figure 1C), wet the flat head of a spatula in 1x PBS or water and gently insert between the top and bottom layers. The laminated colony should separate from the bottom layer. Be careful not to distort or bend the laminated colony when lifting it from its base.
5. Fixation
Working in a well-ventilated fume-hood, immediately transfer the laminated colony (i.e., 2-layer chuck) into an embedding cassette (see Table of Materials), labeled with a chemical-resistant marking pen. Place the embedding cassette into a glass slide mailer (see table of materials) containing the fixative prepared in steps 2.1-2.2. Make sure there are no air bubbles trapped inside the embedding cassette.
Incubate the sample in fixative overnight in the dark at room temperature.
6. Sample Processing: Buffer Wash, Dehydration, Clearing, and Infiltration
After overnight fixation, wash the sample twice in 1x PBS for 1 h each. For best results, automate reagent homogenization using the spin function of an automatic tissue processor (see table of materials) set to a low setting. If no processor is available, processing can be run manually.
Follow the buffer wash by dehydration through a graded series of ethanol (EtOH) dilutions in 1x PBS (25%, 50%, 70%, 95%) for 1 h each at room temperature.
Dehydrate in three washes of 100% EtOH for 1 h each at room temperature.
Clear the dehydrated sample in three washes of 100% orange oil-based clearing agent (see table of materials) for 1 h each at room temperature.
Infiltrate the cleared sample twice with molten paraffin wax (see Table of Materials), heated to 55˚C, for 2 h each.
7. Sample Embedding
Fill a wax mold with molten paraffin wax heated to 55 ˚C. Use a heated, flat spatula to quickly transfer the infiltrated chuck from the embedding cassette into the wax mold, ensuring that the chuck rests parallel to the base of the mold. Avoid applying excessive pressure onto the chuck. Wax molds may be custom 3-D printed, or are commercially available (see Table of Materials).
Allow wax to solidify overnight at 4 ˚C. Samples molded in solid wax may be stored indefinitely at 4 ˚C.
Once the wax has solidified, excise the sample from the mold and trim excess wax from around the sample with a razor blade. Leave excess wax extending from one end of the sample, parallel to the plane of sectioning, that can be used to clamp it into the microtome (see Table of Materials). Also leave a sheath of wax, approximately 1-mm thick, around the sample and smooth its faces.
8. Sectioning
Heat a water bath to 42 ˚C. Clamp the sample into the microtome with the surface of the colony oriented perpendicularly to the edge of the blade (see Table of Materials).
Trim the sample in 50-µm intervals until the desired plane of the colony has been reached, from which sections will be collected.
Cut a ribbon of the desired number of 10-µm thick sections using a microtome set to a sectioning velocity of 75-80 rpm and a clearance angle of 6-10˚. Use a fine-tipped paintbrush to detach the ribbon from the blade.
Using a drop of water at the tip of a Pasteur pipette (preferred) or forceps, gently transfer the ribbon to the water bath. Be careful to avoid trapping air bubbles under the section.
Immediately insert a slide into the water bath and position it below the ribbon at a 45˚ angle.
Touch the narrow edge of the ribbon to the slide, just below the frosted label. The ribbon should adhere.
Pull the slide out of the water bath, adjusting the angle to become perpendicular to the surface of the water, and allowing the ribbon to lay flat against the slide along its length. Avoid trapping excess water beneath the ribbon.
Gently stand the slide onto an absorbent lint-free tissue, wicking excess water from the section.
Lay the slide on a paper towel, and allow it to dry at room temperature overnight in the dark. Slides can be stored indefinitely at 4 ˚C in the dark.
9. Heat-fixing, Rehydration, and Mounting
Heat a leveled hot plate to 45 ˚C. Heat the slide for 30-60 min. The wax will become semi-molten and flatten against the slide.
Gently lift the slide from the hot plate and lay it flat onto a smooth, leveled, room temperature surface, using care to ensure that the molten wax does not pull to either side of the slide, until the wax solidifies (~1 min).
Using a glass slide mailer, de-wax slides in four washes of clearing agent for 5 min each, using an Büchner aspirator to remove solution between washes.
Wash the slides three times in 100% EtOH for 1 min each.
Rehydrate the slides in a graded series of ethanol in the reverse order of processing (95%, 70%, 50%, and 25%) for 1 min each followed by two 1-min washes in 1x PBS.
Immediately mount the sections in a Tris-buffered mounting medium (see Table of Materials) and apply a coverslip, avoiding the introduction of air bubbles. Allow mounting medium to polymerize overnight at room temperature.
Once polymerized, seal the coverslip to the slide using clear nail polish. Sealed slides may be stored indefinitely in the dark at 4 ˚C.
Representative Results
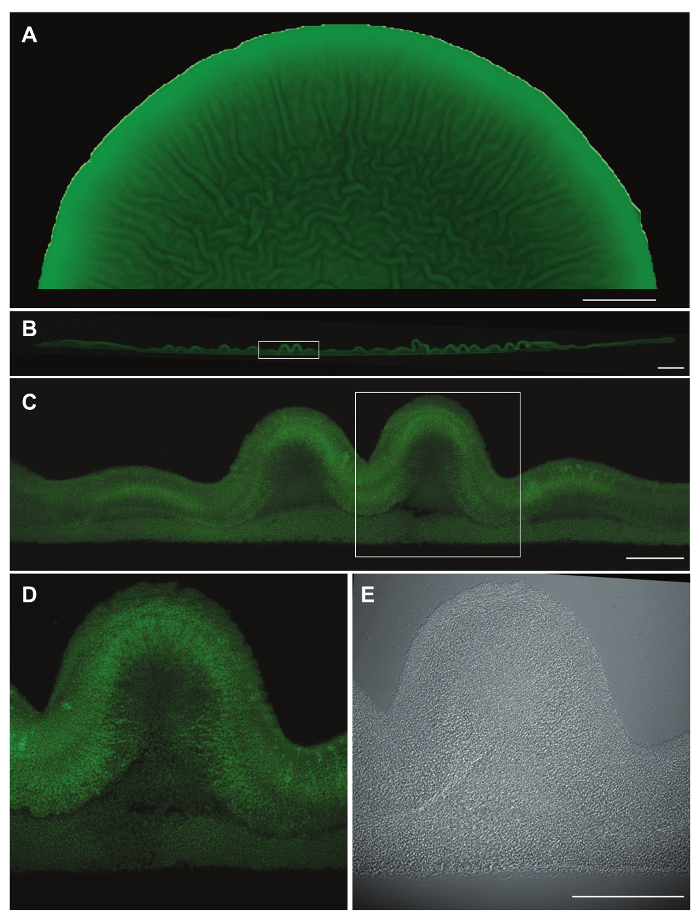
This method generates biofilm thin-sections wherein distinct morphological features and zones of gene expression can be imaged by DIC, fluorescence microscopy, and TEM. While DIC imaging using a 40X oil immersion objective can be sufficient to show some morphological features (Figure 2E), we have found that fluorescence microscopy of strains engineered to constitutively express fluorescent protein provides enhanced visualization of cell distribution within the sample (Figure 2D). Images of individual sections can be stitched together to generate a cross-section of the entire colony (Figure 2B) and to provide context for the localization of structural features within the overall morphology at the macroscopic level (compare Figure 2A, B, and C). Morphological features and fluorescent signals can be measured using imaging software14. Structures within the biofilm or transitions between zones of gene expression can then be correlated with distributions of metabolites or chemical gradients11 .
This protocol can be amended and adapted in several ways. Use of a strain engineered to express fluorescent protein under the control of a specific promoter enables visualization of the distribution of gene expression (Figure 3A). Colonies can be grown on medium containing dyes, or dyes can be added post-sectioning, to stain specific polysaccharides (Figures 3B and C). Finally, samples prepared in a modified version of this protocol can be examined by TEM (Figure 3D) to allow for visualization at higher resolution than that enabled by DIC or fluorescence microscopy.
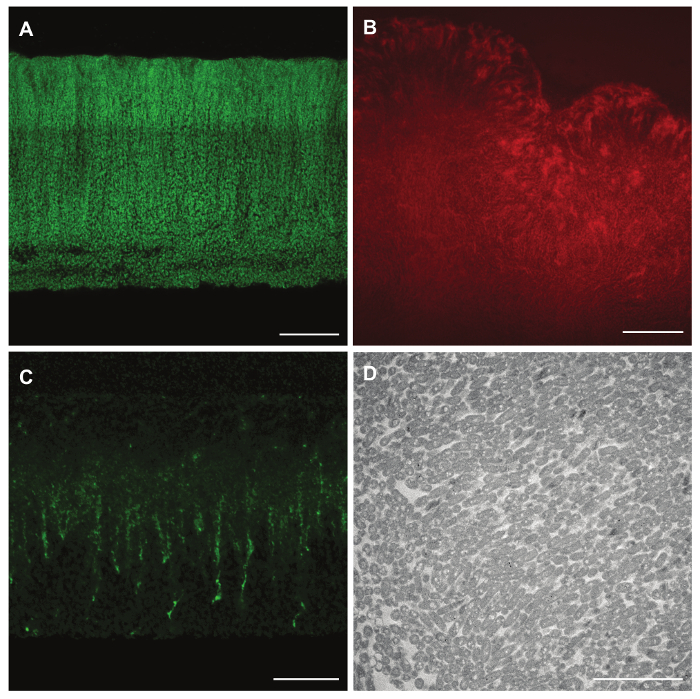
Figure 1: Schematic depicting setup for colony growth prior to fixation. (A) Colonies are grown on top of two layers of agar-solidified growth medium (top and bottom) and (B) are then overlaid with an additional layer (overlay), which preserves colony morphology. (C) The colony sandwiched between the overlay and top layer is then separated from the bottom layer for further processing. Please click here to view a larger version of this figure.
Figure 2: Micromorphological features and YFP fluorescence in cross-sections of paraffin-embedded colonies. Representative data for a Pseudomonas aeruginosa PA14 Δphz colony15 constitutively expressing YFP and grown for 3 days on 1% tryptone, 1% agar containing Congo red and Coomassie blue. (A) Top-view, fluorescence image showing half of a colony prior to fixation. (B) Cross section of the entire colony after paraffin-embedding. The boxed area was imaged with a 10X objective lens (C). The boxed area in (C) was then imaged with a 40X oil immersion objective lens using fluorescence (D) and DIC (E). Scale bars represent 2 mm (A), 500 µm (B), and 100 µm (C-E). Please click here to view a larger version of this figure.
Figure 3: Reporter expression, pre- and post-staining of biofilm features, and TEM imaging of paraffin-embedded colony biofilm samples. (A) mexGPr-GFP reporter fluorescence in a P. aeruginosa PA14 colony grown for 3 days on 1% tryptone, 1% agar. (B) Fluorescence of bound Congo red in a P. synxantha colony grown for 5 days on a medium containing the dye. (C) Fluorescence of the Wisteria floribunda lectin stain for Pel polysaccharide in a P. aeruginosa PA14 Δphz colony (grown for 2 days on 1% tryptone, 1% agar containing Congo red and Coomassie blue), applied after sectioning. (D) TEM image of a P. aeruginosa PA14 Δphz colony (grown for 3 days on 1% tryptone, 1% agar containing Congo red and Coomassie blue), and processed for sectioning via paraffin embedding*. Scale bar represents 40 µm (A-B), 20 µm (C), and 5 µm (D). Please click here to view a larger version of this figure.
*This sample was processed for sectioning via paraffin-embedding through Step 4 of the above protocol, omitting Steps 4.1-4.3, and then processed separately for TEM analysis.
Discussion
Paraffin-embedding and thin-sectioning tissue samples is a classic histological technique that enables imaging of micro-morphological structures and is commonly used on eukaryotic tissues, and has been applied with some success to microbial samples8,9. While cryoembedding allows for strong retention of endogenous and immunofluorescent signal, paraffin embedding is generally preferable as it provides better preservation of morphology16. In adapting this method for application to microbial biofilms, we focused on characteristics that are unique to our system. The cells and matrix of tissues are often held together relatively robustly, while biofilms tend to be more delicate; we therefore optimized routine fixation and wax embedding protocols to maximize sample retention. Maintaining the sample on its growth substrate and overlaying the colony with agar immediately prior to fixation ensures that the sample is not lost from the top or the base. However, overlaying colonies with agar that is too hot can damage the colonies, so extra care should be taken during this step.
Fixation is a critical step for retaining structure through the harsh dehydration, clearing, and infiltration steps required for paraffin embedding. We found that lysine-formaldehyde fixation best preserves the integrity of the sample. Soluble lysine, a diamine, can react with aldehydes to form cross-linked polymers and has been proposed to reinforce exopolymeric substance (EPS) against mechanical degradation17,18.
We have observed that background fluorescence decreases with successive washes in the orange oil-based clearing agent, or through prolonged exposure, during sample rehydration (step 9.3). Over-treatment with the clearing agent can, however, result in brittle samples that are difficult to section19. It may be necessary to adjust the volume or number of washes to reflect the amount of wax present during each rehydration. Increased background fluorescence can likewise arise from contamination of the tissue processing reagents, where the wax, which is slightly autofluorescent, is either fully or partially miscible in the clearing solvent or ethanol used in these steps (Steps 6.1-6.4). Additionally, we have found that ethanol diminishes reporter signal, and it is critical to re-constitute the fluorophore in two washes of PBS prior to mounting (step 9.5-9.6).
This method also allows for the localization of constitutive and promoter-driven fluorescence at the resolution of cells. However, we advise caution when using this method to interpret gene expression. The overlay step introduced in this protocol (Step 4.2), applied prior to fixation at 50 ˚C, presents a considerable environmental change relative to the initial growth conditions that may influence gene expression patterns. It may be useful to verify expression patterns by applying fixative to the colony directly, immediately prior to pouring the overlay, but at a cost to morphology (Optional Step 3.1-3.3).
Another factor influencing the interpretation of fluorescence is the topography of the section itself. Different regions of the biofilm may exhibit varying degrees of structural integrity and be more or less amenable to preservation via fixation, depending upon which, if any, functional groups those components are able to contribute to fixative cross-linking 20. As a result, sections may lose biomass disproportionately from the section surface when transitioning from one morphological or metabolic zone to another along the colony's z-axis. This may be addressed by imaging an intact focal slice of the section with a confocal microscope.
In addition to applying this technique to strains engineered to express fluorescent proteins, we have examined micromorphological features by transmission electron microscopy (TEM) and in biofilm samples stained with specific fluorescent dyes (Figure 3A). Jennings et al. recently described a dye specific for Pel, the major polysaccharide produced by P. aeruginosa PA14 biofilms 21. As described in the protocol and representative results above, application of this dye to sections allows for visualization of Pel distribution in PA14 colony biofilms at high resolution (Figure 3C) 3. Conversely, fluorescent dyes such as Congo red may be added to the growth medium and imaged post-sectioning (Figure 3B). The application of an overlay also preserves colony biofilm morphology and cell structure throughout processing for TEM (Figure 3D).
The optimized method described here enables the preparation of colony biofilms for sectioning via paraffin embedding, wherein endogenous signal and features or complexed dyes may be localized in vivo with superior resolution while minimizing sample loss and preserving native colony macro- and micro-morphologies. We acknowledge that substantial effort, time and reagent use are required for this method. However, we feel these drawbacks are countered by the degree of morphological preservation, the resolution of in situ fluorescence, and the amenability to pre- and post-staining procedures or alternative processing strategies (such as preparation for TEM) afforded by this technique.
Disclosures
The authors have nothing to disclose.
Acknowledgments
This work was supported by NSF CAREER AWARD 1553023 and NIH/NIAID award R01AI103369.
References
- Ray VA, Morris AR, Visick KL. A semi-quantitative approach to assess biofilm formation using wrinkled colony development. J. Vis. Exp. 2012. p. e4035. [DOI] [PMC free article] [PubMed]
- Friedman L, Kolter R. Genes involved in matrix formation in Pseudomonas aeruginosa PA14 biofilms. Mol. Microbiol. 2004;51(3):675–690. doi: 10.1046/j.1365-2958.2003.03877.x. [DOI] [PubMed] [Google Scholar]
- Okegbe C, et al. Electron-shuttling antibiotics structure bacterial communities by modulating cellular levels of c-di-GMP. Proc. Natl. Acad. Sci. U. S. A. 2017;114(26):E5236–E5245. doi: 10.1073/pnas.1700264114. [DOI] [PMC free article] [PubMed] [Google Scholar]
- Vlamakis H, Aguilar C, Losick R, Kolter R. Control of cell fate by the formation of an architecturally complex bacterial community. Genes Dev. 2008;22(7):945–953. doi: 10.1101/gad.1645008. [DOI] [PMC free article] [PubMed] [Google Scholar]
- Serra DO, Richter AM, Klauck G, Mika F, Hengge R. Microanatomy at cellular resolution and spatial order of physiological differentiation in a bacterial biofilm. MBio. 2013;4(2):e00103–e00113. doi: 10.1128/mBio.00103-13. [DOI] [PMC free article] [PubMed] [Google Scholar]
- Serra DO, Richter AM, Hengge R. Cellulose as an architectural element in spatially structured Escherichia coli biofilms. J. Bacteriol. 2013;195(24):5540–5554. doi: 10.1128/JB.00946-13. [DOI] [PMC free article] [PubMed] [Google Scholar]
- McGlinn E, Mansfield JH. Detection of gene expression in mouse embryos and tissue sections. Methods Mol. Biol. 2011;770:259–292. doi: 10.1007/978-1-61779-210-6_10. [DOI] [PubMed] [Google Scholar]
- Choi YS, Kim YC, Baek KJ, Choi Y. In Situ Detection of Bacteria within Paraffin-embedded Tissues Using a Digoxin-labeled DNA Probe Targeting 16S rRNA. J. Vis. Exp. 2015. p. e52836. [DOI] [PMC free article] [PubMed]
- James G, Hunt AMA. Imaging Biofilms in Tissue Specimens. Antibiofilm Agents. 2014. pp. 31–44.
- Madsen JS, et al. Facultative control of matrix production optimizes competitive fitness in Pseudomonas aeruginosa PA14 biofilm models. Appl. Environ. Microbiol. 2015;81(24):8414–8426. doi: 10.1128/AEM.02628-15. [DOI] [PMC free article] [PubMed] [Google Scholar]
- Jo J, Cortez KL, Cornell W-C, Price-Whelan A, Dietrich LEP. An orphan cbb3-type cytochrome oxidase subunit supports Pseudomonas aeruginosa biofilm growth and virulence. bioRxiv. 2017. p. 171538. [DOI] [PMC free article] [PubMed]
- Fong JC, et al. Structural dynamics of RbmA governs plasticity of Vibrio cholerae biofilms. Elife. 2017;6 doi: 10.7554/eLife.26163. [DOI] [PMC free article] [PubMed] [Google Scholar]
- Bertani G. Lysogeny at mid-twentieth century: P1, P2, and other experimental systems. J. Bacteriol. 2004;186(3):595–600. doi: 10.1128/JB.186.3.595-600.2004. [DOI] [PMC free article] [PubMed] [Google Scholar]
- Schindelin J, et al. Fiji: an open-source platform for biological-image analysis. Nat. Methods. 2012;9(7):676–682. doi: 10.1038/nmeth.2019. [DOI] [PMC free article] [PubMed] [Google Scholar]
- Dietrich LEP, Teal TK, Price-Whelan A, Newman DK. Redox-active antibiotics control gene expression and community behavior in divergent bacteria. Science. 2008;321(5893):1203–1206. doi: 10.1126/science.1160619. [DOI] [PMC free article] [PubMed] [Google Scholar]
- Zupančič D, Terčelj M, Štrus B, Veranič P. How to obtain good morphology and antigen detection in the same tissue section? Protoplasma. 2017. [DOI] [PubMed]
- Priester JH, et al. Enhanced visualization of microbial biofilms by staining and environmental scanning electron microscopy. J. Microbiol. Methods. 2007;68(3):577–587. doi: 10.1016/j.mimet.2006.10.018. [DOI] [PubMed] [Google Scholar]
- Boyles J, Anderson L, Hutcherson P. A new fixative for the preservation of actin filaments: fixation of pure actin filament pellets. J. Histochem. Cytochem. 1985;33(11):1116–1128. doi: 10.1177/33.11.3902963. [DOI] [PubMed] [Google Scholar]
- Blackburn MR. Examination of normal and abnormal placentation in the mouse. Methods Mol. Biol. 2000;136:185–193. doi: 10.1385/1-59259-065-9:185. [DOI] [PubMed] [Google Scholar]
- Hoffman EA, Frey BL, Smith LM, Auble DT. Formaldehyde crosslinking: a tool for the study of chromatin complexes. J. Biol. Chem. 2015;290(44):26404–26411. doi: 10.1074/jbc.R115.651679. [DOI] [PMC free article] [PubMed] [Google Scholar]
- Jennings LK, et al. Pel is a cationic exopolysaccharide that cross-links extracellular DNA in the Pseudomonas aeruginosa biofilm matrix. Proc. Natl. Acad. Sci. U. S. A. 2015;112(36):11353–11358. doi: 10.1073/pnas.1503058112. [DOI] [PMC free article] [PubMed] [Google Scholar]