

Abstract
Allosteric (i.e. long-range) communication within proteins is crucial for many biological processes, such as the activation of signaling cascades in response to specific stimuli. However, the physical basis for this communication remains unclear. Existing computational methods for identifying allostery focus on the role of concerted structural changes, but recent experimental work demonstrates that disorder is also an important factor. Here, we introduce the Correlation of All Rotameric and Dynamical States (CARDS) framework for quantifying correlations between both the structure and disorder of different regions of a protein. To quantify disorder, we draw inspiration from methods for quantifying “dynamic heterogeneity” from chemical physics to classify segments of a dihedral’s time evolution as being in either ordered or disordered regimes. To demonstrate the utility of this approach, we apply CARDS to the Catabolite Activator Protein (CAP), a transcriptional activator that is regulated by Cyclic Adenosine MonoPhosphate (cAMP) binding. We find that CARDS captures allosteric communication between the two cAMP-Binding Domains (CBDs). Importantly, CARDS reveals that this coupling is dominated by disorder-mediated correlations, consistent with NMR experiments that establish allosteric coupling between the CBDs occurs without a concerted structural change. CARDS also recapitulates an enhanced role for disorder in the communication between the DNA-Binding Domains (DBDs) and CBDs in the S62F variant of CAP. Finally, we demonstrate that using CARDS to find communication hotspots identifies regions of CAP that are in allosteric communication without foreknowledge of their identities. Therefore, we expect CARDS to be of great utility for both understanding and predicting allostery.
Graphical Abstract
INTRODUCTION
Despite its fundamental importance, understanding of the physical mechanisms of allosteric communication remains incomplete. For example, significant effort has gone into studying how G-Protein Coupled Receptors (GPCRs) allosterically transmit extracellular signals to intracellular binding partners.1 However, understanding of this process is still insufficient for the routine design of drugs that allosterically modulate GPCRs.2
Models of allostery have typically focused on concerted structural changes.3 For example, the classic induced fit model postulates that ligand binding to one subunit of a protein causes a conformational change in other subunits.4,5 The conformational selection model also focuses on structural changes, positing that ligand binding to one subunit stabilizes an alternative (but pre-existing) structure of other subunits.6 Extensive work establishes there is often a role for conformational selection,7 though there is clearly a continuum between extreme versions of induced-fit and conformational selection.8–10 This conclusion implies allostery can be inferred from proteins’ equilibrium fluctuations even in the absence of an allosteric perturbation. Inspired by this implication, numerous methods have been developed to infer allosteric communication from structural fluctuations observed in molecular simulations.11–32
While concerted structural changes are clearly important for allostery, there is mounting evidence that conformational disorder has an important role to play, and can even lead to allosteric communication in the absence of concerted structural transitions.3,33–39 The importance of allostery without conformational change first appeared in a model where ligand binding perturbs the entropy of a distant site rather than its preferred structure.40 Since then, NMR and ITC experiments on Catabolite Activator Protein (CAP) have established allosteric communication without conformational change exists in nature.41–43 CAP is a homodimeric transcription factor whose DNA-binding affinity increases upon binding of cAMP to the cAMP-Binding Domains (CBDs).44,45 In wild-type CAP, cAMP binding allosterically induces the DNA-Binding Domains (DBDs) to swivel around the central hinge region into a DNA-binding conformation (Fig. 1).46,47 There is also negative coupling between the two CBDs.44,45,48 A combination of NMR and ITC measurements reveal that binding of cAMP to one CBD reduces the cAMP-binding affinity of the second CBD without changing its structure.42,48 Additional experiments reveal that binding of cAMP activates the S62F variant of CAP without causing a conformational change in the hinge or DBDs.49,50
Figure 1.
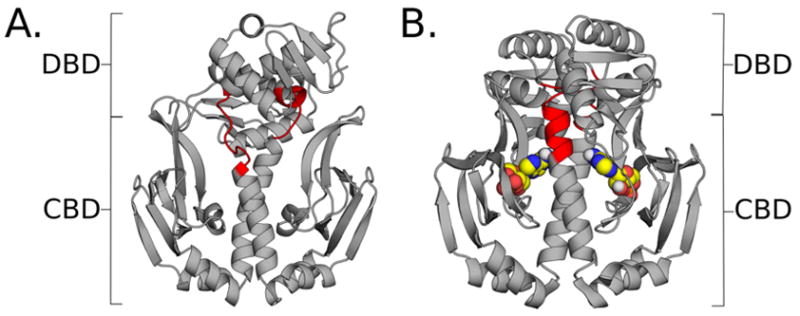
Structures of CAP in apo and holo forms. A. Structure of apo-CAP, with cAMP-binding domains (CBDs) and DNA-binding domains (DBDs) indicated by brackets. Residues that make up the hinge region are colored in red. B. Structure of holo-CAP with cAMP ligands (spheres) bound to the CBD regions. The same hinge residues are colored in red.
While the importance of disorder is gaining widespread acceptance, the field lacks systematic methods for identifying allosteric communication in the absence of conformational change. For example, NMR has yet to uncover how these signals are transmitted. COREX/BEST,35,51,52 other coarse-grained models,18 and normal modes53 provide valuable insights but miss essential subtleties, such as important side-chain motions. Using molecular dynamics simulations to measure the mutual information between the orientations of different dihedral angles captures the reduction in uncertainty (measured with an entropy metric) about the structure of one dihedral given knowledge of another,19–21 but does not capture phenomena like changes in the rotameric state of one dihedral increasing the conformational heterogeneity of a distant site. Approaches for inferring allosteric coupling from sequence covariation54,55 are agnostic to the mechanism underlying this communication and cannot explain how it occurs. A method for identifying timing correlations has promise for capturing disorder-mediated coupling.56 For example, application of this approach to side-chain degrees of freedom in CAP successfully identified hotspots for allosteric communication. It also demonstrated that disorder-mediated correlations give rise to long-range communication, while purely structural correlations are limited to short-ranged communication. However, timing correlations do not integrate structural and dynamical correlations into a holistic measure of communication that can capture the continuum of possibilities between purely structural and purely disorder-mediated coupling.
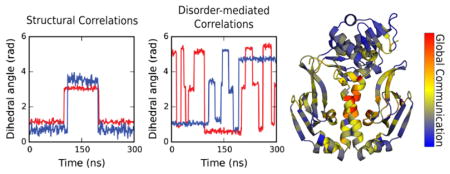
Here, we introduce the CARDS (Correlation of all Rotameric and Dynamical States) methodology for quantifying the roles of both concerted structural changes and conformational disorder. CARDS is based on our observation that a single degree of freedom (e.g. a dihedral angle) can transition between “ordered” regimes, wherein it undergoes small fluctuations within a single structural state, and “disordered” regimes wherein it undergoes bursts of transitions between different structural states (Fig. 2A). Similar “dynamic heterogeneity”57–59 has been observed in the physics of glasses, where it has been shown that a single degree of freedom’s local environment can either facilitate dynamics by flattening out the effective free energy surface that degree of freedom experiences or freeze out dynamics.60–62 CARDS identifies ordered and disordered regimes based on two kinetic signatures: the average time a degree of freedom persists within a structural state and the typical timescale for transitions between structural states. For many dihedrals, we observe that the typical time that elapses between structural transitions, which is dominated by segments of a trajectory in disordered regimes, is orders of magnitude smaller than the typical persistence time in a state. Based on these kinetic signatures, CARDS assigns segments of trajectories to dynamical states (i.e. ordered and disordered regimes). CARDS then quantifies correlations between the structural and dynamical states of different dihedrals. Specifically, we employ the mutual information to assess how much better one can predict the structural and dynamical states of one dihedral given knowledge of the structural and dynamical states of another dihedral. To demonstrate the utility of CARDS, we assess whether it can identify allosteric communication in the absence of concerted structural changes observed in CAP.
Figure 2.

Workflow for identifying ordered and disordered regimes. A. An example of the time-evolution of a χ1 angle. The core of each rotameric state is shaded green and the buffer zones between them are white. B. Assignment of each snapshot in the trajectory to rotameric states. C. Transition indicator function identifying where the dihedral changes states. Examples of ordered (τord) and disordered (τdis) times are labeled. D. Assignment of each snapshot in the trajectory to dynamical states (e.g. ordered and disordered regimes).
THEORY AND METHODS
CARDS captures all forms of correlated fluctuations, including concerted structural changes, correlations between the conformational disorder of different degrees of freedom, and correlations between the structure of one degree of freedom and the conformational disorder of another. As in other recent work, we focus on dihedral angles, as they are natural degrees of freedom for describing protein structure and dynamics and are easily decomposed into a small number of rotameric states.20,21
Molecular dynamics simulations
We ran three 500 ns simulations with our previously published protocol63 (see SI for details). Briefly, we placed PDB ID 4N9H47 in a dodecahedron box and solvated it with TIP3P explicit solvent64 extending 1 nm beyond the protein in any dimension. We used PyMOL65 to mutate Ser62 to Phe to create a starting structure for the S62F variant. For each system, we ran simulations with the Gromacs software package66 using the Amber03 force field.67 This combination of software and parameters was selected because it has proven reliable in our past studies of both protein folding68 and structural fluctuations within folded proteins.63,69,70
As described in the Results section, our microsecond timescale simulations are sufficient to recapitulate much of what is known from experiments about allostery in CAP. The correlation coefficient between the couplings obtained from any individual simulation and the combination of three simulations is 0.64±0.02, suggesting that hundreds of nanoseconds of simulation may be sufficient to discover gross patterns of communication but are insufficient to obtain converged results. The correlation coefficient between the coupling obtained from any pair of simulations and the combination of three simulations is 0.79±0.02, suggesting that 1–1.5 microseconds of simulation give more reproducible results. Taken together with our past work, we conclude that a few microseconds of simulation are adequate to demonstrate the utility of our new method and, likely, to gain valuable insights into many systems.
Assignment of dihedrals to rotameric states
Dihedral angles were calculated with MDTraj71 and assigned to discrete rotameric states (e.g. gauche+, gauche−, and trans for most χ angles and cis or trans states for backbone dihedrals). Transition-Based Assignment (TBA) is used to distinguish lasting transitions from transient fluctuations.72–75 TBA prevents over-counting of transitions (e.g. due to fluctuations at a barrier peak where a simulation repeatedly crosses a hard cutoff between rotameric states) by defining a core region within each rotameric state and buffer zones between them. A dihedral is only considered to have changed rotameric states if it transitions from the core of one state to the core of another state, passing completely through the buffer zone between cores (Fig. 2A and 2B). A dihedral that starts in one core, enters a buffer zone, and then returns to its initial core is said to have remained in the initial rotameric state. We define the core of a rotameric state as a region of width W centered between the boundaries between rotamers. We present results using a core width of 90°, but our results are robust to variations in the core width ranging from 60° to 90° (Fig. S1A).
Assignment of snapshots to dynamical states
CARDS assigns snapshots to ordered and disordered regimes based on two variables that describe the dynamics of the trajectory: the mean ordered time (〈τord〉) and mean disordered time (〈τdis〉). An ordered time (τord) is the time from any time-point to the next time where a transition occurs and a disordered time (τdis) is the time between two consecutive transitions (Fig. 2C). These times are called persistence and exchange times in the condensed matter physics literature.61,62,76 For many dihedrals, we observe that 〈τdis〉 ≪ 〈τord〉 〈τdis〉 because 〈τdis〉 is dominated by the short times between transitions in disordered regimes, whereas 〈τord〉 is heavily influenced by the lengthy times without any transitions in ordered regimes. To calculate these times, CARDS first identifies the time points where a dihedral transitions between two different rotameric states (Fig. 2C), referred to as the transition indicator function. The method then extract the complete set of τdis and τord values in the trajectory. Next, CARDS classifies each segment of a trajectory between two consecutive transitions as being in an ordered or disordered regime based on whether the length of the segment (t) between the transitions is more consistent with the distribution of ordered or disordered times (Fig. 2D). We find that transitions within ordered and disordered regimes are roughly Poisson processes with different characteristic times (〈τord〉 and 〈τdis〉, respectively), see Fig. S2. Therefore, CARDS determines if a segment of a trajectory of length t between two consecutive transitions is more consistent with an ordered or disordered regime using the likelihood ratio (L):
| (1) |
where Pdis is the probability the segment is disordered and Pord is the probability it is ordered. Taking inspiration from the interpretation of Bayes factors,77 CARDS classifies a segment of a trajectory as being disordered if L > 3.0, otherwise the trajectory segment is classified as being in an ordered regime. Our results are robust to varying this cutoff from 1.5 to 5 (Fig. S1B).
Calculation of structural, disorder-mediated, and holistic correlations
The primary objective of CARDS is to calculate the total correlation between different dihedrals, including both their rotameric state and dynamical state (e.g. whether the dihedral is in an ordered or disordered regime at a given time). Towards this end, we define the holistic correlation (IH) between dihedrals X and Y as
| (2) |
where is the normalized mutual information between the structure (i.e. rotameric state) of dihedral X and the structure of dihedral Y, is the normalized mutual information between the structure of dihedral X and the dynamical state of dihedral Y, is the normalized mutual information between the dynamical state of dihedral X and the structure of dihedral Y, and is the normalized mutual information between the dynamical state of dihedral X and the dynamical state of dihedral Y. The mutual information (I) is:
where x ∈ X refers to the set of possible states that dihedral X can adopt, p(x) is the probability that dihedral X adopts state x, and p(x, y) is the joint probability that dihedral X adopts state x and dihedral Y adopts state y. We define the normalized mutual information ( ) as
where C(X, Y) is the maximum possible mutual information between two dihedrals, called the channel capacity.78 Using this normalized mutual information allows for a direct comparison between the different components of the holistic correlation by correcting for the fact that the largest possible mutual information between different types of dihedrals will vary based on how many different states there are. For example, a side-chain dihedral has three possible rotameric states but only two possible dynamical states, so structural correlations (Iss) can be as large as log(3) while the correlations between dynamical states (Idd) can only reach as high as log(2).
In addition to the above, we define the disorder-mediated correlation (IDM) as all forms of correlation between two dihedrals that rely, at least in part, on disorder ( ). This construct is useful for assessing the importance of disorder relative to existing methods based purely on concerted structural changes (Iss). We use bootstrapping to measure the uncertainty in our estimates of all the components of the holistic correlation to ensure any comparisons we make are statistically sound. Specifically, we draw 20 random samples of our trajectories, with replacement, and calculate the structural and disorder-mediated correlations between all pairs of residues. We conclude that disorder-mediated communication dominates if the average disorder-mediated communication minus the standard deviation across all our bootstrap samples is greater than the mean structural correlation plus the standard deviation.
Calculation of the net communication to a target site
We are often interested in calculating how much influence a particular residue has over another site, such as an active site or ligand-binding site. To calculate the communication between a reference residue and some target site, we take the average mutual information between two sets of dihedrals: 1) all dihedrals in the reference residue and its nearest neighbors and 2) all dihedrals in the target site. We define the nearest neighbors of a reference residue as all residues with atoms that fall within 3 Å of any atom in the reference residue. Varying this cutoff does not alter our results (Fig. S1C). Including both a reference residue and its nearest neighbors accounts for the fact that mutating the reference residue will directly change the environment of all neighboring residues.
Calculation of global communication
In addition to identifying residues that have strong correlations to a specific target site, it would also be valuable to identify residues that generally appear to play an important role in allosteric networks. Towards this end, we define the global communication strength of a residue as the sum of its holistic correlations to all other residues. For these calculations, we also include neighboring residues, as in our calculation of the net communication to a target site.
RESULTS AND DISCUSSION
Many dihedrals have the potential for disorder-mediated communication
For a dihedral to have ordered and disordered regimes, 〈τord〉 must be significantly larger than 〈τdis〉. We reasoned that determining if 〈τord〉 ≥ 3 × 〈τdis〉 is a reasonable heuristic for identifying dihedrals with separable ordered and disordered regimes based on the likelihood ratio defined in Eq. 1. Dihedrals that do not meet this criterion are classified as entirely being in ordered regimes and, therefore, are only capable of having structural correlations with other dihedrals.
Based on the criterion defined above, we find that 556 of the 1584 dihedrals in CAP have separable ordered and disordered regimes and, therefore, are capable of disorder-mediated communication with other dihedrals (Fig. S3). Mapping these dihedrals to the apo structure of CAP highlights a number of interesting patterns (Fig. 3). First of all, CARDS reveals that many side-chain dihedrals buried in CAP’s core are capable of disorder-mediated communication. This finding helps to rectify the apparent contradiction between the common physical intuition that proteins’ cores should be rigid due to their tight packing and the observation that there is substantial conformational heterogeneity within proteins’ cores.79,80 That is, dihedrals within a protein’s core are commonly locked in a single rotameric state for extended periods of time but rare fluctuations create room for conformational changes. Backbone dihedrals that are capable of disorder-mediated communication tend to reside on the protein’s surface. Notably, a number of these backbone dihedrals are in β-sheets that contact cAMP. However, there are also backbone dihedrals within the core that are capable of disorder-mediated communication. For example, we find backbone dihedrals within the central hinge region that are capable of disorder-mediated communication. This observation is noteworthy because the hinge region undergoes a large conformational change upon activation of CAP (Fig. 1).48–50 We find that similar patterns emerge when we vary the cutoff for determining whether a dihedral has separable ordered and disordered regimes (Fig. S4).
Figure 3.
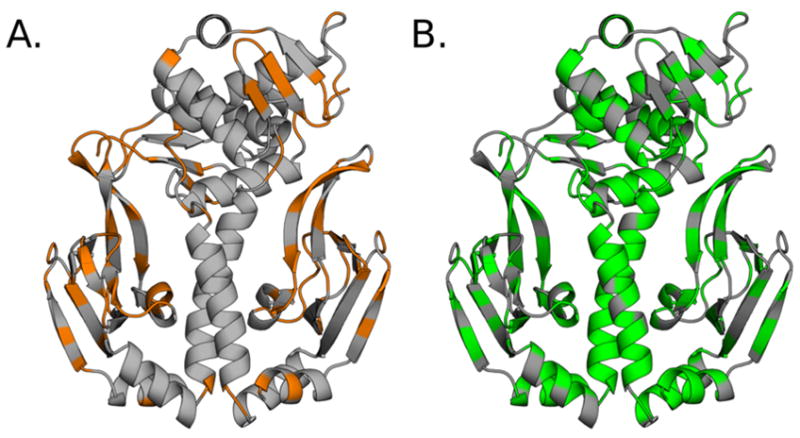
Residues whose dihedrals are capable of disorder-mediated communication. A. Residues with at least one backbone dihedral that is capable of disorder-mediated communication (orange). B. Residues with at least one side-chain dihedral that is capable of disorder-mediated communication (green).
Disorder-mediated correlations dominate communication between the CBDs
Given experimental evidence for allosteric communication between the CBDs without a concerted structural change,49 we expect the disorder-mediated component of the holistic correlation between these sites to be larger than the purely structural component. To test this prediction, we simulated apo CAP for 1.5 μs and calculated the net communication of every residue to one of the cAMP-binding sites. Specifically, we defined the target site as all residues with heavy atoms within 6 Å of one of the two cAMP molecules in the holo crystal structure (PDB ID 1CGP46). The residues in this target site are 30, 36, 49, 61–62, 64, 69–86, and 99 from chain A and residues 122–129 from chain B.
As predicted, CARDS successfully identifies that there is communication between the two CBDs. Fig. 4A shows the holistic correlations to a single cAMP-binding site. Unsurprisingly, the residues with the strongest correlations to this set of residues reside within the same CBD. However, there is also strong communication between the target site and residues lining the other cAMP-binding pocket. There are also strong correlations on the central hinge region and the interface between the CBDs and DBDs that may be responsible for allosteric coupling between these domains.
Figure 4.

Communication to a single CBD. A. Holistic mutual information (IH) of each residue to the residues lining a single cAMP-binding pocket (shown in sticks). B. Residues whose communication to the cAMP-binding pocket is dominated by disorder-mediated communication (orange sticks). Residues lining the target cAMP-binding pocket are in blue sticks.
To determine the relative importance of disorder-mediated communication and purely structural correlations, we broke the holistic communication into structural and disorder-mediated components. Furthermore, we used bootstrapping to estimate the uncertainty in each of these components.
Identifying residues where disorder-mediated communication to the target cAMP-binding site is larger than purely structural correlations automatically identifies a number of residues in the second cAMP-binding site (Fig. 4B, Fig. S5). This finding demonstrates that CARDS recapitulates the experimental finding that communication between the two CBDs does not primarily occur through concerted structural changes.49 CARDS also identifies disorder-dominated communication within a single CBD. Furthermore, the Pearson correlation coefficient between structural and disorder-mediated communication is 0.44. This result indicates there are some similarities between patterns of allosteric coupling that could be observed by focusing entirely on structural correlations and those identified by CARDS, but that considering disorder provides additional information.
Disorder-mediated communication is enhanced in the S62F variant
The S62F variant of CAP is still activated by cAMP binding.49,50,81,82 However, NMR studies have revealed that the conformation of the DBDs does not change upon cAMP binding. Rather, NMR and ITC experiments suggest an important role for conformational entropy, with the DBDs only changing conformation in the presence of both cAMP and DNA.49,50 Therefore, we expect an increase in disorder-mediated communication between the CBDs and DBDs in the S62F variant, compared to wild-type CAP.
To determine the effect of the S62F variant, we also ran 1.5 μs of simulation of this variant. Then we calculated the holistic communication to a single cAMP-binding site, as described for wild-type CAP.
As expected, we observe significant increases in disorder-mediated communication between the target CBD and the DBDs. There are particularly large increases in disorder-mediated correlations in regions of known importance for CAP activation, such as the central hinge region and along the interfaces between the CBDs and DBDs (Fig. 5A). At the same time, there are some decreases in disorder-mediated communication within the CBDs. There are also changes in purely structural correlations. These changes often follow the same qualitative trends as the changes in disorder-mediated communication. However, the magnitudes of any increases in purely structural correlations are considerably smaller than the increases in disorder-mediated correlations. Furthermore, reductions in structural correlations are often larger than any decreases in disorder-mediated communication.
Figure 5.

Change in coupling to a single CBD pocket upon the S62F mutation. A. Change in disorder-mediated communication of each residue to the single cAMP-binding pocket depicted in Fig. 4. B. Change in structural communication of each residue to the same cAMP-binding pocket. Red indicates increased communication in S62F compared to wild-type, and blue indicates decreased communication.
Side-chain-side-chain and backbone-side-chain correlations dominate allosteric communication in CAP
To begin understanding the relative importance of different types of degrees of freedom, we plotted the matrix of correlations between every pair of dihedrals (Fig. 6A). The upper triangle represents purely structural correlations, while the lower triangle represents purely disorder-mediated correlations. Side-chain and backbone dihedrals are also grouped together to enable comparisons between the relative strengths of backbone-backbone, backbone-side-chain and side-chain-side-chain correlations.
Figure 6.

Hubs of backbone-side-chain communication in wild-type CAP. A. Mutual information between every pair of dihedrals in wild-type CAP. The upper triangle of the matrix (above the green diagonal) represents structural communication and the lower triangle (below the green diagonal) represents disorder-mediated communication. The pink and cyan squares encompass the regions of the matrix that capture backbone-side-chain communication that is mediated by disorder-mediated and structural coupling, respectively. B. Structure of wild type CAP highlighting the residues that are the strongest hubs (top 5%) of backbone-side-chain communication (red sticks).
Inspection of the matrix of all pairwise correlations immediately reveals that side-chain-side-chain correlations dominate allosteric communication in CAP. This observation is consistent with previous reports that side-chain degrees of freedom are more variable than the backbone.79,80,83–89 Backbone-backbone correlations are far rarer, and we find that disorder-mediated correlations between backbone dihedrals are more common than structural correlations.
We also find a small number of backbone dihedrals that appear to be hubs of communication that are coupled to the side-chains of a large fraction of the residues in CAP. These hubs appear as lines in the backbone-side-chain quadrants of the matrix in Fig. 6A. Mapping the strongest (top 5%) backbone hubs to the structure reveals that they cluster in two regions: the phosphate-binding cassette (PBC) of each CBD and the interface between the CBDs and DBDs, including the central hinge (Fig. 6B). Using an even stricter cutoff (top 2%) only identifies residues along the CBD-DBD interface and within the central hinge (Fig S6), further emphasizing their importance in the allosteric network. This result suggests that perturbations to these functionally important regions (e.g. cAMP binding) can influence the behavior of the entire protein, and vice versa.
Locating communication hotspots identifies key functional sites
The coincidence of backbone dihedrals that are hubs of communication and key functional sites suggests that CARDS may be capable of predicting the locations of such sites. Indeed, if evolution has selected for communication between particular sites, then one might expect residues in these sites to have stronger coupling to other regions of a protein than typical residues.
To detect strongly communicating residues, we ranked each residue based on the sum of its correlations to all other residues in the protein. This measure of global communication will highlight two types of hotspots: 1) hubs with correlations to many residues and 2) residues that have strong correlations to a few residues.
Coloring each residue in the apo structure according to its global communication highlights that the central hinge region and the helices between the two cAMP-binding sites are key mediators of allosteric communication in CAP (Fig. 7). There are also hotspot residues in other parts of the cAMP-binding sites and along the interfaces between the CBDs and DBDs. These are precisely the regions that were identified by assessing communication to a single cAMP-binding site, providing evidence that CARDS can indeed identify key functional sites without foreknowledge of their locations. This conclusion is further supported by the fact that the central hinge region has even stronger communication in the S62F variant (Fig. S7).
Figure 7.
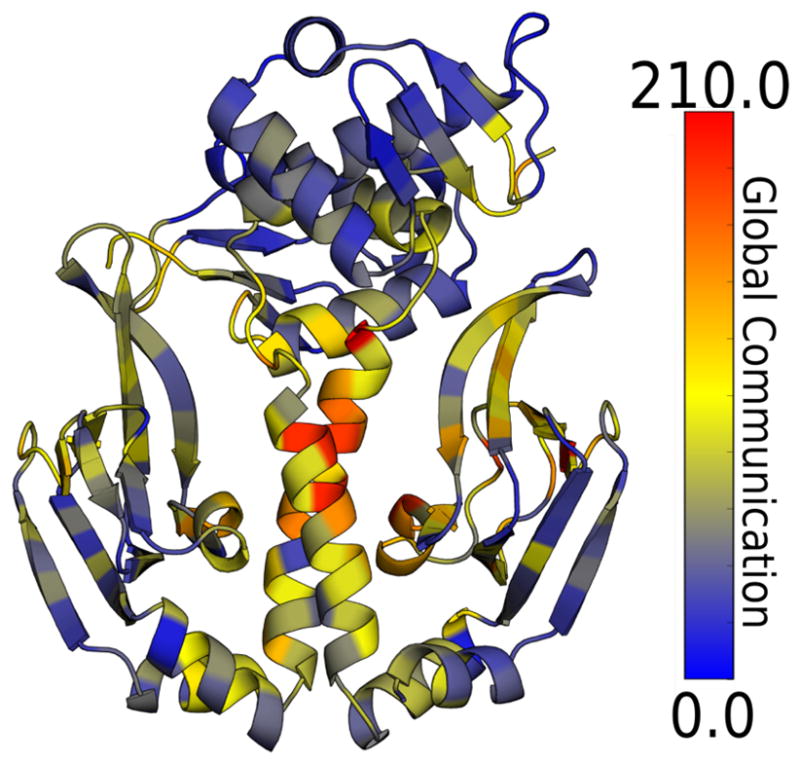
Global communication strength of each residue in apo CAP.
CONCLUSIONS
CARDS provides a means to integrate concerted structural changes and disorder-mediated correlations into a holistic view of allostery. Application of this approach to wild-type CAP and the S62F variant demonstrates the method’s ability to identify allosteric coupling in the absence of concerted structural changes. Specifically, we showed that examining the coupling of every residue to a known cAMP binding site naturally highlights regions of the protein that are known to be impacted by cAMP binding, such as the second cAMP binding site and the central hinge region connecting the CBDs and DBDs. Decomposing the correlations between these sites into disorder-mediated and purely structural components demonstrates an important role for disorder-mediated coupling in the absence of concerted structural changes. Our global communication metric also provides a means to identify important functional sites without foreknowledge of their existence and locations. For example, this metric identifies the central hinge region—which undergoes the largest conformational change upon activation—and the cAMP binding pockets as important components of the allosteric network in CAP. Therefore, CARDS should be a powerful means to identify allosteric networks in systems that have not been studied as thoroughly as CAP. Taken together, we expect CARDS to be of great utility for understanding allostery in systems where it is already known to occur, as well as for predicting allostery in systems where it has yet to be observed.
Supplementary Material
Acknowledgments
Funding Sources
This research was supported by the National Science Foundation CAREER Award MCB-1552471. G.R.B. also holds a Career Award at the Scientific Interface from the Burroughs Wellcome Fund and a Packard Fellowship for Science and Engineering from The David & Lucile Packard Foundation.
This work was funded by NSF CAREER Award MCB-1552471. G.R.B. holds a Career Award at the Scientific Interface from the Burroughs Wellcome Fund and a Packard Fellowship for Science and Engineering from The David & Lucile Packard Foundation. We are also grateful to NVIDIA Corporation for the GTX Titan X used to run preliminary simulations. Finally, thanks to Kelsey C. Schuster and David Chandler, who, in collaboration with G.R.B., first demonstrated that proteins’ side-chains have dynamic heterogeneity.
Footnotes
The authors declare no competing financial interest.
The Supporting Information is available free of charge on the ACS Publications website.
Supplementary Figures S1–S7, along with a more detailed account of simulation and sensitivity testing methodologies (PDF)
References
- 1.Rosenbaum DM, Rasmussen SGF, Kobilka BK. The Structure and Function of G-Protein-Coupled Receptors. Nature. 2009;459(7245):356–363. doi: 10.1038/nature08144. [DOI] [PMC free article] [PubMed] [Google Scholar]
- 2.Shoichet BK, Kobilka BK. Structure-Based Drug Screening for G-Protein-Coupled Receptors. Trends Pharmacol Sci. 2012;33(5):268–272. doi: 10.1016/j.tips.2012.03.007. [DOI] [PMC free article] [PubMed] [Google Scholar]
- 3.Guo J, Zhou H-X. Protein Allostery and Conformational Dynamics. Chem Rev. 2016;116(11):6503–6515. doi: 10.1021/acs.chemrev.5b00590. [DOI] [PMC free article] [PubMed] [Google Scholar]
- 4.Koshland DE. Enzyme Flexibility and Enzyme Action. J Cell Comp Physiol. 1959;54:245–258. doi: 10.1002/jcp.1030540420. [DOI] [PubMed] [Google Scholar]
- 5.Koshland DE, Jr, Nemethy G, Filmer D. Comparison of Experimental Binding Data and Theoretical Models in Proteins Containing Subunits *. Biochemistry. 1966;5(1):365–385. doi: 10.1021/bi00865a047. [DOI] [PubMed] [Google Scholar]
- 6.Monod J, Wyman J, Changeux J-P. On the Nature of Allosteric Transitions: a Plausible Model. J Mol Biol. 1965;12(1):88–118. doi: 10.1016/s0022-2836(65)80285-6. [DOI] [PubMed] [Google Scholar]
- 7.Changeux J-P, Edelstein S. Conformational Selection or Induced Fit? 50 Years of Debate Resolved. F1000 Biol Rep. 2011;3(19):19. doi: 10.3410/B3-19. [DOI] [PMC free article] [PubMed] [Google Scholar]
- 8.Csermely P, Palotai R, Nussinov R. Induced Fit, Conformational Selection and Independent Dynamic Segments: an Extended View of Binding Events. Trends Biochem Sci. 2010;35(10):539–546. doi: 10.1016/j.tibs.2010.04.009. [DOI] [PMC free article] [PubMed] [Google Scholar]
- 9.Silva D-A, Bowman GR, Sosa-Peinado A, Huang X. A Role for Both Conformational Selection and Induced Fit in Ligand Binding by the LAO Protein. PLoS Comput Biol. 2011;7(5):e1002054. doi: 10.1371/journal.pcbi.1002054. [DOI] [PMC free article] [PubMed] [Google Scholar]
- 10.Hammes GG, Chang Y-C, Oas TG. Conformational Selection or Induced Fit: a Flux Description of Reaction Mechanism. Proc Natl Acad Sci USA. 2009;106(33):13737–13741. doi: 10.1073/pnas.0907195106. [DOI] [PMC free article] [PubMed] [Google Scholar]
- 11.Ichiye T, Karplus M. Collective Motions in Proteins: a Covariance Analysis of Atomic Fluctuations in Molecular Dynamics and Normal Mode Simulations. Proteins. 1991;11(3):205–217. doi: 10.1002/prot.340110305. [DOI] [PubMed] [Google Scholar]
- 12.Radkiewicz JL, Brooks CL. Protein Dynamics in Enzymatic Catalysis: Exploration of Dihydrofolate Reductase. J Am Chem Soc. 2000;122(2):225–231. [Google Scholar]
- 13.Agarwal PK, Billeter SR. Nuclear Quantum Effects and Enzyme Dynamics in Dihydrofolate Reductase Catalysis. J Phys Chem B. 2002;106(12):3283–3293. [Google Scholar]
- 14.Agarwal PK, Billeter SR, Rajagopalan PTR, Benkovic SJ, Hammes-Schiffer S. Network of Coupled Promoting Motions in Enzyme Catalysis. Proc Natl Acad Sci USA. 2002;99(5):2794–2799. doi: 10.1073/pnas.052005999. [DOI] [PMC free article] [PubMed] [Google Scholar]
- 15.Rod TH, Radkiewicz JL, Brooks CL. Correlated Motion and the Effect of Distal Mutations in Dihydrofolate Reductase. Proc Natl Acad Sci USA. 2003;100(12):6980–6985. doi: 10.1073/pnas.1230801100. [DOI] [PMC free article] [PubMed] [Google Scholar]
- 16.Lange OF, Grubmüller H. Generalized Correlation for Biomolecular Dynamics. Proteins. 2006;62(4):1053–1061. doi: 10.1002/prot.20784. [DOI] [PubMed] [Google Scholar]
- 17.Whitley MJ, Lee AL. Frameworks for Understanding Long-Range Intra-Protein Communication. Curr Protein Pept Sci. 2009;10(2):116–127. doi: 10.2174/138920309787847563. [DOI] [PMC free article] [PubMed] [Google Scholar]
- 18.Weinkam P, Pons J, Sali A. Structure-Based Model of Allostery Predicts Coupling Between Distant Sites. Proc Natl Acad Sci USA. 2012;109(13):4875–4880. doi: 10.1073/pnas.1116274109. [DOI] [PMC free article] [PubMed] [Google Scholar]
- 19.Lenaerts T, Ferkinghoff-Borg J, Stricher F, Serrano L, Schymkowitz JWH, Rousseau F. Quantifying Information Transfer by Protein Domains: Analysis of the Fyn SH2 Domain Structure. BMC Structural Biology. 2008;8(1):43. doi: 10.1186/1472-6807-8-43. [DOI] [PMC free article] [PubMed] [Google Scholar]
- 20.McClendon CL, Friedland G, Mobley DL, Amirkhani H, Jacobson MP. Quantifying Correlations Between Allosteric Sites in Thermodynamic Ensembles. J Chem Theory Comput. 2009;5(9):2486–2502. doi: 10.1021/ct9001812. [DOI] [PMC free article] [PubMed] [Google Scholar]
- 21.DuBay KH, Bothma JP, Geissler PL. Long-Range Intra-Protein Communication Can Be Transmitted by Correlated Side-Chain Fluctuations Alone. PLoS Comput Biol. 2011;7(9):e1002168. doi: 10.1371/journal.pcbi.1002168. [DOI] [PMC free article] [PubMed] [Google Scholar]
- 22.Feher VA, Durrant JD, Van Wart AT, Amaro RE. Computational Approaches to Mapping Allosteric Pathways. Curr Opin Struct Biol. 2014;25:98–103. doi: 10.1016/j.sbi.2014.02.004. [DOI] [PMC free article] [PubMed] [Google Scholar]
- 23.Fenwick RB, Orellana L, Esteban-Martín S, Orozco M, Salvatella X. Correlated Motions Are a Fundamental Property of -Sheets. Nat Commun. 2014;5:4070. doi: 10.1038/ncomms5070. [DOI] [PubMed] [Google Scholar]
- 24.Cui Q, Karplus M. Allostery and Cooperativity Revisited. Protein Sci. 2008;17(8):1295–1307. doi: 10.1110/ps.03259908. [DOI] [PMC free article] [PubMed] [Google Scholar]
- 25.Elber R. Simulations of Allosteric Transitions. Curr Opin Struct Biol. 2011;21(2):167–172. doi: 10.1016/j.sbi.2011.01.012. [DOI] [PubMed] [Google Scholar]
- 26.Van Wart AT, Durrant J, Votapka L, Amaro RE. Weighted Implementation of Suboptimal Paths (WISP): an Optimized Algorithm and Tool for Dynamical Network Analysis. J Chem Theory Comput. 2014;10(2):511–517. doi: 10.1021/ct4008603. [DOI] [PMC free article] [PubMed] [Google Scholar]
- 27.Malmstrom RD, Kornev AP, Taylor SS, Amaro RE. Allostery Through the Computational Microscope: cAMP Activation of a Canonical Signalling Domain. Nat Commun. 2015;6:7588. doi: 10.1038/ncomms8588. [DOI] [PMC free article] [PubMed] [Google Scholar]
- 28.Chu J-W, Voth GA. Allostery of Actin Filaments: Molecular Dynamics Simulations and Coarse-Grained Analysis. Proc Natl Acad Sci USA. 2005;102(37):13111–13116. doi: 10.1073/pnas.0503732102. [DOI] [PMC free article] [PubMed] [Google Scholar]
- 29.Ravindranathan KP, Gallicchio E, Levy RM. Conformational Equilibria and Free Energy Profiles for the Allosteric Transition of the Ribose-Binding Protein. J Mol Biol. 2005;353(1):196–210. doi: 10.1016/j.jmb.2005.08.009. [DOI] [PubMed] [Google Scholar]
- 30.Weinkam P, Chen YC, Pons J, Sali A. Impact of Mutations on the Allosteric Conformational Equilibrium. J Mol Biol. 2013;425(3):647–661. doi: 10.1016/j.jmb.2012.11.041. [DOI] [PMC free article] [PubMed] [Google Scholar]
- 31.Liu Y, Bahar I. Sequence Evolution Correlates with Structural Dynamics. Mol Biol Evol. 2012;29(9):2253–2263. doi: 10.1093/molbev/mss097. [DOI] [PMC free article] [PubMed] [Google Scholar]
- 32.Zhang L, Bouguet-Bonnet S, Buck M. Combining NMR and Molecular Dynamics Studies for Insights Into the Allostery of Small GTPase-Protein Interactions. Methods Mol Biol. 2012;796:235–259. doi: 10.1007/978-1-61779-334-9_13. [DOI] [PMC free article] [PubMed] [Google Scholar]
- 33.Kern D, Zuiderweg ERP. The Role of Dynamics in Allosteric Regulation. Curr Opin Struct Biol. 2003;13(6):748–757. doi: 10.1016/j.sbi.2003.10.008. [DOI] [PubMed] [Google Scholar]
- 34.Tzeng S-R, Kalodimos CG. Protein Dynamics and Allostery: an NMR View. Curr Opin Struct Biol. 2011;21(1):62–67. doi: 10.1016/j.sbi.2010.10.007. [DOI] [PubMed] [Google Scholar]
- 35.Hilser VJ, Thompson EB. Intrinsic Disorder as a Mechanism to Optimize Allosteric Coupling in Proteins. Proc Natl Acad Sci USA. 2007;104(20):8311–8315. doi: 10.1073/pnas.0700329104. [DOI] [PMC free article] [PubMed] [Google Scholar]
- 36.Burger VM, Nolasco DO, Stultz CM. Expanding the Range of Protein Function at the Far End of the Order-Structure Continuum. J Biol Chem. 2016;291(13):6706–6713. doi: 10.1074/jbc.R115.692590. [DOI] [PMC free article] [PubMed] [Google Scholar]
- 37.Haliloglu T, Bahar I. Adaptability of Protein Structures to Enable Functional Interactions and Evolutionary Implications. Curr Opin Struct Biol. 2015;35:17–23. doi: 10.1016/j.sbi.2015.07.007. [DOI] [PMC free article] [PubMed] [Google Scholar]
- 38.Henzler-Wildman K, Kern D. Dynamic Personalities of Proteins. Nature. 2007;450(7172):964–972. doi: 10.1038/nature06522. [DOI] [PubMed] [Google Scholar]
- 39.Hilser VJ, Wrabl JO, Motlagh HN. Structural and Energetic Basis of Allostery. Annu Rev Biophys. 2012;41(1):585–609. doi: 10.1146/annurev-biophys-050511-102319. [DOI] [PMC free article] [PubMed] [Google Scholar]
- 40.Cooper A, Dryden DT. Allostery Without Conformational Change. a Plausible Model. Eur Biophys J. 1984;11(2):103–109. doi: 10.1007/BF00276625. [DOI] [PubMed] [Google Scholar]
- 41.Wand AJ. The Dark Energy of Proteins Comes to Light: Conformational Entropy and Its Role in Protein Function Revealed by NMR Relaxation. Curr Opin Struct Biol. 2013;23(1):75–81. doi: 10.1016/j.sbi.2012.11.005. [DOI] [PMC free article] [PubMed] [Google Scholar]
- 42.Popovych N, Sun S, Ebright RH, Kalodimos CG. Dynamically Driven Protein Allostery. Nat Struct Mol Biol. 2006;13(9):831–838. doi: 10.1038/nsmb1132. [DOI] [PMC free article] [PubMed] [Google Scholar]
- 43.Jakob U, Kriwacki R, Uversky VN. Conditionally and Transiently Disordered Proteins: Awakening Cryptic Disorder to Regulate Protein Function. Chem Rev. 2014;114(13):6779–6805. doi: 10.1021/cr400459c. [DOI] [PMC free article] [PubMed] [Google Scholar]
- 44.Harman JG. Allosteric Regulation of the cAMP Receptor Protein. Biochim Biophys Acta. 2001;1547(1):1–17. doi: 10.1016/s0167-4838(01)00187-x. [DOI] [PubMed] [Google Scholar]
- 45.Heyduk T, Lee JC. Escherichia Coli cAMP Receptor Protein: Evidence for Three Protein Conformational States with Different Promoter Binding Affinities. Biochemistry. 1989;28(17):6914–6924. doi: 10.1021/bi00443a021. [DOI] [PubMed] [Google Scholar]
- 46.Schultz SC, Shields GC, Steitz TA. Crystal Structure of a CAP-DNA Complex: the DNA Is Bent by 90 Degrees. Science. 1991;253(5023):1001–1007. doi: 10.1126/science.1653449. [DOI] [PubMed] [Google Scholar]
- 47.Seok S-H, Im H, Won H-S, Seo M-D, Lee Y-S, Yoon H-J, Cha M-J, Park J-Y, Lee B-J. Structures of Inactive CRP Species Reveal the Atomic Details of the Allosteric Transition That Discriminates Cyclic Nucleotide Second Messengers. Acta Crystallogr D Biol Crystallogr. 2014;70(Pt 6):1726–1742. doi: 10.1107/S139900471400724X. [DOI] [PubMed] [Google Scholar]
- 48.Popovych N, Tzeng S-R, Tonelli M, Ebright RH, Kalodimos CG. Structural Basis for cAMP-Mediated Allosteric Control of the Catabolite Activator Protein. Proc Natl Acad Sci USA. 2009;106(17):6927–6932. doi: 10.1073/pnas.0900595106. [DOI] [PMC free article] [PubMed] [Google Scholar]
- 49.Tzeng S-R, Kalodimos CG. Dynamic Activation of an Allosteric Regulatory Protein. Nature. 2009;462(7271):368–372. doi: 10.1038/nature08560. [DOI] [PubMed] [Google Scholar]
- 50.Tzeng S-R, Kalodimos CG. Protein Activity Regulation by Conformational Entropy. Nature. 2012;488(7410):236–240. doi: 10.1038/nature11271. [DOI] [PubMed] [Google Scholar]
- 51.Hilser VJ, Dowdy D, Oas T, Freire E. The Structural Distribution of Cooperative Interactions in Proteins: Analysis of the Native State Ensemble. Proc Natl Acad Sci USA. 1998;95:9903–9908. doi: 10.1073/pnas.95.17.9903. [DOI] [PMC free article] [PubMed] [Google Scholar]
- 52.Hilser VJ, Freire E. Structure-Based Calculation of the Equilibrium Folding Pathway of Proteins. Correlation with Hydrogen Exchange Protection Factors. J Mol Biol. 1996;262(5):756–772. doi: 10.1006/jmbi.1996.0550. [DOI] [PubMed] [Google Scholar]
- 53.Marcos E, Crehuet R, Bahar I. Changes in Dynamics Upon Oligomerization Regulate Substrate Binding and Allostery in Amino Acid Kinase Family Members. PLoS Comput Biol. 2011;7(9):e1002201. doi: 10.1371/journal.pcbi.1002201. [DOI] [PMC free article] [PubMed] [Google Scholar]
- 54.Lockless SW, Ranganathan R. Evolutionarily Conserved Pathways of Energetic Connectivity in Protein Families. Science. 1999;286(5438):295–299. doi: 10.1126/science.286.5438.295. [DOI] [PubMed] [Google Scholar]
- 55.Süel GM, Lockless SW, Wall MA, Ranganathan R. Evolutionarily Conserved Networks of Residues Mediate Allosteric Communication in Proteins. Nat Struct Mol Biol. 2003;10:232. doi: 10.1038/nsb881. [DOI] [PubMed] [Google Scholar]
- 56.Lin MM. Timing Correlations in Proteins Predict Functional Modules and Dynamic Allostery. J Am Chem Soc. 2016;138(15):5036–5043. doi: 10.1021/jacs.5b08814. [DOI] [PubMed] [Google Scholar]
- 57.Ediger MD. Spatially Heterogeneous Dynamics in Supercooled Liquids. Annu Rev Phys Chem. 2000;51(1):99–128. doi: 10.1146/annurev.physchem.51.1.99. [DOI] [PubMed] [Google Scholar]
- 58.Glotzer SC. Spatially Heterogeneous Dynamics in Liquids: Insights From Simulation. J Non-Cryst Solids. 2000;274(1–3):342–355. [Google Scholar]
- 59.Richert R. Heterogeneous Dynamics in Liquids: Fluctuations in Space and Time. J Phys Condens Matter. 2002;14(23):R703–R738. [Google Scholar]
- 60.Merolle M, Garrahan JP, Chandler D. Space-Time Thermodynamics of the Glass Transition. Proc Natl Acad Sci USA. 2005;102(31):10837–10840. doi: 10.1073/pnas.0504820102. [DOI] [PMC free article] [PubMed] [Google Scholar]
- 61.Hedges LO, Maibaum L, Chandler D, Garrahan JP. Decoupling of Exchange and Persistence Times in Atomistic Models of Glass Formers. J Chem Phys. 2007;127(21):211101. doi: 10.1063/1.2803062. [DOI] [PubMed] [Google Scholar]
- 62.Keys AS, Hedges LO, Garrahan JP, Glotzer SC, Chandler D. Excitations Are Localized and Relaxation Is Hierarchical in Glass-Forming Liquids. Phys Rev X. 2011;1(2):021013. [Google Scholar]
- 63.Hart KM, Ho CMW, Dutta S, Gross ML, Bowman GR. Modelling Proteins' Hidden Conformations to Predict Antibiotic Resistance. Nat Commun. 2016;7:12965. doi: 10.1038/ncomms12965. [DOI] [PMC free article] [PubMed] [Google Scholar]
- 64.Jorgensen WL, Chandrasekhar J, Madura JD, Impey RW, Klein ML. Comparison of Simple Potential Functions for Simulating Liquid Water. J Chem Phys. 1983;79(2):926. [Google Scholar]
- 65.DeLano WL. The PyMOL Molecular Graphics System. Schrödinger; 2010. [Google Scholar]
- 66.van der Spoel D, Lindahl E, Hess B, Groenhof G, Mark AE, Berendsen HJC. GROMACS: Fast, Flexible, and Free. J Comput Chem. 2005;26(16):1701–1718. doi: 10.1002/jcc.20291. [DOI] [PubMed] [Google Scholar]
- 67.Duan Y, Wu C, Chowdhury S, Lee MC, Xiong G, Zhang W, Yang R, Cieplak P, Luo R, Lee T, Caldwell J, Wang J, Kollman P. A Point-Charge Force Field for Molecular Mechanics Simulations of Proteins Based on Condensed-Phase Quantum Mechanical Calculations. J Comput Chem. 2003;24(16):1999–2012. doi: 10.1002/jcc.10349. [DOI] [PubMed] [Google Scholar]
- 68.Bowman GR, Voelz VA, Pande VS. Taming the Complexity of Protein Folding. Curr Opin Struct Biol. 2011;21(1):4–11. doi: 10.1016/j.sbi.2010.10.006. [DOI] [PMC free article] [PubMed] [Google Scholar]
- 69.Bowman GR, Bolin ER, Hart KM, Maguire BC, Marqusee S. Discovery of Multiple Hidden Allosteric Sites by Combining Markov State Models and Experiments. Proc Natl Acad Sci USA. 2015;112(9):2734–2739. doi: 10.1073/pnas.1417811112. [DOI] [PMC free article] [PubMed] [Google Scholar]
- 70.Bowman GR. Accurately Modeling Nanosecond Protein Dynamics Requires at Least Microseconds of Simulation. J Comput Chem. 2016;37(6):558–566. doi: 10.1002/jcc.23973. [DOI] [PubMed] [Google Scholar]
- 71.McGibbon RT, Beauchamp KA, Harrigan MP, Klein C, Swails JM, Hernández CX, Schwantes CR, Wang L-P, Lane TJ, Pande VS. MDTraj: a Modern Open Library for the Analysis of Molecular Dynamics Trajectories. Biophys J. 2015;109(8):1528–1532. doi: 10.1016/j.bpj.2015.08.015. [DOI] [PMC free article] [PubMed] [Google Scholar]
- 72.Hummer G. From Transition Paths to Transition States and Rate Coefficients. J Chem Phys. 2004;120(2):516–523. doi: 10.1063/1.1630572. [DOI] [PubMed] [Google Scholar]
- 73.Bolhuis PG, Chandler D, Dellago C, Geissler PL. Transition Path Sampling: Throwing Ropes Over Rough Mountain Passes, in the Dark. Annu Rev Phys Chem. 2002;53(1):291–318. doi: 10.1146/annurev.physchem.53.082301.113146. [DOI] [PubMed] [Google Scholar]
- 74.Buchete N-V, Hummer G. Coarse Master Equations for Peptide Folding Dynamics. J Phys Chem B. 2008;112(19):6057–6069. doi: 10.1021/jp0761665. [DOI] [PubMed] [Google Scholar]
- 75.Schütte C, Noé F, Lu J, Sarich M, Vanden-Eijnden E. Markov State Models Based on Milestoning. J Chem Phys. 2011;134(20):204105. doi: 10.1063/1.3590108. [DOI] [PubMed] [Google Scholar]
- 76.Jung Y, Garrahan JP, Chandler D. Dynamical Exchanges in Facilitated Models of Supercooled Liquids. J Chem Phys. 2005;123(8):084509. doi: 10.1063/1.2001629. [DOI] [PubMed] [Google Scholar]
- 77.Kass RE, Raftery AE. Bayes Factors. J Am Stat Assoc. 1995;90(430):773–795. [Google Scholar]
- 78.Witten IH, Frank E. Data Mining. 2. Elsevier; San Francisco, CA: 2005. [Google Scholar]
- 79.Fraser J, van den Bedem H, Samelson AJ, Lang PT, Holton JM, Echols N, Alber T. Accessing Protein Conformational Ensembles Using Room-Temperature X-Ray Crystallography. Proc Natl Acad Sci USA. 2011;108(39):16247–16252. doi: 10.1073/pnas.1111325108. [DOI] [PMC free article] [PubMed] [Google Scholar]
- 80.Bowman GR, Geissler PL. Extensive Conformational Heterogeneity Within Protein Cores. J Phys Chem B. 2014;118(24):6417–6423. doi: 10.1021/jp4105823. [DOI] [PMC free article] [PubMed] [Google Scholar]
- 81.Dai J, Lin S-H, Kemmis C, Chin AJ, Lee JC. Interplay Between Site-Specific Mutations and Cyclic Nucleotides in Modulating DNA Recognition by Escherichia Coli Cyclic AMP Receptor Protein. Biochemistry. 2004;43(28):8901–8910. doi: 10.1021/bi0499359. [DOI] [PubMed] [Google Scholar]
- 82.Aiba H, Nakamura T, Mitani H, Mori H. Mutations That Alter the Allosteric Nature of cAMP Receptor Protein of Escherichia Coli. EMBO J. 1985;4(12):3329–3332. doi: 10.1002/j.1460-2075.1985.tb04084.x. [DOI] [PMC free article] [PubMed] [Google Scholar]
- 83.Karplus M, McCammon JA. Dynamics of Proteins: Elements and Function. Annu Rev Biochem. 1983;53:263–300. doi: 10.1146/annurev.bi.52.070183.001403. [DOI] [PubMed] [Google Scholar]
- 84.Brooks CL, Karplus M, Pettitt BM. Adv Chem Phys. Vol. 71 Wiley; New York, NY: 1988. Proteins: a Theoretical Perspective of Dynamics, Structure, and Thermodynamics. [Google Scholar]
- 85.DePristo MA, de Bakker PIW, Blundell TL. Heterogeneity and Inaccuracy in Protein Structures Solved by X-Ray Crystallography. Structure. 2004;12(5):831–838. doi: 10.1016/j.str.2004.02.031. [DOI] [PubMed] [Google Scholar]
- 86.Wand AJ, Urbauer JL, McEvoy RP, Bieber RJ. Internal Dynamics of Human Ubiquitin Revealed by 13C-Relaxation Studies of Randomly Fractionally Labeled Protein. Biochemistry. 1996;35(19):6116–6125. doi: 10.1021/bi9530144. [DOI] [PubMed] [Google Scholar]
- 87.Lindorff-Larsen K, Best RB, DePristo MA, Dobson CM, Vendruscolo M. Simultaneous Determination of Protein Structure and Dynamics. Nature. 2005;433(7022):128–132. doi: 10.1038/nature03199. [DOI] [PubMed] [Google Scholar]
- 88.Igumenova TI, Frederick KK, Wand AJ. Characterization of the Fast Dynamics of Protein Amino Acid Side Chains Using NMR Relaxation in Solution. Chem Rev. 2006;106(5):1672–1699. doi: 10.1021/cr040422h. [DOI] [PMC free article] [PubMed] [Google Scholar]
- 89.DuBay KH, Geissler PL. Calculation of Proteins' Total Side-Chain Torsional Entropy and Its Influence on Protein-Ligand Interactions. J Mol Biol. 2009;391(2):484–497. doi: 10.1016/j.jmb.2009.05.068. [DOI] [PubMed] [Google Scholar]
Associated Data
This section collects any data citations, data availability statements, or supplementary materials included in this article.