

Summary
Diversity in the genetic lesions that cause cancer is extreme. In consequence, a pressing challenge is the development of drugs that target patient-specific disease mechanisms. To address this challenge, we employed a chemistry-first discovery paradigm for de-novo identification of druggable targets linked to robust patient selection hypotheses. In particular, a 200,000 compound diversity-oriented chemical library was profiled across a heavily annotated test-bed of >100 cellular models representative of the diverse and characteristic somatic lesions for lung cancer. This approach led to the delineation of 171 chemical-genetic associations, shedding light on the targetability of mechanistic vulnerabilities corresponding to a range of oncogenotypes present in patient populations lacking effective therapy. Chemically addressable addictions to ciliogenesis in TTC21B-mutants and GLUT8-dependent serine biosynthesis in KRAS/KEAP1 double mutants are prominent examples. These observations indicate a wealth of actionable opportunities within the complex molecular etiology of cancer.
ITI
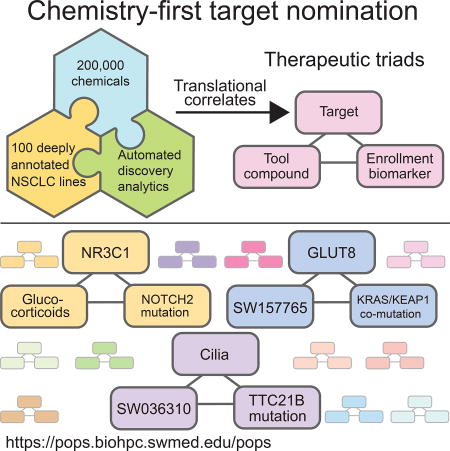
Application of a chemistry-first approach matches chemicals with targetable, diverse genetic lesions and cancer promoting mechanisms in human lung cancer, providing guidance for development of personalized cancer treatment.
Introduction
The future of cancer treatment lies in a personalization of medicine, where each patient’s treatment regime is tailored to the genetic diversity of their tumors. Accomplishing this requires a “therapeutic triad”, where appropriate context-specific intervention targets, tightly linked to response biomarkers, are coupled to agents to engage these targets. To date, this has been best realized in disease harboring a druggable oncogenic driver. However, many of the more prevalent and most lethal cancers do not present with this opportunity. Non-small cell lung cancer (NSCLC) is a leading cause of cancer related death in the United States and is a highly heterogeneous disease. A clinically relevant contributor to this disease heterogeneity is the diversity of molecular etiology associated with individual NSCLC tumors. Specifically, lung squamous carcinoma (LUSC) and lung adenocarcinoma (LUAD) represent the second and the third most highly mutated tissue subtypes in The Cancer Genome Atlas (TCGA), with a mean non-synonymous mutation burden of ~250 mutations/ tumor. This greatly increases the challenge of understanding the molecular drivers underpinning a patient’s disease; knowledge that is usually the starting point for hypothesis driven design of new therapeutic approaches. However, a large mutational burden also increases the probability that NSCLCs will contain vulnerabilities, not found in normal cells, which might be exploited therapeutically. The problem is how to identify and engage such vulnerabilities. Here, we employ a chemistry-driven de novo discovery strategy tailored for coincident delivery of preclinical therapeutic triads.
Results
A tiered screening and analytic strategy for chemistry-first target discovery
To generate an experimental testbed reflective of the molecular and mechanistic heterogeneity of lung cancer, we assembled a panel of 96 NSCLC (mainly LUAD) cell lines and 4 immortalized human bronchial epithelial cell lines (HBECs) (Data File S1). Reasonable concordance of the phenotypic variation of this panel with human tumors was evaluated using legacy whole-genome transcript array data (Figure 1A, S1A). High-resolution molecular characterization was then carried out by WES (Data File S2), RNAseq (Data File S3), tiled SNP arrays (Data File S4), RPPA (Data File S5), and heavy carbon tracing from glucose and glutamine into selected metabolites. For 34 NCLC cell lines, matching B-cell lines from the same patients were sequenced, allowing for robust discrimination of somatic versus germline variation (Data File S2). For the remaining cell lines, we developed a computational pipeline leveraging somatic alleles detected in the matched pairs and public datasets to filter probable germline variation (STAR methods, Figure 1B, S1B–C). We noted high concordance between transcript profiles from RNAseq and hybridization arrays that were performed years apart, providing confidence in the accuracy and stability of cell line provenance (Figure S1D).
Figure 1. Genomic characterization and chemical sensitivities of NSCLC cell line panel.

(A) p-values (Pearson) comparing tumors (MDACC=orange; TCGA=purple) and cell lines colored by source
(B) Number of mutations called in the matched (red) and unmatched (blue) subsets post-filtering
(C) NSCLC sensitivity (ED50) to POPS rank ordered by row. Red dashes = ‘cherry-picked’
(D) APC clustering by similarity of POPs ED50 responses. Nodes are colored according to cluster membership
(E) APC clustering by similarity of POPs ED50 responses (as in Figure 1D). Nodes are colored according to cluster membership defined by RNAseq based APC (Figure S1E)
(F) APC clustering across all datasets. Cell lines are ordered according to cluster membership in chemical APC. Each cell line is colored according to cluster membership in the indicated datasets (Figure S1M–P). Cell lines absent from a dataset are colored in white
(G–H) Predictive mRNA expression signatures specifying (G) crizotinib and (H) erlotinib sensitivity. Rank-ordered sensitivity values are indicated as heatmap (top row) with corresponding features plotted below.
*all experiments performed in triplicate, unless otherwise indicated. Values are means. Error bars plotted as ± 1 SD. * p<.05; ** p<.01
A deterministic clustering method, affinity propagation clustering (APC), (Frey and Dueck, 2007) produced more than 15 distinct phenotypic groups as defined by gene expression profiles (Figure S1E). Based on this, we devised a tiered high-throughput screening strategy to screen 202,103 chemicals across 12 cell lines representing overall phenotypic diversity of the panel (Figure S1F). Filters were implemented at each tier to enrich for small molecules that could selectively target the phenotypic variation across the NSCLC cell line panel (Figure S1F–I, STAR methods). This culminated in 208 compounds, and an additional 14 chemicals with known mechanism of action, which were tested for efficacy across the complete panel of 100 NSCLC cell lines at 12 doses in triplicate in two independent runs. This set was evaluated for potency and selectivity using both area under the dose response curve (AUC) and the effective dose required to reduce activity 50% (ED50). In both instances, low values indicate sensitivity. While we observed statistically significant correlations between AUC and ED50 values, there was a subset of chemicals for which AUC was uncoupled from ED50 values (Figure S1J). ED50 values produce a large dynamic range of chemical response values corresponding to the activity inflection point while AUC values reflect magnitude of response. As both metrics provide complementary information, we employed AUC and ED50 values in all subsequent association analyses. (Data File S6). Furthermore we examined potential correlations of chemical sensitivities (AUC and ED50 metrics) with cell doubling times (Data File S6) as differences in proliferation rates can make confounding contributions to chemical sensitivity profiles within cell panels (Hafner et al., 2017). APC of the final collection of compounds, based on activity across the cell line panel, produced at least 38 distinct clusters (Figure S1K). A ranking of this collection, which we refer to as a “precision oncology probe set (POPS)”, by potency and activity revealed robust selectivity profiles (median fold changes from 2–90,000, Figure 1C, Figure S1L).
To begin to pursue chemical/genetic associations, we first parsed the cell line panel based on similarity of chemical response (Figure 1D), and each quantitative molecular feature set (Figures S1M–P). We overlaid annotations from feature-specific clusters onto those derived from chemical sensitivity, observing unimpressive correspondence with any feature set (Figure 1E–F, S1Q–T). This suggests global molecular diversity cannot account for the observed selective chemical responses. This observation, together with similar previous observations from our group and others, led us to pursue sparse feature selection for finding robust chemical/genetic associations (Eskiocak et al., 2017; Garnett et al., 2012; Iorio et al., 2016; Kim et al., 2013). For this, we employed a combination of regularized machine learning (elastic net) and probability-based metrics (scanning KS) to isolate features from each molecular dataset predicting sensitivity to each chemical. As compelling proof of concept, these methods linked high ALK expression as predicting sensitivity to the ALK inhibitor crizotinib (Figure 1G) and EGFR mutations and amplifications to predict sensitivity to the EGFR inhibitor erlotinib (Figure 1H). As expected, the EGFR mutant, erlotinib-sensitive cell lines have mutations in the kinase domain known to affect EGFR function. Notably, among the EGFR mutant non-responders, 2 cell lines harbored preexisting T790M mutations (Figure S1U), a known cell-autonomous adaptive mechanism promoting inhibitor resistance not detected by related chemical profiling efforts (Figure S1V). Together, these observations indicate that clinically relevant associations are discoverable within this experimental schema.
High-throughput discovery of pharmacological liabilities among chemicals with robust selective sensitivity profiles
From the elastic net feature discovery approach, we noted a cohort of chemicals (12/221) for which sharp and selective sensitivity profiles (median deltas of greater than 60-fold) were associated with expression of 1 of 9 known drug metabolism enzymes (Figure 2A, S2A). The compounds are structurally diverse and target distinct groups of cell lines (Figure S2B–D), prompting the attractive possibility that pharmacological liabilities could be detected and flagged early in chemistry-first target discovery screening cascades (i.e. for these chemicals, selective sensitivity may be due to selective production of a toxic metabolite). To test this, we first assessed chemical stability of each compound in groups of sensitive and resistant cell lines using LC/MS based approaches (Figure 2B–E, S2E–J). 6 compounds displayed accelerated metabolism, evident by loss of parent compound, selectively in the sensitive cell lines (Figure 2B–E, Figure S2E–F). We further examined SW157765 as a member of a cluster of compounds associated with activity in cytochrome p450 family member, CYP4F11, expressing cells. Notably, the CYP4F family inhibitor, HET0016, reversed metabolism of the compound (Figure 2F), and CRISPR-mediated knockout of CYP4F11 reversed toxicity in otherwise sensitive cell lines (Figure 2G, S2K–M). We next predicted the activity of SW001286 and SW126788, within a panel of 26 previously untested NSCLC cells, using the weighted elastic net models. Expression of the carboxylesterases CES1 and CES1P1 was cleanly predictive of SW126788 sensitivity in this test set (Figure S2N). However, prediction accuracy of SW001286 sensitivities was lower due to 4 unanticipated non-responders (Figure S2O). Like SW157756, HET0016 rescued SW001286 toxicity in two sensitive cell lines (Figure 2H). Thus, the metabolic products of SW001286 in CYP4F11-expressing cells may not be behaving as a general toxin(s), but rather may be targeting a selective vulnerability in sensitive cell lines. In line with this possibility, a manual examination of the KS test output indicated mutations in LKB1 as an additional marker that, together with CYP4F11 expression, better stratify response (Figure 2I, S2P). In response to metabolic stress, LKB1 activates AMPK to suppress anabolic and activate catabolic pathways to maintain energy and redox homeostasis via inhibition of ACC1 (Jeon et al., 2012). A mechanistic connection between SW001286 sensitivity and loss-of-function LKB1 mutations was supported by the observation that depletion of ACC1 (Figure 2J), or addition of a ROS scavenger (Figure S2Q), partially rescued SW001286-sensitivity.
Figure 2. Detecting “prodrugs” and drug efflux substrates.

(A) Elastic net modeling associates mRNA expression of drug metabolism enzymes with sensitivity to 8 chemicals. Rank-ordered ED50 values are indicated as heatmap (SWxxxxxx; top row). Corresponding log2 FPKM values are plotted underneath
(B–F) Percent remaining (ln scale) of (B) SW126788 (C) SW103675 (D) SW027951 (E) SW157765 and (F) SW157765 co-treated with HET-0016 (100 nM) is plotted as a function of chemical treatment time (blue = sensitive cell line; orange = resistant cell line). Values are normalized to control treatment
(G) SW157765 dose response in H460 cells with and without deletion of CYP411
(H) Viability of cells treated with either DMSO, SW001286 (5µM) or co-treated with SW001286 (5µM) and HET-0016 (100nM) for 72 hrs
(I) CDF plot comparing SW001286 sensitivity (ED50) of cell lines with high expression of CYP4F11 and LKB1 mutations (red) to wild-type cell lines (grey)
(J) siRNA depletion of ACC1 or a non-targeting control (NC) followed by 72 hr SW001286 treatment (HCC44= 5µM; H2122=1µM).
(K) THZ1 ED50 plotted as a function of ABCG2 mRNA expression (log2 FPKM). Pearson R=.64, p=4.6E-10
(L) siRNA depletion of ABCG2 or non-targeting control (NC) followed by 72 hrs THZ1 treatment (50nM) in H157 cells.
Chemicals correlating with expression of CYP4F11 represent the largest observed “prodrug” class (Figure 2A). The P450 class of enzymes, of which CYP4F11 is a member, can oxidize a variety of substrates; the scope of which has not been fully characterized but some chemical transformations tend to recur thematically within the class. One such transformation, the demethylation of aryl methoxy groups, is predicted to occur with two of the proposed pro-drug chemicals (Figure S2R). The remaining 3 compounds share a common furan-substituted alkene functional group that can likely be engaged by xenometabolic enzymes. Furthermore, the internal alkene is a reasonable site for enzymatic oxidation and protein conjugation. Consistent with the possibility that protein/small molecule conjugation might be at play, 72 hour ED50’s were similar following either transient or sustained exposure to SW157765 (Figure S2S). In an effort to identify structural components of the molecule required for biological activity, we designed and synthesized a series of analogs of SW157765, of which analog 500-01 (Figure S2T) was found to be completely inert when tested for viability in a NSCLC cell line panel (Figure S2U). Interestingly, 500-01 differs from the parent molecule in only the hydrogenation of its internal alkene, suggesting SW157765 requires this functional group for biological activity. Considering that alkenes and other sites of unsaturation can be transformed into points of conjugation with larger biomolecules, the discovery of SW157765’s active moiety converged with our hypothesis that the molecule can behave as a covalent modifier. We next sought to identify labile metabolites of SW157765 that might be susceptible to protein conjugation, with specific attention given to metabolite species whose modifications appeared at the double bond. Mass spectrometry-based evaluation of metabolites produced by H2122 cells treated with either SW157765 or 500-1 for eight hours identified an oxidized metabolite, unique to SW157765 (Figures S2V–S2Y), potentially containing an epoxide at the site of the internal alkene (Figure S2Z). Considering that strained epoxide ring systems are subject to facile protein adduction, we propose this epoxide metabolite is the active covalent ligand. Efforts to chemically synthesize the metabolite revealed it to be too unstable to produce in quantities needed for in vitro testing, perhaps underpinning the semi-transient nature and robust reactivity profile of the molecule in a biological setting.
As a final example of high-throughput detection of pharmacological liabilities, we noted that high expression of the multi-drug resistance transporter, ABCG2, predicts resistance to the CDK7 inhibitor THZ1 (Figure 2K). RNAi-mediated depletion of ABCG2 sensitized resistant cells to THZ1, suggesting it is an ABCG2 substrate (Figure 2L).
Notch2 mutations predict cellular sensitivity to glucocorticoids
From within the Prestwick library, we noted a cluster of 5 glucocorticoid (GC) receptor agonists with highly correlated selective activity profiles and a strong association with mutations in Notch2 (Figure 3 A,B). Notch2 has been implicated as a tumor suppressor in some settings. For example, Notch2 and Notch1 expression are oppositely correlated with prognosis in colorectal cancer, where low expression of Notch2 and high expression of Notch1 is predictive of poor patient outcome (Chu et al., 2011). Additionally, in experimental models of lung cancer, Notch2 loss, but not Notch1 loss, promotes aggressive disease (Baumgart et al., 2015). The “dispersed” pattern of Notch2 alleles detected among the NSCLC cell lines is reminiscent of loss-of-function alterations typically associated with a tumor suppressor (Figure S3A) and the glucocorticoid-sensitive cell lines harboring these mutations display downregulation of Notch pathway genes as compared to wild-type counterparts. (Figure 3C).
Figure 3. Glucocorticoid sensitivity is predicted by Notch2 mutations.

(A) 2-way hierarchical cluster of 5 glucocorticoid AUC values across 100 NSCLC cell lines
(B) Rank-ordered ED50 values for methylprednisone are indicated as heatmap (top row). Mutation status for NOTCH2 is shown below
(C) CDF plot comparing ranked mRNA expression of genes in the indicated gene set (z-scores) in GC sensitive (blue) and resistant cell lines (orange; KS-test p=.003)
(D) siRNA depletion of NR3C1 or a non-targeting control (NC) followed by 72 hrs hydrocortisone treatment (3µM) in H2073 cells.
(E) Log2 mRNA expression of NR3C1 in GC responsive and non-responsive cell lines (illumina BeadArray)
(F) Changes in NR3C1 mRNA 72 hrs post-GC treatment (5 µM) in 2 sensitive and resistant cell lines, normalized to untreated cells
(G) Dose response curves of cell lines grown in 3D spheroid models in response to methylprednisone. Cell lines that were sensitive (blue) or resistant (orange) to GC’s in standard 2-D cell-culture were evaluated in 3D. (n=8/dose)
(H–I) Changes in (H) HES1 and (I) Cyclin D1 protein expression 72 hrs post-GC treatment (5 µM) in sensitive and resistant cells
(J) Flow cytometric histograms for H1993 cells transfected with HES1-pCMV-AC-GFP and treated 72 hrs post-GC treatment (5 µM). The propidium iodide signal of cells gated by GFP fluorescence is graphed. Nocodazole (100 ng/mL) was added 48 hrs post-treatment to force accumulation of proliferating cells in G2/M over the course of the next 24 hrs
Depletion of the ubiquitously expressed GC receptor, NR3C1, was sufficient to reduce cellular sensitivity to GC exposure, suggesting the selective toxicity phenotype is receptor-dependent (Figure 3D). Intriguingly, several studies have linked GC response to Notch pathway activity. For example, activation of Notch signaling is associated with GC resistance in T-ALL (Inaba and Pui, 2010) and gamma-secretase inhibitors, which block the activation of Notch, restore sensitivity to GC. Moreover, a mutually antagonistic relationship exists between Notch effector, HES1, and NR3C1, in which each represses transcription of the other (Real et al., 2009; Revollo et al., 2013). Consistent with these observations, we found significantly higher basal expression levels of NR3C1 mRNA in Notch2 mutant, GC responsive cell lines (Figure 3E). Transcription of NR3C1 itself is responsive to GC induction, and we observed significant induction of NR3C1 in response to GC stimulation in these cells (Figure 3F). These observations indicate that GC-responsive cells are primed to propagate an NR3C1 signal through a GC-dependent positive feedback amplification loop.
We found the selective efficacy of GC’s was preserved in 3D spheroid models of lung cancer (Figure 3G). Thus, we sought to understand the mechanism by which differential activity of Notch signaling may specify sensitivity to GCs. HES1 is a general transcriptional repressor which has been described to occupy the promoters of GC inducible genes and acts as a master negative regulator of GC response (Revollo et al., 2013). Similarly, we found that GC exposure selectively reduced cellular HES1 protein levels in GC-sensitive NSCLC cells (Figure 3H, S3C). GC exposure was cytostatic, resulting in a selective G1/S arrest (Figure S3D). GC’s suppress inflammation through transcriptional activation of anti-inflammatory genes and direct inhibition of nuclear factor-kB (NFKB) and activator protein 1(AP-1). A well-known target of both pathways is cyclin D1, which was selectively reduced in sensitive NSCLC cells exposed to GC (Figure 3I). Finally, stable overexpression of HES1 from a GC-independent CMV promoter was sufficient to rescue GC-induced cell cycle arrest (Figure 3J, S3E–F). We therefore suspect that Notch2 mutations, in NSCLC cells, result in reduced Notch signaling and higher basal NR3C1 expression, priming cells to respond to GC with G1 cell cycle arrest (Figure S3G). While GC therapy is not commonly used in therapeutic doses to treat patients with lung cancer, 5.9% of LUAD tumors and 5.1% of LUSC’s in the TCGA have mutations or deletions in Notch2, corresponding to thousands of patients a year that could be treated with a FDA approved therapy.
Ready detection of a biologically diverse array of chemical/genetic associations
To enrich for robust chemical/genetic associations that enable productive new target pursuit, we established a strict inclusion criteria threshold for automated reporting of predictive biomarker hypotheses from the elastic net (STAR methods). Receiver operator characteristics and odds ratios were calculated as confidence metrics. Finally, predicted responder population frequencies were evaluated using the TCGA LUAD cohort. To enable open access for community-based hypothesis testing, we integrated the final results, and all associated quantitative data, into a searchable web-based GUI (Data File S6) (http://pops.biohpc.swmed.edu).
From the output, we selected 26 predicted chemical/genetic associations to experimentally evaluate for a distributive assessment of reliability and biological diversity. The weighted elastic net models derived from the training set (100 cell line panel) were applied to a distinct panel of 33 previously untested NSCLC cell lines (Data File S1; test set). For 21 of the 26 chemicals, at least one cell line in the test set was predicted to be sensitive. 9 of these were validated by empirical testing (Figure 4A, S4B). In addition, 13 chemicals were selected for evaluation of conservation of selective activity in spheroid assays, 9 of which validated. (Figure 4B; S4A). 4 chemicals passing one or both criteria were selected for additional functional characterization (SW036310, SW151511, SW140154, SW208097).
Figure 4. Biological diversity among robust chemical/genetic associations.

(A) ED50 values of the testing set cell lines predicted to be sensitive (blue) and resistant (orange) to each indicated chemical. Dashes indicate class means. Red font indicates chemicals with successfully predicted selectivity profiles (KS-test p-values <.05)
(B) ED50 values of cell lines grown in 3D spheroid format in response to the indicated chemicals. Cell lines that were sensitive (blue) or resistant (orange) to each chemical in standard 2D cell-culture were evaluated. Dashes indicate class means. Chemicals for which 2D selectivity is preserved in 3D (KS-test p<.05) are highlighted in red
(C) CDF plot comparing SW036310 sensitivity (AUC) of TTC21B mutant (red) to wild-type cell lines (blue). (Scanning KS p<.0002)
(D) Dose response curves of cell lines grown in 3D spheroid models in response to SW036310. Cell lines that were sensitive (blue) or resistant (orange) to SW036310 in standard 2D cell-culture were evaluated (n=8/dose)
(E) SW036310 sensitivity (AUC) plotted as a function of Ciliobrevin sensitivity (AUC). Pearson R = .88; p=.0041
(F) SW140154 sensitivity (ED50) plotted as a function of SW151511 sensitivity (ED50). Pearson R=−.62, p= .00036
(G) Predictive mRNA expression signature specifies sensitivity to SW140154 and SW151511. Rank ordered ED50 values are indicated as a heatmap (top row). Log2 FPKM values are plotted below
(H) Cell line sensitivities outside the training set were predicted based on associated elastic net models of SW140154 and SW151511. Boxplot represents AUC values for each prediction class (Orange = predicted resistant, blue = predicted sensitive).
(I) SW151511 responsive cells show enrichment of KEGG TLR Signaling compared to SW140154 non-responsive cell lines. (GSEA ES = .39)
(J) Dose response curves of cell lines grown in 3D spheroid models in response to SW151511. Cell lines that were sensitive (blue) or resistant (orange) to SW151511 in standard 2-D cell-culture were evaluated. (n=8/dose)
(K) CDF plot comparing GSK-923295 sensitivity (ED50) of cell lines with co-occurring mutations in TP53 and KEAP1 (red) to wild-type (blue). (Scanning KS p<.0002)
(L) Dose-response curves for cell lines outside the training set predicted to be sensitive (blue) and resistant (orange) to GSK-923295
The automated scanning KS analysis indicated that mutations in TTC21B correspond to sensitivity to the benzothiazole-containing small molecule SW036310 (Figure 4C), in which selective efficacy was preserved in spheroid assays (Figure 4D). TTC21B (aka, IFIT139B) is the only known protein to act solely as a retrograde transport motor for primary cilia. Somatic mutations in TTC21B have not been characterized in the setting of cancer, however, loss of function TTC21B mutations upregulate cilia dependent processes in mice (Tran et al., 2008) and are causal mutations in human developmental diseases driven by primary cilia malfunction (ciliopathies) (Davis et al., 2011). Gain-of-function primary cilia growth and signaling occurs upon loss of TTC21B activity, including activation of sonic hedgehog, and potentially other processes known to be regulated by primary cilia, including NFKB, VHL, and TGF-β signaling pathways. Indeed, whole genome transcript profiles indicated that gene signatures associated with activation of these pathways were selectively enriched (Figure S4B) and primary cilia were selectively detectable (Figure S4C) in TTC21B mutant, SW036310-sensitive cell lines (Figure S4B). Given these associations, we suspect that SW036310 may perturb a target(s) associated with primary cilia biology that supports survival of TTC21B mutant cells. Consistently, SW036310 sensitivity almost perfectly correlated sensitivity to the cytoplasmic dynein inhibitor, ciliobrevin, known to disrupt primary cilia by perturbing anterograde trafficking to that organelle (Figure 4E).
From a distinct biological context, we examined two chemicals, with anti-correlated activity profiles (Figure 4F), corresponding to expression of positive and negative modulators of innate immune signaling (Figure 4G). Using the derived weighted sum elastic net model, we found SW140154 sensitivity was accurately predicted outside the training set by a combination of high expression of the negative regulator of Toll like receptor signaling (TLR) pathway, SARM1, and low expression of the cytokine receptor, IL18R1 (Figure 4H, S4D) while SW151511 sensitivity could be predicted by high expression of the positive regulator of the TLR pathway, PELI2 (Figure 4H, S4E). We compared cell lines on opposing ends of the sensitivity spectrum and noted that high expression of TLR pathway genes was associated with sensitivity to SW151511 and resistance to SW140154 (Figure 4I). Sensitivity to SW151511 (Figure 4B, 4J), but not SW140154 (Figure 4B, S4F), was recapitulated in spheroid culture models. We therefore selected SW151511 for examination of global gene expression responses to chemical challenge. 2 sensitive and 2 resistant cell lines were treated with SW151511 for 24 hours prior to transcript profiling. We found significant chemically-induced expression changes associated with the host defense response (Figure S4G). Notably, this signature was elevated above base-line upon compound exposure, suggesting amplification of a maladaptive innate-immune signaling program may represent a conditional vulnerability in cell lines response to SW151511.
Finally, low nanomolar sensitivity to SW208097 was predicted and validated to correspond to co-occuring mutations in TP53 and KEAP1 (Figure 4K,L). This is notable, as the molecule is a well-tolerated investigational drug (GSK923295) targeting the mitotic motor protein CENPE. GSK923295 has dose proportional pharmacokinetics in humans and a low number of grade 3/4 adverse events, however, responder populations have not been identified. Co-occurring TP53 and KEAP1 mutations are detected in 9.6% of LUAD in the TCGA, which extrapolates to ~17,000 patients/year potentially harboring GSK923295-responsive disease.
A chemically addressable vulnerability of KRAS/KEAP1 NSCLC cells to perturbation of SLC2A8
KRAS mutant lung cancers are common, aggressive, and difficult to manage in the clinic. Therefore, we chose this class for in-depth pursuit of tool compound/target/biomarker triads. We previously reported the overarching phenotypic diversity among KRAS mutant lung cancer cell lines is essentially equivalent to the global phenotypic variation found across all characterized NSCLC cell lines (Kim et al., 2016). Consistent with this, we noted KRAS mutant NSCLC lines distributed across the majority of APC similarity clusters, defined by RNAseq, within the larger NSCLC cell line panel (Figure 5A). This genomic mRNA expression diversity was mirrored by a diversity of sensitivity of KRAS mutant cell lines to the POPs collection (Figure 5B,C). However, automated scanning KS analyses returned 4 chemical associations with KRAS mutant subtypes that passed p-value thresholds (p<2E-4). These subtypes were defined by co-occurring mutations in KEAP1, NUP214, PTPRT, and TTC21B (Figure S5A, 5D). Among these, the association of KRAS/KEAP1 double mutant cell lines with sensitivity to SW157765 (Figure 5D) was verifiable in a test set of NSCLC lines distinct from the training set (Figure 5E) and selective efficacy was preserved in spheroid models of lung cancer (Figure 5F, S5B). KEAP1 is a major regulator of the NRF2 antioxidant response. Under normal physiological conditions, NRF2 is constantly ubiquitinated in the cytoplasm by the CUL3/KEAP1 E3 ligase/substrate adaptor complex. Upon stress, KEAP1 inactivation facilitates NRF2 nuclear translocation and consequent activation of the NRF2-dependent anti-oxidant and cytoprotective transcriptional responses. Deleterious mutations or deletions in KEAP1 are present in ~19% of LUAD’s and ~12% of LUSC’s corresponding to constitutive NRF2 activity. Co-occurring mutations in KEAP1 and KRAS are present in ~6% of LUADs (www.tcga.org); significantly more than expected by chance (p=.007), suggesting they are under positive selective pressure during disease development. There were, however, a few KEAP1 wild-type cell lines that were responsive to SW157765 (Figure 5G). These included the only cell line in the panel that harbors a KEAP1 homozygous deletion (Figure S5C) resulting in undetectable KEAP1 mRNA (Figure 5G). These also included cell lines (2/2) with amino acid substitutions in the degron domain of NRF2 (Figure 5G), corresponding to hotspot NRF2 mutations detected in LUAD tumors lacking functional KEAP1 degradation motifs producing constitutively activated variants (Figure S5D). We did not detect additional variants in known NRF2 pathway genes among the 8 remaining sensitive cell lines that were KRAS/KEAP1 wild type. However, these cell lines had a significant upregulation of an NRF2-dependent gene expression signature (p<2.2E-16) (Figure S5E), and can be predicted to have high NRF2 pathway activity despite the absence of discernable NRF2-related lesions. High expression of this NRF2 gene signature (Figure S5F) was predictive of sensitivity to SW157765 when applied to cell lines outside the training set (Figure 5H).
Figure 5. Chemical response associations among KRAS mutant NSCLC lines.

(A–B) Cell lines clustered (APC) according to (A) similarity of ED50 responses to the “POPS” and (B) similarity of gene expression (RNAseq). Cell lines (nodes) are colored according to KRAS status (blue = KRAS mutant, red= KRAS WT)
(C) 2-way hierarchical cluster of KRAS mutant cells according to response to POPs (ED50). Red = cherry-picked dataset
(D) CDF plot comparing SW157765 sensitivity (AUC) of cell lines with co-occurring mutations in KRAS and KEAP1 (red) to wild-type (blue; p<.0002; KS-test)
(E) Dose response curves of 5 cell lines not included in the original training panel in response to SW157765 (blue=KEAP1, KRAS mutant, orange = WT)
(F) Dose response curves of cell lines grown in 3D spheroid models in response to SW157765. Cell lines that were sensitive (blue) or resistant (orange) to SW036310 in standard 2-D cell-culture were evaluated (n=8/dose)
(G) Heatmaps relate SW157765 sensitivity to predictive biomarkers. Cell lines are ranked by response (AUC; top panel). For each cell line the co-occurrence of mutations in KEAP1 and KRAS, NRF2 mutations and RNAseq based log2 FPKM expression values for KEAP1 are shown below
(H) Dose response curves in response to SW157765 of cell lines outside the training set with high (blue) and low (orange) mRNA expression of an NRF2 regulated gene signature
(I) protein expression of NRF2 and CYP4F11 post-siRNA mediated depletion of NRF2 or a non-targeting control (NC). siNRF2 oligos were transfected individually or as a pool
(J) siRNA mediated depletion of NRF2 or a non-targeting control (NC) followed by 72 hrs SW157765 treatment in A549 cells. Dose response curves are shown. siNRF2 oligos were individually transfected or transfected as a pool
(K) siRNA mediated depletion of KRAS or a non-targeting control (NC) followed by 72 hrs SW157765 treatment in H2122 and A549 cells. Dose response curves are shown (n=6/dose)
(L) The percent remaining of SW157765 in H2122 cells transfected with siKRAS (orange) or a non-targeting control (NC, blue) plotted as a function of chemical treatment time
SW157765 is found as a member of the ‘prodrug’ compounds in which high expression of CYP4F11 is predictive of, and required for, cellular response (Figure 2 A,G). Of note, CYP4F11 is a candidate NRF2 target gene whose expression is upregulated in NRF2-dependent NSCLC (Goldstein et al., 2016). Given this association, we assessed NRF2 dependent regulation of CYP4F11 in an SW157765-sensitive cell line and found that siRNA-mediated depletion of NRF2 resulted in depletion of CYP4F11 (Figure 5I, S5G) and reduction of sensitivity to SW157765 (Figure 5J). This suggests that NRF2 pathway activity leads to selective production of a toxic SW157765 metabolite. However, we also noted that HCC44 is an SW157765-resistant cell line with high expression of CYP4F11 and corresponding SW157765 metabolism (Figure 2E), suggesting CYP4F11-dependent modification of SW157765 is not sufficient to account for chemical sensitivity. Consistent with this, we found siRNA-mediated depletion of KRAS completely rescued cellular sensitivity to SW157765 even though metabolism of the compound was unaffected (Figure 5K,L). Thus, KRAS and NRF2 pathway activation combine to produce a selective cellular vulnerability to SW157765 intervention.
To help identify the nature of this vulnerability, we employed an arrayed genome-scale affinity-selection/mass spectrometry screening strategy to identify SW157765 interacting proteins from among a panel of ~14,000 candidates (Figure S6A). The noncanonical glucose transporter, GLUT8 (SLC2A8), was the sole hit, with an estimated Kd = 200nM (Figure 6A). Parental SW157765 was used as a substrate for the binding assay rather than the CYP4F11-dependent oxidized metabolite (Figure 2Z) as we were unable to synthesize the latter de novo. As an alternate approach, we undertook docking studies to assess binding of SW157765 to GLUT8 in comparison to the predicted metabolite (Figure S2Z). A homology model GLUT8 was developed from homologous crystal structure of GLUT1 (Kapoor et al., 2016). A crystal structure of GLUT8 has not been published, however GLUT1 has a 48% sequence similarity with GLUT8 and most of the critical residues for glucose transport are conserved between the two proteins. SW157765 and the epoxide metabolite were predicted to dock on top of one another, except for a deviation near the epoxide region. (Figure S6B). While both chemicals were predicted to interact with residues on GLUT8 (Figure S6B), the epoxide constrains the furan ring, resulting in a significant shift of this ring (55°) relative to the parent molecule, producing stronger predicted interactions with Trp433 and a higher docking score (−7.9 versus −7.6). Notably, docking studies with the inactive analog, 500-1, indicate it fails to achieve a binding pose similar to SW157765, with less H-bonding interactions and a relatively poor docking score of only −6.8. In aggregate, these analyses are consistent with interaction of both SW157765 and its oxidized metabolite with GLUT8. Enhanced GLUT8 thermal stability in cells treated with SW157765, but not 500-1, provided orthogonal evidence for this interaction (Figure S6C).
Figure 6. SW157765 sensitive cell lines define a KRAS mechanistic subtype addicted to GLUT8 mediated glucose transport.

(A) LC/MS binding signals for ~14,000 proteins tested for the ability to bind to SW157765.
(B) siRNA mediated depletion of GLUT8 (blue) or a non-targeting control (grey; NC) in SW157765 sensitive and resistant cell lines.
(C) Cellular accumulation of fluorescently labeled 2DG in sensitive and resistant cell lines 72 hrs post-SW157765 treatment (purple= 1µM; blue = 5µM) or DMSO treatment.
(D) Cellular accumulation of fluorescently labeled 2DG in H647 (KEAP1, KRAS mutant) cells post-siRNA depletion of GLUT1 and GLUT8
(E) Incorporation of [13C6] into serine (SerM3) and glycine carbons (GlyM2) in SW157765 sensitive (n=12) and resistant (n=57) cell lines at 24 hours post-label incubation
(F–G) Relative viability (z-scores) of SW157765 sensitive and resistant cells in response to (F) siATF4 (G) and siPHGDH
(H) Incorporation of [13C6] into serine (SerM2) in H647 cells 24 hrs post-SW157765 or DMSO treatment
(I) Incorporation of [13C6] into serine (SerM3) and glycine (GlyM2) carbons in SW157765 sensitive and resistant cells 6 hrs post-SW157765 or DMSO treatment
(J) Protein expression of PHGDH in KEAP1, KRAS mutant, SW157765 sensitive cell lines (A549, H460, and H647) and KEAP1, KRAS mutant unanticipated non-responders (DFCI024, HCC44, H2030, HCC4019)
(K) Dose response curves of HCC44 cells and HCC44 cells stably expressing either PHGDH or PHGDHV490M in response to SW157765
(L) SW157765 response (AUC) in CYP4F11 and PHDGH positive breast cancer cell lines (blue) compared to CYP4F11, PHGDH negative cell lines (orange)
GLUT8 is a member of the class III glucose transporters thought to mainly participate in translocation of glucose across the blastocyst membrane (Carayannopoulos et al., 2000). A role for GLUT8 in cancer has not been well studied, though it has been found to be significantly upregulated in endometrial cancer and in multiple myeloma relative to normal tissue. While the dominant glucose transporter in tumor cells is thought to be GLUT1, upregulated class III glucose transporters may support higher energy demands in some cases (Schmidt et al., 2009). Supporting this notion, glucose uptake and viability of a subset of multiple myeloma cell lines was found to be dependent on the continued expression of GLUT8 but not GLUT1 (McBrayer et al., 2012). Notably, we found SW157765-sensitive NSCLC cell lines were also selectively sensitive to glucose deprivation (Figure S6D) and to GLUT8 depletion (Figure 6B). Furthermore, SW157765 selectively inhibited fluorescent 2-deoxyglucose (2DG) uptake in SW157765-sensitive cells in a dose-dependent manner (Figure 6C). In contrast, GLUT1 depletion (Figure S6E,F) had no effect on 2DG uptake (Figure 6D) or viability (Figure S6G). These observations are consistent with action of SW157765 at the level of GLUT8 inhibition, and a selective dependence of KRAS/KEAP1 mutant cells on GLUT8 for glucose consumption.
Uniformly labeled [13C6] glucose is metabolized via the glycolytic cycle to 3-phosphoglutarate (3PG), which can enter the serine biosynthetic pathway where it is converted in a series of steps to serine, which is subsequently cleaved to produce glycine and a one-carbon intermediate that can enter the folate cycle to ultimately result in the production of purines and thymidines (Figure S6H). Of relevance to this study, high NRF2 activity was recently demonstrated to promote serine/glycine biosynthesis, in some NSCLC cell types, through ATF4-dependent expression of rate-limiting serine biosynthetic enzymes (PHGDH, PSAT1, PSPH, SHMT1, and SHMT2). De novo serine biosynthesis is upregulated in subsets of lung cancer, breast cancer, glioma, and melanoma, presumably to support glutathione and nucleotide production, and can be required for tumor cell survival. When we examined carbon flux from uniformly labeled [13C6] glucose into serine (SerM3) and glycine (GlyM2) mass isotopomers across 63 NSCLC cell lines, we found significant enrichment of heavy carbons in the SW157765 sensitive cell lines (Figure 6E), corresponding to significantly higher expression of serine biosynthetic pathway genes (Figure S6I) and selective consequences on cell survival upon depletion of the ATF4 transcription factor (Figure 6F) and PHGDH (Figure 6G), the enzyme that catalyzes the first committed step in the serine biosynthetic pathway. Taken together, these findings indicate a dependence of KRAS/KEAP1 mutant NSCLC cells on consumption of glucose to support serine biosynthetic pathway activity.
These cumulative observations led us to consider that SW157765 may be acting to reduce carbon flux through the serine biosynthetic pathway, leading to selective targeting of cancer cells dependent on this pathway. To test this, we pretreated H647 (KRAS/KEAP1 mutant) with SW157765 for 24 hours, an interval where we do not observe significant induction of cell death (Figure S6J), followed by exposure to glucose ([13C2]) (Figure S6O). Heavy carbon labeling of serine reached steady-state after 2 hrs (SerM2), which was reduced 5-fold by SW157765 (Figure 6H). Iteration of this approach within a panel of NSCLC cell lines, indicated basal carbon flux through the serine biosynthetic pathway was higher in SW157765-sensitive cell lines, as expected, and exposure to SW157765 selectively reduced serine labeling in these cell lines (Figure 6I). Notably, carbon flux from glucose through the pentose phosphate pathway (PPP; LacM1) or the citric acid cycle (TCA; CitM2) (Figure S6K–L; Figure S6O) was not affected by SW157765. Both KRAS and NRF2 are known to shunt glucose towards the PPP. Thus, the selective consequences of SW157765 exposure on serine/glycine metabolism suggests a dominant routing of available glucose to the PPP and TCA. GLUT8 may therefore support supplementary glucose consumption to an extent that provides for serine/glycine biosynthetic demands of the KRAS/KEAP1 mutant cellular context.
While KEAP1 and KRAS mutation status was robustly predictive of sensitivity to SW157765, we noted 4 unanticipated non-responders (DFCI024, HCC44, H2030, HCC4019) with co-occurring mutations in KEAP1 and KRAS and high expression of CYP4F11(Figure S6M). Importantly, PHGDH was greatly reduced or absent in all 4 cell lines (Figure 6J). Additionally, cell line H2030 is completely missing mRNA expression of PSAT1 (S6H,M). These cells may be resistant to SW157765 due to a pre-existing adaptation that reduces contributions of glycolysis to serine/glycine biosynthesis. To test this, we stably expressed either full length PHGDH or a hypomorphic mutant (PHGDHV490M) (Tabatabaie et al., 2009) in HCC44 cells under the control of a doxycycline inducible promoter (Figure S6N). Overexpression of PHGDH, but not PHGDHV90M, sensitized HCC44 cells to SW157765 (Figure 6K), suggesting that PHGDH re-established carbon flux into serine/glycine production with consequent reliance on GLUT8 to maintain sufficient glucose consumption.
In summary, we have shown co-occurring mutations in KEAP1 and KRAS define a vulnerability to continued function of GLUT8. Inhibition of GLUT8 is associated with a reduction of glucose intake leading to a selective shunting of glucose from serine biosynthesis. We found overexpression of wild-type PHGDH can re-sensitize HCC44 cells to SW157765. Perhaps most intriguingly, re-introduction of PHGDH also can sensitize cells to GLUT8 inhibition. These findings suggest that shunting cellular consumption of glucose to serine biosynthesis generates a dependency on GLUT8 that can be selectively targeted with SW157765. To potentially help assess the generality of this relationship, we profiled SW157765 for toxicity in a panel of 27 breast cancer cell lines with publically available genomics data (Barretina et al., 2012). Importantly, we found that copy number-driven amplification of PHGDH expression together with high expression of CYP4F11 significantly corresponded to SW157765 sensitivity (Figure 6L).
Discussion
The chemistry-first target nomination approach employed here was designed to leverage large-scale uncharacterized chemical diversity as a de novo discovery tool unconstrained by any preconceived notions of mechanistic relationships. Of the 202,103 chemicals employed, less than 1% are associated with known or suspected modes of action. However, computer automated rediscovery of current precision medicine relationships from within the collection of known compounds authenticated the screening cascade. This included the association of erlotinib-sensitivity with EGFR mutation status and the association of crizotinib-sensitivity with EML4-ALK translocations. Likewise, the pipeline returned novel and robust repurposing hypotheses and biomarkers for clinically available compounds that currently lack patient selection hypotheses.
While the above observations credentialed the rigor of the experimental and data analytics pipeline, the identification of novel chemical/genetic relationships was the primary objective. To that end, 171 compounds were linked to genomic features within a 95% confidence interval by the elastic net. These chemical/genetic relationships spanned a strikingly diverse array of biological processes including selective vulnerabilities associated with host defense pathway activation, ciliogenesis, and nuclear hormone signaling. Furthermore, pharmacological relationships that were a consequence of selective chemical clearance and/or selective chemical metabolism were readily detectable.
To pursue candidate “therapeutic triads” we focused on KRAS mutant adenocarcinoma. When considered as a single class, these cell models displayed diverse and discordant response profiles to the chemical collection employed here. However, significant chemical/genetic associations were detected upon segmentation of cell models according to mutations in additional genes that co-occurred with KRAS mutations at a reasonable frequency. This is in accordance with accumulating evidence that KRAS mutant lung cancers parse across multiple distinct mechanistic subtypes. Most notably, KRAS/KEAP1 double mutant NSCLC cells were selectively sensitive to the benzothiozole, SW157765, due to the convergent consequences of dual KRAS and NRF2 modulation of metabolic and xenobiotic gene regulatory programs. Glut8 was identified as a mechanistic target of SW157765, and is selectively required to support the diversion of glucose to serine biosynthesis in this genetic background. Modulation of these regulatory programs by orthogonal means was sufficient to modulate SW157765 responsiveness. We note that lineage-restricted biomarker discovery was key to identifying the KRAS/KEAP1 synthetic chemical relationship. Of note, parallel analysis within a large cohort of breast cancer cell lines returned sensitivity-associated biomarkers indicative of a conserved biological mode-of-action for SW155765, but there was no relationship with KRAS/KEAP1 mutation status, an oncogenotype that is exceedingly rare in breast.
We find that the application of a large diversity-oriented chemical collection, within a carefully delineated phenotypic screening convention, can uncover a compelling diversity of here-to-for unappreciated target opportunities within the seeming cacophony of molecular etiology of lung cancer. Importantly, these target opportunities are, by nature of the discovery paradigm, associated with precision medicine strategies and pharmacologically addressable. Furthermore, it is clear that chemical vulnerabilities can be revealed that are linked to recurrent mutations in lung cancer patients that are not currently “actionable”. Thus, we argue that many undeveloped avenues remain open for productive pursuit of tumor-intrinsic precision medicine.
STAR Methods
Contact for reagent and resource sharing
Further information and requests for resources and reagents should be directed to and will be fulfilled by the Lead Contact, Michael White (michael.white@utsouthwestern.edu)
Experimental Model and Subject Details
Cell Lines
Most NSCLC lines used in this study were part of the NCI and HCC (Hamon Cancer Center at UT Southwestern) series of cell lines, with the exception of THLE-2, THLE-3, A427, A549, Calu.1, Calu.6 (American Type Culture Collection; ATCC), Cal.12T (Deutsche Sammlung von Mikroorganismen und Zellkulturen GmbH; DSMZ), DFCI.024, DFCI.032 (Dana Farber Cancer Institute, courtesy of Pasi Jänne), EKVX, Hop62 (NCI-60 panel), PC9 (Johns Hopkins University School of Medicine, courtesy of Bert Vogelstein). Cell lines from these collections were cultured in RPMI 1640 (Gibco, 2.05mM L-glutamine) supplemented with 5% FBS (GIBCO) and 1% penicillin/streptomycin (Gibco). Normal bronchiole epithelia-derived cell lines (Ramirez et al., 2004) were grown in ACL4 (RPMI 1640 supplemented with 0.02 mg/ml insulin, 0.01 mg/ml transferrin, 25 nM sodium selenite, 50 nM hydrocortisone, 10 mM HEPES, 1 ng/ml EGF, 0.01 mM ethanolamine, 0.01 mM O-phosphorylethanolamine, 0.1 nM triiodothyronine, 2 mg/ml BSA, 0.5 mM sodium pyruvate) with 2% FBS and 1% penicillin/streptomycin. Normal liver lines, THLE-2 and THLE-3, were grown in the Bronchial Epithelial Cell Growth Medium (Lonza, CC-3170) supplemented with 10% FBS and 1% penicillin/streptomycin. All cell lines were maintained in a humidified environment in the presence of 5% CO2 at 37°C. All cell lines were were DNA fingerprinted (Powerplex 1.2 Kit, Promega) and mycoplasma free (myco kit, Boca Scientific). All chemicals beginning with the prefix SW are from the UT Southwestern Chemical Library. THZ1 was obtained from Calbiochem, ciliobrevin from Tocris, GSK923295 from SellekChem, HET-0016 from Santa Cruz Biotechnology, nocodazole from Sigma-Aldrich.
Methods Details
Chemical libraries
The UT Southwestern chemical screening library (~200,000 small molecules; Figure S1G) is composed of 75,000 compounds purchased from ChemBridge Corporation, 100,000 compounds purchased from Chemical Diversity Labs and 22,000 compounds purchased from ComGenex, 1200 purchased from TimTek, 1100 from Prestwick, 2,500 com-pounds from UTSW chemistry labs, and the 450 compounds of the NIH clinical collection. The TimTek compounds are “natural product-like” synthetic compounds and the Prestwick compounds are off-patent drugs. The NIH clinical collection is composed of compounds that have been tested in phase I clinical trials. The library is free of commercial ties and is wholly owned by UT Southwestern. The compounds from commercial sources were selected to reflect the diversity available in the larger sets of compounds offered by each company and were screened for desirable, drug-like qualities and chemical diversity, using filtering software running in the CheD and SARNavigator programs (Tripos, Inc.). The compounds in the library satisfy a relaxed set of Lipinsky’s rules, with 99% having a molecular weight less than 550 (average 250–300).
Spheroid assays
Cell lines were trypsinized, counted, and plated into 96-well U-bottom low adherence plates (Nunclon Sphera, Thermo Scientific). Cells were inoculated between 500–4,000 cells per well depending on growth rate. Spheroids were allowed to form over 48 hrs, drug was added, and the plates incubated for an additional 96 hrs. Luminescence assays were performed using CellTiter-Glo® 3D cell viability assay (Promega) according to the manufactures instructions. The plates were read on a BMG Labtech FLUOstar® Optima.
RNA isolation and microarray
All cells were seeded in 6-well plates at 300,000 cells/well in 2 mL standard culture media (RPMI, 5%FBS, penicillin/streptomycin) and allowed to adhere overnight. The media was discarded and replaced with 1.5 mL treatment media containing either o.1% DMSO vehicle control, or 10 µM of SW compound. After 24 hrs of treatment, total RNA was harvested using the miRNeasy Qiagen kit according to the manufacturer’s instructions. All samples were submitted for microarray analysis at the UT Southwestern Microarray Core using an Illumina Human-HT-12 v4 Expression BeadChip. Raw intensitity values were background corrected and quantile normalized using the lumi package in R. Using a minimal expression cutoff of 7, we eliminated from the analysis genes that were not expressed before or after compound treatment. For each gene, normalized values were converted to a log2 to score to indicate the fold change with compound treatment with the following equation:
where xDMSO and xcomp is the normalized expression value of gene × with DMSO and 10 µM of SW compound treatment, respectively. The data was deposited into the Gene Expression Omnibus (GEO) under the accession number GSE104757.
Carbon tracing and metabolic flux analysis
All labeling experiments performed with cells plated at a density of 200,000 cells per 60 mm diameter dishes and grown for 48 hrs. Afterwards, media was removed and cells were rinsed with PBS prior to treatment with SW157765 for either 6 or 24 hrs. Media was then removed and cells were rinsed with PBS prior to treatment with SW157765 in media containing glucose-free RPMI supplemented with 5% FBS and 13C glucose. For the 6 hr compound treatment, 13C media mixture was added for 2 hr. For the 24 hr compound treatment, cells were rinsed with phosphate-buffered saline, replenished with 13C labeling medium with SW157765 and cultured for time points ranging from 0 to 2 hr as indicated at the end of the 24 hrs. To determine basal metabolomics flux in the panel of 61 cell lines, cells were pre-treated with media containing either 13C labeled glucose or glutamine for either 6 or 24 hours. Labeled cells were briefly rinsed with cold saline, pelleted in cold 50% methanol, lysed through at least 3 freeze-thaw cycles, and then centrifuged to remove debris. The supernatants were evaporated to dryness methoximated and derivatized by tert-butyl dimethylsilylation. One mL of the derivatized material was injected onto an Agilent 6970 gas chromatograph equipped with a fused silica capillary GC column (30 m length, 0.25 mm diameter) and networked to either an Agilent 5973 or 5975 Mass Selective Detector. Retention times of all metabolites of interest were validated using pure standards. The measured distribution of mass isotopomers was corrected for natural abundance of 13C
Glucose deprivation assays
Cells were cultured in either complete media (RPMI supplemented with 5% FBS) or media lacking glucose for 5 days. Viability was determined as relative content of DNA at day 5 in reduced media as compared to cells grown in complete medium.
qPCR
Cells were plated at a density of 250,000 cells/well in 6 well format and allowed to incubate overnight. The cells were then washed with PBS twice prior to RNA extraction with the RNeasy Mini Kit (Qiagen) following the manufacturer’s recommended protocol. 100 ng to 1ug of total RNA was mixed with qScript cDNA SuperMix for cDNA synthesis (Quanta Biosciences) or taqman universal master mix II (Applied Biosciences). Taqman gene expression probes (Applied Biosciences) for GLUT1, GLUT8 and NR3C1, were used for real-time qPCR amplification on a Light Cycler 480 II Real-Time PCR System (Roche). The cycling program was 95°C for 10 min, 95°C for 15 sec, and 60°C for 40 cycles. Each sample was run in triplicate, normalized to the Cy5 standard probe, and analyzed by the comparative CT method.
Thermal stability shift assay
3E6 cells were cultured in 75 cm2 flasks for overnight growth. Cells were treated with RPMI media supplemented with 5% FBS containing either 0.1% DMSO or 1 µM SW157765 for 24 hr. After treatment, cells were detached with trypsin, collected by centrifugation, resuspended in PBS, and cell suspensions of 500,000 cells/tube were transferred into 8-well 0.2-ml PCR tubes and heated for 3 min. After a subsequent 3 min incubation at room temperature, cells were lysed by the addition of 100 µl of ice-cold RIPA buffer (150 mM sodium chloride, 6 mM disodium phosphate, 4 mM monosodium phosphate, 2 mM Ethylenediaminetetraacetic acid, 1% Triton X-100, 100 mM sodium fluoride) supplemented with 20 µg/mL aprotinin, 0.1 M sodium fluoride, 1 mM sodium orthovanadate, 1 mM phenylmethylsulfonyl fluoride, complete Mini EDTA-free protease inhibitor cocktail (Roche), and PhoSTOP (Roche). The lysates were incubated on ice for 30 minutes prior to centrifugation at 14,000 × g for 10 minutes at 4°C. Proteins of interest remaining in the supernatant were detected by immunoblotting.
Targeted siRNA and plasmid DNA transfection
For transfection in 96 well format, .1-1 µL siRNA (10 µM) of siRNA in 25 µL of serum-free RPMI was mixed with either .2 or .4 µL of RNAimax (Invitrogen) in 25 µL serum-free RPMI. Following a 15 minute incubation, the siRNA-lipid mixture was transferred to a 96 well plate followed by plating of cells at a concentration ranging from 3000 cells/well to 5000 cells/well (depending on cellular growth rate) in 100 µL media. Optimal concentration of siRNA was determined by titering amounts from .1 to 1 µL per well and selecting the maximal concentration for which no death is observed with non-targeting control. Consequences on cell viability were determined 48–96 hrs post-incubation. Experiments involving chemical treatment involved 48 hr pretreatment with siRNA followed by chemical treatment for 72 hrs at the indicated doses. CellTiter-Glo (promega) assays were performed using 15 µL regent/well followed by a 10 minute incubation. Luminescence was quantified with an Envision plate reader (PerkinElmer). siRNA data for siATF4 and siPHGDH (Figure 6F–G) was curated from a prior study (Kim et al., 2016).
For immunoblot and qPCR analyses, a 6 well plate was prepared containing mixture of 250 µl siRNA (Dharmacon, 10 µl 10 mM siRNA in 240 µl serum free media) and 250 µl RNAiMax (Invitrogen, 6 µl RNAiMax in 244 µl serum free media) per well, pre-incubated for 15 minutes at room temperature. Cells were then plated at a final concentration of 250,000 cells/well. After 48–96 hrs of transfection, cells were lysed and subjected to immunoblot or qPCR analyses.
Stable PHGDH expressing cell lines were created by transducing HCC44 cells with the pLvx-Tight-Puro (Clontech) tetracycline-inducible vector containing the human PHGDH complementary DNA fragment (kindly provided by Matthew G. Vander Heiden)(Locasale et al., 2011). Cell colonies were selected and maintained with 0.5 µg/mL of puromycin and 0.5 mg/mL of G418 sulfate. To induce PHGDH expression, cells were pretreated with 1 µg/mL doxycycline for 24 hr prior to SW157765 treatment.
To create stable HES1 overexpressing cells, H1993 cells were seeded at 3 × 10⁵ cells/well in 6-well plates 24 hrs prior to transfection. The cells were transiently transfected with the 2ug of HES1-pCMV6-AC-GFP expressing plasmid using 8ul/well of Lipofectamine-2000 (Invitrogen) according to manufacturer’s instruction. At 24hrs post-transfection, 5µM hydrocortisone or EtOH vehicle was treated to the culture medium and incubated for 72hrs. Nocodazole (300ng/ml) or DMSO vehicle was added at 48hrs post-treatment of hydrocortisone. Nocodazole treated cells were used as positive control. For cell cycle analysis, the cells were trypsinized, centrifuged at 1200rpm and stained with the cell-permeable DNA dye Hoechst-33342 (10ug/ml, Invtrogen) for 30 min at 37°C. After incubation, the stained cells were washed and resuspended with cold PBS. The DNA content of GFP-positive or negative with Hoechst positive cells were determined using FACS with UV and 488 nm lasers (LSR fortessa, BD FACSDiva software version 8.0.1, firmwere version 1.4, BD bioscience). Data were analyzed using FlowJo 7.6.5.
CRISPR-mediated cell line editing
CRISPR knockout cells were prepared using the two-vector system (Sanjana et al., 2014). 293T cells were cultured to 90% confluence. A mixture of 0.4 µg transfer plasmid (lenti-cas9 blast or lenti-guide puro; Addgene), 0.87 µg psPax2 (Addgene), and 1 µg pMD2-VSV-G (Addgene) were diluted to a total of 50 µL in Opti-MEM media and added to a mixture of 21 µL FuGENE 6 (Promega) in 129 µL Opti-mem after a 10 minute incubation period. The mixture was allowed to sit for 20 minutes after which it was added dropwise to 293T cells. Fresh RPMI 5% media was added 24 hrs later and 48 hrs post-transfection, target cells were transduced with virus. This processes was repeated and clones were selected in 10 µg /mL blasticydin. Cas9 expression was confirmed with Western blots. Cas9 expressing cells were then transduced with lenti-guide puro constructs using the same protocol. Clones were selected in puromycin and knockouts were confirmed immunobloting. sgRNA constructs were designed according to established protocol at http://CRISPR.mit.edu and cloned into the lenti-guide puro lentiviral expression vector. The sequences are as follows: CYP4F11 CACCGAAGGCGGCGGCAGTTGTCAT
Immunoblot analysis
Cells were plated in 6 well format for at a density of 150,000 cells/well and allowed to incubate overnight. Cells treated with 5µM GC were allowed to incubate 72 hrs prior to collection. Cells were either lysed in RIPA buffer (Sigma-Aldrich) with 1× protease inhibitor (GenDEPOT) and phosphatase inhibitor (Thermo Scientific) cocktails or in 50nM Tris (pH 6.8), 2% SDS and 10% glycerol. Total 10 µg of lysates were loaded and electrophoresed on 4~15% gradient SDS-PAGE gel (Bio-Rad) and transferred to a PVDF membrane using the Trans-blot turbo transfer system (Bio-Rad). After blocking with 5% nonfat dry milk in PBST (1× PBS, 0.1% Ttween-20), membranes were probed overnight with primary antibodies diluted at either 1:500 or 1:1000 at 4°C according to manufacturer recommendations. After washing and incubation with secondary antibody, protein signals were visualized with the Enhanced Chemiluminescence Western Blot Detection Solution (Thermo Scientific) or Supersignal West Pico Chemiluminescence Western Blot Detection Solution (Thermo Scientific). Whole cell lysate loading controls were either GAPDH or β-actin. Nuclear loading controls were Lamin B1. Glut13 was used as a loading control for thermal stability shift assays. Antibodies were purchased as follows: β-actin, KRAS, CYP4F11 and HRP-conjugated anti-mouse or rabbit IgG antibody (Santa Cruz Biotechnology), HES1, Cyclin D1, GR and PHGDH (Cell Signaling Technology), NRF2 (Invitrogen), β-tubulin, GLUT1, GLUT8, GLUT13 and Cas9 (Abcam).
96 well dose response assays
To determine cytotoxicity of the small molecule compounds, NSCLC cells and HBECs were plated at a densities ranging from 3,000 of 5,000 cells per well in white tissue-culture-treated 96-well clear bottom plate (Corning), with the seeding density for each cell line based on growth rate. After culturing the cells in assay plates for 24 hrs, compounds were added to each plate at the indicated doses (3 replicates per dose per cell line). After an incubation of 96 hrs, 15 µl of CellTiter-Glo reagent (Promega) was added to each well and mixed. Plates were incubated for 15 min at room temperature and luminescence was determined for each well using a SpectraMax Paradigm plate reader (Molecular devices).
Flow cytometry analysis
For DNA content analysis, cells were seeded at density of 1.5 × 10⁵ per well in 6-well plate and after 24 hrs in cell culture, 3 µM hydrocortisone or DMSO vehicle was added to medium. Nocodazole at 100 ng/ml or DMSO was added 72 hrs after cell seeding. Twenty-four hrs post-nocodazole/DMSO treatment, cells were collected by trypsinization, resuspended in 1 ml of ice-cold PBS-F (1 × PBS, 2% FBS), followed by drop-wise addition of 10 ml ice-cold 70% ethanol. Following overnight incubation at 4°C, cells were washed twice with PBTA (1× PBS, 1% BSA, 0.1% Tween-20), stained with propidium iodide (Sigma) containing RNase A at 37°C for 30 minutes. Fluorescence of the PI-stained cells was measured using a FACSCalibur (BD Biosciences) and analyzed with FlowJo software (BD Bioscience).
In vitro determination of compound stability with human tumor cells
Cell lines were plated at a density of either 2000 (H2122, A549, HCC95, HCC44, H1792, H460, H322, HCC1171, H920, HCC2108, H226, H647, H2086, HCC4011) or 4000 (DFCI.032, HCC3051, H3255, H1395, H2073, H1437, HCC2814, HCC515, H596, H3122) cells per well in 96 well plates. After overnight adherence, media was removed and replaced with fresh media containing either 100 nM (SW027951, SW098382, SW126788, SW153609, SW157765, and SW159580) or 200 nM (SW103675, SW115205, and SW167255) compound. Experiments using the CYP4A and 4F inhibitor HET0016 used 50 nM SW157765 in combination with 100 nM HET0016 added after overnight cell culture. siRNA experiments involved 48 hour pretreatment with siRNA’s targeting KRAS prior to compound addition. At varying times post compound addition, media and cells were removed using trypsin and the cells were broken open and the lysate precleared of protein by the addition of a two-fold volume of methanol containing 0.2% formic acid, 2 mM NH4 acetate and 100 ng/ml of internal standard (IS = n-benzylbenzamide or tolbutamide) followed by vigorous vortexing and centrifugation at 16,000 × g for 5 min. In experiments involving the compound SW153609, proteins were pre-cleared by addition of a two-fold volume of methanol containing 2 mM NH4 formate and 100 ng/mg of IS. The supernatant was analyzed by LC-MS/MS for levels of parent compound. An analytical method for each compound was devised by direct infusion of a 1 µg/ml stock in 50:50 MeOH/H20 containing 0.1% formic acid and 2 mM NH4 acetate or 2 mM NH4 formate into a Sciex 3200 or 4000 Qtrap mass spectrometer. Using the compound optimization wizard in Analyst 1.6.1, optimal ionization parameters (Declustering Potential, DP; Entrance Potential, EP; Collision Cell Entrance Potential, CEP; Collision Energy, CE; and Collision Cell Exit Potential, CEP) for each parent/daughter pair were determined and a generic set of gas parameters (CUR=45, CAD=medium, IS=4500, TEM=700, GS1=70, GS2=70) and chromatography conditions (Buffer A: Water + 0.1% formic acid, 2mM NH4 acetate or Water + 5 mM NH4 formate; Buffer B: MeOH + 0.1% formic acid, 2 mM NH4 acetate or MeOH + 5 mM NH4 formate; flow rate 1.5 ml/min; column Agilent C18 XDB column, 5 micron packing 50 × 4.6 mm size ; 0 – 1.5 min 3%B, 1.5 – 2.0 min gradient to 100% B, 2.0 – 3.5 min 100% B, 3.5 – 3.6 min gradient to 3% B, 3.6 – 4.5 3% B) were utilized to quantitate peak areas for the parent/daughter pair for each compound and IS. Transitions utilized in positive mode were as follows: SW098382: 459.149/121.2; SW103675: 329.045/91.1; SW115205: 309.119/107.0; SW126788: 395.197/349.1; SW153609: 408.098/125.0; SW155765: 332.071/211.1; SW167255: 411.032/125.0; n-benzylbenzamide: 212.1/91.1. Transitions utilized in negative mode were as follows: SW027951: 331.02/125.9; SW134963: 299.862/240.9; SW147739: 376.203/166.7; tolbutamide: 269.9/169.9. The peak area for each compound was normalized to the peak area for the IS and then relative compound abundance at each time point was determined by comparison to the peak ratio at time 0. A “% remaining” value was used to assess metabolic stability of a compound over time. The natural Log (LN) of the % remaining of compound was then plotted versus time (in min) and a linear regression curve plotted going through y-intercept at LN(100). Compound was also incubated in the absence of cells (culture media only) to determine whether any compounds showed chemical instability. Several compounds (SW134963, SW153609, and SW167255) showed such chemical instability with the amount of compound lost in media only by 24 hr equivalent to that lost in the presence of both sensitive and resistant cell lines.
SW157765 Metabolite Identification
Metabolite identification studies for SW157765 were performed essentially as indicated above. H2122 cells were incubated with 10 µM SW157765 or 500-1 for 8 hr and then washed and harvested as described. Samples were analyzed by LC-MS/MS on a Sciex 4000QTRAP using LightSight Software for information dependent acquisition followed by an enhanced product ion scan (IDA-EPI). Transitions associated with Phase I metabolism were evaluated.
Glucose utilization
Glucose uptake was evaluated utilizing the Glucose Uptake Assay Kit (Abcam). Briefly, 6,000 cells were plated in 96-well plates in RPMI plus 5% FBS. Twenty-four hrs later, cells were pretreated with either SW157765 (1 or 5 µM, final) or equal volume vehicle (ethanol) in RPMI plus 5% FBS for 6 hr. In experiments involving siRNA, GLUT8 or GLUT1 was transfected as described and allowed to incubate for 48 hrs. Media was removed and wells were washed three times with DBPS. Afterwards, 0.9 mM 2-deoxyglucose (2-DG) was prepared in glucose-free RPMI plus 5% FBS and then added to each well. Plates were returned to a 37°C incuba tor with 5% CO2 for 2 hr. Afterwards, media was removed, cells were washed with DPBS three times to remove exogenous 2-DG and detection of glucose uptake was determined using manufacturer’s recommended protocol.
Analysis of 2-DG uptake was performed as follows: First, fluorometric values were calculated based on the 2-deoxyglucose-6-phosphate standard curve. Next, cell count and viability was determined by the CellTiter-Glo Luminescent Assay in a separate 96-well plate that was cultured and treated in parallel to the 2-DG treated plates. Reported relative fluorescent 2-DG uptake was calculated by normalizing the fluorescent values (i.e. 2-DG) to the luminescent values (cell number).
Binder selection assays
Protein preparation
In order to prepare human protein library, the CMV promoter-based vectors encoding a cDNA fragment of human gene (~14,000) was transiently transfected into FreeStyle293 cells (Invitrogen) using 293fectin (Invitrogen) according to the manufacturer's instructions. After 3 days of incubation, cells were disrupted in a bead beater and the cell disruptions were frozen at −80 °C until use.
To prepare the membrane-associated human GLUT8, the pcDNA3.1 vector (Invitrogen) encoding a cDNA fragment of human GLUT8 was transiently transfected into FreeStyle293 cells. After 3 days of incubation, cells were washed with phosphate-buffered saline (PBS) and suspended in buffer A, which contained 50 mM HEPES (pH 7.4), 1 mM EDTA. The cells were homogenized and centrifuged at 950×g for 10 min at 4 °C, after which the supernatant was recovered. Total membrane fractions were isolated by ultracentrifugation at 140,000×g for 60 min at 4 °C, and resuspended in buffer A. Membrane fractions were frozen at −80 °C until use.
Binder selection technology
Arrayed affinity-selection/mass spectrometry binding assays were employed to identify binding proteins for test compounds using a human protein library with one protein per well in 96 well plate format. The binding assay was performed at 4 °C using the human protein library or membranes. Proteins were dissolved in assay buffer (25 mM Tris-HCl (pH 7.4), 137 mM NaCl, 2.7 mM MgCl2, 0.005% Tween-20, 1 mM DTT). Compounds were added to protein solutions (final DMSO concentration of less than 1%) and the mixtures were incubated for 2 hours. Nonspecific binding was defined using mock-transfected membranes. The reaction mixtures were applied to a size-exclusion chromatography to separate bound compounds from free compounds. Then the bound compounds were quantified by liquid chromatography-mass spectrometry (API5000 LC/MS/MS system) and the calculated Kd value was determined using Prism nonlinear software (Graph Pad Software, CA, USA).
DNA/RNA extraction for sequencing
Prior to sequencing, all cell lines were DNA-fingerprinted (PowerPlex 1.2 Kit; Promega) and found to be mycoplasma-free (e-Myco Kit; BocaScientific). DNA for exome or genome sequencing was purified from frozen cell line pellets using DNeasy reagents and protocols with QIAcube robot (Qiagen). DNA spectra were quantitated using spectrophotometer (Nanodrop) and samples diluted with nuclease free water (Ambion). Cell lines were grown to approximately 70–80% confluence, washed 2× with PBS and directly lysed from culture flasks using RLT buffer (Qiagen). Lysates were snap frozen and stored at −80° C. RNA was purified from lysates using RNeasy kit and QIAcube robot (Qiagen).
Genomic characterization
SNP Arrays
Whole-genome single nucleotide polymorphism (SNP) array profiling was done using the Illumina Human1M-Duo DNA Analysis BeadChip (Illumina, Inc.). Cell line DNA was hybridized according to manufacturer instructions. Processing was first performed using Illumina BeadStudio to generate the ‘Log R Ratio’ which measures the relative probe intensity compared with normal diploid controls. The package DNAcopy in the R statistical software environment was then used to segment the data. Final copy number variation was interpreted as the log2 segmented copy number values.
RNAseq and Whole Exome Sequencing
FastQC (Babraham Bioinformatics Institute) was used to check the sequencing quality, and high-quality reads were mapped to human reference genome (hg19) along with the gene annotation data (genecode v19) from Genecode database using STAR (v2.4.2). RSeQC was applied for assessing RNA sample quality Gene-level expression was reported in fragments per kilobase per million reads (FPKM) by Cufflinks.
Illumina BeadChip Microarray
Raw Illumina HumanWG-6 v3.0 BeadChip files were obtained from the Gene Expression Omnibus using accession number GSE32026 and normalized as described previously (Kim et al., 2016). Briefly, Data were background-corrected using the ‘MBCB’ package in R, which provides a model-based background correction method similar to an RMA correction with affymetrix arrays. Data were then quantile-normalized to produce equivalent expression distributions amongst cell lines.
Germline variant filtering
The UTSW-92 panel of the cell lines corresponded to those in which we have tumor DNA but corresponding matched non-tumorigenic DNA is not available. These correspond to 68 lines from the ‘training set’ of cell lines and 24 lines from the ‘testing set’ of cell lines. For these, we developed a pipeline to filter out the most probable germline mutations and enrich for somatically acquired mutations. Reads were aligned as described to the hg19 reference and filtered for non-synonymous lesions (missense, non-sense, splice site mutations) (mean of 5,049 mutations/cell). We next removed any site that was annotated as corresponding to a germline mutation in the matched dataset (mean of 1,248 mutations/cell). Using publically available datasets such as the thousand genome project (TGP) as an exclusion criteria or the catalogue of somatic mutations in cancer (COSMIC) as an inclusion criteria may aid in enriching for somatic mutations. We removed variants (defined based on genomic position) that were found in > 12% of the TGP (TGP filter) and where the difference in the UTSW panel frequency and the TGP frequency was <1.8% (allele difference filter). We also removed, on a gene-level basis, genes that were highly mutated (mutated at any site in >40% of cell lines) in the UTSW panel (mutation any site filter), but present at a low frequency (<13%) in COSMIC (Cosmic filter) and in the UTSW-34 matched panel (<20%) (UTSW-34 filter). This resulted in a final mean mutation count of 718 mutations/cell. We developed a strategy to find a data driven way select optimal filter cutoffs from these datasets. We selected 12 evenly distributed values for the TGP filter between .02% and 20%, for the allele difference filter between −10% and 10%, for the mutated any-site filter between 1.8% and 80%, for the Cosmic filter between .13% and 20% (log10 scale), and for the UTSW-34 filter between 2.9% and 50%. Selecting all possible combinations of these filters resulted in 248,832 possible combinations. For each filter combination, we can plot the number of mutations that pass the filters (Figure S1C), with the strictest filter combination resulting in the fewest variant being annotated as ‘somatic’ and the most lenient resulting in the most variants being included. To select the optimal filter combination in a data-driven way, we fit a cubic function to the plot of filter index (x values) versus number of mutations included at each filter index (y-axis) and selected the value on the plot which results in the minimized second derivative for each cell line. Figure S1C indicates the mean selected filter value across the cell line panel (solid line) with 95% confidence intervals indicated (dashed line). Resulting variants are described in Data File S2.
Small molecule cytotoxicity assays
The UTSW chemical library and screening assay format was described previously (Kim et al., 2013) and is described above. Our chemical library, consisting of ~200,000 chemicals (Figure S1B, G), was initially screened at a single dose (2.5 µM) in single well for each compound against a panel of 12 NSCLC cell lines. Toxicity data was converted to an activity score according to the following equation
so that an activity score indicates percent kill relative to on-board DMSO controls. We subsequently converted activity scores to z-scores for each chemical across the 12 cell line panel and selected chemicals with z <= −3 in at least one cell line, resulting in 15,483 chemicals (single dose cohort). These chemicals were then re-screened in triplicate against the same 12 NSCLC cell lines along as well as an immortalized human bronchial epithelial cell line (HBEC30KT) at the screening dose of 2.5 µM (confirmation dataset). From this data set, we used two criteria to select chemicals for further follow-up. We first filtered for chemicals with a bimodal pattern of response from our panel of cell lines. Specifically, we selected chemicals with > 40% toxicity to a subset of cell lines and < 20% toxicity to the remaining NSCLC’s and HBEC30KT. As determined in downstream dose-response studies, compounds that met this criteria typically displayed IC50’s in the range of our screening dose or lower for a subset of the NSCLC lines and IC50 values > 10 µM in the remaining cell lines in the panel and the HBEC30KT cell lines. In terms of chemical selectivity, we expect this selection to result in compounds with at least a ½ log difference in response between sensitive and resistant cell lines. We also used a selection method to capture potent chemicals with more of a continuous distribution of cytoxocity in our 12 cell line panel. For each compound, the responses of the cell lines were ranked from most sensitive to least. The difference (Δn) in response between each pair of ranked cell line activities for each compound was calculated. The S-score is the maximum difference (Δnmax) between two cell lines’ responses in the ranked list of responses to the compound. The two cell line responses that define the S-score therefore demarcate a boundary between sensitive and resistant response groups in the ranked list of responses for each compound. We selected chemicals for follow-up to be those with the S-score > 40%, while enforcing the criteria that the chemical not be toxic to HBEC30KT (< 20% observed toxicity). These chemicals were subjected to chemistry review that removed compounds with known or suspected promiscuous (off target) behavior based on historical screening data, structural alerts, and PAINS substructures. Following resupply (1 – 5 mg of powder per compound) and analytical quality control for identity and purity (LC/MS), 447 compounds were assayed in a multi-dose format (12 point dose-response curves in ½ log dilutions with the doses ranging from 50 pM to 50 µM) against the same panel of 12 NSCLC cell lines plus the HBEC30KT cell line. Each compound was assayed twice in this format and the dose-response curves compared. In cases where experimental replicates differed by more than 3-fold, we performed a third dose-response experiment and averaged the two experimental replicates that were in closest agreement. We used the same unimodal (S-score) method to select a total of 208 chemicals to be screened across the entire panel of 100 cell lines. In this case, we rank-ordered average log10(IC50) values for each compound and applied a threshold of 0.5 log units for the S-score. Chemical structures for all analyzed chemicals are available at http://pops.biohpc.swmed.edu. Smile strings are described in Data File S6.
Quantification and Statistical Analysis
In-silico Molecular Docking
The GLUT8 structural model was developed from the inward, open crystal structure of human GLUT1 (hGLUT1, PDBID 5EQG). The hGLUT1 structure has 48% sequence similarity to GLUT8, and all except one of ligand binding residues are conserved between the two proteins. The sequence alignment used for this comparison was based on Cheeseman and Long (Long, 2015) and Deng et. al., (Deng et al., 2015) to ensure correct alignment of sequentially conserved residues. For unresolved loop region residues, the GLUT3 crystal structure (4ZW9) was used as template(Deng et al., 2015). The model GLUT8 structure was evaluated for proper side-chain orientation vs. hGLUT1 crystal structure and was then optimized for docking using Protein Preparation Wizard. This included addition of hydrogens and step-wise energy minimization using OPLS3 force field. Sitemap was used to predict ligand-binding sites on GLUT8. A grid box was defined using the top ranked site that overlaps with glucose binding site and inhibitor binding residues. Conformations of SW157765 and the epoxy metabolite were generated in MOE2016.08 (Chemical Computing Group, QC, Canada). Multiple conformations were docked against glucose-binding site of the GLUT8 model using an SP scoring function in Glide version 6.5 (Schrodinger, LLC). In these docking experiments, the protein was treated as rigid and the liarvargand was allowed to be flexible. The docking results were analyzed visually using MOE2016.08 and Maestro (Schrödinger, LLC, New York, NY). The top-ranked docked pose exhibited H-bond interactions with Asn312 and van der Waals interaction with Trp433 and Trp457 consistent with co-crystal structures(Deng et al., 2015; Kapoor et al., 2016). SW157765 and epoxide metabolite exhibited similar docked poses expect for the double bond/epoxide region.
Normalization of drug response data and calculation of ED50 and AUC values
Chemical response for each cell line was converted to an activity score as described above. We found normalizing to the median of the two lowest doses, as opposed to on-board DMSO controls, minimized plate effects and resulted in a better curve fit and a more accurate description of sensitivity. We used the drc package in R to fit a standard 4 parameter log-logistic fit to the data and discover ED50 values. As imputed ED50 values have shown to be problematic in re-tests of large drug screening datasets, we do not impute values. Rather, if the imputed ED50 value is greater than the top tested dose (50 µM), we assign an ED50 of the top dose. Additionally, to correct for low ED50 values being assigned to chemicals in which the response is shallow, we assign an ED50 value of the top tested dose if the chemical does not result in at least 30% reduction in CTG values.
We calculated AUC values by determining area under the curve of the log fitted hill equation through standard integral analysis. For many of the compounds, a large proportion of the dose range is completely innocuous for all cell lines tested. To increase the dynamic range with AUC values, we found for each compound the proportion of the curve in which there is a response across all cell lines, and eliminated the data for the lower doses. Each compound was tested in 2 separate runs, with three replicates per run. To automatically detect the best, most reproducible data, we select the two replicates from each run with the best concordance between calculated ED50 values. The assigned ED50 or AUC value is then the mean between the filtered runs.
Scanning Kolmogorov-Smirnov statistic
A modification to a Kolmogorov-Smirnov statistic, which we term a scanning ranked KS test, was used to determine which mutations alone or co-occurring combinations of mutation combinations can best predict a selective sensitivity to each unknown compound. In addition to single mutations, we also annotated a ‘RAS_Class’ metaclass in which we assigned a cell line a value of ‘1’ if it contained a mutation in either KRAS, NRAS, HRAS, PIK3C1, or BRAF. Mutations or pairwise combinations of co-occuring mutations were first binarized (1=mutated; 0=wild-type), resulting in 446,435 combinations in which at least 5 cell lines contained the mutation combination. For each chemical, we reasoned that if a mutation combination is conferring a selective sensitivity, then the ED50 or AUC values for cell lines that are mutated will be lower than those that are wild-type. To determine the degree to which the ED50/AUC values for cells that are mutated are located towards the bottom of the ranked list sensitivity values, and thus lower than the background distribution, the following equation was used:
where v(j) is the position of each gene in the gene set in the ordered list of genes, t is the total number of cell lines with the mutation combination, and n is the total number of cell lines assayed (n=100).
To determine a p-value, 5000 permutations of randomized sorting of ED50/AUC values of size t was performed, and urandom was calculated. The resulting p-value was determined to be:
p<.002 indicates that, out of 5000 permutations, no random value was less than the calculated distance, u. This process was repeated for each of the mutation combinations for each chemical using both AUC and ED50 values as a sensitivity metric.
Elastic Net Regression
In order to assign predictive biomarkers to each chemical, we used a penalized linear regression model, the elastic net. We considered each dataset individually and separately as input into the elastic net. Candidate predictive features were selected from normalized measures of gene expression (illumina V3 BeadChip, RNAseq), copy number (Snp 6.0 arrays), protein expression (RPPA), metabolomics flux analysis and binary measures of gene mutational statuses (Whole Exome Sequencing). mRNA measures are likely to be the most variable across laboratories are subject to fluctuations from an in-vitro to an in-vivo system, and are the most difficult to assess in patient samples. Thus, mRNA measures were only considered inputs into the elastic net if there was at least a two-fold difference between lowest and highest expressing cells, and were prioritized for experimental follow-up based on maximal fold expression differences. The elastic net assigns biomarkers to a response vector of activity scores by solving a basic linear regression problem as follows:
Let X ∈ ℝnxp be the matrix of predictive features where n is the number of cell lines included in the training dataset and p is the number of features, and let y ∈ ℝn be the vector of binary sensitivity values for the same cell line panel. Columns of the predictive features matrix and y were normalized to have a mean of zero and a standard deviation of 1. The elastic net attempts to find which weighted linear combination of the columns of the predictive features matrix can best approximate y, or it solves the following equation for w:
The elastic net solves the above by enforcing a penalty to the solution that makes the solution both unique and sparse so that only the features that best approximate y are left with non-zero weight values. It does this by combining L1-norm and L2-norm regularization parameters so that the elastic net formulation to the above problem is given by:
where λ, α, are two adjustable parameters such that lambda controls the degree of the overall penalty and α controls the degree to which the L1 norm and L2 norm constraints are applied so that when α=0, only the L1 penalty is applied and when α=1, only the L2 penalty is applied. In order to determine the optimal values of alpha and lambda to use in the model, we did 100 iterations of 10 fold cross-validation where, in each iteration, the cells were randomly re-sampled into different groups. The values of alpha and lambda were chosen to be those that resulted in the minimum mean squared error for each fold. We then subjected the data to a series of 100 bootstrap permutations in which the cell lines were sampled with replacement, and features were assigned to each bootstrapped dataset. Features with a higher frequency of representation across bootstrapped permutations correspond to those with the highest confidence of being associated with drug response as opposed as being assigned due to overfitting of the model. Features were assigned to a chemical that were present in > 70% of permutations. Higher weighted features in the elastic net correspond to those with better mathematical predictive capacity and lowly weighted features may be assigned due to model overfitting. Cutoff values were assigned for weight values to select the most predictive features while still maintaining sparcity in the model. As weight magnitudes and distributions vary depending on input feature set and chemical sensitivity distributions, cutoffs were selected to be tailored to each chemical/feature set combination by selecting weight values +/− 2 standard deviations from the mean. Weight distributions follow a Gaussian distribution, so this cutoff corresponds to the top 5% of the most predictive features being assigned to each chemical.
As input into the elastic net, we used both AUC and ED50 values as measures of sensitivities. Additionally, we found that log10 transformation of the sensitivity vector could better identify exceptional responders to a compound in some instances, thus we used both the linear and log transformed sensitivity measure as input to the algorithm. The elastic net was run using the glmnet package in R.
Cell line pathway activity analysis
To calculate pathways that were down regulated relative to the background distribution on an individual cell line basis, we used a modification of a Kolmogorov Smirnov test. Gene pathways were curated from the Broad msigdb. We first converted RNAseq data to z-scores with the following equation
where zi,j is the z-score for gene i in cell line j. Then for a cell line, we converted z-scores to a ranked list, where a value of 1 indicates the highest z-score in that cell line. For a pathway, to determine the degree to which the values in a set are located towards the top of a ranked list, and thus upregulated relative to background, the following equation was used:
and to determine the degree to which a set is downregulated relative to background, the following equation was used:
where v(j) is the position of each gene in the gene set in the ordered list of genes, t is the total number of genes in the gene set, and n is the total number of genes assayed in the array.
To determine a p-value, 5000 permutations of randomized sorting of genes of the same set size was performed, and urandom was calculated. The resulting p-value was determined to be:
Gene Set Enrichment Analysis
Cell lines were dichotomized based on sensitivities to SW140154 and SW151511. We selected cell lines that were sensitive (ED50 < 10 µM) to SW151511 and resistant to SW140154 (ED50 > 20 µM) and compared them to cells resistant to SW151511 (ED50 > 20 µM) and sensitive to SW140154 (ED50 < 10 µM) using a GSEA analysis (Subramanian et al., 2005). For SW036310, we compared sensitive (ED50 <2 µM), TTC21B mutant cell lines to resistant lines (ED50 > 40 µM) with a GSEA analysis. Enrichment plots for the top gene sets were re-plotted using R statistical software.
Sensitivity Prediction
Sensitivity outside the training set was predicted as described previously (Kim et al., 2013). Twenty-six NSCLC cell lines not included in the original training set were subjected to RNAseq and high throughput 384 well format cytoxicity assays as described above in response to 21 chemicals in which at least one cell line is predicted to be sensitive. Log2 transformed FPKM values were converted to z-scores, and sensitivities were predicted according to the following equation
where wi is the weight determined from the elastic net for feature i, and xij is the normalized expression value of feature i in line j and n is the number of features selected for a chemical as described above. The range of si values predicts the degree of sensitivity where a high value of si predicts resistant and a low value of si predicts sensitive. Sensitivity to SW001286 and SW126788 was predicted based on RNAseq based expression of CYP4F11 and CES1/CES1P1, respectively. Sensitivity to SW151511 and SW140154 was predicted based on expression of PELI2 and SARM1/IL18R1. Additionally, we predicted activity of the KEGG TLR Pathway on a single-cell line basis using the protocol described above. Cells predicted to be sensitive to SW151511 and resistant to SW140154 were confirmed to have high TLR pathway expression levels.
To assess predictions, a two sample, one-sided KS test was used to determine if activity scores across the 12-point dose range in the predicted sensitive classes were significantly lower than those in the predicted resistant classes.
ROC Curve Analysis
For each feature set, we associated biomarkers to a sensitivity vector and predicted sensitivities on the original training panel according to the procedures outlined above. We used a cutoff of sj = 0 to binarize cell lines into predicted sensitive and resistant classes. For each chemical in our dataset, we manually selected ED50 and AUC values above which a cell line is considered resistant and below which a cell line is considered sensitive. The ROCR package in R was then used to calculate specificity (100 – false positive rate) and sensitivity (true positive rate) and plot the values. As input to the ROCR package, ‘true positives’ were considered to be those whose predictions were correct (sensitive cells predicted to be sensitive and resistant cells predicted to be resistant). Area under the ROC curve was calculated with and p-value was calculated to test the hypothesis that the area under the ROC curve is different from .5 (random) using the ROCR R package.
Affinity propagation clustering
Affinity propagation clustering was performed as described (Kim et al., 2016) using Pearson distance as a similarity metric. Cell lines that were present in the intersection between the POPs and each dataset were clustered for similarity. Cell lines in the RPPA dataset (65 cell lines) were clustered according to 154 unique features, in the metabolomic flux (67 cell lines) analysis according to 84 unique features, and in the chemical perturbagen dataset (100 cell lines) according to 221 features. We first filtered features in the illumina BeadChip (90 cell lines), RNAseq (99 cell lines), and SNP 6.0 arrays (63 cell lines) by selecting the top 20% of the most highly variant features. RNAseq and illumina BeadChip features were further reduced by selecting features that were above a minimal expression cutoff in at least one cell line (RNAseq FPKM value of 1 and illumina BeadChip value of 6), resulting in 5075 and 5047 features, respectively. The SNP array was clustered according to a final set of 3583 features. Networks were visualized with cytoscape with edges defined according to the procedure above and edge lengths drawn proportional to pearson distance using the built-in spring embedding algorithm.
NRF2 Signature
We curated publically available datasets to identify genes with NRF2 binding sites through ChipSeq analysis (Chorley et al., 2012; Hirotsu et al., 2012; Malhotra et al., 2010). To identify a context-independent set of NRF2 regulated genes, we selected genes that were found to have NRF2 binding sites in all three datasets. Recent work has also annotated a non-small cell lung cancer specific set of genes that are upregulated in cells with gain of function mutations in the NRF2 pathway (Goldstein et al., 2016). We also included these genes in our NRF2 signature, resulting in a total of 40 genes. Cell lines in our panel were binarized into two categories. SW157765 sensitive cell lines were defined to have an AUC < 400 and an ED50 value <1µM while resistant cells had an ED50 >30 µM. A KS test was used to determine if sensitive cells had significantly higher expression of NRF2 signature genes (two sample, one sided KS test) using the R stats package.
Comparison of cell lines to tumors
LUAD and LUSC RNAseq V2 RSEM normalized expression values were downloaded from the TCGA (https://cancergenome.nih.gov/) (519 LUAD tumors and 504 LUSC tumors). For each dataset, we selected the top 20% of the most highly variant genes. 509 genes represented the intersection between all three datasets. RNAseq V2 RSEM gene expression values of the 509 genes in BRCA tumors (1100 tumors) and MESO tumors (87 tumors) was downloaded using the CGDSR package in R. Though the gene signature was defined using a NSCLC dataset, every gene in the signature is expressed in at least one tumor in the MESO and BRCA dataset. Using the 509 genes, we used a Pearson correlation to compare each tumor in the TCGA with each cell line in our dataset with the stats package in R. p-values for the correlation are plotted (Figure 1A, S1A)
Peg plots
TCGA mutation data for the LUAD and LUSC subtypes was retrieved using the cgdsr package in R. Somatic mutations characterized as either ‘missense’ or ‘nonsense’ were plotted according to amino acid position. Non-synonymous mutations in the UTSW cell line panel for the same gene were plotted on the same scale. Domain information was obtained from the PFAM database from the following website http://pfam.xfam.org/.
Other Statistical Analyses
Hierarchical clustering, Pearson correlations, two sample t-tests, and density calculations were performed using the stats package in R.
Data and Software Availability
Microarray data in response to SW151511 was deposited into the Gene Expression Omnibus (GEO) under the accession number GSE104757. Raw sequencing data is available at dbGap under the study ID 28061.
Supplementary Material
Data File S1: NSCLC cell line collection, related to STAR METHODS: Experimental Model and Subject Details
(A) Cell lines were compared to tumors through similarity of a gene expression signature, defined to be the set of the 509 most highly variant (top 20% of variance values) genes in the cell line and tumor datasets. Boxplot comparing the pairwise p-values (Pearson Correlations) between lung cancer cell lines and lung cancer tumors (blue) and between lung cancer cell lines and breast cancer tumors (pink) corresponding to Figure 1A. p=.05 is indicated as a dashed red line.
(B) For the 92 cell lines with no corresponding matched normal DNA, the series of filters shown were applied in a step-wise fashion to remove probable germline variants and retain the most likely somatic mutations. The mean number of remaining mutations per cell line after each filtering step is indicated in each box, with a final mean estimated somatic mutation burden of 718 mutations per cell line. Optimal filter values were defined according to the protocol described in Figure S1C and described in detail in the STAR methods. TGP = thousand genome project; COSMIC = catalogue of somatic mutations in cancer
(C) A data-driven metric was applied to discover the optimal filter cutoff values applied in boxes 4–5 in Figure S1B. 12 evenly distributed filter values were selected between pre-defined ranges (.02% – 20%) for the TGP filter (Figure S1B, box 4), for the allele difference filter (Figure S1B, box 4; allele frequency – TGP frequency) (−10% – 10%), for the mutated (any site) filter (Figure S1B, box 5; 1.8% – 80%), for the cosmic filter (Figure S1B, box 5; .13% – 20%) and for the UTSW matched pair filter (Figure S1B, box 5; 2.9% – 50%). Selecting all possible combinations of these filter values resulted in a total of 248,832 filter combination values. For each filter value, the number of mutations that pass each filter is plotted. Each cell line in the unmatched dataset is plotted as a black line. A cubic function was fit to each black curve, and the optimal filter value for each cell line was selected to be the value where the second derivative is minimized. An overall filter value was selected to be the mean across the cell lines (solid red line). The red dashed line indicates the selected filter cutoff with 95% confidence range indicated as the dashed lines.
(D) Pearson correlations were calculated based on similarity of gene signature expression values of the same panel of cell lines assessed by an Illumina V3 BeadArray dataset and an RNAseq dataset. Gene signatures were defined to be the set of expressed genes (illumina expression value > 3 and RNAseq FPKM > 1) in at least one cell line that are among the most highly variant (top 20%). UPGMA of the R values are shown, where the diagonal indicates cell line self-similarity between both datasets.
(E) APC of NSCLC cell lines clustered according to similarity of a RNAseq derived gene expression. Clusters are drawn with cytoscape with edges proportional to pearson distances. Nodes are colored according to APC-defined cluster membership. The 12 cell lines screened with the entire 200,000 compound library are highlighted in green.
(F) UTSW screening approach. The entire 200K (Figure S1G) chemical library was screened at a single dose (2.5 µM) in singlicate across a panel of 12 cell lines defined to be representative of overall phenotypic diversity (Figure S1E). 15,000 molecules with variable response profiles were re-screened in triplicate at 2.5 µM. 900 chemicals with reasonable bi-modal (Figure S1H) or 317 chemicals with unimodal (Figure S1I) response patterns were selected and filtered by chemistry review. Fresh material was resupplied and subjected to analytical quality control and purity (LC/MS). 447 chemicals were re-assayed in a multi-dose format (12 point dose responses) against 12 cell lines in duplicate. Variable response profiles were selected, resulting in 208 chemicals that were screened together with 14 ‘cherry picked’ chemicals with known mechanism across the 100 cell line panel using 12 doses (1/2 log dilutions from 50 pM to 50 µM) in triplicate, twice.
(G) The UTSW chemical library consists of 202,103 chemicals composed of 450 chemicals from the NIH clinical library, 1,120 from Prestwick, 941 from TimTek, 2,500 from the UTSW proprietary library, 21,668 from ComGenex, 75,424 from ChemBridge, and 100,000 form ChemDiv labs
(H–I) Density distribution of the ED50 values in the 100 cell line panel of a chemical that was selected with (G) the bimodal selection method and (H) a chemical selected with the unimodal selection method.
(J) For each chemical, a Pearson correlation was calculated to represent similarity between calculated ED50 and AUC responses across the 100 cell line panel. Red dashes indicate 14 manually curated chemicals with known mechanisms of action.
(K) APC of 222 chemicals clustered based on ED50 values across the 100 cell line panel. Clusters are drawn with cytoscape with edges proportional to Pearson distances. Nodes are colored according to APC-defined cluster membership.
(L) Unsupervised 2-way hierarchical cluster of cell lines according to similarity in ED50 responses across the 100 cell line panel. Values are log10
(M–P) Cell lines were clustered with APC according to phenotypic similarity in (M) Illumina V3 BeadArrays, (N) carbon tracing data, (O) RPPA data, (P) and Illumina Human1M-Duo Copy Number Array. For each dataset, graphs are drawn with cytoscape. Nodes are colored according to APC-defined cluster membership and edges are drawn with a spring embedding algorithm proportional to Pearson distances.
(Q–T) APC of cell lines clustered according to ED50 responses from the POPs chemical dataset (Figure 1D). Cell line nodes are colored according to cluster membership in APC’s derived from (Q) Illumina V3 Bead Array, (R) carbon tracing data, (S) RPPA data, (T) Illumina Human1M-Duo Copy Number Array (Figure M–P).
(U) Lollipop plot of EGFR mutations within the 100 cell line panel as compared to tumor samples in TCGA LUAD and LUSC. Mutations are ordered based on annotated amino acid position along protein length. Top panel indicates the frequency of non-synonymous mutations found in TCGA LUAD’s (blue) and LUSC’s (red); bottom panel the frequency in the UTSW cell line panel (blue = erlotinib sensitive cell line; orange = erlotinib resistant cell line). The domains in the EGFR protein as annotated in PFAM are diagramed below.
(V) Comparison with perturbations shared with (Iorio et al., 2016) and (Seashore-Ludlow et al., 2015). Due to differences in approach and in the chemical entities employed, we found limited commonality among the compounds evaluated in the three studies. Out of 676 chemicals in the union between Iorio et al. and Ludlow et al., 105 were also present in our primary screen. The majority of these chemicals did not pass our initial filtering criteria for selectivity of cellular response and only 26 chemicals made it to the confirmation cohort (Figure S1F). None of these passed our unimodal or bi-modal filtering criteria required for selection to be tested across the full panel of 100 NSCLC cell lines. This was mainly a consequence of either broad toxicity or no detectable activity at 2.5 µM. Among the compounds with known mechanism of action that we inserted in the dose-response studies across the 100 cell lines (quality control “cherry-pick” set, figure S1F) there were 6 chemicals (paclitaxel, etoposide, dasatinib, erlotinib, bortezomib, and crizotinib) that were in common among all three studies. Bafilomycin-A1 and DeBQ were also present in the intersection between POPs and Ludlow et al. When comparing AUC’s calculated in Ludlow et al. to AUC’s from this study, among NSCLC cell lines present in both studies, we found that 6/8 chemicals are significantly correlated across 66 cell lines (crizotinib, erlotinib, dasatinib, bortezomib, etoposide, paclitaxel). The Iorio et al. study employed an IC50 metric. When comparing our ED50 dataset to IC50 values calculated in Iorio et al, we find that 1/6 chemicals (etoposide, Pearson p<.05) correlated across 60 cell lines. Dashed red line indicates p=.05.
(A) Elastic net modeling associated high mRNA expression of one of 4 known drug metabolism enzymes with sensitivity to 4 chemicals. Cell lines are ranked by ED50 response indicated as a heatmap (top rows, unbolded) with log2 FPKM values for the same cell lines plotted as a heatmap underneath (bolded). A legend to interpret the color scale is plotted to the right.
(B) Unsupervised hierarchical clustering of ED50 responses of 12 chemicals which correlate with high expression of a drug metabolism enzyme.
(C–D) (C) Structures and (D) chemical sensitivity profiles (ED50 values) of prodrugs in 100 cell lines. Cell lines are ordered according to average ED50 value. Error bars are plotted as +/− 1 SD from the mean ED50 across (n=6/cell line)
(E–J) Percent remaining (ln scale) of (E) SW115205 (F) SW098382 (G) SW153609 (H) SW167255 (I) SW134963 and (J) SW147739 is plotted as a function of time of treatment with each compound (sensitive=blue; resistant=orange). Values are normalized to control treatment. In all cases, concentration of the parent compound is followed over time. In some cases, selective sensitivity corresponds to selective loss of the parent compound, which may indicate conversion of the parent molecule into a toxic compound in sensitive cells (i.e. SW098382). In other cases, there is equivalent loss of the parent compound in both sensitive and resistant cell lines, which may indicate selective sensitivity to a commonly produced metabolite, or due to production of distinct metabolites with distinct toxicity profiles (i.e. SW153609).
(K–L) Clones were selected after gene editing of the CYP4F11 locus and analyzed by immunoblot. Parental protein expression of CYP4F11 (lane1) was compared to that of the clones, and the clones resulting in the lowest protein expression were selected for further follow-up. (K) Clone 8 was selected for H647 and (L) Clone 2 was selected for H460.
(M) H647 cells with CYP411 edited out of the genome with CRISPR and H647 cells transfected with a control sgRNA were treated for 72 hrs with the concentrations of SW157765 shown and cell viability relative to a DMSO control measured.
(N–O) Dose response curves of cell lines outside the training set (n=26) predicted to be sensitive (blue) and resistant (orange) to (N) SW126788 and (O) SW001286.
(P) An empirical CDF plot comparing SW001286 sensitivity of cell lines mutant for LKB1 (red) compared to wild-type (grey) (p=.0055, Scanning-KS test)
(Q) Cells were co-treated with 2 mg/mL NAC and either 5 µM (HCC44) or 1µM (A549) SW001286. Viability was measured 72 hrs post-treatment and values were normalized to the DMSO condition.
(R) CYP4F11, as a member of the p450 cytochrome class of enzymes, likely catalyzes a variety of reactions in biological settings. Considering that p450 oxidation of internal olefins has been previously characterized, we considered that the alkene-containing small molecules SW115205, SW157765, and SW157692 might be susceptible to this type of enzymatic activity. As such, studies were undertaken with SW157765 to characterize the metabolic products.
(S). We reasoned that if the small molecule acted as a covalent modifier of its target protein, both transient and prolonged exposure would elicit similar cellular responses as covalent modification would result in sustained protein perturbation even after the treatment media was removed. Groups of sensitive (yellow) and resistant (blue) cell lines were treated with 5 uM SW157765 or DMSO for either (bottom) a single 72-hour continuous dose or (top) a 24 hour continuous treatment followed by a 48-hour incubation with compound free media.
(T) Comparison of structures of SW157765 and inactive analog, 500-1 (U) 500-1 retains no activity when retested alongside SW157765 in a panel of 12 cell lines
(V–Y) H2122 cells were pre-treated with SW157765 or the inactive analog, 500-1, for 8 hours prior to analysis on a Sciex 4000QTRAP system. The fragmentation sites monitored in the experiment for SW157765 (V) and 500-1 (X) are indicated.. In (W) and (Y) The larger total ion chromatogram (TIC) on the left depicts the summation of all new multiple reaction monitoring (MRM) peaks for SW157765 (W) or 500-1 (Y) identified by LightSight software (AB Sciex) in the time 0 samples (gray) versus 8hr (red). Arrows indicate peaks (transitions) with higher abundance in the 8hr samples. The M3 peak is contained within the shoulder of M2. The smaller MS/MS plots show the daughter ion fragmentation for each of the potential metabolites shown in the larger chromatogram. Hypothesized metabolite structures are indicated. All potential oxidation sites appear to lie on the right hand side of the molecule because the daughter ion masses are unchanged. Based on similar fragmentation patterns for SW157765 M2 and 500-1 M1, the oxidation site for these metabolites was hypothesized to be on the 5-member furan ring. The fragmentation pattern for SW157765 M1, however, is unique, and was therefore hypothesized to occur on the internal alkene.
(V–X) Predicted fragmentation sites and resulting daughter ions of (V) SW157765 and (X) 500-1.
(Z) Predicted metabolite of SW157765
(A) Location and type of Notch2 mutations in NSCLC cell lines is shown by lollipop plot. Mutations are ordered based on annotated amino acid position along protein length. Height of symbols indicate frequency of non-synonymous mutations found in the UTSW cell line panel (blue = GC sensitive cell line). PFAM annotated domains in the Notch2 protein are shown below. Missense mutations are indicated as a black solid line and nonsense are indicated as a red solid line.
(B) Effect of individual siRNA oligonucleotides on protein expression of NR3C1 compared to H2073 cells treated with a non-targeting control (NC) 72 hrs post-treatment with 5µM hydrocortisone was measured by immunoblot.
(C) Changes in HES1 protein levels in nuclear (N) and cytosolic (C) fractions 72 hrs after treatment with hydrocortisone was measure by immmunoblot. β-actin and Lamin B1 serve as loading controls for the total lysate and nuclear fractions, respectively.
(D) Flow cytometric histograms for DNA content after 3-day exposure to hydrocortisone (3 µM) or DMSO measured in GC responsive and non-responsive cell lines. Nocodazole (100 ng/mL) was added 48 hrs post-treatment to force accumulation of proliferating cells in G2/M over the course of the next 24 hrs.
(E) Transient over-expression of HES1 or empty vector control cDNA in 3 GC responsive cell lines. Protein expression levels are shown 72 hrs posthydrocortisone treatment (5 µM)
(F) DNA content for the indicated populations in Figure 3J is measured by flow cytometry of cells stained with propidium iodide.
(G) Proposed mechanism for GC induced cell cycle arrest in lung cancer. Mutations in Notch2 are loss of function resulting in lower notch signaling and higher basal NR3C1 expression, priming cells to respond to the GC signal. Upon GC stimulation, sensitive cell lines will initiate a positive feedback loop to upregulate NR3C1 expression and downregulate HES1 expression. One consequence of higher GC signaling will be a selective reduction of CyclinD1, leading to G1 arrest.
(A) A one-sided KS test was used to calculate p-values assessing ability of the associated elastic net models to predict sensitivities in a test panel of cell lines (Figure 4A) and to assess preservation of chemical sensitivities in 3D spheroid models (4B)
(B) GSEA calculated p-values for top gene sets predicted to be upregulated in TTC21B mutant, SW036310 sensitive cell lines compared to SW036310 resistant cell lines.
(C) Immunofluorescent staining of acetylated tubulin (green) marking cilia. DNA is stained with DAPI (blue). Cilia can be seen in the well characterized cilia forming cell line, 10T1/2, as well as two TTC21B mutant SW036310 sensitive cell lines (H647, H157) but not in two SW036310 resistant cell lines (H460, HCC1171). Scale bars, 10 µm
(D–E) Dose response curves are shown for cell lines outside the training set that are predicted to be sensitive (blue) or resistant (orange) to (D) SW140154 and (E) SW151511.
(F) Dose response curves of cell lines grown in 3-D spheroid models in response to SW140154 (n=8/experiment). Cell lines that were sensitive (blue) or resistant (orange) to SW140154 in standard 2-D cell-culture were evaluated in 3D (n=8/dose).
(G) Fold change of 13 differentially regulated genes in response to treatment with 10 µM SW151511 for 24 hrs in 2 sensitive and 2 resistant lines is shown. Values represent the log2 fold change of the gene expression in SW151511 treated cells compared to cells treated with the DMSO vehicle.
(A) An empirical CDF plot compares the AUC values SW174769, SW087454, and SW056245 of cell lines with co-occurring mutations in KRAS and NUP214 (left), RAS_Class and PTPRT (center) and KRAS and TTC21B (right) (red) to wild-type cell lines (blue; p<.0002, Scanning KS test)
(B) Dose response curves of cell lines grown in 3D spheroid models in response to SW174769 (left), SW087454 (middle) and SW056245 (right). Cell lines that were sensitive (blue) or resistant (orange) to each chemical in standard 2-D cell-culture were evaluated in 3D (n=8/dose).
(C) Deletion in KEAP1 as visualized by integrative genomics viewer (IGV). H1437 cancer cell lines (bottom panel) have a large deletion of exon2 (red box) as compared to DNA from a matched normal tissue sample (top panel)
(D) A lollipop plot compares NRF2 mutation statuses and locations in TCGA LUAD and LUSC tumor datasets and in the UTSW cell panel. Mutations are ordered based on annotated amino acid position along protein length. Panels indicate frequency of non-synonymous mutations found in TCGA LUAD’s (blue) and LUSC’s (red), in the UTSW cell line panel (blue = SW157765 sensitive cell line; orange = SW157765 resistant cell line). PFAM annotated domains in the NRF2 protein are diagrammed below.
(E) A CDF plot compares RNAseq mRNA expression (z-scores) of genes in the NRF2-regulated set of genes in cells in the training panel of 100 cell lines sensitive to SW157765 that were not found to contain variants in known NRF2 pathway related genes (n=8; red) compared to SW157765 resistant cells (blue). (KS test p< 2.2 E-16).
(F) A CDF plot compares RNAseq mRNA expression (z-scores) of genes in the NRF2-regulated set of genes (Figure 5E) in a panel of 3 cell lines not included in the training panel of 100 cell lines. The indicated cell lines have significantly upregulated mRNA expression of NRF2-related genes and were tested for sensitivity to SW157765 (Figure 5H). P-values are calculated based on a one-sided KS-test.
(G) mRNA expression values of NRF2 in response to siNC or siNRF2 48 hrs post siRNA transfection are normalized to the non-targeting control. siNRF2 oligos were transfected as either 3 individual oligos or in a pooled format as indicated.
(A) Binder selection pipeline. ~14,000 purified proteins were arrayed in 96 well format, with one protein per well. Chemicals were added to each well and binding was determined based on retention times in LC/MS. Plotted are LC/MS binding signals (y-axis) for all proteins assayed (x-axis). As a control, FK-506 had the strongest signal for binding to well annotated binding partners, FK-506 binding protein family members (FKBP) 1A, 2, 3,4, and 5. The family member with the strongest binding annotated in the literature, FKBP1A, had the highest LC/MS binding signal.
(B) (Left) GLUT8 model with docked poses of SW157765 (orange) and the SW157765-epoxide metabolite (cyan). Residues (in ball and stick) within 3.5 Å of SW157765 metabolite docked pose are shown. Both chemicals are predicted to make hydrogen bonds with Asn312. This interaction is consistent with GLUT1 co-crystal structure of glucose where Asn286 exhibits H-bond interaction with C4-OH of glucose. Further, this residue is also known to involve in conformation switching of GLUT3 from outward open to outward occluded form. SW157765 as well as the metabolite exhibited van der Waals interactions with Trp433 and Trp457. GLUT1 inhibitors Glut-i1, Glut-i2 and cytochalasin exhibited similar interactions with equivalent residues in corresponding co-crystal structures, and these residues were experimentally confirmed to be crucial in inhibitor binding. The presence of a double bond next to furan seems to be a necessary constraint that helps restrain SW157765 or the epoxide metabolite in a specific conformation. Residues from TM4 are colored grey, TM5 purple, TM7 green, TM10 orange and TM11 pink (Right) Close-up view of SW157765 and SW157765-epoxide metabolite overlay highlighting deviation in docked poses
(C) A thermal-stability shift assay comparing protein levels of GLUT8 in H647 cells treated with either DMSO, 5 µM 500-1, or 1µM SW157765. Cells were heated to the indicated temperatures prior to lysis. Glut13 serves as a loading control.
(D) Cells were deprived of glucose from the culture medium for 5 days and viability was measured as relative DNA content at day 5 versus day 0. The boxplot compares viabilities in response to glucose withdrawal in SW157765 sensitive (blue) and resistant (orange) cells. GLUT1 mRNA was measured with qPCR 96 hrs post-transfection with siGLUT1 or siNC. Values are normalized to the siNC.
(E–F) mRNA (E) and (F) Protein expression of GLUT1 in H647 96 hrs post-transfection with siGLUT1 or siNC oligonucleotides was measured by either qPCR or immunoblot.
(G) Viability of SW157765 sensitive and resistant cell lines transfected with siRNA’s targeting GLUT1 normalized to control (NC) was measured at 96 hrs post-transfection.
(H) In the serine biosynthetic pathway, a glycolytic precursor, 3PG, is converted in a series of steps to serine (Ser), which is subsequently cleaved to produce Glycine (Gly) and a one carbon intermediate that can then enter the folate cycle for production of purines and thymidines. PHGDH activity is rate limiting for the pathway. Steady state flux through this pathway can be determined by measuring incorporation of [13C6] into all three carbons of serine (SerM3) and both carbons of glycine (GlyM2).
(I) Boxplots comparing RNAseq based log2 FPKM expression for the enzymes in the serine biosynthetic pathway in SW157765 sensitive (blue) and resistant (orange) cell lines.
(J) Relative viability of H647 cells at 24 hours post-SW157765 treatment
(K–L) Incorporation of [13C2] into (K) 1 carbon of lactate (LacM1) and (L) 2 carbons of citrate (CitM2), reporting activity in the pentose phosphate pathway and citric acid cycle, respectively, was measured 24 hrs after treatment of H647 cells with SW157765 (5µM) or DMSO.
(M) Heatmap comparing SW157765 sensitivities. Cell lines are ordered according to SW157765 AUC values (top panel). KEAP1, KRAS mutant cells are indicated in black (second panel). The following panels indicate expression levels (log2 RNAseq FPKM) of CYP4F11, PHGDH, and PSAT. Unanticipated non-responders (HCC4019, HCC44, DFCI024, and H2030) are highlighted in red.
(N) Protein expression of PHGDH in HCC44 parental cells and those stably expressing PHGDH or PHGDHV490M under the control of a tetracycline-inducible promoter was assessed by immunoblot. Doxycline (1µg/mL) was used to induce expression of the PHGDH construct, though the promoter is quite leaky.
(O) Fate of 1,2 labeled glucose upon entering the cell. Once labeled glucose enters the cell, it is phosphorylated to form glucose 6-phosphate (G6P). G6P can enter the PPP pathway (green), the first step of which involves an oxidative decarboxylation where one of the labeled carbons will be released as CO2. The pathway will eventually converge on lactate, with LacM1 (one labeled carbon) being a reporter of PPP activity. Glucose carbons that are shunted towards glycolysis will result in labeling of LacM2 (2 labeled carbons). In the serine biosynthetic pathway (blue), the glycolytic precursor 3PG will be used converted in a series of steps to form serine (Figure S6H), producing a SerM2 labeling pattern. In the citric acid cycle (red), the 3 carbon end product of glycolysis, pyruvate, will be shunted towards the TCA cycle. The first step of which involves an oxidative decarboxylation, resulting in two labeled carbons incorporated into citrate (CitM2).
Data File S2: WES derived mutational calls, related to Figure 1
Data File S3: RNA sequencing, related to Figure 1
Data File S4: Illumina Human1M-Duo Copy Number array, related to Figure 1
Data File S6: Chemical Screening Summary Values and associated features, related to Figure 4
Data File S5: RPPA curated values, related to Figure 1
Highlights.
A chemistry-first approach for druggable target identification for lung cancer
Mapping the associations between chemicals and genetic lesions in lung cancer
Matching chemicals with diverse patient-specific cancer-promoting mechanisms
Validating the effect of targeting chemically addressable mechanisms in NSCLC cells
Acknowledgments
This work was supported by grants from the NIH, CPRIT, Robert Welch Foundation, the Korea Health Technology R & D project through the Korea Health Industry Development Institute (HI14C1324) and the National R&D Program for Cancer Control (1420100), funded by the Ministry of Health & Welfare, Republic of Korea. EAM was supported by NIH training grant 5T32GM8203-27.
Footnotes
Publisher's Disclaimer: This is a PDF file of an unedited manuscript that has been accepted for publication. As a service to our customers we are providing this early version of the manuscript. The manuscript will undergo copyediting, typesetting, and review of the resulting proof before it is published in its final citable form. Please note that during the production process errors may be discovered which could affect the content, and all legal disclaimers that apply to the journal pertain.
Author Contributions
Conceptualization: M.A.W., H.K., E.A.M. Methodology: M.A.W., H.K., E.A.M. Software: E.A.M., J.R.C. Formal Analysis: E.A.M., L.G., Y.Y., S.P., T.H.H. Investigation: E.A.M., C.H.D., S.M., R.M.V., M.J.R, K.R.C., M.P., K.H., R.A.G., J.V.H, I.W, K.R.C, N.S.W, D.A.W., J.B.M, J.D.M., R.J.D, X.W., J.K. Y.S., P.C. J.Y.L., J.H., J.S., C.D., D.M.M., H.D., M.G.R, B.A.P., H.K., T.M., A.G.,I.W., P.L.M., S.V., Writing: E.A.M., M.G.R., H.K., M.A.W. Supervision: M.A.W., H.K., J.D.M., Funding: M.A.W., J.D.M, M.G.R., H.S.K.
Declaration of Interests
The authors have no conflicts of interest to report related to this work. Michael White is currently an employee of Pfizer Inc. and Takashi Motoyaji was an employee of Takeda Oncology.
References
- Barretina J, Caponigro G, Stransky N, Venkatesan K, Margolin AA, Kim S, Wilson CJ, Lehar J, Kryukov GV, Sonkin D, et al. The Cancer Cell Line Encyclopedia enables predictive modelling of anticancer drug sensitivity. Nature. 2012;483:603–607. doi: 10.1038/nature11003. [DOI] [PMC free article] [PubMed] [Google Scholar]
- Baumgart A, Mazur PK, Anton M, Rudelius M, Schwamborn K, Feuchtinger A, Behnke K, Walch A, Braren R, Peschel C, et al. Opposing role of Notch1 and Notch2 in a Kras(G12D)-driven murine non-small cell lung cancer model. Oncogene. 2015;34:578–588. doi: 10.1038/onc.2013.592. [DOI] [PubMed] [Google Scholar]
- Carayannopoulos MO, Chi MM, Cui Y, Pingsterhaus JM, McKnight RA, Mueckler M, Devaskar SU, Moley KH. GLUT8 is a glucose transporter responsible for insulin-stimulated glucose uptake in the blastocyst. Proc Natl Acad Sci U S A. 2000;97:7313–7318. doi: 10.1073/pnas.97.13.7313. [DOI] [PMC free article] [PubMed] [Google Scholar]
- Chorley BN, Campbell MR, Wang X, Karaca M, Sambandan D, Bangura F, Xue P, Pi J, Kleeberger SR, Bell DA. Identification of novel NRF2-regulated genes by ChIP-Seq: influence on retinoid X receptor alpha. Nucleic Acids Res. 2012;40:7416–7429. doi: 10.1093/nar/gks409. [DOI] [PMC free article] [PubMed] [Google Scholar]
- Chu D, Zhang Z, Zhou Y, Wang W, Li Y, Zhang H, Dong G, Zhao Q, Ji G. Notch1 and Notch2 have opposite prognostic effects on patients with colorectal cancer. Ann Oncol. 2011;22:2440–2447. doi: 10.1093/annonc/mdq776. [DOI] [PubMed] [Google Scholar]
- Davis EE, Zhang Q, Liu Q, Diplas BH, Davey LM, Hartley J, Stoetzel C, Szymanska K, Ramaswami G, Logan CV, et al. TTC21B contributes both causal and modifying alleles across the ciliopathy spectrum. Nat Genet. 2011;43:189–196. doi: 10.1038/ng.756. [DOI] [PMC free article] [PubMed] [Google Scholar]
- Deng D, Sun P, Yan C, Ke M, Jiang X, Xiong L, Ren W, Hirata K, Yamamoto M, Fan S, et al. Molecular basis of ligand recognition and transport by glucose transporters. Nature. 2015;526:391–396. doi: 10.1038/nature14655. [DOI] [PubMed] [Google Scholar]
- Eskiocak B, McMillan EA, Mendiratta S, Kollipara RK, Zhang H, Humphries CG, Wang C, Garcia-Rodriguez J, Ding M, Zaman A, et al. Biomarker Accessible and Chemically Addressable Mechanistic Subtypes of BRAF Melanoma. Cancer Discov. 2017;7:832–851. doi: 10.1158/2159-8290.CD-16-0955. [DOI] [PMC free article] [PubMed] [Google Scholar]
- Frey BJ, Dueck D. Clustering by passing messages between data points. Science. 2007;315:972–976. doi: 10.1126/science.1136800. [DOI] [PubMed] [Google Scholar]
- Garnett MJ, Edelman EJ, Heidorn SJ, Greenman CD, Dastur A, Lau KW, Greninger P, Thompson IR, Luo X, Soares J, et al. Systematic identification of genomic markers of drug sensitivity in cancer cells. Nature. 2012;483:570–575. doi: 10.1038/nature11005. [DOI] [PMC free article] [PubMed] [Google Scholar]
- Goldstein LD, Lee J, Gnad F, Klijn C, Schaub A, Reeder J, Daemen A, Bakalarski CE, Holcomb T, Shames DS, et al. Recurrent Loss of NFE2L2 Exon 2 Is a Mechanism for Nrf2 Pathway Activation in Human Cancers. Cell Rep. 2016;16:2605–2617. doi: 10.1016/j.celrep.2016.08.010. [DOI] [PubMed] [Google Scholar]
- Hafner M, Niepel M, Sorger PK. Alternative drug sensitivity metrics improve preclinical cancer pharmacogenomics. Nat Biotechnol. 2017;35:500–502. doi: 10.1038/nbt.3882. [DOI] [PMC free article] [PubMed] [Google Scholar]
- Hirotsu Y, Katsuoka F, Funayama R, Nagashima T, Nishida Y, Nakayama K, Engel JD, Yamamoto M. Nrf2-MafG heterodimers contribute globally to antioxidant and metabolic networks. Nucleic Acids Res. 2012;40:10228–10239. doi: 10.1093/nar/gks827. [DOI] [PMC free article] [PubMed] [Google Scholar]
- Inaba H, Pui CH. Glucocorticoid use in acute lymphoblastic leukaemia. Lancet Oncol. 2010;11:1096–1106. doi: 10.1016/S1470-2045(10)70114-5. [DOI] [PMC free article] [PubMed] [Google Scholar]
- Iorio F, Knijnenburg TA, Vis DJ, Bignell GR, Menden MP, Schubert M, Aben N, Goncalves E, Barthorpe S, Lightfoot H, et al. A Landscape of Pharmacogenomic Interactions in Cancer. Cell. 2016;166:740–754. doi: 10.1016/j.cell.2016.06.017. [DOI] [PMC free article] [PubMed] [Google Scholar]
- Jeon SM, Chandel NS, Hay N. AMPK regulates NADPH homeostasis to promote tumour cell survival during energy stress. Nature. 2012;485:661–665. doi: 10.1038/nature11066. [DOI] [PMC free article] [PubMed] [Google Scholar]
- Kapoor K, Finer-Moore JS, Pedersen BP, Caboni L, Waight A, Hillig RC, Bringmann P, Heisler I, Muller T, Siebeneicher H, et al. Mechanism of inhibition of human glucose transporter GLUT1 is conserved between cytochalasin B and phenylalanine amides. Proc Natl Acad Sci U S A. 2016;113:4711–4716. doi: 10.1073/pnas.1603735113. [DOI] [PMC free article] [PubMed] [Google Scholar]
- Kim HS, Mendiratta S, Kim J, Pecot CV, Larsen JE, Zubovych I, Seo BY, Kim J, Eskiocak B, Chung H, et al. Systematic identification of molecular subtype-selective vulnerabilities in non-small-cell lung cancer. Cell. 2013;155:552–566. doi: 10.1016/j.cell.2013.09.041. [DOI] [PMC free article] [PubMed] [Google Scholar]
- Kim J, McMillan E, Kim HS, Venkateswaran N, Makkar G, Rodriguez-Canales J, Villalobos P, Neggers JE, Mendiratta S, Wei S, et al. XPO1-dependent nuclear export is a druggable vulnerability in KRAS-mutant lung cancer. Nature. 2016;538:114–117. doi: 10.1038/nature19771. [DOI] [PMC free article] [PubMed] [Google Scholar]
- Locasale JW, Grassian AR, Melman T, Lyssiotis CA, Mattaini KR, Bass AJ, Heffron G, Metallo CM, Muranen T, Sharfi H, et al. Phosphoglycerate dehydrogenase diverts glycolytic flux and contributes to oncogenesis. Nat Genet. 2011;43:869–874. doi: 10.1038/ng.890. [DOI] [PMC free article] [PubMed] [Google Scholar]
- Long W, Cheeseman CI. Structure of, and functional insight into the GLUT family of membrane transporters. Cell Health and Cytoskeletion. 2015;7:167–183. [Google Scholar]
- Malhotra D, Portales-Casamar E, Singh A, Srivastava S, Arenillas D, Happel C, Shyr C, Wakabayashi N, Kensler TW, Wasserman WW, et al. Global mapping of binding sites for Nrf2 identifies novel targets in cell survival response through ChIP-Seq profiling and network analysis. Nucleic Acids Res. 2010;38:5718–5734. doi: 10.1093/nar/gkq212. [DOI] [PMC free article] [PubMed] [Google Scholar]
- McBrayer SK, Cheng JC, Singhal S, Krett NL, Rosen ST, Shanmugam M. Multiple myeloma exhibits novel dependence on GLUT4, GLUT8, and GLUT11: implications for glucose transporter-directed therapy. Blood. 2012;119:4686–4697. doi: 10.1182/blood-2011-09-377846. [DOI] [PMC free article] [PubMed] [Google Scholar]
- Ramirez RD, Sheridan S, Girard L, Sato M, Kim Y, Pollack J, Peyton M, Zou Y, Kurie JM, Dimaio JM, et al. Immortalization of human bronchial epithelial cells in the absence of viral oncoproteins. Cancer research. 2004;64:9027–9034. doi: 10.1158/0008-5472.CAN-04-3703. [DOI] [PubMed] [Google Scholar]
- Real PJ, Tosello V, Palomero T, Castillo M, Hernando E, de Stanchina E, Sulis ML, Barnes K, Sawai C, Homminga I, et al. Gamma-secretase inhibitors reverse glucocorticoid resistance in T cell acute lymphoblastic leukemia. Nat Med. 2009;15:50–58. doi: 10.1038/nm.1900. [DOI] [PMC free article] [PubMed] [Google Scholar]
- Revollo JR, Oakley RH, Lu NZ, Kadmiel M, Gandhavadi M, Cidlowski JA. HES1 is a master regulator of glucocorticoid receptor-dependent gene expression. Sci Signal. 2013;6:ra103. doi: 10.1126/scisignal.2004389. [DOI] [PMC free article] [PubMed] [Google Scholar]
- Sanjana NE, Shalem O, Zhang F. Improved vectors and genome-wide libraries for CRISPR screening. Nat Methods. 2014;11:783–784. doi: 10.1038/nmeth.3047. [DOI] [PMC free article] [PubMed] [Google Scholar]
- Schmidt S, Joost HG, Schurmann A. GLUT8, the enigmatic intracellular hexose transporter. Am J Physiol Endocrinol Metab. 2009;296:E614–618. doi: 10.1152/ajpendo.91019.2008. [DOI] [PubMed] [Google Scholar]
- Seashore-Ludlow B, Rees MG, Cheah JH, Cokol M, Price EV, Coletti ME, Jones V, Bodycombe NE, Soule CK, Gould J, et al. Harnessing Connectivity in a Large-Scale Small-Molecule Sensitivity Dataset. Cancer Discov. 2015;5:1210–1223. doi: 10.1158/2159-8290.CD-15-0235. [DOI] [PMC free article] [PubMed] [Google Scholar]
- Subramanian A, Tamayo P, Mootha VK, Mukherjee S, Ebert BL, Gillette MA, Paulovich A, Pomeroy SL, Golub TR, Lander ES, et al. Gene set enrichment analysis: a knowledge-based approach for interpreting genome-wide expression profiles. Proc Natl Acad Sci U S A. 2005;102:15545–15550. doi: 10.1073/pnas.0506580102. [DOI] [PMC free article] [PubMed] [Google Scholar]
- Tabatabaie L, de Koning TJ, Geboers AJ, van den Berg IE, Berger R, Klomp LW. Novel mutations in 3-phosphoglycerate dehydrogenase (PHGDH) are distributed throughout the protein and result in altered enzyme kinetics. Hum Mutat. 2009;30:749–756. doi: 10.1002/humu.20934. [DOI] [PubMed] [Google Scholar]
- Tran PV, Haycraft CJ, Besschetnova TY, Turbe-Doan A, Stottmann RW, Herron BJ, Chesebro AL, Qiu H, Scherz PJ, Shah JV, et al. THM1 negatively modulates mouse sonic hedgehog signal transduction and affects retrograde intraflagellar transport in cilia. Nat Genet. 2008;40:403–410. doi: 10.1038/ng.105. [DOI] [PMC free article] [PubMed] [Google Scholar]
Associated Data
This section collects any data citations, data availability statements, or supplementary materials included in this article.
Supplementary Materials
Data File S1: NSCLC cell line collection, related to STAR METHODS: Experimental Model and Subject Details
(A) Cell lines were compared to tumors through similarity of a gene expression signature, defined to be the set of the 509 most highly variant (top 20% of variance values) genes in the cell line and tumor datasets. Boxplot comparing the pairwise p-values (Pearson Correlations) between lung cancer cell lines and lung cancer tumors (blue) and between lung cancer cell lines and breast cancer tumors (pink) corresponding to Figure 1A. p=.05 is indicated as a dashed red line.
(B) For the 92 cell lines with no corresponding matched normal DNA, the series of filters shown were applied in a step-wise fashion to remove probable germline variants and retain the most likely somatic mutations. The mean number of remaining mutations per cell line after each filtering step is indicated in each box, with a final mean estimated somatic mutation burden of 718 mutations per cell line. Optimal filter values were defined according to the protocol described in Figure S1C and described in detail in the STAR methods. TGP = thousand genome project; COSMIC = catalogue of somatic mutations in cancer
(C) A data-driven metric was applied to discover the optimal filter cutoff values applied in boxes 4–5 in Figure S1B. 12 evenly distributed filter values were selected between pre-defined ranges (.02% – 20%) for the TGP filter (Figure S1B, box 4), for the allele difference filter (Figure S1B, box 4; allele frequency – TGP frequency) (−10% – 10%), for the mutated (any site) filter (Figure S1B, box 5; 1.8% – 80%), for the cosmic filter (Figure S1B, box 5; .13% – 20%) and for the UTSW matched pair filter (Figure S1B, box 5; 2.9% – 50%). Selecting all possible combinations of these filter values resulted in a total of 248,832 filter combination values. For each filter value, the number of mutations that pass each filter is plotted. Each cell line in the unmatched dataset is plotted as a black line. A cubic function was fit to each black curve, and the optimal filter value for each cell line was selected to be the value where the second derivative is minimized. An overall filter value was selected to be the mean across the cell lines (solid red line). The red dashed line indicates the selected filter cutoff with 95% confidence range indicated as the dashed lines.
(D) Pearson correlations were calculated based on similarity of gene signature expression values of the same panel of cell lines assessed by an Illumina V3 BeadArray dataset and an RNAseq dataset. Gene signatures were defined to be the set of expressed genes (illumina expression value > 3 and RNAseq FPKM > 1) in at least one cell line that are among the most highly variant (top 20%). UPGMA of the R values are shown, where the diagonal indicates cell line self-similarity between both datasets.
(E) APC of NSCLC cell lines clustered according to similarity of a RNAseq derived gene expression. Clusters are drawn with cytoscape with edges proportional to pearson distances. Nodes are colored according to APC-defined cluster membership. The 12 cell lines screened with the entire 200,000 compound library are highlighted in green.
(F) UTSW screening approach. The entire 200K (Figure S1G) chemical library was screened at a single dose (2.5 µM) in singlicate across a panel of 12 cell lines defined to be representative of overall phenotypic diversity (Figure S1E). 15,000 molecules with variable response profiles were re-screened in triplicate at 2.5 µM. 900 chemicals with reasonable bi-modal (Figure S1H) or 317 chemicals with unimodal (Figure S1I) response patterns were selected and filtered by chemistry review. Fresh material was resupplied and subjected to analytical quality control and purity (LC/MS). 447 chemicals were re-assayed in a multi-dose format (12 point dose responses) against 12 cell lines in duplicate. Variable response profiles were selected, resulting in 208 chemicals that were screened together with 14 ‘cherry picked’ chemicals with known mechanism across the 100 cell line panel using 12 doses (1/2 log dilutions from 50 pM to 50 µM) in triplicate, twice.
(G) The UTSW chemical library consists of 202,103 chemicals composed of 450 chemicals from the NIH clinical library, 1,120 from Prestwick, 941 from TimTek, 2,500 from the UTSW proprietary library, 21,668 from ComGenex, 75,424 from ChemBridge, and 100,000 form ChemDiv labs
(H–I) Density distribution of the ED50 values in the 100 cell line panel of a chemical that was selected with (G) the bimodal selection method and (H) a chemical selected with the unimodal selection method.
(J) For each chemical, a Pearson correlation was calculated to represent similarity between calculated ED50 and AUC responses across the 100 cell line panel. Red dashes indicate 14 manually curated chemicals with known mechanisms of action.
(K) APC of 222 chemicals clustered based on ED50 values across the 100 cell line panel. Clusters are drawn with cytoscape with edges proportional to Pearson distances. Nodes are colored according to APC-defined cluster membership.
(L) Unsupervised 2-way hierarchical cluster of cell lines according to similarity in ED50 responses across the 100 cell line panel. Values are log10
(M–P) Cell lines were clustered with APC according to phenotypic similarity in (M) Illumina V3 BeadArrays, (N) carbon tracing data, (O) RPPA data, (P) and Illumina Human1M-Duo Copy Number Array. For each dataset, graphs are drawn with cytoscape. Nodes are colored according to APC-defined cluster membership and edges are drawn with a spring embedding algorithm proportional to Pearson distances.
(Q–T) APC of cell lines clustered according to ED50 responses from the POPs chemical dataset (Figure 1D). Cell line nodes are colored according to cluster membership in APC’s derived from (Q) Illumina V3 Bead Array, (R) carbon tracing data, (S) RPPA data, (T) Illumina Human1M-Duo Copy Number Array (Figure M–P).
(U) Lollipop plot of EGFR mutations within the 100 cell line panel as compared to tumor samples in TCGA LUAD and LUSC. Mutations are ordered based on annotated amino acid position along protein length. Top panel indicates the frequency of non-synonymous mutations found in TCGA LUAD’s (blue) and LUSC’s (red); bottom panel the frequency in the UTSW cell line panel (blue = erlotinib sensitive cell line; orange = erlotinib resistant cell line). The domains in the EGFR protein as annotated in PFAM are diagramed below.
(V) Comparison with perturbations shared with (Iorio et al., 2016) and (Seashore-Ludlow et al., 2015). Due to differences in approach and in the chemical entities employed, we found limited commonality among the compounds evaluated in the three studies. Out of 676 chemicals in the union between Iorio et al. and Ludlow et al., 105 were also present in our primary screen. The majority of these chemicals did not pass our initial filtering criteria for selectivity of cellular response and only 26 chemicals made it to the confirmation cohort (Figure S1F). None of these passed our unimodal or bi-modal filtering criteria required for selection to be tested across the full panel of 100 NSCLC cell lines. This was mainly a consequence of either broad toxicity or no detectable activity at 2.5 µM. Among the compounds with known mechanism of action that we inserted in the dose-response studies across the 100 cell lines (quality control “cherry-pick” set, figure S1F) there were 6 chemicals (paclitaxel, etoposide, dasatinib, erlotinib, bortezomib, and crizotinib) that were in common among all three studies. Bafilomycin-A1 and DeBQ were also present in the intersection between POPs and Ludlow et al. When comparing AUC’s calculated in Ludlow et al. to AUC’s from this study, among NSCLC cell lines present in both studies, we found that 6/8 chemicals are significantly correlated across 66 cell lines (crizotinib, erlotinib, dasatinib, bortezomib, etoposide, paclitaxel). The Iorio et al. study employed an IC50 metric. When comparing our ED50 dataset to IC50 values calculated in Iorio et al, we find that 1/6 chemicals (etoposide, Pearson p<.05) correlated across 60 cell lines. Dashed red line indicates p=.05.
(A) Elastic net modeling associated high mRNA expression of one of 4 known drug metabolism enzymes with sensitivity to 4 chemicals. Cell lines are ranked by ED50 response indicated as a heatmap (top rows, unbolded) with log2 FPKM values for the same cell lines plotted as a heatmap underneath (bolded). A legend to interpret the color scale is plotted to the right.
(B) Unsupervised hierarchical clustering of ED50 responses of 12 chemicals which correlate with high expression of a drug metabolism enzyme.
(C–D) (C) Structures and (D) chemical sensitivity profiles (ED50 values) of prodrugs in 100 cell lines. Cell lines are ordered according to average ED50 value. Error bars are plotted as +/− 1 SD from the mean ED50 across (n=6/cell line)
(E–J) Percent remaining (ln scale) of (E) SW115205 (F) SW098382 (G) SW153609 (H) SW167255 (I) SW134963 and (J) SW147739 is plotted as a function of time of treatment with each compound (sensitive=blue; resistant=orange). Values are normalized to control treatment. In all cases, concentration of the parent compound is followed over time. In some cases, selective sensitivity corresponds to selective loss of the parent compound, which may indicate conversion of the parent molecule into a toxic compound in sensitive cells (i.e. SW098382). In other cases, there is equivalent loss of the parent compound in both sensitive and resistant cell lines, which may indicate selective sensitivity to a commonly produced metabolite, or due to production of distinct metabolites with distinct toxicity profiles (i.e. SW153609).
(K–L) Clones were selected after gene editing of the CYP4F11 locus and analyzed by immunoblot. Parental protein expression of CYP4F11 (lane1) was compared to that of the clones, and the clones resulting in the lowest protein expression were selected for further follow-up. (K) Clone 8 was selected for H647 and (L) Clone 2 was selected for H460.
(M) H647 cells with CYP411 edited out of the genome with CRISPR and H647 cells transfected with a control sgRNA were treated for 72 hrs with the concentrations of SW157765 shown and cell viability relative to a DMSO control measured.
(N–O) Dose response curves of cell lines outside the training set (n=26) predicted to be sensitive (blue) and resistant (orange) to (N) SW126788 and (O) SW001286.
(P) An empirical CDF plot comparing SW001286 sensitivity of cell lines mutant for LKB1 (red) compared to wild-type (grey) (p=.0055, Scanning-KS test)
(Q) Cells were co-treated with 2 mg/mL NAC and either 5 µM (HCC44) or 1µM (A549) SW001286. Viability was measured 72 hrs post-treatment and values were normalized to the DMSO condition.
(R) CYP4F11, as a member of the p450 cytochrome class of enzymes, likely catalyzes a variety of reactions in biological settings. Considering that p450 oxidation of internal olefins has been previously characterized, we considered that the alkene-containing small molecules SW115205, SW157765, and SW157692 might be susceptible to this type of enzymatic activity. As such, studies were undertaken with SW157765 to characterize the metabolic products.
(S). We reasoned that if the small molecule acted as a covalent modifier of its target protein, both transient and prolonged exposure would elicit similar cellular responses as covalent modification would result in sustained protein perturbation even after the treatment media was removed. Groups of sensitive (yellow) and resistant (blue) cell lines were treated with 5 uM SW157765 or DMSO for either (bottom) a single 72-hour continuous dose or (top) a 24 hour continuous treatment followed by a 48-hour incubation with compound free media.
(T) Comparison of structures of SW157765 and inactive analog, 500-1 (U) 500-1 retains no activity when retested alongside SW157765 in a panel of 12 cell lines
(V–Y) H2122 cells were pre-treated with SW157765 or the inactive analog, 500-1, for 8 hours prior to analysis on a Sciex 4000QTRAP system. The fragmentation sites monitored in the experiment for SW157765 (V) and 500-1 (X) are indicated.. In (W) and (Y) The larger total ion chromatogram (TIC) on the left depicts the summation of all new multiple reaction monitoring (MRM) peaks for SW157765 (W) or 500-1 (Y) identified by LightSight software (AB Sciex) in the time 0 samples (gray) versus 8hr (red). Arrows indicate peaks (transitions) with higher abundance in the 8hr samples. The M3 peak is contained within the shoulder of M2. The smaller MS/MS plots show the daughter ion fragmentation for each of the potential metabolites shown in the larger chromatogram. Hypothesized metabolite structures are indicated. All potential oxidation sites appear to lie on the right hand side of the molecule because the daughter ion masses are unchanged. Based on similar fragmentation patterns for SW157765 M2 and 500-1 M1, the oxidation site for these metabolites was hypothesized to be on the 5-member furan ring. The fragmentation pattern for SW157765 M1, however, is unique, and was therefore hypothesized to occur on the internal alkene.
(V–X) Predicted fragmentation sites and resulting daughter ions of (V) SW157765 and (X) 500-1.
(Z) Predicted metabolite of SW157765
(A) Location and type of Notch2 mutations in NSCLC cell lines is shown by lollipop plot. Mutations are ordered based on annotated amino acid position along protein length. Height of symbols indicate frequency of non-synonymous mutations found in the UTSW cell line panel (blue = GC sensitive cell line). PFAM annotated domains in the Notch2 protein are shown below. Missense mutations are indicated as a black solid line and nonsense are indicated as a red solid line.
(B) Effect of individual siRNA oligonucleotides on protein expression of NR3C1 compared to H2073 cells treated with a non-targeting control (NC) 72 hrs post-treatment with 5µM hydrocortisone was measured by immunoblot.
(C) Changes in HES1 protein levels in nuclear (N) and cytosolic (C) fractions 72 hrs after treatment with hydrocortisone was measure by immmunoblot. β-actin and Lamin B1 serve as loading controls for the total lysate and nuclear fractions, respectively.
(D) Flow cytometric histograms for DNA content after 3-day exposure to hydrocortisone (3 µM) or DMSO measured in GC responsive and non-responsive cell lines. Nocodazole (100 ng/mL) was added 48 hrs post-treatment to force accumulation of proliferating cells in G2/M over the course of the next 24 hrs.
(E) Transient over-expression of HES1 or empty vector control cDNA in 3 GC responsive cell lines. Protein expression levels are shown 72 hrs posthydrocortisone treatment (5 µM)
(F) DNA content for the indicated populations in Figure 3J is measured by flow cytometry of cells stained with propidium iodide.
(G) Proposed mechanism for GC induced cell cycle arrest in lung cancer. Mutations in Notch2 are loss of function resulting in lower notch signaling and higher basal NR3C1 expression, priming cells to respond to the GC signal. Upon GC stimulation, sensitive cell lines will initiate a positive feedback loop to upregulate NR3C1 expression and downregulate HES1 expression. One consequence of higher GC signaling will be a selective reduction of CyclinD1, leading to G1 arrest.
(A) A one-sided KS test was used to calculate p-values assessing ability of the associated elastic net models to predict sensitivities in a test panel of cell lines (Figure 4A) and to assess preservation of chemical sensitivities in 3D spheroid models (4B)
(B) GSEA calculated p-values for top gene sets predicted to be upregulated in TTC21B mutant, SW036310 sensitive cell lines compared to SW036310 resistant cell lines.
(C) Immunofluorescent staining of acetylated tubulin (green) marking cilia. DNA is stained with DAPI (blue). Cilia can be seen in the well characterized cilia forming cell line, 10T1/2, as well as two TTC21B mutant SW036310 sensitive cell lines (H647, H157) but not in two SW036310 resistant cell lines (H460, HCC1171). Scale bars, 10 µm
(D–E) Dose response curves are shown for cell lines outside the training set that are predicted to be sensitive (blue) or resistant (orange) to (D) SW140154 and (E) SW151511.
(F) Dose response curves of cell lines grown in 3-D spheroid models in response to SW140154 (n=8/experiment). Cell lines that were sensitive (blue) or resistant (orange) to SW140154 in standard 2-D cell-culture were evaluated in 3D (n=8/dose).
(G) Fold change of 13 differentially regulated genes in response to treatment with 10 µM SW151511 for 24 hrs in 2 sensitive and 2 resistant lines is shown. Values represent the log2 fold change of the gene expression in SW151511 treated cells compared to cells treated with the DMSO vehicle.
(A) An empirical CDF plot compares the AUC values SW174769, SW087454, and SW056245 of cell lines with co-occurring mutations in KRAS and NUP214 (left), RAS_Class and PTPRT (center) and KRAS and TTC21B (right) (red) to wild-type cell lines (blue; p<.0002, Scanning KS test)
(B) Dose response curves of cell lines grown in 3D spheroid models in response to SW174769 (left), SW087454 (middle) and SW056245 (right). Cell lines that were sensitive (blue) or resistant (orange) to each chemical in standard 2-D cell-culture were evaluated in 3D (n=8/dose).
(C) Deletion in KEAP1 as visualized by integrative genomics viewer (IGV). H1437 cancer cell lines (bottom panel) have a large deletion of exon2 (red box) as compared to DNA from a matched normal tissue sample (top panel)
(D) A lollipop plot compares NRF2 mutation statuses and locations in TCGA LUAD and LUSC tumor datasets and in the UTSW cell panel. Mutations are ordered based on annotated amino acid position along protein length. Panels indicate frequency of non-synonymous mutations found in TCGA LUAD’s (blue) and LUSC’s (red), in the UTSW cell line panel (blue = SW157765 sensitive cell line; orange = SW157765 resistant cell line). PFAM annotated domains in the NRF2 protein are diagrammed below.
(E) A CDF plot compares RNAseq mRNA expression (z-scores) of genes in the NRF2-regulated set of genes in cells in the training panel of 100 cell lines sensitive to SW157765 that were not found to contain variants in known NRF2 pathway related genes (n=8; red) compared to SW157765 resistant cells (blue). (KS test p< 2.2 E-16).
(F) A CDF plot compares RNAseq mRNA expression (z-scores) of genes in the NRF2-regulated set of genes (Figure 5E) in a panel of 3 cell lines not included in the training panel of 100 cell lines. The indicated cell lines have significantly upregulated mRNA expression of NRF2-related genes and were tested for sensitivity to SW157765 (Figure 5H). P-values are calculated based on a one-sided KS-test.
(G) mRNA expression values of NRF2 in response to siNC or siNRF2 48 hrs post siRNA transfection are normalized to the non-targeting control. siNRF2 oligos were transfected as either 3 individual oligos or in a pooled format as indicated.
(A) Binder selection pipeline. ~14,000 purified proteins were arrayed in 96 well format, with one protein per well. Chemicals were added to each well and binding was determined based on retention times in LC/MS. Plotted are LC/MS binding signals (y-axis) for all proteins assayed (x-axis). As a control, FK-506 had the strongest signal for binding to well annotated binding partners, FK-506 binding protein family members (FKBP) 1A, 2, 3,4, and 5. The family member with the strongest binding annotated in the literature, FKBP1A, had the highest LC/MS binding signal.
(B) (Left) GLUT8 model with docked poses of SW157765 (orange) and the SW157765-epoxide metabolite (cyan). Residues (in ball and stick) within 3.5 Å of SW157765 metabolite docked pose are shown. Both chemicals are predicted to make hydrogen bonds with Asn312. This interaction is consistent with GLUT1 co-crystal structure of glucose where Asn286 exhibits H-bond interaction with C4-OH of glucose. Further, this residue is also known to involve in conformation switching of GLUT3 from outward open to outward occluded form. SW157765 as well as the metabolite exhibited van der Waals interactions with Trp433 and Trp457. GLUT1 inhibitors Glut-i1, Glut-i2 and cytochalasin exhibited similar interactions with equivalent residues in corresponding co-crystal structures, and these residues were experimentally confirmed to be crucial in inhibitor binding. The presence of a double bond next to furan seems to be a necessary constraint that helps restrain SW157765 or the epoxide metabolite in a specific conformation. Residues from TM4 are colored grey, TM5 purple, TM7 green, TM10 orange and TM11 pink (Right) Close-up view of SW157765 and SW157765-epoxide metabolite overlay highlighting deviation in docked poses
(C) A thermal-stability shift assay comparing protein levels of GLUT8 in H647 cells treated with either DMSO, 5 µM 500-1, or 1µM SW157765. Cells were heated to the indicated temperatures prior to lysis. Glut13 serves as a loading control.
(D) Cells were deprived of glucose from the culture medium for 5 days and viability was measured as relative DNA content at day 5 versus day 0. The boxplot compares viabilities in response to glucose withdrawal in SW157765 sensitive (blue) and resistant (orange) cells. GLUT1 mRNA was measured with qPCR 96 hrs post-transfection with siGLUT1 or siNC. Values are normalized to the siNC.
(E–F) mRNA (E) and (F) Protein expression of GLUT1 in H647 96 hrs post-transfection with siGLUT1 or siNC oligonucleotides was measured by either qPCR or immunoblot.
(G) Viability of SW157765 sensitive and resistant cell lines transfected with siRNA’s targeting GLUT1 normalized to control (NC) was measured at 96 hrs post-transfection.
(H) In the serine biosynthetic pathway, a glycolytic precursor, 3PG, is converted in a series of steps to serine (Ser), which is subsequently cleaved to produce Glycine (Gly) and a one carbon intermediate that can then enter the folate cycle for production of purines and thymidines. PHGDH activity is rate limiting for the pathway. Steady state flux through this pathway can be determined by measuring incorporation of [13C6] into all three carbons of serine (SerM3) and both carbons of glycine (GlyM2).
(I) Boxplots comparing RNAseq based log2 FPKM expression for the enzymes in the serine biosynthetic pathway in SW157765 sensitive (blue) and resistant (orange) cell lines.
(J) Relative viability of H647 cells at 24 hours post-SW157765 treatment
(K–L) Incorporation of [13C2] into (K) 1 carbon of lactate (LacM1) and (L) 2 carbons of citrate (CitM2), reporting activity in the pentose phosphate pathway and citric acid cycle, respectively, was measured 24 hrs after treatment of H647 cells with SW157765 (5µM) or DMSO.
(M) Heatmap comparing SW157765 sensitivities. Cell lines are ordered according to SW157765 AUC values (top panel). KEAP1, KRAS mutant cells are indicated in black (second panel). The following panels indicate expression levels (log2 RNAseq FPKM) of CYP4F11, PHGDH, and PSAT. Unanticipated non-responders (HCC4019, HCC44, DFCI024, and H2030) are highlighted in red.
(N) Protein expression of PHGDH in HCC44 parental cells and those stably expressing PHGDH or PHGDHV490M under the control of a tetracycline-inducible promoter was assessed by immunoblot. Doxycline (1µg/mL) was used to induce expression of the PHGDH construct, though the promoter is quite leaky.
(O) Fate of 1,2 labeled glucose upon entering the cell. Once labeled glucose enters the cell, it is phosphorylated to form glucose 6-phosphate (G6P). G6P can enter the PPP pathway (green), the first step of which involves an oxidative decarboxylation where one of the labeled carbons will be released as CO2. The pathway will eventually converge on lactate, with LacM1 (one labeled carbon) being a reporter of PPP activity. Glucose carbons that are shunted towards glycolysis will result in labeling of LacM2 (2 labeled carbons). In the serine biosynthetic pathway (blue), the glycolytic precursor 3PG will be used converted in a series of steps to form serine (Figure S6H), producing a SerM2 labeling pattern. In the citric acid cycle (red), the 3 carbon end product of glycolysis, pyruvate, will be shunted towards the TCA cycle. The first step of which involves an oxidative decarboxylation, resulting in two labeled carbons incorporated into citrate (CitM2).
Data File S2: WES derived mutational calls, related to Figure 1
Data File S3: RNA sequencing, related to Figure 1
Data File S4: Illumina Human1M-Duo Copy Number array, related to Figure 1
Data File S6: Chemical Screening Summary Values and associated features, related to Figure 4
Data File S5: RPPA curated values, related to Figure 1